Article

Research on the Impact of Technical Measures on Enterprise Export Participation

School of Ecocomics, Jinan University, Guangzhou 510632, China
*
Author to whom correspondence should be addressed.
Sustainability 2022, 14(14), 8909; https://doi.org/10.3390/su14148909
Submission received: 9 June 2022 / Revised: 1 July 2022 / Accepted: 7 July 2022 / Published: 20 July 2022
(This article belongs to the Special Issue International Trade Policy in Chinese Economy)

Abstract

:
Technical Measures to Trade have the characteristics of strong concealment and imperceptibility, which makes some WTO members frequently use “technical barriers” to restrict China’s product exports. Based on the multi-period differences-in-differences method, we use micro-data at the level of Chinese companies from 2000 to 2013 to empirically test the impact of technical measures on the export participation of companies from the perspective of corporate heterogeneity. The study found that for the strength of the technical measures, the coefficients on the technical measures variables are all significantly positive. From the perspective of the types of Technical Measures to Trade, the increase of Technical Barriers to Trade and Pre-shipment Inspection has significantly improved enterprises, and the promotion effect of Sanitary and Phytosanitary Measures on the export participation degree of enterprises is not significant. According to the intermediary effect model, it can be concluded that there is an indirect transmission channel through which technical measures affect the participation of enterprises in export through export diversification.

1. Introduction

The eight rounds of GATT/WTO negotiations have prompted countries to significantly reduce tariffs, and the role of traditional tariff measures has gradually declined. Along with the general reduction of tariffs, non-tariff measures have gradually become the main tool of trade protection. There has been a “seesaw effect” in which tariff measures and non-tariff measures “fall one after the other”. As legitimate WTO trade rules, non-tariff measures have a huge impact on the import and export of WTO members due to their discriminatory and concealed characteristics. Over the past 40 years of China’s reform and opening up, import and export trade has developed rapidly, and it will inevitably be restricted by non-tariff measures. Especially as a large developing country, the technical content of products is difficult to compare with the products of developed countries such as the United States and the European Union. Since the beginning of the new century, China’s export products have been increasingly subject to technical measures (TMT: Technical Measures to Trade). In the implementation process of various countries, technical measures can not only achieve public policy objectives, such as protecting consumers’ health and the environment, but also distort the trade structure by increasing the export cost of enterprises. For this reason, many countries have created unfair competitive advantages for their domestic enterprises through technical measures, which makes it difficult for exporters to provide services to the market that implement technical measures and hinders the smooth progress and long-term development of international trade. In particular, since the US financial crisis in 2008 and the European debt crisis, Trump’s Cold War mentality has further promoted global trade protectionism and anti-globalization, and global exports have been affected by technical measures, non-technical measures and tariff wars in all aspects.
However, there is still academic debate on the impact of TMTs on firms’ export participation. On the one hand, compliance with regulatory standards in importing countries constitutes a fixed market entry cost and can be part of the variable costs incurred by firms each time they export to a market imposing a TMT (e.g., if higher quality inputs should be used), thereby discouraging firms’ export participation. On the other hand, the adoption of TMTs may catalyse production upgrading by firms or act as a signal to consumers that their products are of higher quality, thereby increasing demand for the products and thus boosting firms’ export participation. In particular, TMT encompasses a wide range of technical measures such as Technical Barriers to Trade (TBT), Sanitary and Phytosanitary Measures (SPS) and Pre-shipment Inspection (PSI), and the impact of each type of measure on firms’ export participation may have a differentiated impact, adding to the complexity of the TMT issue. At the same time, in order to reduce export risks in the face of external trade, enterprises usually actively participate in the globalised division of labour, accelerate the pace of technological innovation and enhance enterprise productivity. Therefore, an in-depth analysis of the impact of TMT and tariffs on Chinese exporting firms can provide empirical evidence to clarify the mechanism of the role of TMT on firms’ export participation, as well as facilitate the understanding of the differentiation of heterogeneous firm behaviour and performance.
New trade theory, though, takes into account factors such as economies of scale and consumer preferences and assumes that firms in an industry have the same technology, similar levels of productivity and similar trends in participating in trade. However, it contradicts empirical observations and micro-data of firm heterogeneity, prompting the emergence of the “heterogeneous firm trade model” (i.e., HT model) (Melitz, 2003) [1]. The heterogeneous firm model allows each firm in an industry to have a different level of productivity and assumes that only more productive firms can choose to become exporters because more productive firms can overcome entry costs in foreign markets. For example, the HT models of Melitz (2003), Lawless (2009) and Chaney (2008) provide a theoretical framework for examining the impact of trade costs (including those associated with technical barriers) on firms’ intensification and expansion of export profitability [1,2,3].
Technological measures are often seen as a disincentive or facilitator of trade (Altıntaş et al., 2007; Dean, Mengüç, & Myers, 2000; Julian & Ahmed, 2005; Kahiya & Dean, 2014; Katsikeas, Piercy, & Ioannidis, 1996; Mavrogiannis, Bourlakis, Dawson, & Ness, 2008) [4,5,6,7,8,9]. Some scholars in their studies have hypothesised that technical measures hinder export performance (Altıntaş et al., 2007; Dean et al., 2000) [4,5]. Other scholars, however, have argued that there is both a negative and a positive relationship between technical measures and export performance (Julian & Ahmed, 2005; Kahiya & Dean, 2014) [6,7].
Empirical studies have shown that technical measures have a negative impact on export performance and include procedural and competition-related trade barriers (Altıntaş et al., 2007 and Mavrogiannis et al., 2008) [4,9]. In addition, firm managers’ preferences (Dean et al., 2000; Julian & Ahmed, 2005) [5,6], knowledge (Kahiya & Dean, 2014) [7] and experience (Katsikeas et al., 1996) [8] are negatively related to firm export performance. Köksal & Kettaneh (2011), through a cross-country analysis of Lebanese and Turkish exporters, compared cross-country analyses of Lebanese and Turkish exporters to reach similar findings [10]. For example, their results show that trade-related barriers have a negative impact on the performance of Lebanese and Turkish exporters. For firms located in France, Fontagné et al. (2015) examine the negative effects of SPS concerns on expansion and intensification margins, but this negative effect is attenuated in larger firms [11]. Fontagné and Orece (2018) reveal similar negative effects of TBT concerns on exports. Moreover, these negative effects are stronger for multi-destination firms, as they tend to shift to destinations without TBTs [12].
Some studies also suggest that TBTs are positively related to firms’ export performance (Dean et al., 2000; Julian & Ahmed, 2005; Kahiya & Dean, 2014) [5,6,7]. Exporting firms often contribute to their export performance by adapting to foreign markets as quickly as possible (Julian & Ahmed, 2005; Kahiya & Dean, 2014) [6,7], improving their ability to cope with foreign exchange risks (Dean et al., 2000) and enhancing international competition (Köksal & Kettaneh, 2011) [5,10]. At the same time, the adoption of higher technological standards may also stimulate firms to upgrade their products and signal to consumers the higher quality of their products, thus increasing market demand (Jin & Bao, 2015) [13]. From a developing country perspective, Kamal and Zaki (2018) analysed the impact of TBT on Egyptian firms [14]. The results show that TBT issues have a negative impact on intensive profitability but no significant truncated impact on extensive profitability, unless firm size is taken into account. Fernandes et al. (2019) combine data on pesticide standards and firm exports from 42 developing countries and argue that restrictive standards have a negative impact on firms’ exports, but that firm size and networks can partially compensate for this negative impact [15]. The net impact of technical measures on firms’ exports is therefore uncertain, depending on the relative magnitude of their cost increases and demand enhancements.
As can be seen, scholars currently focus on discussing the symbolic direction of technical measures affecting firms’ export decisions, at the same time providing insights into a range of factors that influence firms’ export behaviour, including the form of trade barriers, managers’ preferences and the way firms respond to risks. However, there are few results on the research of different periods and types of technical measures on enterprises’ export behaviour. Drawing on previous research findings, this paper incorporates tariff and non-tariff measures into a unified analytical framework, simultaneously discussing the impact of various types of technical measures on firms’ export participation.
The main contributions of this paper may have the following three points. First, it establishes a unified analysis framework for the impact of tariff and non-tariff measures on enterprises’ export behavior. Second, it uses the method of multi-period differences-in-differences (DID) to verify whether technical measures will have an impact on the export behavior of enterprises, and it further analyzes the impact of the intensity of technical measures on the export behavior of enterprises. Third, according to the different types of technical measures, the whole sample is divided into TBT enterprises, SPS enterprises and PSI enterprises, to more clearly show the difference in the impact of different types of technical measures on enterprises’ export participation. This study is not only a useful supplement to relevant literature on technical measures, but it is also helpful for a comprehensive assessment of the changing trend of Chinese enterprises’ export behavior under the influence of technical barriers.

2. Theoretical Model

For the basic decision-making process of enterprises, academic circles have carried out a lot of theoretical explorations. For example, in the heterogeneous enterprise model, scholars have found that the productivity threshold of enterprises’ export can vary with the accessibility of the destination country (in the exporting country under constant conditions), and firms with lower productivity will leave the destination country where exports are more difficult, thereby reducing firms’ export participation (Chaney, 2008) [3]. However, in the general equilibrium model, exporters may also increase export market diversification by exporting to other markets in order to respond to technical measures.
In general, technical measures affect not only fixed but also variable costs, and the simplest trade models assume imperfect competition and increasing returns. Considering the situation in which enterprises are subjected to technical measures in an open economy, this paper assumes that τ = τ* represents the variable cost of TMT discrimination, where τ* is generally larger than τ when not subject to technical measures; assume f = f* means that TMT discrimination is involved in the fixed costs, where f* is generally greater than f without technical measures.
In the case of technical measures, this paper assumes that the decision facing firm i is whether to export to country j. By the criteria of the heterogeneous firm model, entering a foreign market is related to paying an initial fixed cost ( f i j * ). The above statement is well supported by relevant empirical studies, including the cost of information collection or the establishment of new sales network (Roberts and Tybout, 1997) and the cost of introducing advanced technology (Bao and Qiu, 2012) [16,17]. πij represents the annual profit after the enterprise decides to enter the foreign market. If the present value of future profits exceeds the fixed input cost f i j t * , the firm will decide to export at time t:
t = 0 1     δ t π i j t > f i j t *
Discount factor (1 − δ) < 1. Assuming that future profits are deterministic, the above formula can be transformed into:
π i j t δ > f i j t *
Therefore, the probability that firm i decides to export to country j can be expressed as:
Pr E X P i j t = 1 = P r [ π i j t δ > f i j t * ]
Among them, EXPijt is an indicator variable that represents the value of 1 when it is exporting in year t. Equation (3) contains two basic parameters, profit πij and fixed input cost f i j t * , which will be explained in detail below.
The Melitz (2003) heterogeneous firm model used to describe firm profits is derived from the Dixit—Stiglitz—Krugman framework of monopolistic competition [1]. Assuming that the preferences of consumers in country j can be represented by a constant coefficient elasticity (CES) utility function, the product (Marshall) demand xij of firm i is given by:
x i j = p i j σ P j 1 σ μ j I j       ,               σ > 1
where P j = ( 0 n   p j 1 σ   d n ) 1 / ( 1 σ ) is the local price index of n commodities, σ is the elasticity of substitution among products and μj is the share of income spent in manufactured goods j (Ij). Since the enterprise will incur iceberg transportation costs τ i j * (including the increased cost due to technical measures) when selling products abroad, that is, only part of the goods can reach the destination, so the final price paid by consumers in j is pij = pi ×  τ i j * . The factory price pi initially set by a firm can be derived from its operating profit πij = pixijwili, where wi represents nominal wages and Ii is the only factor of production (labor). The marginal cost of production remains constant, so the labor used is a linear function of the output xij: Ii = f + xiji. The key innovation of Melitz (2003) is that all firms share a fixed cost f, but firms have different levels of productivity φ [1]. The profit maximization place requires that the factory price of the product produced by the enterprise is equal to the marginal cost of the constant markup rate (wi/φi), and the factory factory price of the enterprise is pi = σ/σ − 1 × wi/φi, where σ/σ − 1 ≡ 1/ρ. xij and Pi can be used to calculate the total annual profit πij:
π i j = 1 σ [ τ i j * ω i ρ φ i P j ] 1 σ μ j I j
This paper expands on the heterogeneous firm model of Melitz (2003) [1], assuming that the fixed input cost f i j * is a function of the characteristics of exporting firms:
f i j * A i = f i j * ¯ A i θ
Among them, f i j * represents the specific fixed cost of i’s export destination j, which includes the related costs of organizing training, establishing a sales network, etc., and the increased costs affected by technical measures when enterprise i exports to j. At the same time, A represents the impact of firm characteristics (including firm performance characteristics and ownership attributes) on the fixed input cost f i j * .
Expressed in natural logarithms, Equation (3) can be rearranged as:
P r E X P i j t = 1 = P r [ ln π i j t > ln δ + ln ( f i j t * A i t ) ]
Firm revenue and fixed input costs can be written as estimable equations:
ln π i j t = β 0 + β 1 ln φ i t + β 2 ln ω i t + β 3 ln τ i j t * + β 4 ln μ j t + β 5 ln P j t + β 6 ln I j t
ln f i j t * A i t = γ 0 + γ 1 ln A i t + ε i j t
Among them, εijt is the random disturbance term, which includes all the unobservable parts in the export decision of the enterprise. Therefore, the possibility of an enterprise deciding to export is:
P r E X P i j t = 1 = P r [ β 0 + β 1 ln φ i t + β 2 ln ω i t + β 3 ln τ i j t * + β 4 ln μ j t + β 5 ln P j t + β 6 ln I j t ] > γ 0 + γ 1 ln A i t + ε i j t  
Define the relationship between the export probability of firm i to country j and the export participation of firm i as follows:
E I i t = j μ j P r E X P i j t = 1
Among them, EIit is the export participation index of firm i in period t, and μj is the specific trade weight of country j. For export enterprises, if they only point to a certain target market, once the increase in technical measures leads to large fluctuations in demand in this market, the export probability of the enterprise will be reduced. If multiple target markets are targeted at the same time, and each target market is independent of each other and there is a problem in one market, the company can adjust the export volume among multiple markets so as to reduce the impact of a single market demand shock on the company’s export stability and keep the company in the Export Participation in International Markets. The diversification strategy of actively expanding more overseas markets is usually regarded as an effective way to reduce dependence on a fixed target market (Sang and Li, 2011) [18]. Therefore, the diversification of target markets is an effective means to reduce the business risks that enterprises take due to the single market and to improve the export participation of enterprises.
Hypothesis 1.
The increase of foreign technical measures will increase the export participation of enterprises.
Hypothesis 2.
Improving the diversification of the export market of enterprises is an important means and method to increase export participation.

3. Econometric Model

3.1. Model Settings and Variable Descriptions

3.1.1. Model Settings

Difference-In-Difference (DID) and its extensions are currently the most widely used research tools for evaluating policy effects in China. The DID method is often used in academic circles to evaluate the trade policy effects of tariffs and non-tariff measures. The form is:
Y i t = α + β 1 T r e a t e d i + β 2 P e r i o d t + β 3 T r e a t e d i P e r i o d t + ε i t
The difference-in-difference method can effectively eliminate the heterogeneity of individuals that do not change with time before and after the implementation of trade policies and the increments that change with time, and this method can strip out the net effect of trade policy implementation shocks on individuals, so it has been widely used in trade policy evaluation. However, after China’s accession to the WTO, the time when companies were hit by technical measures was not exactly the same, and the DID method was only applicable to the same time when they were affected by technical measures. Therefore, this paper uses a multi-period double-difference model for estimation. The multi-period double-difference benchmark model is:
Y i t = α + β 1 p o s t i t + β 2 T A i t + β k X i t + μ i + f t + ε i t
Among them, the explained variable Y is the enterprise export participation degree (EEit), which represents the export participation degree of enterprise i in year t, which is processed by logarithm. The core explanatory variable is the dummy variable postit, which indicates whether enterprise i has been impacted by technical measures in year t. If it has been impacted, the value of postit is 1; since it is impossible to determine the time when each enterprise is subjected to technical measures uniformly, in the multi-period DID model the grouping variable and time variable will not exist, and the individual fixed effect μi and time fixed effect ft should also be controlled in the multi-period DID model; TA is the comprehensive tariff variable controlled by this paper, which is processed by logarithm, and εit is the random disturbance term. In addition, X refers to other control variables added in this paper, and it is mainly referring to the characteristics of the enterprise, including: (1) the age of the enterprise (age), which is measured by the logarithm of the time of the enterprise in the market; (2) the capital-labor ratio of the enterprise (kl), which uses the logarithmic value of the ratio of the net fixed assets of the enterprise to the number of employees at the end of the year; (3) the size of the enterprise (size), expressed by the logarithm of the annual industrial output value of the enterprise; (4) the characteristics of enterprise ownership (own), which is calculated by constructing dummy variables of the characteristics of enterprise ownership, letting state-owned enterprises be 1 and non-state-owned enterprises be 0.
Based on Equation (13), in order to further test the impact of the intensity of technical measures on the export participation of enterprises, this paper replaces postit with TMTit, which represents the cumulative technical measures of enterprise i in year t, and takes logarithmic processing. The final model is:
Y i t = α + β 1 T M T i t + β 2 T A i t + β k X i t + μ i + f t + ε i t

3.1.2. Variable Description

(1)
Explained variable
The explanatory variable in this paper is the enterprise’s export participation (EE), which is a comprehensive index to measure the export decision of the enterprise. The average export value of each product of the enterprise is used as the weight to carry out a weighted average to construct the enterprise’s export participation. The specific calculation process is as shown in Formula (15).
(2)
Core explanatory variables
The core explanatory variable of this paper is technical measures, and the specific calculation process is shown in Formula (17). According to the international classification standard of the United Nations Statistical Commission, TMT includes technical barriers to trade (TBT: Technical Barriers to Trade), animal and plant sanitary Phytosanitary Measures (SPS: Sanitary and Phytosanitary Measures) and pre-shipment inspection and other procedures (PSI: Pre-shipment Inspection and Others) of three types. Technological measures may be seen as a catalyst for export trade, and the adoption of higher technical standards may stimulate companies to upgrade their products and send consumers a signal of higher product quality, thereby increasing market demand (Yu, J & Bao, X. H, 2015) [13]. In addition, when companies suffer from external trade shocks, they usually pursue a diversified development strategy for export markets, thereby improving their resilience against trade risks. Therefore, the direction of the net impact of technical measures on companies’ export participation is positive, and the expected sign is positive.
(3)
Control variable
Comprehensive tariff (TA): the tariff data comes from the WTO tariff database, and the average ad valorem tariff rate of the most-favored-nation rate is selected for calculation. The specific calculation process is as shown in Formula (18). Scholars generally believe that reducing tariffs and promoting free trade can increase resources on a global scale, improve allocative efficiency, promote the increase of the welfare level of the participating countries and improve the participation of export enterprises in the international market (Smith A, 1776; Ricardo D, 1817; Stolper & Samuelson, 1941) [19,20,21]. However, with the substantial increase in export participation, the weighted average tariff of multi-product exporters will also increase accordingly, thus forming a positive correlation between the comprehensive tariff of enterprises and export participation; the expected sign is positive.
Enterprise age (age): according to the life cycle theory of enterprises, the growth of enterprise age is accompanied by the expansion of enterprise investment and scale, the maturity of production management methods and the formation of enterprise reputation. The older the enterprise is, the more likely it is to enter the foreign market. At the same time, it is relatively easier to deal with adverse shocks in the export market (Jovanovic B, 1982) [22]. Referring to the practice of Wen, C. and Miao, S. (2016), the logarithm of the difference between the current year and the establishment year of the enterprise is used to measure the age of the enterprise [23]. The expected sign is positive, indicating that the older enterprise has a relatively higher export participation.
Enterprise capital-labor ratio (kl): the capital-labor ratio is an important indicator reflecting the degree of capital deepening of the enterprise. The higher the degree of capital deepening, the easier it is for some enterprises that are more dependent on external financing to obtain investment at a lower cost, and the more easy it is to develop foreign trade (Svaleryd & Vlachos, 2005) [24]. In addition, when companies initially choose to export, they need to pay the fixed costs required for overseas market expansion. Only companies with high productivity and relatively strong capital can obtain sufficient funds to cover this fixed cost (Bernard, 2007) [25]. The expected sign is positive, indicating that the higher the capital-labor ratio, the higher the export participation of enterprises.
Enterprise size (size): new trade theory believes that economies of scale play a very important role in the export of enterprises, and larger enterprises are more inclined to participate in international markets (Krugman, 1980) [26]. At the same time, the New Trade Theory also found that the size of the enterprise is an important factor affecting export participation. The larger the enterprise, the more capital and human resources it has, and the more capable it is to overcome adverse shocks in the international market (Bernard & Jensen, 2004) [27]. The logarithm of the total industrial output value is used to represent the scale of the enterprise. The expected sign is positive, indicating that the larger the enterprise scale, the higher the export participation of the enterprise.
Ownership characteristics (own): the export decision of an enterprise is usually regarded as a strategic response made by the enterprise management under the influence of internal and external factors of the enterprise. Some scholars believe that the export decision is closely related to the corporate governance structure (such as the ownership structure) (Filatotchev et al., 2008) [28]. In particular, the difference between state-owned and non-state-owned capital will lead to differences in business behavior. Non-state-controlled enterprises have stronger export preferences than state-owned enterprises (FU, Da-hai and TANG, Yi-hong, 2013) [29]. Drawing on the practice of Ping Xinqiao (2003), a dummy variable of enterprise ownership is set; it is set to 1 for state-owned enterprises and 0 for non-state-owned enterprises [30]. The expected sign is negative, indicating that non-SOEs have higher export participation than SOEs.

3.2. Data Sources and Sample Composition

3.2.1. Data Sources

All data on technical measures come from the TRAINS database. The database records an overview of measures taken by countries that will affect the commercial interests of other countries, including information such as the country where each measure is implemented, the type, the HS6 products involved, the countries affected and the time of implementation.
Tariff information comes from the WTO Tariff Database. The tariff data mentioned in this article are all based on the average MFN applicable tariff rate. The tariff data of each product in the WTO tariff database can be obtained directly from the WTO website.
All data of enterprise characteristics are from China Industrial Enterprise Database. The database records the annual report information of all industrial enterprises above a designated size from 2000 to 2013, and its industry coverage includes the extractive industry, the manufacturing industry and the production and supply of electricity, gas and water under China’s national economic industry (GB4754-2011). There are three categories of industries, including 6–46, a total of 41 major categories of industries (two-digit code industries). The industrial enterprises designed into this paper contain a total of 36,643 enterprises, 28,831 with sales of 20 million or more and 28,841 with sales of 5 million or more.
The enterprise export data comes from the China Customs database, which provides export information at the product level (8-digit HS code) of each exporting enterprise, including export price, quantity, total amount, export destination country, enterprise ownership, trade method, etc.

3.2.2. Sample Processing

Since the customs trade data is HS8-digit code, whereas the tariff data and TRAINS database directly obtained from the WTO are HS6-digit code, the product code in the customs database is intercepted into six digits, and the tariff data and technical measures data are analyzed by this code as well as customs data in order to be merged and organized. Finally, the multi-destination six-digit product-level export data was merged to the firm level with the firm year unchanged. At the same time, the missing values, outliers and obvious statistical error samples of relevant variables in the survey statistical database will be deleted.

3.2.3. Key Metrics

In order to minimize the sample selection bias and the endogeneity problems caused by the self-selection of export products of enterprises, academia usually uses the products exported by enterprises to obtain enterprise-level data according to the weighted average of the export value. However, this method does not take into account the degree of trade dependence between different export destination countries and the Chinese market. Therefore, this paper uses the average export value of each product of the enterprise to the destination country as the weight to perform a weighted average to calculate the export participation of enterprises (EE), market diversification (DIFF), technical measures (TMT) and comprehensive tariffs (TA). The following enterprise-level metrics were built:
E E i t = k μ i k j λ j e e i j t k
D I F F i t = k μ i k v a r i t y i t k
T M T i t = k μ i k j λ j t m t i j t k
T A i t = k μ i k j λ j τ i j t k
Among them, EEit, DIFFit, TMTit and TAit represent the export participation, export market diversification index, technical measures and comprehensive tariffs of i-firm in year t, respectively. e e i j t k refers to the dummy variable of the export of product k of company i to country j in year t, and the export is set to 1, and the export is set to 0; v a r i t y i t k refers to the number of export destination countries of product k of company i in year t; technical measures ( t m t i j t k ) refer to the number of technical trade policy notifications issued by country j for product k of company i in year t, including technical barriers to trade (TBT), sanitary and phytosanitary measures (SPS) and pre-shipment inspection and other procedures (PSI); τ i j t k refers to the average most-favored-nation tariff levied by country j when importing product k of enterprise i in year t; λj refers to the proportion of bilateral trade volume of China’s trading partner j in 2015.
μ i k = t X i t k T i k t X i t T i
μ i k refers to the export share of product k of enterprise i in the enterprise. In order to overcome the endogeneity problem caused by the self-selection bias of enterprises, this paper adopts the fixed ratio of the average annual export value of products in the enterprise life cycle to the total average annual export value of the enterprise. Among them, X i t k is the total trade volume of product k exported by company i in year t; Xit refers to the total export trade volume of company i in year t; T i k represents the total export volume of product k of company i for T years; Ti means that company i participated in the export for a total of T years.
Through the time trend of the technical measures (TMT) index in Figure 1, it can be found that the fluctuations of technical measures are relatively violent. After China joined the WTO in 2001, the technical measures received by Chinese export enterprises began to increase slowly. It may be that in order to join the WTO, China promised to implement principles such as non-discrimination, market access and transparency, which made Chinese enterprises suffer more. Most of them are technical measures from foreign markets. A sharp rise occurred around 2008, which may be related to the global financial crisis. For the purpose of protecting the domestic economy, governments of various countries began to frequently regulate foreign trade policies and intensively introduced technical measures that were in line with their own interests. In 2011–2012, it entered a stage of rapid growth again. In the post-crisis period, which was affected by the outbreak of the European debt crisis, inflation and economic stagnation led to internal and external troubles, which increased the technical measures faced by Chinese export enterprises. At the same time, trade protectionism was in the post-crisis period. The period is on the rise in all directions, and many countries have gradually clarified their policy orientation of “beggar-thy-neighbor” in response to the slowdown in global trade growth, and have begun to increase “technical barriers” in large numbers.
According to the time development trend of the comprehensive tariff (TA) in Figure 2, it can be seen that there has been a rapid increase after 2001. The reason is that after China’s accession to the WTO, the certainty of tariff rates and trade policies faced by Chinese export enterprises has dropped significantly, greatly increasing the export participation of enterprises and at the same time expanding the export scale and product diversification of enterprises. Therefore, the cumulative tariff rate of Chinese enterprises in the export process has been significantly increased, resulting in a substantial increase in tariffs.
Figure 3 and Figure 4 show the time trends of enterprise export diversification (DIFF) and export participation (EE), respectively. It can be found that a peak appeared around 2008. The reason is due to the global financial crisis. Shocks make trade credit more difficult, since international trade typically takes longer and carries greater risks than domestic trade, and exporters need more capital than those who only supply the domestic market. Therefore, the lack of liquidity in the financial environment can seriously damage international trade, especially for those exporting firms that rely on financing, by reducing their export supply and leading to further reductions in firm export diversification and export participation.

4. Empirical Analysis Results

4.1. Descriptive Statistical Analysis

The statistical descriptive characteristics of the variables involved in the text are shown in Table 1.
Using the multi-period DID method to estimate the policy effect of technical measures has an important premise, which is: if there is no external trade policy shock, the time development trend of the enterprises in the treatment group and the enterprises in the control group should be consistent and will not follow systematic differences occur over time. Before multi-period DID estimation, it is necessary to test whether there are systematic differences in export participation among different firms. Firstly, the most intuitive method, the diagram method, is carried out to compare and analyze the enterprises in the treatment group and the enterprises in the control group. Figure 5 shows that the export participation of enterprises in the treatment group and the enterprises in the control group basically maintain the same development trend, indicating that there is no systematic difference between the two types of enterprises.
From Figure 5, it can be found that after China joined the WTO in 2001, the development trend of the export participation of enterprises in the treatment group has changed compared with that of the enterprises in the control group. The development trend of the degree is basically synchronized, but with the passage of time, the technical measures suffered by enterprises began to increase, and the growth rate of export participation of enterprises in the processing group also accelerated significantly. This suggests that technical measures may have contributed to the export participation of companies in the treatment group. Next, it will be tested and supported by empirical analysis.

4.2. Benchmark Regression Results

The data of enterprise export participation were used to regress Equation (14), and the results are shown in Table 2. Regardless of the intensity of technical measures, the coefficients of technical measures variables are significantly positive. After adding control variables, the impact of technical measures intensity on the export participation of enterprises is reduced, indicating that the factors of enterprises are effectively controlled. On the basis that export enterprises have been impacted by technical measures, for each new unit of technical measures, the export participation of enterprises will increase by 2.79%. The above results indicate that the intensity of technical measures (TMT) suffered by enterprises also has a positive impact on their export participation, which verifies Hypothesis 1. Not only that, the increase in the comprehensive tariff level (TA) has also significantly increased the export participation of enterprises. The estimated coefficient of firm age (age) is positive, indicating that as the age of exporting firms increases, it is more likely to have a higher degree of export participation; the estimated coefficient of capital-labor ratio (kl) is positive, indicating that the capital-labor ratio is higher for enterprises that are more inclined to make export decisions; the estimated coefficient of enterprise ownership (own) is significantly negative, indicating that compared with state-owned enterprises, non-state-owned enterprises have a higher degree of export participation, whereas the estimated coefficient of enterprise size (size) is significantly positive, indicating that the increase in the production scale of enterprises is conducive to the improvement of export participation.

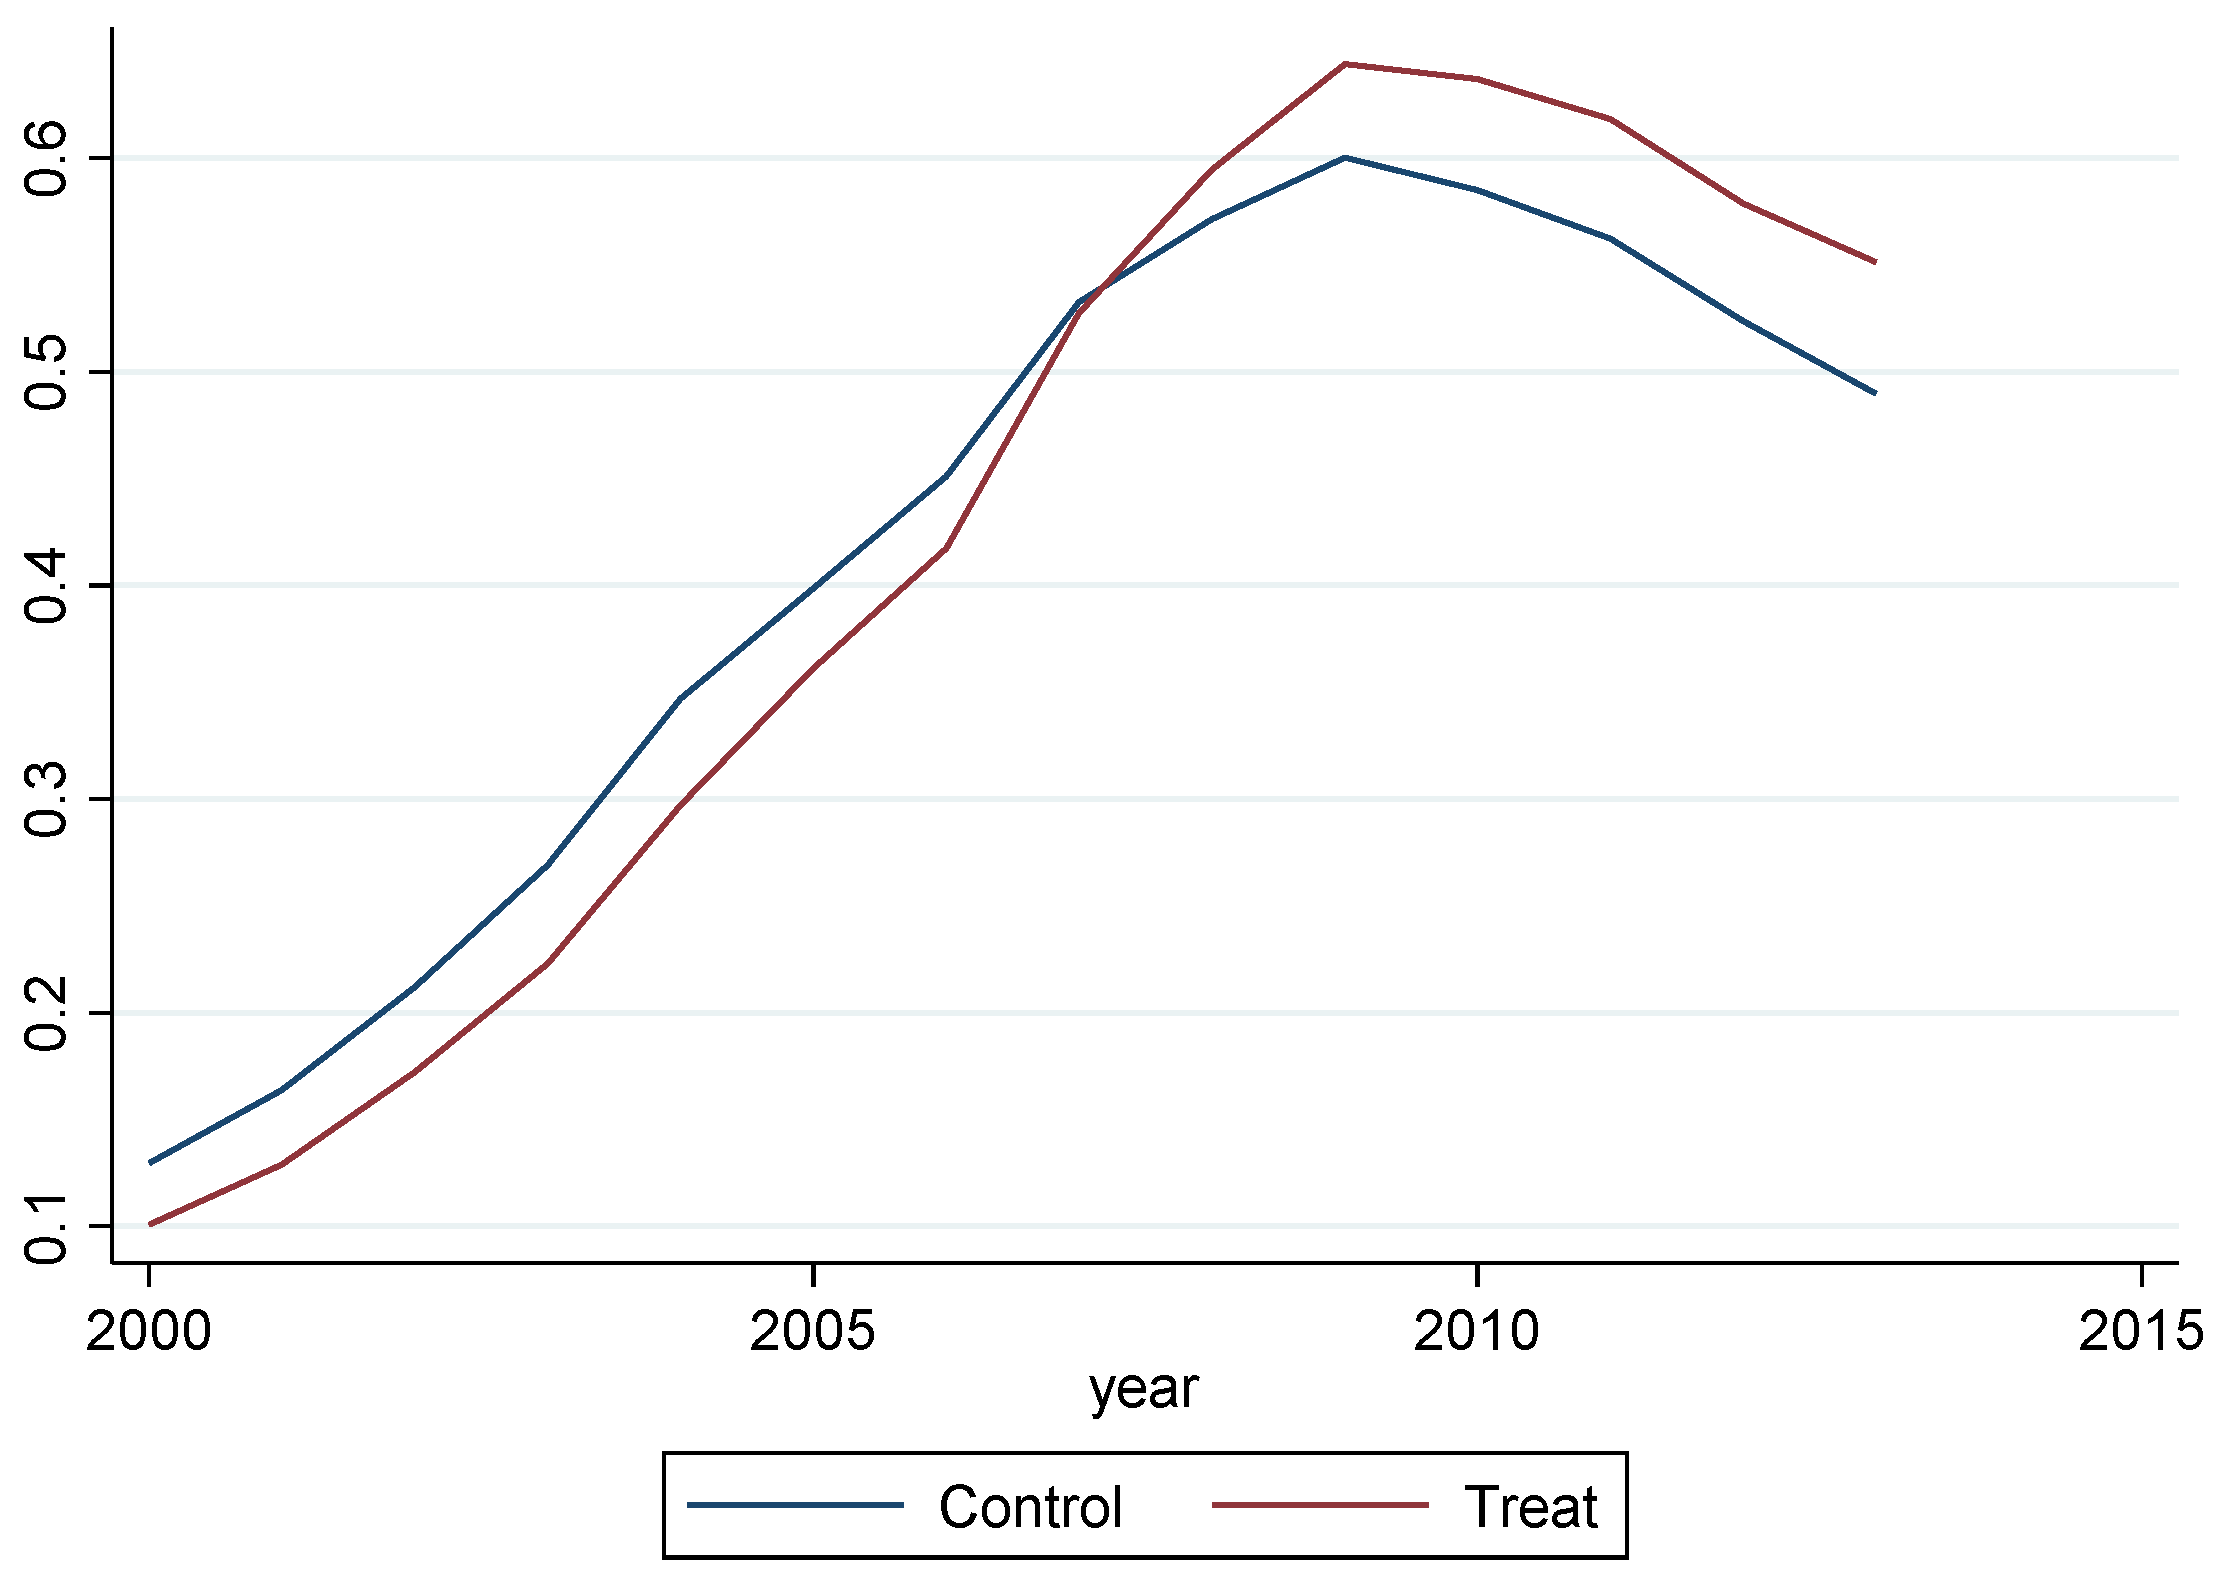
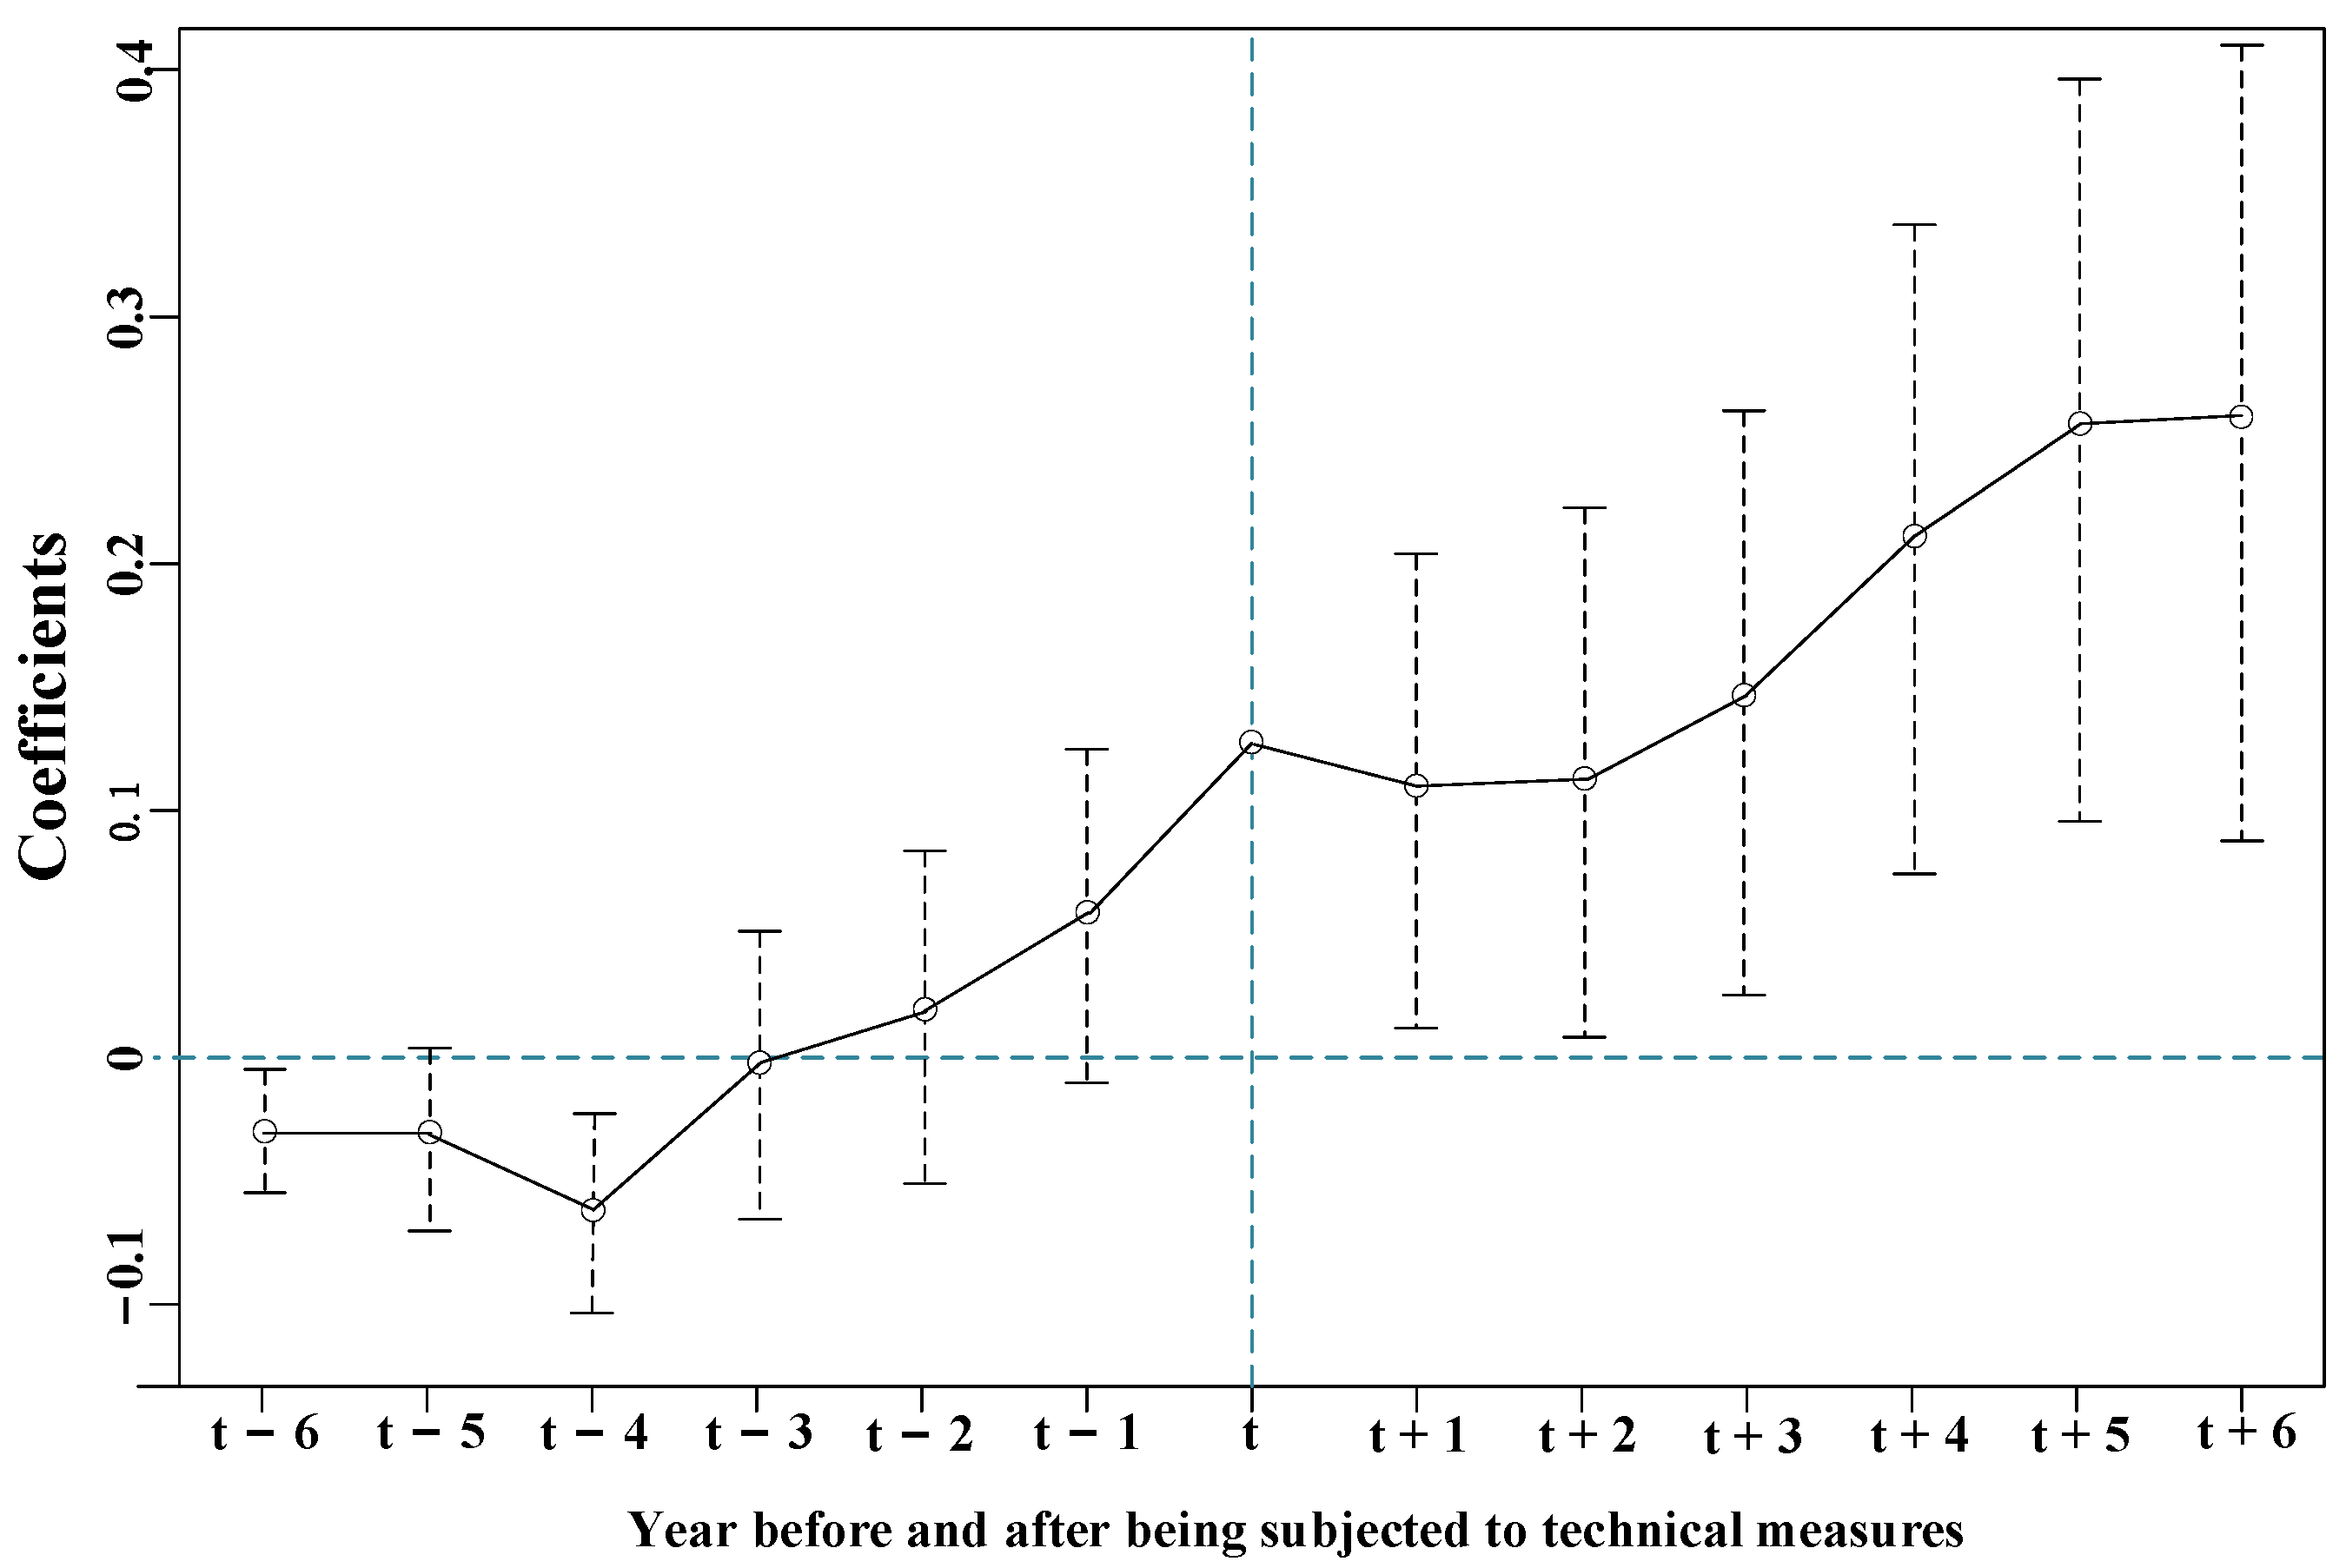
4.3. Parallel Trend Test

The precondition for the validity of multi-period DID is that the parallel trend assumption holds. If the parallel trend hypothesis is established, the impact of technical measures on the export participation of enterprises will only occur after each company is hit by the technical shock. There were no significant differences in the trend of changes in engagement.
In order to test the parallel trend hypothesis, this paper sets the following model on the basis of Equations (13) and (14):
E E i t = α + p = 6 6 β p y e a r p i t + β 2 T A i t + β k X i t + μ i + f t + ε i t
In Formula (20): yearpit is a dummy variable. If enterprise i suffered from technical measures from 2002 to 2013, and the t-th year is the p-th year before and after the impact of technical measures by enterprise i, then yearpit takes the value of 1; otherwise, it is 0. The condition for the establishment of the parallel trend hypothesis is that in the first 6 years of the technical shock there is no significant difference in the export participation of the treatment group and the control group. Figure 6 shows the magnitude of the βp coefficient and its 95% confidence interval, where the abscissa represents the subscript p of βp in Equation (20). Figure 6 shows the change of the coefficient of enterprises’ export participation before and after the impact of technical measures. The regression results show that the coefficient changes (before being impacted by technical measures) do not show a certain law, and are not significantly different from 0, which indicates that the parallel trend hypothesis is established.

4.4. Other Robustness Checks

4.4.1. Control Industry Time Trends

Changes in firms’ export participation may be affected by some non-observed industry-specific factors in their industries. If expected, the time trends of firms’ export participation changes in different industries will be different, and the results may lead to processing. The outcome variable (i.e., firm export participation) of the group and the control group varies along different paths, leading to biased estimates. For the sake of insurance, we draw on the ideas of Mao, QL (2020) to test whether non-observed industry-specific factors will substantially affect the estimation results of this paper [31]. In this paper, the industry-specific linear time trend term is added to the benchmark double-difference method model for estimation, and the regression results are shown in Table 3. The core explanatory variables are still significantly positive after controlling for the industry-specific linear time trend, which means that the increase in technical measures is conducive to promoting the increase of enterprises’ export participation. It can be seen that the non-observed industry-specific factors have not had any substantial effect on the core conclusions of this paper.

4.4.2. Two-Period DID Method

So far, this paper has used the multi-period DID method for empirical analysis. However, a potential disadvantage of multi-period DID estimates is that there may be serial correlation problems. In order to control the impact of potential serial correlation on the regression results, a two-period DID regression was further performed. As can be seen from Table 3, the core explanatory variables are significantly positive, indicating that the increase in technical measures significantly promotes the improvement of enterprises’ export participation, which is consistent with the previous estimation results based on the multi-period DID method.

4.5. Heterogeneity Analysis Results

According to the different types of technical measures, the samples are divided into TBT-affected enterprises, SPS-affected enterprises and PSI-affected enterprises. Columns (2)–(5) of Table 4 report the DID estimation results based on the above subsamples, respectively. As a control, the overall sample estimation results of Table 2 are put into column (1). It can be seen that the increase of TBT, SPS and PSI has a positive impact on the export participation of Chinese export enterprises, but only the increase of TBT and PSI significantly improves the export participation of enterprises, whereas SPS has a positive impact on the export participation of enterprises. The promotion effect is not significant. The possible explanation for the above-mentioned heterogeneity effect is: the increase of SPS only affects the export volume of enterprises and does not have a substantial effect on the entry and exit of enterprises in the export market. However, the increase of TBT and PSI significantly promoted the possibility of enterprises entering the overseas market. The main reason for this is that the negotiations on agriculture in the Uruguay Round were the direct cause of the SPS, whereas the exporters involved in this paper are all industrial firms. Therefore, the SPS has no significant impact on the export participation of industrial firms. TBT and PSI, on the other hand, have a significant positive impact on the participation of exporters.

4.6. Mechanism Test Results

In order to find out whether the technical measures can improve the export participation of enterprises by promoting the diversification of the export market of enterprises, this part takes the diversification of the export market of enterprises as the mediating variable and constructs the following mediation effect model:
D I F F i t = α + β 1 T M T i t + β 2 T A i t + β k X i t + μ i + f t + ε i t
E E i t = α + β 1 T M T i t + β 2 D I F F i t + β 3 T A i t + β k X i t + μ i + f t + ε i t
Among them, DIFFit is an intermediary variable, which represents the diversification index of the export market after taking the logarithm of the i company in the t period. The specific calculation process is as in Formula (16), where εit is the random error term and X is the control variable. The coefficient β1 in Equation (14) measures the total effect of technical measures on firms’ export participation, β1 in Equation (21) measures the impact of technical measures on the diversification of firms’ export markets and β1 in Equation (22) represents the direct effect of technical measures on firms’ export participation. Therefore, by estimating Equations (14), (21) and (22), the direct effect, indirect effect and total effect of the technical measures index on the export participation of enterprises can be obtained.
We then further analyzed the mediating effect mechanism of technical measures affecting the export participation of enterprises. Firms may increase their export participation by increasing the diversification of their export markets when they are subject to technological measures. According to the test logic of the mediation effect, the mediation effect of export diversification is identified by a step-by-step test of the regression coefficient. First, the estimation model (21) in Table 5 shows the regression results; the regression coefficients of technical measures on the diversification of enterprises’ exports is 0.0789, respectively, and is significantly positive at the 1% level, indicating that when enterprises suffer from an increase in technical measures, enterprises will increase export market diversification to counter the adverse effects of the external trade environment.
Then, the estimation model (22) in column (3) of Table 5 shows the regression results of technical measures on the export participation of enterprises after the introduction of the intermediary variable to diversify the export market. The regression coefficient of export market diversification on enterprises’ export participation is 0.3695 and significant at the 1% level, indicating that the increase in export market diversification can significantly promote enterprises’ export participation. At the same time, the regression coefficient of technical measures on enterprises’ export participation is −0.0012, which is lower than the regression coefficient of 0.0279 in column (1) of Table 6, indicating that there is an indirect transmission channel through which technical measures affect enterprises’ export participation through export diversification. The above conclusions verify Hypothesis 2.
After the empirical analysis of the full sample, this paper further tests the mediating effects of export diversification using two major types of technical measures, TBT and PSI, as sub-samples, and compares and analyses the differences in the mediating effects of the two major types of export diversification, as shown in Table 6 and Table 7. There are category differences in the mediating effects of export diversification. By examining the mediating effects of TBT and PSI export diversification, it is found that the correlation coefficients for both TBT and PSI are significantly positive, as shown in column (2) of Table 6 and Table 7, but the coefficient for TBT is much larger than that for PSI, implying that TBT has a greater role in promoting firms’ export participation through export diversification, i.e., the mediating effect of export diversification is greater for firms suffering from TBT.

5. Conclusions

This paper constructs a theoretical model including the characteristics of technical measures and enterprise heterogeneity, and it uses the multi period multiple DID method to study the changes of Chinese enterprises’ export participation when subjected to technical measures. At the same time, it explores the impact of export market diversification on enterprises’ export participation, discusses the heterogeneous differences of the impact of technical measures on enterprises’ export participation and tests the mechanism. The main conclusions are as follows: (1) for the strength of the technical measures, the coefficients on the technical measures variables are all significantly positive; (2) from the category of technical measures, the increase of TBT and PSI significantly improves the export participation of enterprises, whereas the promotion effect of SPS on the export participation of enterprises is not significant; (3) the mediation effect test confirms that technical measures can increase the export participation of enterprises by promoting the diversification of enterprises’ exports. Therefore, we should encourage enterprises to develop diversified export markets as a way to better protect themselves against adverse external trade risks.
Although this paper establishes that the relationship between technical measures and firms’ export participation works through firms’ export diversification, data after 2013 is generally considered unreliable due to limitations in data availability, especially since the statistical scope of the Chinese Industrial Enterprises Database is industrial enterprises with sales of more than 5 million yuan (20 million yuan or more from 2011) in mainland China. Thus, there is limited possibility of further research on the relationship between technical measures and firms’ export participation after 2013. In addition, frequent and uncertain events after 2013 such as the ensuing European debt crisis, the US debt crisis, the US-China trade war and the new crown epidemic may have different degrees of impact on China’s import and export trade, which may affect the results of this paper to some extent. The emergence of these issues provides an opportunity for further research in a broader perspective in the future.

Author Contributions

Conceptualization, H.-L.W.; Data curation, W.-W.Z. All authors have read and agreed to the published version of the manuscript.

Funding

This project was jointly supported by the National Major Project of the National Social Science Foundation of China (Grant No. 20&ZD109).

Institutional Review Board Statement

Not applicable.

Informed Consent Statement

Not applicable.

Data Availability Statement

The data presented in this study are available on request from the corresponding author.

Conflicts of Interest

The authors declare no conflict of interest.

References

  1. Melitz, M.J. The impact of trade on intra-industry reallocations and aggregate industry productivity. Econometrica 2003, 71, 1695–1725. [Google Scholar] [CrossRef] [Green Version]
  2. Lawless, M. Firm export dynamics and the geography of trade. J. Int. Econ. 2009, 77, 245–254. [Google Scholar] [CrossRef] [Green Version]
  3. Chaney, T. Distorted gravity: Heterogeneous firms, market structure, and the geography of international trade. Am. Econ. Rev. 2008, 98, 1707–1721. [Google Scholar] [CrossRef] [Green Version]
  4. Altıntaş, M.H.; Tokol, T.; Harcar, T. The effects of export barriers on perceived export performance: An empirical research on SMEs in Turkey. EuroMed J. Bus. 2007, 2, 36–56. [Google Scholar] [CrossRef]
  5. Dean, D.L.; Mengüç, B.; Myers, C.P. Revisiting firm characteristics, strategy, and export performance relationship: A survey of the literature and an investigation of new zealand small manufacturing firms. Ind. Mark. Manag. 2000, 29, 461–477. [Google Scholar] [CrossRef]
  6. Julian, C.C.; Ahmed, Z.U. The impact of barriers to export on export marketing performance. J. Glob. Mark. 2005, 19, 71–94. [Google Scholar] [CrossRef]
  7. Kahiya, E.T.; Ddean, D.L. Export performance: Multiple predictors and multiple measures approach. Asia Pac. J. Mark. Logist. 2014, 26, 378–407. [Google Scholar] [CrossRef]
  8. Katsikeas, C.S.; Piercy, N.F.; Ioannidis, C. Determinants of export performance in a European context. Eur. J. Mark. 1996, 30, 6–35. [Google Scholar] [CrossRef]
  9. Mavrogiannis, M.; Bourlakis, M.A.; Dawson, P.J.; Ness, M.R. Assessing export performance in the Greek food and beverage industry: An integrated structural equation model approach. Br. Food J. 2008, 110, 638–654. [Google Scholar] [CrossRef]
  10. Köksal, M.H.; Kettaneh, T. Export problems experienced by high-and low-performing manufacturing companies: A comparative study. Asia Pac. J. Mark. Logist. 2011, 23, 108–126. [Google Scholar] [CrossRef]
  11. Fontagné, L.; Orefice, G.; Piermartini, R.; Rocha, N. Product standards and margins of trade: Firm-level evidence. J. Int. Econ. 2015, 97, 29–44. [Google Scholar] [CrossRef] [Green Version]
  12. Fontagné, L.; Orefice, G. Let’s try next door: Technical Barriers to Trade and multi-destination firms. Eur. Econ. Rev. 2018, 101, 643–663. [Google Scholar] [CrossRef] [Green Version]
  13. Yu, J.; Bao, X.H. The Effect of Product Quality on Trade Pattern and Welfare: A Review on QHFM Literature. Int. Econ. Trade Res. 2015, 31, 18–27. [Google Scholar]
  14. Kamal, Y.; Zaki, C. How do technical barriers to trade affect exports? Evidence from egyptian firm-level data. J. Econ. Integr. 2018, 33, 659–721. [Google Scholar] [CrossRef] [Green Version]
  15. Fernandes, A.M.; Ferro, E.; Wilson, J.S. Product standards and firms’ export decisions. World Bank Econ. Rev. 2019, 33, 353–374. [Google Scholar] [CrossRef]
  16. Ronerts, M.J.; Tybout, J.R. The decision to export in Colombia: An empirical model of entry with sunk costs. Am. Econ. Rev. 1997, 87, 545–564. [Google Scholar]
  17. Bao, X.; Qiu, L.D. How do technical barriers to trade influence trade? Rev. Int. Econ. 2012, 20, 691–706. [Google Scholar] [CrossRef]
  18. Sang, B.; Li, J. China’s Trading Relations with Major Emerging Countries: Analysis Based on Trade Competitiveness and Trade Complementarity. Financ. Trade Econ. 2011, 10, 69–74. [Google Scholar]
  19. Smith, A. An Inquiry into the Nature and Causes of the Wealth of Nations: Volume One; Liberty Classics: London, UK, 1776. [Google Scholar]
  20. Ricardo, D. On the Principles of Political Economy and Taxation; Cambridge University Press: London, UK, 1821. [Google Scholar]
  21. Stolper, W.F.; Samuelson, P.A. Protection and real wages. Rev. Econ. Stud. 1941, 9, 58–73. [Google Scholar] [CrossRef] [Green Version]
  22. Jovanovic, B. Selection and the Evolution of Industry. Econ. J. Econ. Soc. 1982, 50, 649–670. [Google Scholar] [CrossRef]
  23. Wen, C.; Miao, S.-Y. Trade Liberalization of Intermediate Inputs and Technology Choice of China’s Manufacturing Enterprises. Econ. Res. J. 2016, 51, 72–85. [Google Scholar]
  24. Svaleryd, H.; Vlachos, J. Financial markets, the pattern of industrial specialization and comparative advantage: Evidence from OECD countries. Eur. Econ. Rev. 2005, 49, 113–144. [Google Scholar] [CrossRef]
  25. Bernard, A.B.; Jensen, J.B.; Redding, S.J.; Schott, P.K. Firms in international trade. J. Econ. Perspect. 2007, 21, 105–130. [Google Scholar] [CrossRef] [Green Version]
  26. Krugman, P. Scale economies, product differentiation, and the pattern of trade. Am. Econ. Rev. 1980, 70, 950–959. [Google Scholar]
  27. Bernard, A.B.; Jensen, J.B. Why some firms export. Rev. Econ. Stat. 2004, 86, 561–569. [Google Scholar] [CrossRef]
  28. Filatotchev, I.; Stephan, J.; Jindra, B. Ownership structure, strategic controls and export intensity of foreign-invested firms in transition economies. J. Int. Bus. Stud. 2008, 39, 1133–1148. [Google Scholar] [CrossRef]
  29. Fu, D.-H.; TANG, Y.-H. Ownership Structure, Industrial Characteristics and Export Decisions: Evidence from Chinese Manufacturing Firms. J. Int. Trade 2013, 11, 24–33. [Google Scholar]
  30. Ping, X. The Control Manner of our State-Owned Assets and its Current Situation. Comp. Econ. Soc. Syst. 2003, 3, 63–68. [Google Scholar]
  31. Mao, Q. Does trade policy uncertainty affect Chinese manufacturing firms’ imports. Econ. Res. J. 2020, 55, 148–164. [Google Scholar]
Figure 1. Time trend of technical measures.
Sustainability 14 08909 g001
Figure 2. Time trend of comprehensive tariffs.
Sustainability 14 08909 g002
Figure 3. Time trend of export diversification index.
Sustainability 14 08909 g003
Figure 4. Time trend of export participation.
Sustainability 14 08909 g004
Figure 5. Time trend of export participation in the treatment group and the control group.
Sustainability 14 08909 g005
Figure 6. Parallel trends of enterprise export participation.
Sustainability 14 08909 g006
Table 1. Statistical description.
CategoryVariableExpected SymbolObservationsMeanStandardMinMax
dependent variableEE 570,1920.09270.092900.5246
independent variableTMT+570,1920.26410.584603.8943
controlTA + 570,1920.29340.384104.0518
age + 570,1923.01690.376507.6093
kl + 570,1921.64342.0389012.4365
size + 570,1926.31265.5633019.2672
own570,1920.04700.211701
Source: compiled by the author.
Table 2. Regression results of the benchmark model.
Variable lnEE
(1)(2)
lnTMT0.0372 ***
(0.0013)
0.0279 ***
(0.0011)
lnTA 0.0186 ***
(0.0010)
age 0.7834 ***
(0.0109)
kl 0.0118 ***
(0.0005)
size 0.0156 ***
(0.0002)
own −0.0186 ***
(0.0069)
Constant0.4513 ***
(0.003)
−2.2879 ***
(0.0366)
Time fixed Yes Yes
Individual fixed Yes Yes
R2_within 0.3523 0.4473
F 6788.55
(0.0000)
18,866.51
(0.0000)
N 513,002 513,002
Note: *** indicate significant at the significance level of 1%, respectively.
Table 3. Robustness test.
Variable lnEE
Control Industry Time Trends Two-Period Doubling Method
lnTMT0.0108 ***
(0.0005)
0.0362 ***
(0.0021)
Control Yes Yes
Industry-specific time trend Yes No
Time fixed Yes Yes
Individual fixed Yes Yes
R2_within 0.4219 0.7526
N 513,002 513,002
Note: *** indicate significant at the significance level of 1%, respectively.
Table 4. Regression results of different types of technical measures.
Variable lnEE
TMT TBT SPS PSI
(1)(2)(3)(4)
lnTMT0.0279 ***
(0.0011)
lnTBT 0.0286 ***
(0.0011)
lnSPS 0.0008
(0.0025)
lnPSI 0.078 9 ***
(0.0052)
lnTA0.0186 ***
(0.001)
0.0189 ***
(0.0010)
0.0200 ***
(0.0010)
0.0202 ***
(0.0010)
age0.7834 ***
(0.010)
0.7824 ***
(0.0109)
0.7884 ***
(0.0109)
0.7887 ***
(0.0109)
kl0.0118 ***
(0.0005)
0.0118 ***
(0.0005)
0.0119 ***
(0.0005)
0.0119 ***
(0.0005)
size0.0156 ***
(0.0002)
0.0156 ***
(0.0002)
0.0158 ***
(0.0002)
0.0158 ***
(0.0002)
own −0.0186 ***
(0.0069)
−0.0187 ***
(0.0069)
−0.0176 ***
(0.0069)
−0.0173 ***
(0.0069)
Constant−2.2879 ***
(0.0366)
−2.2836 ***
(0.0366)
−2.2407 ***
(0.0368)
−2.2471 ***
(0.0368)
Time fixed Yes Yes Yes Yes
Individual fixed Yes Yes Yes Yes
R2_within 0.4473 0.4474 0.4441 0.4450
F18,866.51
(0.0000)
18,988.22
(0.0000)
18,767.14
(0.0000)
18,654.11
(0.0000)
N 513,002 513,002 513,002 513,002
Note: *** indicate significance at the 1% significance levels, respectively.
Table 5. Mediating effect model (TMT).
Variable lnEE lnDIFF lnEE
(1)(2)(3)
lnTMT0.0279 ***
(0.0011)
0.0789 ***
(0.0019)
−0.0012
(0.0007)
lnDIFF 0.3695 ***
(0.0019)
lnTA0.0186 ***
(0.0010)
0.0244 ***
(0.0024)
0.0096 ***
(0.0008)
age0.7834 ***
(0.0109)
1.0018 ***
(0.0266)
0.4132 ***
(0.0086)
kl0.0118 ***
(0.0005)
0.0215 ***
(0.0013)
0.0038 ***
(0.0004)
size0.0156 ***
(0.0002)
0.0288 ***
(0.0005)
0.0049 ***
(0.0001)
own −0.0186 ***
(0.0069)
−0.0193 ***
(0.0156)
−0.0115 **
(0.0052)
Constant−2.2879 ***
(0.0366)
−2.8190 ***
(0.0885)
−1.2463 ***
(0.0285)
Time fixed Yes Yes Yes
Individual fixed Yes Yes Yes
R2_within 0.4473 0.3797 0.7548
F18,866.51
(0.0000)
3282.55
(0.0000)
8384.50
(0.0000)
N 513,002 513,002 513,002
Note: ** and *** indicate significant at the significance level of 5% and 1%, respectively.
Table 6. Mediating effect model (TBT).
Variable lnEE lnDIFF lnEE
(1)(2)(3)
lnTBT0.0286 ***
(0.0011)
0.0783 ***
(0.0019)
−0.0003
(0.0008)
lnDIFF 0.3694 ***
(0.0019)
lnTA0.0189 ***
(0.0010)
0.0254 ***
(0.0024)
0.0096 ***
(0.0008)
age0.7824 ***
(0.0109)
0.9996 ***
(0.0266)
0.4132 ***
(0.0086)
kl0.0118 ***
(0.0005)
0.0216 ***
(0.0013)
0.0038 ***
(0.0004)
size0.0156 ***
(0.0002)
0.0288 ***
(0.0005)
0.0049 ***
(0.0001)
own−0.0187 ***
(0.0069)
−0.0196
(0.0156)
−0.0115 **
(0.0052)
Constant−2.2836 ***
(0.0366)
−2.8033 ***
(0.0885)
−1.2482 ***
(0.0285)
Time fixed Yes Yes Yes
Individual fixed Yes Yes Yes
R2_within 0.4474 0.3795 0.7548
F18,988.22
(0.0000)
3279.19
(0.0000)
8385.04
(0.0000)
N 513,002 513,002 513,002
Note: ** and *** indicate significant at the significance level of 5% and 1%, respectively.
Table 7. Mediating effect model (PSI).
Variable lnEE lnDIFF lnEE
(1)(2)(3)
lnPSI0.0789 ***
(0.0052)
0.2142 ***
(0.0123)
−0.0002
(0.0042)
lnDIFF 0.3693 ***
(0.0019)
lnTA0.0202 ***
(0.0010)
0.0288 ***
(0.0024)
0.0096 ***
(0.0008)
age0.7887 ***
(0.0109)
1.0168 ***
(0.0269)
0.4131 ***
(0.0086)
kl0.0119 ***
(0.0005)
0.0218 ***
(0.0013)
0.0038 ***
(0.0004)
size0.0158 ***
(0.0002)
0.0292 ***
(0.0005)
0.0049 ***
(0.0001)
own −0.0173 **
(0.0069)
−0.0155
(0.0157)
−0.0115 **
(0.0052)
C−2.2471 ***
(0.0368)
−2.7031 ***
(0.0897)
−1.2489 ***
(0.0284)
Time fixed Yes Yes Yes
Individual fixed Yes Yes Yes
R2_within 0.4450 0.3745 0.7548
F18,654.11
(0.0000)
3208.04
(0.0000)
8370.96
(0.0000)
N 513,002 513,002 513,002
Note: ** and *** indicate significant at the significance level of 5% and 1%, respectively.
Publisher’s Note: MDPI stays neutral with regard to jurisdictional claims in published maps and institutional affiliations.

