Abstract
The growing economic inequality around the world is recognized as a global problem of mankind. At the same time, the key tool for reducing inequality and ensuring the achievement of sustainable development goals is the taxation system given its distributive function. That is why this paper puts forward and proves a scientific hypothesis according to which direct taxation has a significant impact on economic inequality, with its scale and sphere depending on the level of economic development and the specific architecture of the tax system adopted in a particular country. The study relies on data from 28 European Union countries, including the United Kingdom, whose tax systems are not identical but harmonized in accordance with European Union directives, the same as the legislation in other economic sectors. Accordingly, it can be concluded that similar institutional characteristics are present. We have used the method of two-stage cluster analysis, which is meant for identifying the natural splitting of the mass of data into groups, then carried out regression analysis and built some models. The contribution of the study is revealing a number of important regularities that are significant for characterizing the dependence of income inequality on direct taxation as well as formulation recommendations for improving the tax policies of European Union countries, with the potential of policy implications. The results obtained can play a significant role in the development and further harmonization of tax systems and resolving the global problem of increased inequality within and between countries.
1. Introduction
Sustainable development includes not only economic [1] and environmental [2,3] but also social [4] sustainability, which is achieved through elimination of poverty and famine, reduction of inequality and provision of equal opportunities. All over the world, growing economic inequality is recognized as a global problem of mankind [5]. The processes of digitalization have a considerable impact on the level of human capital [6,7] and various rates of territorial development [8,9], which is only reinforcing inequality between different regions [10,11]. The coronavirus crisis has also made inequality more marked [12,13]. According to the International Monetary Fund, the COVID-19 pandemic is going to make the Gini index grow by over 6% in the countries with a rising market and developing countries. An even bigger impact is forecasted for low-income countries and territories [14]. That is why reducing economic inequality is the most important goal of sustainable development [15]. The tax systems in various countries have national specifics [16,17] due to their own socio-economic development [18] and legal traditions [19]. In addition, the focus of taxation on income redistribution prevails in most countries. Our study intends to characterize the role of taxation for income levelling based on empirical data from the countries of the European Union.
The purpose of the study is to identify possible patterns in the influence of direct taxation on income inequality in the economy to determine its scale and nature in the context of groups of developed countries comparable in their macroeconomic and institutional characteristics. To achieve this goal, it seems necessary to summarize the results of previous studies to clarify the methodology of the research, which involves an econometric analysis of income inequality and tax parameters of European Union countries for 2005 to 2019.
2. Literature Review
The ideas about the impact of taxes on income redistribution, and, consequently, on economic inequality, were put forward by political economists in the 19th century. Initially, these ideas concerned fair taxation of incomes of lower social classes and the possibility of excluding them from taxation without violating the principle of equality. There was a discussion about the choice between proportional and progressive taxation. Thus, in order to exclude one-sided victims in the payment of taxes by the rich and the poor and restore tax fairness, John Stuart Mill proposed introducing a non-taxable minimum income and proved the rationality of proportional taxation for reducing wealth inequality [20]. The representative of the school of state socialism (“Staatssozialismus”) Adolf Wagner [21] added the criterion of social welfare to the fiscal criterion of taxation. He was a supporter of progressive taxation, which depends on both the size of tax bases and the type of income. In the early XX century, the ideology of Italian liberal F. Nitti, recognizing that the fiscal function of taxes is primary, proved the objectivity of the existence of the redistributive role of taxes and the rationality of applying a progressive system of taxation of personal income with moderate maximum rates in addition to proportional indirect taxes.
In the 21st century the problem of socio-economic inequality has become global, while mankind has gained wide experience in using taxation for reducing inequality within countries. Moreover, proposals to increase the progressiveness of taxation have reached the supranational level. T. Piketty and E. Saez proposed to introduce a global tax on wealth [22]. This idea was supported by Elizabeth Warren, A. Banerjee and E. Duflo. According to their estimates, high top tax rates can actually lead to reduced inequality after taxes but also before taxes as they influence the decision-making on the pay grades for top management and highly qualified employees [23].
In this regard, today, scientists raise the following questions. Does taxation have a significant impact on socio-economic inequality in different countries around the world? What indicators and methods should be used for evaluating this impact? What types of taxation have the most significant impact on inequality? In order to answer these and some other questions important for our study, let us review modern economics literature.
2.1. Gini Index as a Key Indicator of Economic Inequality
The Gini index is one of the indicators recognized by the international community as suitable for assessing economic inequality. Thus, Ref. [24] evaluates a non-linear relationship between export diversification and income inequality. It uses a balanced panel of 90 countries for the period 2002–2014. Gini indices before and after taxation, as well as transfer Gini indices, are used for indicating income inequality. Another study [25] uses panel data models for assessing the predictability of the size of share premiums based on growing Gini indices after taxes and transfers. The analysis was carried out for the G7 countries for the period from 1967 to 2011. A research study [26] evaluates the impact of de jure and de facto globalization (trade, financial, social and political KOF Globalization Indices) on inequality (Gini coefficient). The analysis was carried out for 27 European Union countries for the period from 1998 to 2017. The analysis relied on a single-stage systemic technique of the generalized method of moments (GMM).
Ref. [27] discusses the problems of social inequality based on the example of Russia. One of the analyzed indicators is the Gini index over the past several decades. The research methods used are statistical analysis and benchmarking. More specific aspects of social inequality are presented in Ref. [28]. In order to establish a correlation between the level of education and the reduction in income inequality, the authors of the research conducted statistical modeling using the Gini index, the education index and the coefficient of human inequality on the example of 130 countries. Another work [29] looks at how government funding of education influences income inequality (Gini index) in the United States.
Given the impact of the COVID-19 pandemic on all socio-economic processes, including inequality, Ref. [30] seems interesting. The authors of the study assessed the impact of pandemic uncertainty (World Pandemics Discussion Index (WPDI)) on inequality (the Gini coefficient after tax) for 141 countries for 1996–2020. Regression analysis was used for simulation. The work of Lindstrom M. [31] discusses relationships between social capital (social trust, group affiliation, civic activity, trust in government institutions), income inequality (the Gini coefficient for income) and mortality from COVID-19 in 84 countries included in different time waves.
Conclusion. Thus, due to its versatility and comparability, the Gini coefficient is quite often used in various research studies for measuring economic inequality.
2.2. Taxation as a Factor Influencing Inequality
The review of publications dedicated to this matter is especially important since it allows us to verify our own methodological approach to assessing the impact of taxation on income inequality, which makes our way different from other methodological approaches.
In their work, Bakar S.A.A. & Pathmanathan D. [32] present a comparison of income data with inequality indicators (including the Gini index) using mixed modeling. The parameters of the models were evaluated using the maximum likelihood method, while their effectiveness was measured in respect to the data on the average income per unit of tax in 10 countries. Menna L. and Tirelli P. investigated household inequality in terms of inflation and income taxes [33]. The Gini index was used to calibrate the fraction of restricted agents. The study was conducted on the example of the United States. The income inequality in Korea was measured in another study [34] using the data from the country’s tax authorities.
Bertotti M.L. and Modanese G. made a considerable contribution to the study of the subject under discussion. Over several years of research, they have expanded the areas of study and the tools they used. In their publications, the Gini index is used as the resulting modeling indicator that reflects income inequality. Ref. [35] analyzes how inequality is influenced by several parameters that determine the binary interactions in the processes of taxation and redistribution: the propensity to save, the gap in taxation rates, tax evasion, welfare checks, etc. For example, the work evaluates what effect the situation may have on inequality if the tax evasion indicator increases in proportion to the rate of taxation that people perceive as unfair. The study uses a kinetic model described by a set of nonlinear ordinary differential equations.
In their next work, Bertotti M.L. and Modanese G. present the results of the analyzed correlation of income inequality and the economic mobility of society in analytical models [36]. The authors consider the influence of the same indicators as in Ref. [35] on economic mobility.
Another study [37] divides taxpayers into clusters based on income and tax evasion. The time change in the number of individuals in each class is described by a system of non-linear differential equations of the discretized kinetic Boltzmann type. As a result, it is possible to analyze the impact of audits and fines on income inequality (Gini index) and conclude that it is insignificant.
The relationship between income inequality (Gini index) and the level of tax evasion is revealed in a later work by Bertotti M.L. and Modanese G. [38]. It studies qualitatively and quantitatively the influence of various models of human behavior in the processes of tax evasion on the form and features of the emerging income distribution profile. Numerical solutions show that the Gini inequality index for the entire population increases when the evasion is higher but does not depend significantly on the spread of the evasion.
Another paper [39] discusses a dynamic stochastic model that represents the time evolution of the population’s income distribution, where the dynamics are the result of many economic exchanges occurring in the presence of multiplicative noise. The application of the model goes beyond the usual scope of the Langevin-type kinetic equation. This model can be used to evaluate income inequality (Gini index) in relation to other dynamic parameters: mobility and total income.
Conclusion. Studies of the impact of taxation on economic inequality are of high relevance. They mostly use modeling methods: mixed modeling, building a kinetic model, forming a dynamic stochastic model. Not only are individual taxes considered as factors influencing economic inequality but also behavioral aspects, such as tax evasion.
2.3. State/Tax Reform/Policy and Inequality
Many researchers evaluate the impact of individual state tax reforms on inequality. The influence of the tax reform in the Philippines (by regions) on poverty is analyzed in the work by Dizon R. [40]. The author used the Computable General Equilibrium-Top Down Behavioral Microsimulation. The Gini Coefficient and SST Gini Coefficient Index are used in the study to measure the distributional effect of the tax reform. The results show that the tax reform led to a significant reduction in the number of poor people in the Philippines. Martner G.D. came to an opposite conclusion: household inequality (Gini index) reduced in Chile in the period from 1990 to 2015 due to a gap in market income rather than an increase in the redistributive power of the tax and transfer systems [41]
Another study [42] compares the trend in income-related inequalities in avoidable, amenable and preventable mortality with the trend in income-related inequality measured using the Gini index. There is little or no association between the variations in the Gini index due to tax reforms and socioeconomic disparities in preventable mortality. The study was conducted on the example of Norway between 1994 and 2011.
Ref. [43] by Reinbold G.W. assesses the impact of tax and transfer policy on income inequality in the United States in 2012. There are two effective variants of state policy that diminish inequality: expanding the tax incentive on earned income and reducing tax deductions for taxpayers with high incomes. The Gini index is used in the analysis.
Another publication [44] focuses on the impact of fiscal policy on inequality. It studies 27 economies with the market emerging in 1980–2014 and applies both static panel methods and dynamic impulse response function analysis using local projection methods to identify the direct impact of adjustments on inequality. The authors prove that fiscal consolidation leads to growing income inequality and a decreasing redistributive role of fiscal policy. A study [45] by Tibulca I.L. analyzes the Eurozone member states from 1995 to 2013. The purpose of this analysis is to establish whether convergence of fiscal policy to the Maastricht criteria leads to tax convergence. The research methodology involves sigma convergence based on three indicators (variation coefficient, Gini coefficient and Theil index). The total tax burden indicator is used for determining the state of national tax systems.
A study [46] by Brazilian scientists Cury S. et al. is of interest. Using an integrated approach, they proved the weak impact of the two state programs on reducing inequality in the country (2003–2005). The Gini index was used as an indicator. Among other things, the authors assessed the impact of the tax structure on the funding of government programs and, hence, on the reduction of economic inequality.
A number of publications assess the impact of changes in the procedure for calculating specific taxes on income inequality.
In their research, Kim K. & Kim E. focus on the effects of the changes in the tax system on mitigating inequality between regions in Korea [47]. They propose a policy of reducing tax rates on products and increasing land tax rates. Fifteen scenarios are modelled, and the effects are analyzed, including in terms of inequality (the Gini coefficient to the GRP per capita) [48], applying the procedures of statistical analysis depending on the changes in the Lorentz and Gini indices on the progressiveness of taxation. The analysis uses the example of income for Sweden, Great Britain and the USA before and after the tax reform. It is proven that the assessment of changes in each country depends on the chosen index. The study by Gencev M. et al. presents a mathematical model of the Gini coefficient [49] with its approbation carried out through analysis of the redistribution function of the Czech Republic’s tax system. In particular, it is claimed that the reform of income tax in 2008 did not significantly affect its progressive nature, and, therefore, did not reduce inequality. A somewhat opposite result was obtained by Stanovnik T. & Verbic M. in their study [50]. They analyzed the inequality in the distribution of salaries in Slovenia for the period 1991–2009 given the changes in the income tax law. According to the Gini coefficient, the growth in income inequality slowed in this period, while the income inequality after tax (that is, salary minus social contributions and personal income tax) remained fairly stable due to the increasing progressiveness of personal income tax.
Conclusion. Tax reforms in general and in terms of individual taxes (income tax, land tax, product tax) can influence income inequality. However, the sphere and scale of the influence vary from country to country and depend on the nature of reforms and the types of taxes that are reformed. Most studies draw the conclusion that the influence is moderate.
2.4. Redistributive Function of Taxes and Inequality
In this part of the review, the following groups of works are worth highlighting.
First, there are studies that consider the redistributive effect of taxation as a whole. Thus, a paper [51] by Osberg L. says that, when inequality in society is evaluated, not only the Gini index has to be taken into account but also some important trends in market income and any significant changes in the redistributive effect of the tax and transfer systems. Another study [52] assesses the achievable redistributive effect of tax policy. The author determines the extreme values of the transformed Lorentz curves and the ranges of the transformed Gini and welfare indices. A paper [53] by Gradin C. looks at the impact of certain socio-economic factors on income inequality in Spain, including the redistributive effect of taxes. The cross-country gap in inequality is broken down into characteristics and coefficient effects using a regression of the re-centering function applied to the Gini index. Scientists Duclos J.-Y. et al. propose a tool for assessing inequality, which includes two approaches developed by the scientific community: classical HI and reranking [54], based on the measure of inequality, which combines the Gini coefficient and Atkinson indices and allows us to break down the total redistributive effect of taxes and transfers into the effect of vertical equity and the loss of redistribution due to classical HI and reranking.
Second, there are studies of the redistributive effects of individual taxes. For example, Yilmaz H.H. [55] analyzes the impact of taxes on the consumption of Turkish households. As a result of the analysis based on the indicators of gross and net consumption shares, the Gini coefficient, decile ratios and the Kakwani index, it is proven that their influence is insignificant. By comparing total consumer spending, expenditure tax and household disposable income, the author shows that the consumption taxes widen the gap between the rich and the poor. Stephenson A.V. studies the impact of the type of income taxation on income inequality in five countries of the European Union: Belgium, Bulgaria, Germany, Lithuania and Poland [56]. The Gini index was used, among other things, for measuring the progressivity of taxation. As a result, the author claims that the income tax structure with a differentiated rate in Germany and Belgium seems to be the most effective for reducing inequality. A research study [57] conducted by Farzanegan M.R. & Habibpour M.M. on the example of Iran is based on the method of surveys. The findings of the study show that the resource dividend policy with further direct income tax contributes to a significant reduction in the household Gini index.
Conclusion. The effect of taxes on inequality is measured by assessing the redistributive effect, including the change in the Gini index before and after any changes in taxation. Most often, it is the gross redistributive effect of taxation that is estimated, or the particular effect of a progressive income tax.
The literature review allows us to verify the following statements: (1) the Gini index should be considered as the resulting indicator when models are built for evaluating the impact of various factors on income inequality; (2) taxation is one of the important factors influencing economic inequality within a country; (3) a significant impact on inequality is produced by the types of taxation associated with a large-scale redistributive effect on the welfare of individuals, primarily individual income taxation.
However, despite all the variety of studies, analyzing the impact of taxation on income inequality is still relevant. The literature review does not provide any unambiguous evidence for the widespread theoretical statement that there is an inverse relationship between the level of income inequality and the level of taxation. The studies reviewing a wide sample of countries, as a rule, concern taxation indirectly as one of the numerous factors analyzed in the context of public policy. The impact of taxation on income inequality is most often evaluated according to data from one country. Such studies prove that the impact on income inequality is heterogeneous in different countries in terms of its scale and scope. The comparability of their findings is limited because the researchers use different methods of analysis. That is why patterns have to be searched for in the context of homogeneous groups of countries and using a single methodological approach to the analysis of their macroeconomic and institutional characteristics. The matters of the impact produced on the inequality by the incomes of the population and certain categories of taxes (not only income taxes) are still not investigated deep enough. Thus, given the numerous proposals to increase property taxes, which include taxes on property, estate, gift, net worth of wealth, etc., it is of great interest to assess how they influence economic inequality. An important fiscal tool for mitigating inequality, eliminating poverty and ensuring equality of opportunity is targeted social fees directed towards social transfers, whose impact on economic inequality has to be researched further as well.
Thus, the following research hypothesis can be put forward: direct taxation (individual income taxes, property taxes and social contributions) has a significant impact on economic inequality, the scale and direction of which depends on the economic development and architecture of the country’s tax system.
3. Materials and Methods
This study is based on the data from 28 European Union countries, including the United Kingdom, whose tax systems are not identical but harmonized in accordance with the unified EU Directives as well as the legislation in other sectors of the economy, which suggests the presence of similar institutional characteristics.
The countries of the European Union differ by their economic development, the scale of the economy, inequality between countries and within countries (Figure 1).
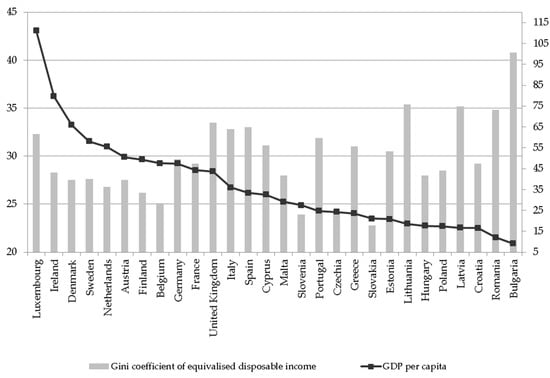
Figure 1.
Performance of European Union countries by GDP per capita and Gini coefficient in 2019.
In order to identify groups of countries comparable by the chosen parameters, they were clustered according to the real GDP per capita (constant 2010 US$) and the Gini coefficient of equivalized disposable income. The real GDP per capita can be used to assess the economic development, the scale of the economy and the inequality between the European Union countries; the Gini coefficient of equivalized disposable income is used for measuring the income inequality within the country. For clustering, we used data for 2019. They were collected from the World Bank (World Development Indicators) databases for the GDP per capita and the Eurostat (European Union Statistics on Income and Living Conditions (EU-SILC)) for the Gini coefficient.
The cluster analysis was carried out in SPSS Statistics, a computer program for statistical data processing. We used a method of two-stage cluster analysis, which is designed to identify the natural break-down of the dataset into groups. Log-likelihood was used as a distance measure. The conditions of its application were tested. The normality of the parameters was tested using the one-sample Kolmogorov–Smirnov test. Both parameters had a normal (Gaussian) distribution. In general, the test showed the possibility of using log-likelihood as a distance measure.
The analysis relied on both automatic determination of the number of clusters using the Bayes information clustering criterion and their exact determination within the range of 2 to 5. The best quality of the solution was obtained for 3 clusters. In this case, the silhouette measure of connectivity and separation of clusters was 0.6 (Figure 2).
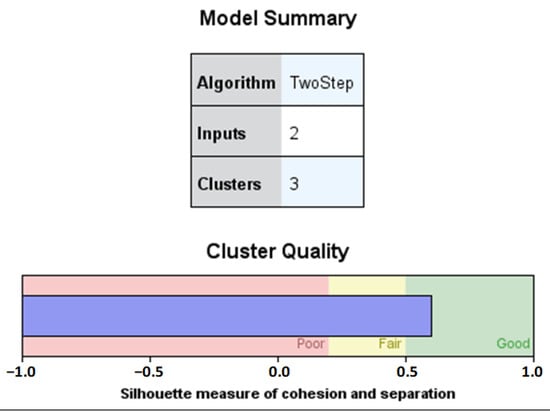
Figure 2.
Results of cluster analysis.
The correlation–regression analysis of the impact that taxation has on income inequality is based on data embracing 15 years, from 2005 to 2019. The information for year 2020 was not used due to the impact of the COVID-19 pandemic on both economic inequality and the effectiveness of taxation.
The starting point of the study was an attempt to build a regression model between the Gini index and gross tax rates for all European Union countries:
- –
- Total tax revenue as % of the GDP characterizes the impact of all taxes;
- –
- Taxes on income, profits and capital gains as % of the GDP characterize the impact of income taxes on organizations and populations.
However, the model based on the panel data did not turn out to be significant, which may be due to the generalization of the countries with very different levels of economic development, inequality and taxation rates, so it was decided to expand the list of variables and carry out an analysis in the context of clusters.
From the theoretical standpoint, the most effective redistributive tools are the taxation of income and property of the population as well as social insurance contributions, which have a mandatory fiscal nature. Thus, the indicators presented in Table 1 were used as factors. Given the direct impact of the individual income tax on the income of the population, two indicators were used to measure it, both of them reflecting the contribution to the GDP (X1) and to the country’s budget (X2). In order to calculate X3, we used the gross indicator of social contributions paid by both employers and employees. In order to calculate X4, gross property taxes were used (both from individuals and legal entities) due to the fact that any business is the property of individuals or groups of individuals and is a way to receive additional income.

Table 1.
Variables.
The correlation–regression analysis was carried out using the SPSS Statistics toolkit. Linear regression models were built, with the variables selected in a step-by-step method.
4. Results
4.1. The Results of European Union Countries’ Clustering
According to the findings of the study at this stage, European Union countries are divided into three clusters (Table 2). Table 3 presents the average characteristics of clusters.
Table 2.
Results of European Union countries’ clustering.
Table 3.
Average values of indicators for clusters of European Union countries.
Thus, the first cluster includes the European Union countries with the highest level of inequality (the average value of the Gini index is 32.59%), the second cluster includes the European Union countries with the average level of inequality (the average value of the Gini index is 27.58%) and the third cluster of the European Union countries with the lowest level of inequality (the average value of the Gini index is 24.46%). Obviously, the countries in the third cluster have the most homogeneous characteristics, with a minimum standard deviation of one to two points for all the analyzed indicators. The countries in the second cluster do not differ that much in inequality (the standard deviation of the Gini index is 1.89) but have significant differences in tax indicators. These countries have the maximum standard deviation in terms of X2 (9.50), which characterizes the role of individual income tax in the budget system. This is the result of the presence of the Scandinavian countries in the cluster, which have the highest personal income tax burden in Europe. The first cluster mostly includes countries of Eastern and Southern Europe. They also have the most heterogeneous X2 indicator (the standard deviation is 5.20), which is because they belong in the group of countries with a flat tax rate.
It should be noted that the countries of the third cluster are comparable in terms of economic development with the countries of the first cluster (the average value of the real GDP per capita is EUR 15,914.3) but demonstrate the lowest level of inequality, with social insurance contributions (X3) having the maximum value among all the analyzed tax factors. Besides, the average values of the indicators of individual income taxes and property taxes are minimal in these countries among all the European Union countries. This allows us to suggest as early as at this stage of the study that the low level of inequality in these countries could be precisely because of social insurance contributions.
The clustering also demonstrates some dependence between the level of economic development of the countries, inequality and tax burden. The countries with the highest level of economic development (central and northern Europe) are in the second cluster (the average value of the real GDP per capita is EUR 42,183.3). In these countries, the variables for individual income taxes and property taxes have the highest average values. The countries of the first cluster are significantly inferior to them, both in terms of the real GDP per capita (average value of EUR 15,820.9) and in terms of the average values of X1, X2 and X4 indicators. Thus, it can be assumed that, in countries with a high level of economic development and a high tax burden, inequality is not as substantial as in developing countries. The exceptions in the analysis are the United Kingdom and Luxembourg, which are rich countries, but with the Gini index being higher than in other countries similar in terms of their GDP per capita (33.5 and 32.3, respectively). However, since Luxembourg has a very high value of GDP per capita (EUR 83,640) (for example, the next largest value is only EUR 49,720 in Denmark), it still goes into the second cluster. The United Kingdom, having the greatest value of the Gini index among the highly developed European countries, falls into the first cluster.
In order to reinforce the identified dependence, we calculated the dynamics indicators (absolute deviation and growth rate for 2005 to 2019) and the correlation coefficients between the Gini coefficient and real GDP per capita (Table 4).
Table 4.
Description of clusters.
As for GDP growth per capita, the leading countries are: Romania (77.9%), Lithuania (76.0%), Poland (73.4%), Slovakia (59.2%), Latvia (52.9%), Ireland (52.4%), Malta (51.6%). In the period 2005–2019, the welfare decreased only for the citizens of two European Union countries: Greece (−14.4%) and Italy (−3.3%).
The Gini index fell in 14 and rose in 14 European Union countries. The following countries are the leaders in terms of the increasing Gini index: Bulgaria (+9.6), Luxembourg (+5.8), Sweden (+4.2), Germany and Denmark (+3.6). The Gini index decreased the most in the following countries: Poland (−7.1), Portugal (−6.2), Estonia, Ireland (−3.6), Romania (−3.5), Slovakia (−3.4), Belgium (−2.9).
In 12 European Union countries, there is a direct positive relationship between the Gini index and the GDP per capita: it is strong in Bulgaria (+0.946), Sweden (+0.738); significant in Malta (+0.674), Germany (+0.622), Finland (+0.531); moderate in Luxembourg (+0.421), Netherlands (+0.403), Austria (+0.389). Along with the growth in public welfare, the Gini index increased too in these countries. A weak positive relationship between the analyzed indicators was observed in Lithuania (+0.295), Hungary (+0.29), Denmark (+0.276), United Kingdom (+0.122).
In 16 European Union countries, growing public welfare was associated with a reducing Gini index. A strong negative relationship was identified in Poland (−0.942), Czech Republic (−0.839), Croatia (−0.809), Cyprus (−0.806), Slovakia (−0.767), Belgium (−0.759); a significant one in Latvia (−0.503) and Ireland (0.51); a moderate one in Spain (−0.484), Portugal (−0.465), Italy (−0.378); a weak one in Estonia (−0.239), Romania (−0.134).
Thus, the first cluster included countries with the lowest welfare per capita and the highest income inequality (Gini index ranging from 28 to 40.8). Among them prevail the countries with a negative relationship between welfare growth and income differentiation (10 countries out of 15). The second cluster comprises the developed countries of central and northern Europe, where, at the maximum welfare per capita, the values of the Gini index are relatively lower (ranging from 25.1 to 32.3). However, during the analyzed period, the growing welfare in most of these countries was associated with increasing income inequality (in seven countries out of ten). The countries of the third cluster had welfare per capita comparable to that of the countries in the first cluster, so it was possible to achieve a decrease, and, by 2019, the value of the Gini index was minimal among all the European Union countries.
4.2. The Results of the Analyzed Impact of Taxation on Income Inequality
Based on the results of this stage of the study, linear regression equations are built for European Union countries that characterize the impact of taxation on income inequality (Table 4).
According to the data for five European Union countries, it was not possible to establish a qualitative econometric dependence between the analyzed tax factors and the Gini index. This was not only the case for some countries in the first cluster that use a flat taxation scale (Hungary, Romania, Lithuania) with a low GDP per capita but also for the countries in the second cluster with a progressive system of taxation of individual incomes (France and Austria) and with an average GDP per capita. Besides, in many European Union countries (12 countries or 43%), the expected inverse dependence between the Gini index and tax factors (X1, X2, X4) was not confirmed over the analyzed period. In the analyzed period, income inequality was rising in these countries despite the growing role of taxes on individual income and property in the GDP and in the budget system.
Despite the high values of the Gini index, the countries of the former socialist camp still apply a flat taxation scale (Bulgaria, Hungary, Estonia, Romania, Czech Republic) or have switched to a progressive taxation scale of individual incomes only recently (Lithuania since 2019, Latvia since 2018). In most of them, personal income tax indicators are not significant or contribute to increasing income differentiation (Bulgaria). Latvia is an exception, with both personal income tax and property taxes having a negative impact on the Gini index. In addition, property taxes make the Gini index go down in Croatia.
In five countries (Bulgaria, Greece, Czech Republic, United Kingdom, Luxembourg), a direct relationship was found between X1 and the Gini index, and in three countries (Germany, Denmark and Spain) between X2 and the Gini index. It may be suggested that the growing role of the individual income tax in the economy or in the budget system of these countries in the analyzed period was not a factor that could resist the increasing income differentiation and, on the contrary, was associated with the growing inequality.
The redistributive role of the individual income tax is evident only in two countries of the first cluster (Cyprus, Italy), where an inverse dependence between X2 and the Gini index is observed, as well as in two countries of the third cluster (Slovakia, Slovenia), with an inverse dependence between X1 and the Gini index.
A relationship was found between the Gini index and property taxes—X4 in eight European Union countries. In three of them (Croatia, Latvia, Belgium), property taxes made income inequality decrease in the analyzed period but did not in the remaining five countries (Poland, Estonia, Italy, Netherlands, Ireland). Direct dependence was identified between the Gini index and property taxes.
In the analyzed period, the most important factor for the reduction in income inequality was the X3 factor—social insurance contributions, which, in fact, are not a tax but insurance fees. In nine countries, an inverse dependence was found between the Gini index and X3, with seven countries having a relatively low level of welfare per capita and two countries of northern Europe (Finland, Sweden), known for their socially oriented market economy. An exception was the United Kingdom, where there was a direct relationship between the Gini index and social security contributions. In the countries of the third cluster with the highest share of social contributions in the GDP, their negative impact on the Gini index was confirmed only in one country (Czech Republic).
Thus, the range of European Union countries in which personal income taxes and/or property taxes clearly contributed to the reduction of inequality in the analyzed period is extremely narrow: Latvia (−X1, −X4), Croatia (−X4), Cyprus (−X2), Italy (−X2), Belgium (−X4), Slovakia (−X1) and Slovenia (−X1), which is 25% of their total number. It is logical to assume that, in the European Union countries of the former socialist camp, the tax factors are insignificant because the scale of taxation is flat and property taxes are low. However, in most countries of the second cluster with a progressive system of income taxation and maximum aggregate rates of individual income tax, there was either no dependence at all between tax factors (X1, X2 and X4) and the Gini index (France, Austria, Finland, Sweden) or it was directly proportional (Germany, Netherlands, Denmark, Ireland, Luxembourg). The most significant and constructive was the negative impact of social insurance contributions on the Gini index, which was observed in nine European Union countries (32% of their total number).
In all the European Union countries where an inverse relationship between the Gini index and tax factors (X1, X2, X4) was observed, there was a strong or significant negative relationship between GDP per capita and the Gini index. This allows us to conclude that taxes contributed to reduced income differentiation against the backdrop of rising welfare, with the exception of Italy, where GDP per capita fell.
The inverse dependence between the Gini index and social insurance contributions (X3) in some countries (Finland, Sweden, Malta) could not outweigh the positive relationship between the level of GDP per capita and the Gini index or prevent the growth of income differentiation within the country.
5. Discussion
In general, the study confirms the conclusion made by A. Banerjee and E. Duflo: taxes are important for redistribution, but growing inequality is a much deeper phenomenon than the mechanical consequence of decreased redistribution [23].
The tendency for the spread of progressive taxation of income and property will intensify in the short term. In 2021, only five European Union countries, Bulgaria, Romania, Hungary, Estonia and the Czech Republic, levy personal income tax on a flat scale, competing for taxpayers in this way. Our clustering shows that the level of income inequality in these countries is somewhat higher than in those European Union countries that are leaders in economic development with high progressive rates of personal income tax.
The absence of dependence or direct dependence between tax factors and the Gini index certainly does not mean that tax increases contributed to the growing income inequality within the European Union or will do that in the future. More likely, it is the evidence of the complexity and multifaceted nature of the problem of increasing income inequality. It is obvious that the taxation of individual incomes and property can no longer cope with growing inequality, which has the scale of a global problem rather than being a local differentiation of public incomes. Nowadays, a simple increase in the tax burden imposed on high-income strata of the population contributes to the withdrawal of a larger share of income from them in comparison with the poorer strata. However, in the face of new challenges (development of the digital economy, Industry 4.0, the rental society, the growing gap between the financial and real sectors of the economy, etc.), the rate of differentiation and concentration of income is growing at a faster pace, their sources are changing and the “chase” for rental income is becoming more intense.
Thus, according to T. Piketty [22], the recapitalization of property accumulated in the past is faster than the growth of production and wages. Entrepreneurs inevitably become rentiers and increase their dominance over those whose only asset is their own labor. Accumulated capital reproduces itself faster than production grows. The introduction of a world progressive tax on capital, proposed by T. Piketty, is mostly aimed at reducing the gap in the accumulated property.
In addition, we believe the taxation of the sources of capital has to be reformed. First of all, we refer to increasing the tax burden on the owners of information and digital capital who receive digital rent and, second, on the exploitation of natural capital, which makes it possible to receive rental income in the form of currency and price disparity as resources are supplied to world markets and eco-services are free; third, on capital appreciation and speculative income in financial markets.
Thus, the introduction of a number of new taxes and fees (contribution on non-recycled plastic, border carbon adjustment mechanism, digital levy, financial transaction tax [58]) as part of the reform of the revenues of the EU general budget in the multiannual financial framework for 2021 to 2027 seems to be quite constructive, although it is not a new solution, which stimulates many discussions among politicians and scientists. Their indirect impact on income inequality will depend on the rationality of the designs and the ability of European Union countries to eliminate the practice of tax evasion. In the future, the experience of the European Union may become a trigger for similar tax reforms in other countries with a tax system model comparable to the European one. Thus, in the adoption of the procedure for taxation, the impact of new taxes and fees on international relations with partner countries must be considered so that provisions that infringe on the interests of other countries could be excluded.
6. Conclusions
This research study fully confirms the original hypothesis. Direct taxation (personal income taxes, property taxes and social contributions) significantly influences economic inequality, whose scale and scope depend on the level of economic development and the particular architecture of the country’s tax system. In different European Union countries, even comparable in terms of macroeconomic and institutional characteristics, taxes affect income inequality in different ways. It cannot be stated positively that growing direct taxes result in less income inequality, just like the opposite, judging by the statistics and the identified interrelations between indicators. Only in seven European Union countries, a significant negative impact of individual income taxes and/or property taxes on income inequality was revealed within the analyzed period.
The study established a number of patterns that are significant for characterizing the dependence of income inequality on direct taxation.
First, it was proven that there is an inverse dependence between the level of economic development of the country and income inequality. At the same time, in most of the less developed European Union countries (clusters 1 and 3), growing welfare is associated with a reduction in income differentiation. In most of the developed countries of the second cluster, on the contrary, the growing welfare within the analyzed period was associated with an increasing income inequality. That is, there are tendencies of convergence of the European Union countries in terms of the analyzed indicators.
Second, in the tax systems of the developed European Union countries with average values of the Gini index (second cluster), individual income tax has a significant weight in the budget revenues and in the GDP. These countries have exhausted their potential for increasing pressure on individual income so as to reduce inequality. However, less developed countries still have the opportunity to reform individual income taxation on the way to equality.
Third, a distinctive feature of the tax systems in the European Union countries with the lowest income inequality (third cluster) is the high share of social insurance contributions in GDP. Their impact on the Gini index between 2005 and 2019 was most significant, and they contributed to reducing income inequality in nine European Union countries. It is obvious that the role of social contributions in the fight against income inequality is underrated. As a rule, developed countries seek to reduce the tax wedge on labor precisely by diminishing social contributions.
Fourth, between 2005 and 2019, property taxes did not influence income inequality in any significant way. Among the countries in the second cluster that have the highest property taxes, the inverse dependence with the Gini index is observed only in Belgium. The extremely low role of property taxes in the countries of the first and third clusters is primarily due to the low level of public welfare. In the future, growing tax bases in these countries will be associated with increasing property taxes to be paid.
Based on the findings of the research, it is possible to recommend the main directions for improving the tax policy of the European Union countries as a tool for reducing income inequality. Cluster 1 and 3 countries should focus on increasing individual income tax, making the transition from a flat to a progressive scale of taxation. In cluster 2 countries, where the burden on individual income tax and property taxes is already high, the insurance premiums system should be enhanced.
The COVID-19 pandemic made all countries realize the importance of the state’s participation in providing citizens with high-quality health, education and social security services to preserve the vital potential of the population and create conditions for human development. In this regard, among the studied fiscal instruments, insurance premiums should be considered as an accelerator of sustainable development. Their configuration should include incentives to increase investment in human development. This will be a fiscal contribution towards reducing inequality of opportunity.
Future research directions are driven by a number of limitations that we have encountered.
First, it seems interesting to model the dependence between the Gini index and tax factors based on panel data for groups of European Union countries that are comparable in terms of their macroeconomic and institutional characteristics. However, limitations for comparative studies in the field of taxation based on panel data are created by the opacity and organizational complexity of the tax systems in a number of European Union countries. This requires additional studies of the tax systems of each country within the selected clusters for compliance with the criteria of social justice.
Second, the econometric analysis of panel data is not informative enough to develop specific proposals for tax policy. In the future, it is necessary to investigate the specifics of the architecture of these taxes in the countries of each cluster as well as the best practices in taxation in European Union countries where an inverse relationship between the Gini index and tax factors in the context of the background of welfare growth is revealed. This will make it possible to specify recommendations, bringing them to the level of decisions on policy.
Third, the limited scope of the study did not allow us to consider the full variety of tax factors affecting income inequality. In the future, it is necessary to additionally include an analysis of the total taxes on income, profits and capital gains of corporations as a percentage of the GDP. Given the effects of shifting all taxes ultimately onto individuals, the burden of taxing corporate income can also influence inequality within countries.
Fourth, in this paper, we have limited our study to questions of the impact of taxes on income inequality. Our future research will focus on the regulatory potential of taxes in relation to wealth disparity and inequality of opportunity. The analysis of property taxes turned out to be the least informative. Their impact on income inequality is not obvious. However, these tax payments are the least harmful for economic growth. Therefore, in the future, a separate study should be devoted to their impact on wealth disparity. Social insurance contributions will be explored as a factor in reducing inequality of opportunity.
In today’s world, the global problem of increasing inequality within and between countries could be resolved and sustainable economic development could be achieved only if the entire world community made joint efforts and worked towards improvement and harmonization of the existing tax systems. An indispensable condition for this is the improvement and harmonization of tax systems. Tax reforms should be focused not only on collecting excess income but also on mitigating the burden on socially vulnerable populations (as determined by demographic and family characteristics) and on stimulating socially responsible behavior of businesses and the population to increase spending on education and social security in order to mitigate not only inequality of income and wealth but also inequality of opportunity.
Author Contributions
Conceptualization, L.K., N.P. and A.Z.; Data curation, S.D.; Methodology, L.K., N.P. and A.Z.; Project administration, A.Z.; Visualization, N.V.; Writing—review & editing, N.V. All authors have read and agreed to the published version of the manuscript.
Funding
The research is partially funded by the Ministry of Science and Higher Education of the Russian Federation under the strategic academic leadership program ‘Priority 2030’ (Agreement 075-15-2021-1333 dated 30 September 2021).
Institutional Review Board Statement
Not applicable.
Informed Consent Statement
Informed consent was obtained from all subjects involved in the study.
Data Availability Statement
Not applicable.
Conflicts of Interest
The author declares no conflict of interest.
References
- Chernogorsky, S.A.; Shvetsov, K.V. A Model of Economic Growth, Including Taxation and Public Sector. In Proceedings of the 31st International Business Information Management Association Conference, IBIMA 2018: Innovation Management and Education Excellence through Vision 2020, Milan, Italy, 25–26 April 2018; pp. 988–995. [Google Scholar]
- Shvecov, A.; Dianov, S.; Zaripova, D.A. Agent architecture implementation in models of socio-ecological-economic systems. In Proceedings of the DEFIN2020: III International Scientific and Practical Conference, Saint Petersburg, Russia, 19–20 March 2020. [Google Scholar]
- Qin, Y.; Xi, B.; Sun, X.; Zhang, H.; Xue, C.; Wu, B. Methane Emission Reduction and Biological Characteristics of Landfill Cover Soil Amended with Hydrophobic Biochar. Front. Bioeng. Biotechnol. 2022, 10, 905466. [Google Scholar] [CrossRef] [PubMed]
- Kozlov, A.; Gutman, S.; Rytova, E.; Zaychenko, I. Human and Economic Factors of Long-Distance Commuting Technology: Analysis of Arctic Practices. In Advances in Social & Occupational Ergonomics. Advances in Intelligent Systems and Computing; Goossens, R., Ed.; Springer: Cham, Switzerland, 2017; Volume 487. [Google Scholar]
- Lei, X.-T.; Xu, Q.-Y.; Jin, C.-Z. Nature of property right and the motives for holding cash: Empirical evidence from Chinese listed companies. Manag. Decis. Econ. 2022, 43, 1482–1500. [Google Scholar] [CrossRef]
- Nadezhina, O.; Avduevskaia, E. Genesis of Human Capital Theory in the Context of Digitalization. In Proceedings of the European Conference on Knowledge Management, ECKM 2021, Coventry University, Coventry, UK, 2–3 September 2021; pp. 577–584. [Google Scholar] [CrossRef]
- Azarenko, N.; Kazakov, O.; Kulagina, N.; Rodionov, D. The model of human capital development with innovative characteristics in digital economy. IOP Conf. Ser. Mater. Sci. Eng. 2020, 940. [Google Scholar] [CrossRef]
- Rodionov, D.G.; Kudryavtseva, T.J.; Skhvediani, A.E. Human Development and Income Inequality as Factors of Regional Economic Growth. Eur. Res. Stud. J. 2018, 21, 323–337. [Google Scholar]
- Rodionov, D.; Zaytsev, A.; Konnikov, E.; Dmitriev, N.; Dubolazova, Y. Modeling changes in the enterprise information capital in the digital economy. J. Open Innov. Technol. Mark. Complex. 2021, 7, 166. [Google Scholar] [CrossRef]
- Volodin, A.; Ivanov, M.; Djanelidze, M.; Sokolitsyn, A. An analytical model of economic inequality in the Russian regions and its correlation with the global trend in the digital economy. In Proceedings of the SPBPU IDE’19: International Scientific Conference on Innovations in Digital Economy 2019, Saint Petersburg, Russia, 24–25 October 2019. [Google Scholar] [CrossRef]
- Victorova, N.; Rytova, E.; Koroleva, L.; Pokrovskaia, N. Determinants of Tax Capacity for a Territory (The Case of the Russian Federal Districts). Int. J. Technol. 2020, 11, 1255. [Google Scholar] [CrossRef]
- Belov, A. Economic Policy of Japan in the Time of Pandemic. World Econ. Int. Relat. 2021, 65, 33–41. [Google Scholar] [CrossRef]
- Nesterov, I.O. Accommodative Monetary Policy, Fiscal Stimulus and Foreign Exchange Reserves within the Framework of Russian National Economic Interests: Long-Standing Problems and New Challenges. Vestn. St.-Peterbg. Univ. Ekon. 2021, 37, 371–394. [Google Scholar] [CrossRef]
- International Monetary Fund. World Economic Outlook: A Long and Difficult Ascent; International Monetary Fund: Washington, DC, USA, 2020. [Google Scholar]
- Wu, B.; Wang, Q.; Fang, C.-H.; Tsai, F.-S.; Xia, Y. Capital flight for family? Exploring the moderating effects of social connections on capital outflow of family business. J. Int. Financial Mark. Inst. Money 2021, 77, 101491. [Google Scholar] [CrossRef]
- Chernogorskiy, S.; Kuporov, J.; Shvetsov, K. Evaluating Marginal Excess Burden of Taxation in Russia and the USA. In Proceedings of the 30th International Business Information Management Association Conference, IBIMA 2017, Madrid, Spain, 8–9 November 2017; pp. 2752–2757. [Google Scholar]
- Konnikov, E.A.; Konnikova, O.A.; Ivanov, S.A.; Novikova, O.V. Instrumentation of Ensuring the Sustainability of the Tax System. In Proceedings of the 31st International Business Information Management Association Conference, IBIMA 2018, Milan, Italy, 25–26 April 2018; pp. 5218–5225. [Google Scholar]
- Guzikova, L.A.; Neelova, N.V. Agreements of participation in shared construction: Relationship of legal, tax and accounting aspects. IOP Conf. Ser. Mater. Sci. Eng. 2020, 962, 022081. [Google Scholar] [CrossRef]
- Skhvediani, A.E.; Kudryavtseva, T.Y. The Socioeconomic Development of Russia: Some Historical Aspects. Eur. Res. Stud. J. 2018, XXI, 195–207. [Google Scholar] [CrossRef]
- Mill, J.S. Principles of Political Economy: With Some of Their Applications to Social Philosophy; Nathanson, S., Ed.; John W. Parker: Washington, DC, USA, 2004; p. 305. ISBN 978-1-60384-037-8. [Google Scholar]
- Wagner, A. Three Extracts on Public Finance (Nature of the Fiscal Economy)//Classics in The Theory of Public Finance; Musgrave, R.A., Peacock, A.R., Eds.; Macmillan: London, UK, 1958; pp. 1–15. [Google Scholar]
- Piketty, T. Capital in the Twenty-First Century; Harvard University Press: Cambridge, MA, USA, 2017. [Google Scholar]
- Banerjee, A.; Duflo, E. Good Economics for Hard Times; PublicAffairs: New York, NY, USA, 2019. [Google Scholar]
- Le, T.-H.; Nguyen, C.P.; Su, T.D.; Tran-Nam, B. The Kuznets curve for export diversification and income inequality: Evidence from a global sample. Econ. Anal. Policy 2020, 65, 21–39. [Google Scholar] [CrossRef]
- Christou, C.; Gupta, R.; Jawadi, F. Does inequality help in forecasting equity premium in a panel of G7 countries? N. Am. J. Econ. Financ. 2021, 57, 101456. [Google Scholar] [CrossRef]
- Tamasauskiene, Z.; Žičkienė, S. An investigation of the nexus between globalisation dimensions and income inequality. Entrep. Bus. Econ. Rev. 2021, 9, 39–53. [Google Scholar] [CrossRef]
- Yamshchikova, T.N.; Skobliakova, I.V.; Zhuravleva, T.A.; Lukyanchikova, T.L.; Semenova, E.M. Theory and Reality of Social Inequality; Springer: Cham, Switzerland, 2020; Volume 60, pp. 496–506. [Google Scholar]
- Aksentijević, N.K.; Ježić, Z. Education and Reducing Income Inequalities—The Importance of Education in Maritime Studies. Pomorstvo 2019, 33, 191–204. [Google Scholar] [CrossRef]
- Huber, E.; Stephens, J.D. Income inequality and redistribution in post-industrial democracies: Demographic, economic and political determinants 1. Socio-Econ. Rev. 2014, 12, 245–267. [Google Scholar] [CrossRef]
- Chen, T.; Gozgor, G.; Koo, C.K. Pandemics and Income Inequality: What Do the Data Tell for the Globalization Era? Front. Public Health 2021, 9, 674729. [Google Scholar] [CrossRef]
- Lindström, M. A commentary on “The trouble with trust: Time-series analysis of social capital, income inequality, and COVID-19 deaths in 84 countries”. Soc. Sci. Med. 2020, 263, 113386. [Google Scholar] [CrossRef]
- Abu Bakar, S.A.; Pathmanathan, D. Income modeling with the Weibull mixtures. Commun. Stat.-Theory Methods 2020, 51, 3612–3628. [Google Scholar] [CrossRef]
- Menna, L.; Tirelli, P. Optimal inflation to reduce inequality. Rev. Econ. Dyn. 2017, 24, 79–94. [Google Scholar] [CrossRef]
- Ryu, H.K.; Slottje, D.J. Income inequality versus utility inequality. Commun. Stat.-Theory Methods 2017, 46, 3631–3640. [Google Scholar] [CrossRef]
- Bertotti, M.L.; Modanese, G. Micro to macro models for income distribution in the absence and in the presence of tax evasion. Appl. Math. Comput. 2014, 244, 836–846. [Google Scholar] [CrossRef]
- Bertotti, M.L.; Modanese, G. Economic inequality and mobility in kinetic models for social sciences. Eur. Phys. J. Spéc. Top. 2016, 225, 1945–1958. [Google Scholar] [CrossRef]
- Bertotti, M.L.; Modanese, G. Microscopic models for the study of taxpayer audit effects. Int. J. Mod. Phys. C 2016, 27, 1650100. [Google Scholar] [CrossRef]
- Bertotti, M.L.; Modanese, G. Mathematical models describing the effects of different tax evasion behaviors. J. Econ. Interact. Coord. 2018, 13, 351–363. [Google Scholar] [CrossRef]
- Bertotti, M.L.; Chattopadhyay, A.K.; Modanese, G. Stochastic models with multiplicative noise for economic inequality and mobility. Int. J. Nonlinear Sci. Numer. Simul. 2021, 22, 287–301. [Google Scholar] [CrossRef]
- Dizon, R.L. Tax Incidence of Philippine Tax Reform: Poverty and Distributional Effect. J. Asian Financ. Econ. Bus. 2021, 8, 281–288. [Google Scholar] [CrossRef]
- Martner, G.D. Desigualdades Globales y Políticas de Atenuación de La Desigualdad de Ingresos: El Caso de Chile, 1990–2015 [Global Inequalities and Policies for Income Inequality Reduction: The Case of Chile, 1990–2015]. Reforma Democr. 2018, 2018, 61–84. [Google Scholar]
- Kinge, J.M.; Vallejo-Torres, L.; Morris, S. Income related inequalities in avoidable mortality in Norway: A population-based study using data from 1994–2011. Health Policy 2015, 119, 889–898. [Google Scholar] [CrossRef]
- Reinbold, G.W. Comparing the Effect of U.S. Tax and Transfer Programs on Relative and Absolute Income Inequality: Research and Policy Implications. J. Policy Pract. 2016, 15, 243–268. [Google Scholar] [CrossRef]
- Jalles, J.T. How do fiscal adjustments change the income distribution in emerging market economies? Int. J. Emerg. Mark. 2017, 12, 310–334. [Google Scholar] [CrossRef]
- Țibulcă, I.L. Does Fiscal Convergence Lead to tax Convergence? Evidence from the Eurozone. Ann. Alexandru Ioan Cuza Univ.-Econ. 2015, 62, 1–9. [Google Scholar] [CrossRef][Green Version]
- Cury, S.; Pedrozo, E.; Coelho, A.M. Cash Transfer Policies, Taxation and the Fall in Inequality in Brazil an Integrated Microsimulation-CGE Analysis. Int. J. Microsimulation 2016, 9, 55–85. [Google Scholar] [CrossRef]
- Kim, K.; Kim, E. The impact of alternative tax systems on regional disparities in Korea. Habitat Int. 2005, 29, 183–195. [Google Scholar] [CrossRef]
- Bishop, J.A.; Formby, J.P.; Zheng, B. Inference Tests for Gini-Based Tax Progressivity Indexes. J. Bus. Econ. Stat. 1998, 16, 322–330. [Google Scholar] [CrossRef]
- Genčev, M.; Musilová, D.; Široký, J. A Mathematical Model of the Gini Coefficient and Evaluation of the Redistribution Function of the Tax System in the Czech Republic. Matematický Model Giniho Koeficientu a Zhodnocení Redistribuční Funkce Daňového Systému České Republiky. Politicka Ekon. 2018, 66, 732–750. [Google Scholar] [CrossRef]
- Stanovnik, T.; Verbič, M. Earnings inequality and tax progressivity in Slovenia, 1991–2009. Acta Oeconomica 2013, 63, 405–421. [Google Scholar] [CrossRef][Green Version]
- Osberg, L. On the Limitations of Some Current Usages of the Gini Index. Rev. Income Wealth 2016, 63, 574–584. [Google Scholar] [CrossRef]
- Fellman, J. Mathematical properties of classes of income redistributive policies. Eur. J. Politi- Econ. 2001, 17, 179–192. [Google Scholar] [CrossRef]
- Gradin, C. Why Is Income Inequality so High in Spain? Emerald Group Publishing Limited: Bingley, UK, 2016; Volume 44. [Google Scholar]
- Duclos, J.-Y.; Jalbert, V.; Araar, A. Classical Horizontal Inequity and Reranking: An Integrating Approach; Emerald Group Publishing Limited: Bingley, UK, 2003; Volume 10, ISBN 9780762310241. [Google Scholar]
- Yilmaz, H.H.; University of Ankara; Ozyer, M.A.; Ozyer, S.I. Redistribution Effects of Taxes on Expenditure: The Case of Turkey (2002–2013). Hacienda Publica Esp. 2019, 230, 11–40. [Google Scholar] [CrossRef]
- Stephenson, A.V. The Impact of Personal Income Tax Structure on Income Inequality for Belgium, Bulgaria, Germany, Lithuania, and Poland: A Comparison of Flat and Graduated Income Tax Structures. Atl. Econ. J. 2018, 46, 405–417. [Google Scholar] [CrossRef]
- Farzanegan, M.R.; Habibpour, M.M. Resource rents distribution, income inequality and poverty in Iran. Energy Econ. 2017, 66, 35–42. [Google Scholar] [CrossRef]
- D’Alfonso, A.; Delivorias, A.; Milotay, N.; Sapała, M. Economic and Budgetary Outlook for the European Union 2021. EPRS (European Parliamentary Research Service) Members’ Research Service. PE 679.062–January 2021. Available online: https://op.europa.eu/en/publication-detail/-/publication/5005dee0-6ce3-11eb-aeb5-01aa75ed71a1 (accessed on 9 April 2022).


Publisher’s Note: MDPI stays neutral with regard to jurisdictional claims in published maps and institutional affiliations. |
© 2022 by the authors. Licensee MDPI, Basel, Switzerland. This article is an open access article distributed under the terms and conditions of the Creative Commons Attribution (CC BY) license (https://creativecommons.org/licenses/by/4.0/).