Abstract
In this study, the effects of photo-electrocatalysis (PEC) were evaluated as an innovative application of conventional photocatalysis (PC) to remediate water in a recirculating system for rainbow trout (Oncorhynchus mykiss) culture, in relation to fish welfare and health, with a multidisciplinary approach. Three tanks were employed, equipped with conventional biological filters as a control system, and three tanks equipped with the PEC purification system. The concentrations of ammonia, nitrite and nitrate ions in water were monitored, and the fish’s oxidative damage and stress response were evaluated in parallel. The water of the PEC-treated experimental group showed lower ammonia (TAN) and nitrite concentrations and higher nitrate concentration, possibly deriving from TAN oxidation through PEC, also leading to gaseous N2. Histological analysis did not reveal any pathological alteration in the gills and liver of both groups. The superoxide dismutase (sod1), glutathione reductase (GR), glutathione peroxidase (GPx1), and Tumor necrosis factor (TNFα) gene expressions were significantly higher in the control group than in the PEC-treated group, while the Heat shock protein 70 (Hsp70) expression did not show any difference in the two groups. These results indicate that the use of PEC filters has a positive effect on water quality, compared to the use of conventional biological filters, inducing a high level of welfare in O. mykiss.
1. Introduction
Nowadays, there is great attention paid to safer and sustainable food production, and animal farming, as the first step in the food chain, can remarkably impact the environment. This critical aspect implies the need for new techniques to lower the level of pollutants generated by animal farming. According to The Food and Agriculture Organization of the United Nations (FAO) data [1], in 2018, the production weight by species in European Union (EU) aquaculture was 1.17 million tonnes, with rainbow trout culture representing the main part of freshwater production. Trout farming has traditionally been practiced in hatcheries, where a continuous flow water system is maintained to provide the required water quality. However, rainbow trout is also farmed in recirculating aquaculture systems (RAS), as this land-based aquaculture practice allows for the use of reduced volumes of water, which must be appropriately filtered for reuse and for maintaining a good quality of the fish environment. Cultured fish usually convert 20 to 40 percent of fed nitrogen into biomass, and much of the rest is converted into ammonia by microorganisms. Ammonia is potentially toxic for aquatic organisms, especially in its unionized ammonia form (NH3), which is an excretory metabolic product associated with fish catabolism of protein (amino acids), primarily excreted across the gill membranes. NH3 effective toxicity threshold depends on several factors, including its chemical form, the pH and temperature of water, the duration of exposure, and the life stage of the exposed fish. Generally, an ammonia concentration above 1.5 mg/L is considered toxic for most fish, while the acceptable level in aquaculture is usually set at 0.025 mg/L [2]. The toxicity of ammonia may be linked to its lipophilic nature, since it can potentially cross the biological membranes and cause the unbalance of electrochemical gradients in the central nervous system, thus leading to hyperventilation, hyper excitability, loss of equilibrium, and, in extreme cases, convulsions, coma, and death [3,4,5]. After oxygen, unionized ammonia represents the main limiting factor in aquaculture production systems [6]. Teleost fish have developed different strategies to face ammonia toxicity by activating both enzymatic (superoxide dismutase (SOD), glutathione reductase (GR), and glutathione peroxidase (GPX)) and non-enzymatic antioxidants responses [7]. In addition, fish reared in polluted water or exposed to environmental stress present high levels of inflammatory cytokines that can be considered as hematological indicators to evaluate and monitor the health status of aquatic animals [8]. Fish also respond to stressors by increasing the synthesis of heat shock proteins—HSPs [9].
Gills are organs involved in respiration, osmoregulation, acid-base balance, and ammonia excretion [10]. Due to their external location and close contact with water, gills are one of the most vulnerable structures of teleost fish, as they are susceptible to being damaged by any irritant material either dissolved or suspended in water [11]. The liver is the organ most associated with the detoxification and biotransformation process and, therefore, it is most affected by contaminants in water [12]. To avoid high levels of pollutants in water, recirculating aquaculture systems (RAS) are equipped with filtering systems able to remove suspended particles through mechanical action and to convert ammonia into nitrogen compounds through a biological unit, and with UV lamps to sanitize water. Ammonia is converted into nitrite (NO2−) and nitrate (NO3−) ions through nitrification by specific bacteria in the biological filtration systems. NO3− is relatively nontoxic for aquatic organisms, but can affect fish growth at extremely high concentration. In aquaculture open and recirculating systems, the conversion of ammonia into nontoxic molecular nitrogen (gaseous N2) could be an effective step for water remediation.
The oxidation properties of semiconductor-based photocatalysis and its potential uses in sterilization, sanitation, and anti-pollution applications in the aqueous phase and in the atmosphere are widely demonstrated in the literature [13,14,15,16]. In particular, titanium dioxide (TiO2) photocatalytic paints can be used to transform Ammonia (NH3) into gaseous nitrogen (N2), nitrous oxide (N2O), or nitric oxide (NO) and water [17]. Although photocatalysis is largely exploited in industrial and environmental applications, only in recent times was a study on the positive effects of the photocatalytic treatment of ammonia-containing water in zebrafish aquaculture performed [18]. The application of an external electrical bias between the photocatalyst deposited as a thin film on a conductive support (acting as photoanode) and a suitable counter electrode (cathode), such as in photo-electro-catalytic (PEC) cells, can boost the conversion of ammonia into molecular nitrogen. Indeed, both fresh- or sea-water contain a significant amount of dissolved chloride; thus, the PEC system can further exploit the UV/electro-chlorine advanced oxidation process to convert ammonia [19,20,21]. In this process, chloride is oxidized by photogenerated holes to chlorine radical (E° Cl•/Cl− = 2.47 V vs. NHE), which are highly reactive and selective species in ammonia oxidation to molecular nitrogen or nitrate.
The goal of this multidisciplinary study, consisting of morphological, molecular and physic-chemical analyses, was to evaluate the effects of PEC in a recirculating water system for trout culture, for a more efficient conversion of ammonia into non-toxic molecular nitrogen (gaseous N2) and a higher level of fish welfare.
2. Materials and Methods
2.1. Animals
All the here-described animal-related procedures were conducted according to Directive 2010/63/EU of the European Parliament and of the Council of 22 September 2010 on the protection of animals used for scientific purposes [22] and the Italian legislation [23].
About one thousand juvenile rainbow trout Onchorynchus mykiss specimens (4 g of body weight B.W) were transported from farm “Fattoria del pesce”, Cassolnovo, PV, Italy, to the Experimental Zootechnical Centre of Lodi (University of Milan). At the arrival, the animals were divided into two tanks (1000 L) for acclimation and fed twice daily at 1,5% body weight, according to EFSA/FAO Guidelines, with “Nutria” pellet feed (Skretting Italia S.p.a.).
2.2. Experimental Set up and Design
Six individual tanks were filled with 50 L of fresh water (Figure 1). Three control tanks were equipped with an external mechanical-biological purification system (EHEIM eXperience 250; Scubla) with a recirculating flow rate set at ca. 120 L/h (hereafter, “control group”). The other three tanks were equipped with the same external mechanical–biological purification system as the control group, but connected in series at the outlet with a stainless-steel continuous tubular reactor (6 cm diameter, 45 cm long, ca. 1 L free volume), able to operate as both a photocatalytic (PC) or photo-electrocatalytic (PEC) system (Nanomaterials S.r.l., Piazza Fusina 2, Milano, Italy), hereafter, “treated groups” (Figure 1). Each tank had its own water flow with individual entry and exit of water.
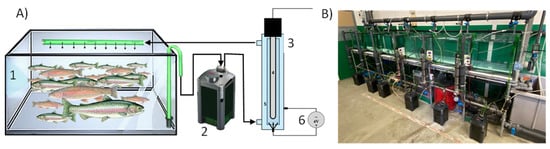
Figure 1.
(A) Scheme of the experimental setup: (1) fish tank, (2) external recirculating pump and mechanical/biological filter, (3) PC-PEC reactor, (4) UV lamp, (5) TiO2 coated mesh, and (6) potentiostat. (B) The six fish tanks used in the experiments.
The P (E)C reactor consists of a central UVA 30 W medium-pressure Hg-vapor lamp surrounded by a Ti mesh coated with a photoactive TiO2 film [24]. The photoactive TiO2 coating was directly grown on the metal Ti mesh by Plasma Electrolytic Oxidation (PEO) at 150 V in a 1.5 M H2SO4 electrolyte solution [25]. The obtained film was comprised of a 45% anatase and 55% rutile mixture, with a sponge-like morphology and ca. 400 nm pore diameter. The system can be switched from PC to PEC by simply applying a 4 V constant potential drop between the TiO2 coated mesh (acting as photoanode) and the reactor body (cathode) by means of a potentiostat (Figure 1A).
The timetable of the experiment is summarized in Table 1. A 30 days waiting period (T0 − T1) was respected before the beginning of the trial with rainbow trout, to reach the biological filter maturation and guarantee a suitable bacterial population aimed at converting ammonia into NO2− and then into NO3−.

Table 1.
Phases of the experimental study.
During this period, a small amount of fish feed was gradually distributed in the empty tanks to simulate the fish waste products. Additionally, nitrifying bacteria (Tetra Filteractive 250 mL) were added as a starter to the biological filter of each tank to enhance the growth of the microbial population.
A total of 375 g of juvenile rainbow trout (around 60 individuals/tank, 16 °C, 10 L/14 D photoperiod), at 7.5 kg/m3 density and fed twice daily (0.7% body weight) was distributed in each tank at T1. The density in tanks and the amount of food were established according to EFSA/FAO Guidelines, which indicate 5 kg/m3 (minimum density) at the juvenile stages and 10 kg/m3 for maximum density.
At T2, the PC system was switched into the PEC system for eight days up to the end of the experiment (T3). Water parameters such as pH, temperature, and pollutants (NH3, NO2−, and NO3−) were daily monitored. Morphological analyses and genes expression were determined in fish of control and treated groups.
2.3. Determination of Water Parameters
Water parameters were monitored in each tank from T0 to T3. Water temperature, percentage of oxygen saturation of water, dissolved oxygen (g/L), and pH were measured by HQ Series Portable Meters (HACH®, Lainate, Milano, Italy). NH3, NO2−, and NO3− concentrations were determined with LCK multiparametric tests (HACH®) employing a Portable Lange DR2800 spectrophotometer (HACH®).
2.4. Fish Sampling
Fish were sampled for histological and gene expression analyses. For each analysis, the following sampling was performed: at T1 (before fish distribution in the six tanks; 3 samples for six tanks, N = 18 in total), T2 (N = 2 for six tanks; N = 12 in total) and T3 (N = 2 for six tanks; N = 12 in total). Fish were euthanized using a lethal dose of Tricaine Pharmaq® 1000 mg/g and (1) liver and gills were recovered and fixed in 10% (v/v) phosphate-buffered formaldehyde (Bio-Optica Milano, Italy) until further analyses; (2) liver and gills were aseptically recovered, stored in RNA later (Qiagen, Hilden, Germany) and immediately frozen at −80 °C until molecular analyses.
2.5. Histology
Fixed samples were dehydrated in a graded 50% (v/v), 70% (v/v), 95% (v/v), and 100% (v/v) ethanol series, embedded in paraffin, and transversally cut into 5 µm-thick serial sections using a microtome (Microm® HM 335 E Microtome). Two different staining methods were performed: hematoxylin and eosin (hematoxylin stains nuclei purple/blue, while eosin stains cytoplasm pink); and AB-PAS (the properties of both PAS and Alcian blue are combined: nuclei deep blue, acidic mucins blue and neutral mucins magenta). Slides were observed, and images were acquired using a B-1000 Optika microscope (OPTIKA®).
2.6. Target and Constitutive Genes Selection
Genes involved in innate immunity response (IL-1β, IL-6, IL-10, TNFα, and Hsp70) and oxidative stress (sod1, GR and GPx1) were selected for subsequent molecular analyses. β-actin and Ef1α genes were used as reference as described in Khansari et al. [26], Wang et al. [27] and Kutluyer et al. [28]. Primer sequences and the amplification size of each fragment are described in Table 2.
Table 2.
Primer sequences, amplification size and literature references.
2.7. RNA Extraction and cDNA Synthesis
Total RNA was extracted from each sample using the RNeasy Mini Kit (Qiagen, Hilden, Germany), and eluted in a final volume of 40 μL of RNase-free water. A double treatment with DNase enzyme was performed, in order to remove any genomic DNA contamination, according to manufacturer instructions. Five hundred nanograms of RNA were retro-transcribed to cDNA using the Quantitect Reverse Transcription Kit (Qiagen, Hilden, Germany) following manufacturer protocol. An additional reaction without retrotranscriptase enzyme was performed to verify the complete genomic DNA removal. cDNAs were stored at −80 °C until subsequent use.
2.8. Gene Expression Profiles
The expression of oxidative response genes (sod1, GPx1, GR) and innate immune genes (IL-10, TNFα) was analyzed in liver and gills samples, respectively. Hsp70 and the two reference genes were instead amplified from both liver and gills samples. cDNAs were analyzed by quantitative PCR (qPCR) using an iQ5 Real-Time PCR instrument (Bio-Rad, CA, USA) and Universal SYBR® Green Supermix (Bio-Rad, CA, USA) as a fluorescent molecule. The amplification conditions were: 450 nM (final concentration) of forward and reverse primers for β-actin gene fragment; 250 nM (final concentration) of forward and reverse primers for the other analyzed genes. The thermal profiles were: 98 °C for 3 min, 40 cycles of 98 °C for 15 s, 59 °C for 30 s (TNFα, Hsp70, GR, GPx1, β-actin and EF1α) or 98 °C for 15 s, 55 °C for 15 s, and 72 °C for 15 s (IL-10 and sod1). qPCRs were run in plates accordingly to different thermal profiles. A melting profile was included after the last amplification cycle. Annealing temperatures were defined according to primers melting temperatures. Cycle threshold (Ct) values were determined for each sample and normalized using β-actin and EF1α genes as reference.
The relative gene expressions of samples collected from control and treated groups at T2 and T3 were calculated using the ΔΔCt method and were compared to samples collected at T1, considered as calibrator.
2.9. Statistical Analysis
Data related to water quality, fish histology and gene expression were processed using variance analysis for repeated statements (Proc GLM of the statistical package SAS-9.4, 2019, [29]) to evaluate the efficiency of the PEC system in the mitigation of nitrogen compounds in water (NH3, NO2−, NO3−) in comparison with the standard biological system. Each tank was considered as an individual effect. The data were presented as least squared means, with SEM, and differences were considered significant at p < 0.05.
3. Results
3.1. Water Parameters
Figure 2 shows the average values of the three trials and the standard deviations of the water physico-chemical properties measured in the two groups of tanks during the experiment. The mean temperature was 17.13 °C in the control tanks and 17.33 °C in the treated ones, with no significant variation during the whole experiment.
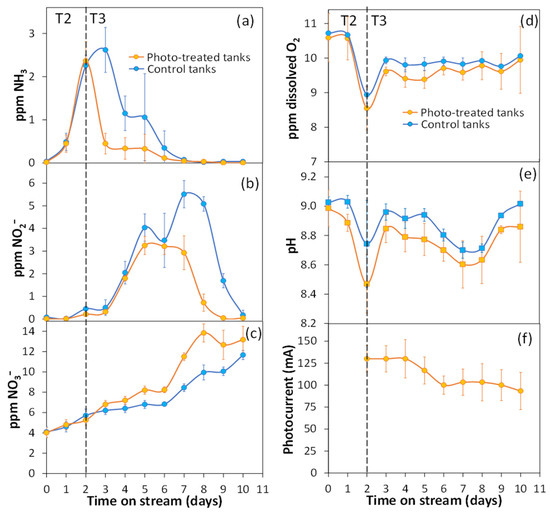
Figure 2.
Time on stream variation of the physico-chemical properties of water during the experiment in the control (blue line) and PEC treated (orange line) group. Average value and standard deviation in the three trials of (a) ammonia, (b) nitrite, (c) nitrate concentration, (d) dissolved oxygen, (e) pH, and (f) photocurrent of the PEC photoreactors.
The variation of ammonia, nitrite, and nitrate concentration in the six tanks during the experiment with fishes is presented in Figure 2. At the beginning of the experiment, i.e., after the 30 days biological filter maturation, the residual concentration of ammonia and nitrite in the tank’s water dropped down to zero, while nitrate concentration rose up to ca. 4 ppm. As the fishes were lodged in the tanks and fed, we registered a peak of ammonia (Figure 2a) excreted by the animals in both tank groups, up to ca. 2.5 ppm after 3 days, accompanied by a sharp decrease in dissolved oxygen (Figure 2d) and pH (Figure 2e). However, a faster decrease in ammonia concentration occurred in the PEC treated group with respect to the control group. The NH3 mean concentration value detected in the three phases were 2.03 mg/L vs. 2.06 mg/L (T0–T1, i.e., during the biological filter maturation), 2.26 mg/L vs. 2.37 mg/L (T1–T2, i.e., during the photocatalytic treatment) and 1.13 mg/L vs. 0.11 mg/L (T2–T3, i.e., during the PEC treatment; p < 0.01) in control and treated tanks, respectively.
After the initial transient accumulation of ammonia, a likewise peak of nitrite formation was observed (Figure 2b) followed by an increase of nitrate concentration (Figure 2c). This trend is characteristic of consecutive reactions and suggests that ammonia is converted into nitrate through the intermediate formation of nitrite. The most important result is that during the T2–T3 period the amount of harmful NO2− accumulated under control conditions for a longer period was significantly higher than in the PEC treated tanks (maximum concentration of 5.51 mg/L vs. 3.21 mg/L; p < 0.05). Moreover, in the PEC treated system NO2− concentration decreased back to zero in a shorter time than in the control system. Finally, during the initial period, a higher concentration of nitrates was detected in the PEC treated than in the control groups, the NO3− mean concentration values being 1.67 mg/L vs. 1.55 mg/L during T0–T1, 5.71 mg/L vs. 5.25 mg/L during T1–T2, and 9.39 mg/L vs. 11.88 mg/L during T2–T3 (Figure 2c) in the control and PEC treated groups, respectively. This result is consistent with a stronger ammonia to nitrate oxidizing efficiency in the PEC reactor with respect to the biological treatment alone, leading to a lower transient ammonia and nitrite accumulation and faster nitrate formation. Notably, the PEC treatment system reached a steady state condition within the last three days of experiment, with both ammonia and nitrite accumulation falling down to ca. zero, despite the continuous excretion by fishes, the nitrate concentration reaching a sort of plateau. In the control groups, by contrast, nitrate concentration increased almost linearly during the whole experiment, in line with the nitrification activity of microorganisms.
Both the pH (Figure 2e) and the dissolved oxygen (Figure 2d) were on average lower in the PEC-treated tanks than in the control ones along the whole experiment, probably due to a superior ammonia conversion and oxidative activity of the PEC system with respect to the biological filter alone. Finally, the average photocurrent (Figure 2f) was 130 mA at the beginning of the experiment and dropped down to ca. 100 mA after the 6th day. The partial loss of photocurrent was probably due to the deposition of limestone on the internal body of the PEC reactor working as cathode. Indeed, the initial value of the photocurrent was completely recovered after cleaning the internal metal surface of the reactor with a solution of diluted sulfuric acid.
3.2. Histology
HE and AB-PAS staining revealed no histological differences between treatments in the gills (Figure 3). Filaments presented a normal morphology, with a central cartilaginous matrix and a thin epithelial covering (Figure 3, arrow-heads). Secondary lamellae appear on the superior and inferior surfaces of the primary lamellae and are located perpendicular to the filaments (Figure 3, SL, PL). Both hypertrophy of mucous cells and hyperplasia of epithelial cells were not observed.
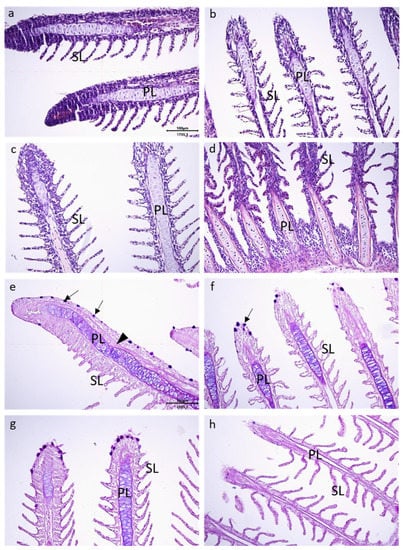
Figure 3.
Longitudinal sections of gill filaments of rainbow trout. HE staining representative figures for (a) T1; (b) T2, control; (c) T3, control; (d) T3, PEC. AB-PAS staining representative figures for (e) T1; (f) T2, control; (g) T3, control; (h) T3, PEC. PL, primary lamella; SL, secondary lamella; arrow, acid mucous cells; arrow-head, cartilaginous matrix. All figures have the same scale as indicated in Figure 3a and (e): 100 µm.
The livers of fish in all groups (control and treated ones) showed normal histology. Hepatocytes presented a regular form, and there was no leukocyte infiltration or signs of necrosis or lesions (data not shown)
3.3. Innate Immunity and Oxidative Stress Genes Expression
The quality of cDNAs obtained from gill and liver samples, and the absence of genomic contaminant DNA, were assessed by amplifying the β-actin gene (data not shown). The results of relative expressions of Hsp70 and innate immunity response (IL-10, TNFα) genes in gills, and Hsp70 and oxidative stress (sod1, GR, and GPx1) genes in the liver are presented in Figure 4 and Figure 5, respectively. Briefly, Ct values were determined for each gene and normalized using β-actin and Ef1α genes as reference. The results of genes relative expression (calculated using the ΔΔCt method) for control and treated groups samples at T2 and T3 were normalized compared to ones of T1, considered as calibrator.
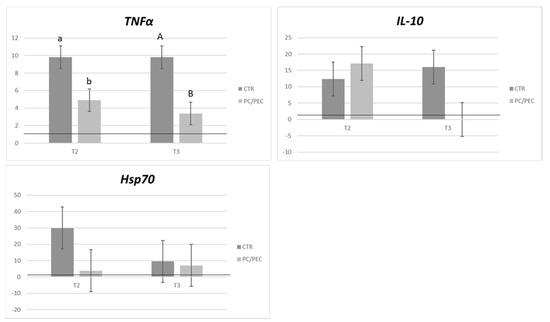
Figure 4.
Relative mRNA abundance of genes (TNFα, IL-10, Hsp70) analyzed in the gills. CTR: control group; PC/PEC: treated groups; T2: biological filter vs. biological filter + PC system; T3: biological filter vs. biological filter + PEC system; a,b: different letters indicate statistically significant differences between the two experimental groups (p < 0.05); black thick line represents the reference sample expression (value = 1). Values are presented as mean ± SD.
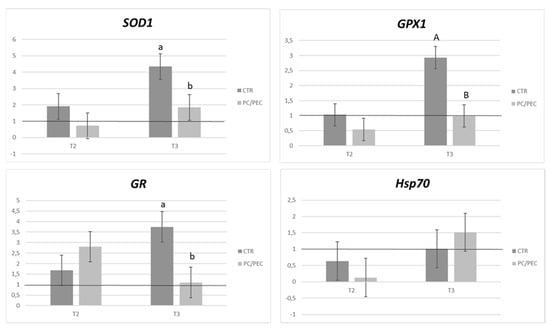
Figure 5.
Relative mRNA abundance of genes (sod1, GPx1, GR, Hsp70) analyzed in the liver. CTR: control group; PS: treated group; PC/PEC: biological filter vs. biological filter + PC system; T3: biological filter vs. biological filter + PEC system a,b: different letters indicate statistically significant differences between the two experimental groups (p < 0.05); black line represents the reference sample expression (value = 1). Values are presented as mean ± SD.
The expression of IL6 and IL-1β genes in gill samples were not detectable since the Ct of each sample was below the lower limit of the dynamic range of the RT reactions and, for this reason, not considered in this work.
In gills, IL-10, TNFα, and HSP70 gene expressions showed an upregulation at T2 and T3 in both control and treated groups compared to T1 samples (Figure 4 and Figure 5). At T2, TNFα gene expression was significantly higher in the control group with respect to the test group (p < 0.05) as well as at T3 (p < 0.01). IL-10 showed a higher expression in the test group at T2, which tended to be significant (p < 0.06). On the contrary, the expression of the IL-10 gene was undetectable in the tested group at T3, and Hsp70 gene expression did not show any significant differences between the two groups at any time point, although an upregulation was detected in the control group at T2 when compared to the reference samples (T1) (Figure 4).
In the liver, sod1, GPx1, and Hsp70 gene expressions were higher in the control group compared to the test group at T2 (not significant). At T3, sod1, GPx1, and GR gene expressions were significantly higher in the control group when compared to the samples of the PEC system group (p < 0.05, p < 0.01, and p < 0.05, respectively). No difference in Hsp70 gene expression between control and tested groups was detected at T2 and T3 (Figure 5).
4. Discussion
In the present study, we investigated the possible application of an innovative PEC reactor for water remediation in a recirculating aquaculture system, to reduce water displacement and enhance water quality. In particular, we investigated rainbow trout, which is present in fish farms all over the world and represents the most important freshwater cultured species in Italy [30].
Photocatalysis in aquaculture was applied for the first time by some of us [18], with promising results in the remediation of nitrogen-containing compounds in Zebrafish culture, proving that the photocatalytic oxidation process could be exploited as an affective, environmentally friendly and sustainable water remediation system. A pure photocatalytic system was tested in the previous work during the whole experiment. In contrast, in this work, we investigated the effect of the photo-electro-catalytic treatment, by introducing an external electrical bias of 4 V between the irradiated photoactive TiO2 coating and the metal body of the reactor working as a counter electrode. Interestingly, in both previous and present experiments, we observed a 6 days long transient accumulation of ammonia and nitrite formation, suggesting the presence of an activation/conditioning period before a steady state condition is reached. However, in the previous work, we recorded a significantly higher nitrite concentration in the PC-treated group than in the control group, while the opposite is observed in the present work, the nitrite concentration being significantly lower in the PEC-treated group. This result highlights the superior oxidizing performance of the PEC vs. the PC treatment.
As mentioned above, the trend of ammonia, nitrite, and nitrate concentration during the transient period is characteristic of the kinetics of consecutive reactions and suggests that ammonia is converted into nitrate through the intermediate formation of nitrite [14,31], according to the following reactions:
Reaction (1) can also explain the minimum pH peak recorded after 7 days (Figure 2), which is reached at the maximum nitrite concentration (Figure 2b). This reactions scheme is analogous to the nitrification process occurring in biofilters that ultimately transforms all excreted ammonia into nitrates in two steps by two distinct aerobic bacteria: Reaction (1) is accomplished by bacteria named Nitrosomonas by their genus, while Reaction (2) by another genus of bacteria referred to as Nitrobacter [32]. During the initial transient period, the maximum reached in the nitrite concentration curve represents the point at which the Nitrobacter population is grown enough to consume an amount of nitrite larger than that produced by Nitrosomonas. From this point on, the nitrite concentration decreases until it levels off when the population of the two bacteria reaches an equilibrium. Hence, the biofilter converts harmful ammonia and nitrite quantitatively into non-toxic nitrate, but constantly accumulates the latter over time. Indeed, the levels usually found in a biofilter-treated RAS are above 200 mg/L. A high concentration of nitrates in the RAS system is generally accepted because fish can undergo reduced feed intake and low average daily gain only when exposed to NO3− levels up to 1000 mg/L for a long period [33]. The advantage of the PEC treatment in RAS is the possibility to limit nitrate accumulation (i.e., lowering the total nitrogen content of the recirculating water) by exploiting other photo- and electro-induced reactions able to oxidize ammonia to gaseous molecular nitrogen (N2). These other possible reactions might be responsible for the plateau in nitrate concentration reached during the last three days of the experiment in the treated group. These reactions might include ammonia cleavage to molecular hydrogen and nitrogen (inverse ammonia synthesis reaction) or the thermodynamically allowed ammonia oxidation by nitrite:
Furthermore, the PEC system can also exploit the UV/electro-chlorine advanced oxidation process, thanks to the presence of dissolved chloride in water. In this process, chloride is oxidized by photogenerated holes to chlorine radical (E° Cl•/Cl− = 2.47 V vs. NHE), which are highly reactive and selective in ammonia oxidation to molecular nitrogen or nitrate [19,21]. Chlorine radicals can undergo several reactions in the aqueous phase, including the formation of molecular chlorine (Cl2) that can further evolve to HClO or directly react with ammonia [19]. This latter reaction pathway can lead to the formation of monochloramine (NH2Cl) and dichloramine (NHCl2) intermediates. Dichloramine reacts with water to yield nitroxyl radical (HNO) and chloride ions. However, nitroxyl is a short-lived intermediate and can rapidly decompose to nitrous oxide (N2O) or react with NHCl2 to yield molecular nitrogen (NHCl2 + HNO → N2 + HClO + H+ + Cl−) [19]. The electro-chlorine process can compete or even inhibit the oxidation of water and dissolved oxygen into hydroxyl radicals OH• and superoxide O2−, which are the typical reactive species involved in traditional photocatalytic oxidation processes.
Moreover, the photo-produced bleach (chlorine) can kill, on one hand, pathogens in the system but, on the other hand, also the nitrifying bacteria in the biofilter. This could explain the plateau in nitrate concentration reached in the treated groups, while in the control nitrate linearly increased along the whole trial. A deeper investigation is required to study the effect of the PEC treatment on the nitrifying bacteria, which is beyond the scope of the present work.
The significantly lower concentration of nitrites, which are highly toxic for fish survival, in the treated tanks is an encouraging result, since NO2− accumulation can affect the well-being of fish, modifying the balance of intra- and extra-cellular electrolytes, which could damage liver cell mitochondria and trigger the immune system, causing hypoxia and different histological alterations in gills [34,35,36].
The fish’s health and welfare could be evaluated through morphological and molecular analyses. Whenever there is the need to evaluate the effects of contaminants on fish, histopathological studies of the gills provide indeed good indicators [37]. In addition, Heath [38] stated that the fish liver is particularly sensitive to environmental factors because some contaminants tend to accumulate in the liver, more than in other organs. Monitoring histological changes in fish liver and gills represent a sensitive and accurate way to evaluate the effects of xenobiotic compounds in water. Indeed, Gernhofer et al. [39] demonstrated that fish liver histology might serve as a model for studying the relations between environmental factors and hepatic structures and functions. In this study, the histology of the gills and the liver presented a normal structure, regardless of the timepoint and the treatment. These results indicate that the water quality in the tanks with and without PC and PEC treatment systems was high enough not to cause any damage to these organs.
The histological results are also partially supported by molecular analyses. Oxidative stress markers in the control group were significantly higher with respect to the PEC-test group at T3. This suggests a higher oxidative stress exposure in the control group, which is demonstrated by the activation of the antioxidant genes sod1, GPx1, and GR [40]. On the contrary, when the photocatalytic filter worked without electro-catalysis (T2), no statistically significant differences between the test and the control group were highlighted in the expression of antioxidant enzymes. However, the expression of antioxidant enzyme genes at T2 showed a tendency to decrease in the treated group compared to the control one. These results could be attributed to the short exposure period of fish to the photocatalytic system.
In addition, the only gene that showed a significantly higher expression in the control group at T2 and T3 is TNFα. These results could be explained since TNFα is an important component of early inflammatory events in fish [41]. IL-10 is an anti-inflammatory cytokine and suppresses immune responses. In general, IL-10 acts as a suppressor and exerts a conserved role in dampening inflammatory responses in fish [42]. The low expression of this gene in the treated groups could therefore be attributed to a limited impact of stress. Finally, the absence of statistically significant differences in Hsp70 between the test and control group is probably due to the fact that this gene expression increment is mainly linked to heat stress, while the temperature of tanks was maintained in the recommended range of 12–21 °C throughout the trial.
The present study demonstrates that the PEC process could be considered an improvement of conventional photocatalysis, which increases the degradation rate of refractory organic pollutants and induces fast oxidation of nitrogen-containing compounds in trout culture, with a better efficiency in the remediation ability of recalcitrant organic pollutants [43] with beneficial effects on fish welfare, as demonstrated by the significantly lower expression of TNFα, an important component of early inflammatory events in fish.
5. Conclusions
The results of the present study demonstrate that the PEC process has a positive effect on water quality, enhancing the degradation rate of refractory organic pollutants and producing a strong oxidation of nitrogen compounds compared to the conventional biological filter, addressing lower levels of oxidative stress markers and inflammation parameters (TNFα) gene expression of O. mykiss.
As PEC filter has been tested so far only for a short time, further studies are required to assess the performance of this innovative water filtration system in a more extended time period.
Author Contributions
Conceptualization, G.L.C., C.B., V.M.M., A.C. (Annamaria Costa), A.D.G. and E.B.; methodology, G.L.C., S.L., C.B., V.M.M., A.C. (Annamaria Costa), A.D.G., S.F., M.B. and E.B.; software, A.C. (Annamaria Costa), G.L.C. and A.D.G.; validation, A.C. (Annamaria Costa), C.B., G.L.C. and A.D.G.; formal analysis, A.C. (Alessandra Cafiso), C.B., C.C., E.B., A.C. (Annamaria Costa), L.A., S.M.M.; investigation, G.L.C., S.L., A.C. (Alessandra Cafiso), C.B., C.C., E.B., A.C. (Alessandra Cafiso), A.D.G., L.A., A.C. (Annamaria Costa), V.M.M., S.M.M.; resources, G.L.C., C.B., A.C. (Annamaria Costa), A.D.G.; data curation, G.L.C., C.B., S.F., M.B., A.C. (Annamaria Costa), A.D.G., E.S. and E.B.; writing—original draft preparation, E.B., G.L.C., C.B., A.C. (Annamaria Costa), A.D.G., A.C. (Alessandra Cafiso), C.C., L.A., E.S.; writing—review and editing, E.B., G.L.C., C.B., A.C. (Annamaria Costa), A.D.G., A.C. (Alessandra Cafiso), C.C., E.S., R.R., S.F.; visualization, G.L.C., C.B., V.M.M., A.C. (Annamaria Costa), A.D.G.; supervision, G.L.C., C.B., V.M.M., A.C. (Annamaria Costa), A.D.G.; project administration, C.B., G.L.C., A.D.G.; funding acquisition, G.L.C., C.B., V.M.M., A.D.G., S.M.M. All authors have read and agreed to the published version of the manuscript.
Funding
This research was funded by University of Milan (SEED2019; Grant number 1148), and it was performed as a pilot study of the Project Fish-PhotoCAT, “Photocatalytic water remediation for sustainable fish farming”, funded by PRIMA 2019.
Institutional Review Board Statement
The study involving animals was conducted according to Directive 2010/63/EU of the European Parliament and of the Council of 22 September 2010 on the protection of animals used for scientific purposes (Article 1, Paragraph 1, Letter b) and the Italian legislation (D. Lgs. n. 26/2014, Article 2, Paragraph 1, Letter b). All procedures involving animals were conducted in accordance with the guidelines approved by the ethical committee (OPBA_20_2020) of the University of Milan, as established by legislative decree n°26/2004 References.
Informed Consent Statement
Not applicable.
Data Availability Statement
The data is contained within the article.
Acknowledgments
The authors thank Nanomaterials S.r.l. (Milano) for the prototype used in the experimental study. The authors acknowledge support from the University of Milan through the APC initiative.
Conflicts of Interest
The authors declare no conflict of interest.
Abbreviations
| sod1 | superoxide dismutase 1 gene |
| GR | glutathione reductase gene |
| GPx1 | glutathione peroxidase 1 gene |
| TNFα | tumor necrosis factor α gene |
| Hsp70 | heat shock protein 70 gene |
| IL-1β | interleukin 1β gene |
| IL-6 | interleukin 6 gene |
| IL-10 | interleukin 10 gene |
| β-actin | β-actin gene |
| Ef1α | elongation factor 1-α gene |
| PCR | Polymerase Chain Reaction |
| qPCR | quantitative Polymerase Chain Reaction |
| Ct | Cycle threshold |
| ΔΔCt | delta delta Cycle threshold |
| HE | Hematoxylin & Eosin |
| AB-PAS | Alcian blue-Periodic Acid Shiff |
| SL | Secondary lamellae |
| PL | Primary lamellae |
| NH3 | Ammonia |
| N2 | Nitrogen |
| N2O | Nitrous Oxide |
| NO | Nitric Oxide |
| PC | photo-catalytic system |
| PEC | photo-electro-catalytic system |
References
- FAO. FishStatJ—Software for Fishery and Aquaculture Statistical Time Series; Food and Agricultural Organization of the United Nations: Rome, Italy, 2020. [Google Scholar]
- Brune, D.E.; Schwartz, G.; Eversole, A.G.; Collier, J.A.; Schwedler, T.E. Intensification of pond aquaculture and high-rate photosynthetic systems. Aquac. Eng. 2003, 28, 65–86. [Google Scholar] [CrossRef]
- Chen, S.; Ling, J.; Blancheton, J.P. Nitrification kinetics of biofilm as affected by water quality factors. Aquac. Eng. 2006, 34, 179–197. [Google Scholar] [CrossRef]
- McKenzie, D.J.; Shingles, A.; Claireaux, G.; Domenici, P. Sublethal concentrations of ammonia impair performance of the teleost fast-start escape response. Physiol. Biochem. Zool. 2009, 82, 353–362. [Google Scholar] [CrossRef]
- Levit Stuart, M. A literature Review of Effects of Ammonia on Fish. 2010. Available online: conservationgateway.org (accessed on 22 June 2022).
- Fornshell, G. Rainbow Trout—Challenges and Solutions. Rev. Fish. Sci. 2002, 10, 545–557. [Google Scholar] [CrossRef]
- Chew, Y.K.; Wilson, J.M.; Randall, D.J. Defences against ammonia toxicity in tropical air-breathing fishes exposed to high concentrations of environmental ammonia: A review. J. Comp. Physiol. 2004, 174, 565–575. [Google Scholar]
- Fazio, F. Fish hematology analysis as an important tool of aquaculture: A review. Aquaculture 2019, 500, 237–242. [Google Scholar] [CrossRef]
- Iwama, G.K.; Afonso, L.O.B.; Vijayan, M.M. Stress in fish. Ann. N. Y. Acad. Sci. 1998, 851, 304–310. [Google Scholar] [CrossRef]
- Heath, A.G. (Ed.) Water Pollution and Fish Physiology, 1st ed.; CRC Press: Boca Raton, FL, USA, 1987; pp. 46–66. [Google Scholar]
- Roberts, J.R. (Ed.) The pathophysiology and systematic pathology of teleosts. In Fish Pathology, 1st ed.; Bailliere Tindall: London, UK, 1978; pp. 67–70. [Google Scholar]
- Rodrigues, E.L.; Fanta, E. Liver histopathology of the fish Brachydanio rerio after acute exposure to sublethal levels of the organophosphate Dimetoato 500. Rev. Brasil. Zool. 1998, 15, 441–450. [Google Scholar] [CrossRef]
- Murgia, S.M.; Poletti, A.; Selvaggi, R. Photocatalytic degradation of high ammonia concentration water solutions by TiO2. Ann. Di Chim. J. Anal. Environ. Cult. Herit. Chem. 2005, 95, 335–343. [Google Scholar] [CrossRef]
- Altomare, M.; Chiarello, G.L.; Costa, A.; Guarino, M.; Selli, E. Photocatalytic abatement of ammonia in nitrogen-containing affluents. Chem. Eng. J. 2012, 191, 394–401. [Google Scholar] [CrossRef]
- Levine, S.Z.; Calvert, J.G. The mechanism of the photooxidation of ammonia. Chem. Phys. Lett. 1977, 46, 81–84. [Google Scholar] [CrossRef]
- Costa, A.; Chiarello, G.L.; Selli, E.; Guarino, M. Effects of TiO2 based photocatalytic paint on concentrations and emissions of pollutants and on animal performance in a swine weaning unit. J. Environ. Manag. 2012, 96, 86–90. [Google Scholar] [CrossRef] [PubMed]
- Il’chenko, N.I.; Golodets, G.I. Catalytic oxidation of ammonia: I. Reaction kinetics and mechanism. J. Catal. 1975, 39, 57–72. [Google Scholar] [CrossRef]
- Randazzo, B.; Chemello, G.; Tortarolo, I.; Chiarello, G.L.; Zalas, M.; Santini, A.; Liberatore, M.; Selli, E.; Olivotto, I. A Novel Photocatalytic Purification System for Fish Culture. Zebrafish 2017, 14, 411–421. [Google Scholar] [CrossRef] [PubMed]
- Ji, Y.; Bai, J.; Li, J.; Luo, T.; Qiao, L.; Zeng, Q.; Zhou, B. Highly selective transformation of ammonia nitrogen to N2 based on a novel solar-driven photoelectrocatalytic-chlorine radical reactions system. Water Res. 2017, 125, 512–519. [Google Scholar] [CrossRef] [PubMed]
- Kishimoto, N.; Katayama, Y.; Kato, M.; Otsu, H. Technical feasibility of UV/electro-chlorine advanced oxidation process and pH response. Chem. Eng. J. 2018, 334, 2363–2372. [Google Scholar] [CrossRef]
- Wang, S.; Ye, Z.; Taghipour, F. UV photoelectrochemical process for the synergistic degradation of total ammonia nitrogen (TAN). J. Clean. Prod. 2021, 289, 125645. [Google Scholar] [CrossRef]
- Directive 2010/63/EU of the European Parliament and of the Council of 22 September 2010 on the protection of animals used for scientific purposes. Official Journal of the European Union. Available online: https://eur-lex.europa.eu/LexUriServ/LexUriServ.do?uri=OJ:L:2010:276:0033:0079:en:PDF (accessed on 20 July 2022).
- D. Lgs. n. 26/2014, Italian Legislation, Article 2, Paragraph 1, Letter b.
- Collivignarelli, M.C.; Carnevale Miino, M.; Arab, H.; Bestetti, M.; Franz, S. Efficiency and energy demand in Polishing treatment of wastewater treatment plants effluents: Photolectrocatalysis vs. photocatalysis and photolysis. Water 2021, 13, 821. [Google Scholar] [CrossRef]
- Franz, S.; Arab, H.; Chiarello, G.L.; Bestetti, M.; Selli, E. Single-Step Preparation of Large Area TiO2 Photoelectrodes for Water Splitting. Adv. Energy Mater. 2020, 10, 2000652. [Google Scholar] [CrossRef]
- Khansari, A.R.; Balasch, J.C.; Vallejos-Vidal, E.; Teles, M.; Fierro-Castro, C.; Tort, L.; Reyes-López, F.E. Comparative study of stress and immune-related transcript outcomes triggered by Vibrio anguillarum bacterin and air exposure stress in liver and spleen of gilthead seabream (Sparus aurata), zebrafish (Danio rerio) and rainbow trout (Oncorhynchus mykiss). Fish Shellfish. Immunol. 2018, 86, 436–448. [Google Scholar] [CrossRef]
- Wang, L.; Wang, L.; Zhang, D.; Li, S.; Yin, J.; Xu, Z.; Zhang, X. Effect of dietary selenium on postprandial protein deposition in the muscle of juvenile rainbow trout (Oncorhynchus mykiss). Br. J. Nutr. 2021, 125, 721–731. [Google Scholar] [CrossRef] [PubMed]
- Kutluyer, F.; Sirkecioğlu, A.N.; Aksakal, E.; Aksakal, F.İ.; Tunç, A.; Günaydin, E. Effect of dietary fish oil replacement with plant oils on growth performance and gene expression in juvenile rainbow trout. Ann. Anim. Sci. 2017, 17, 1135–1153. [Google Scholar] [CrossRef]
- SAS Statistical Package SAS-9.4; SAS: Cary, NC, USA, 2019.
- Stanković, D.; Crivelli, A.J.; Snoj, A. Rainbow trout in Europe: Introduction, naturalization, and impacts. Rev. Fish. Sci. Aquac. 2015, 23, 39–71. [Google Scholar] [CrossRef]
- Altomare, M.; Selli, E. Effects of metal nanoparticles deposition on the photocatalytic oxidation of ammonia in TiO2 aqueous suspensions. Catal. Today 2013, 209, 127–133. [Google Scholar] [CrossRef]
- Hagopian, D.S.; Riley, J.G. A closer look at the bacteriology of nitrification. Aquac. Eng. 1998, 18, 223–244. [Google Scholar] [CrossRef]
- Schram, E.; Roques, J.A.C.; van Kuijk, T.; Abbink, W.; van de Heul, P.; de Vries, P.; Bierman, S.; van de Vis, H.; Flik, G. The impact of elevated water ammonia and nitrate concentrations on physiology, growth and feed intake of pikeperch (Sander lucioperca). Aquaculture 2014, 420, 95–104. [Google Scholar] [CrossRef]
- Lewis, W.M.; Morris, D.P. Toxicity of nitrite to fish: A review. Trans. Am. Fish. Soc. 1986, 115, 83–95. [Google Scholar] [CrossRef]
- Livingstone, D.R. Oxidative stress in aquatic organisms in relation to pollution and aquaculture. Rev. Médecine Vétérinaire 2003, 154, 427–430. [Google Scholar]
- Svobodova, Z.; Machova, J.; Drastichova, J.; Groch, L.; Luskova, V.; Poleszczuk, G.; Velisek, J.; Kroupova, H. Haematological and biochemical profile of carp blood following nitrite exposure at different concentration of chloride. Aquac. Res. 2005, 36, 1177–1184. [Google Scholar] [CrossRef]
- Ortiz-Delgado, J.B.; Segner, H.; Arellano, J.M.; Sarasquete, C. Histopathological alterations, EROD activity, CYP1A protein and biliary metabolites in gilthead seabream Sparus aurata exposed to Benzo(a)pyrene. Histol. Histopathol 2007, 22, 417–432. [Google Scholar]
- Heath, A.G. (Ed.) Water Pollution and Fish Physiology, 2nd ed.; CRC Press: Boca Raton, FL, USA, 1995; p. 369. [Google Scholar]
- Gernhöfer, M.; Pawert, M.; Schramm, M.; Müller, E.; Triebskorn, R. Ultrastructural biomarkers as tools to characterize the health status of fish in contaminated stream. J. Aquat. Ecosyst. Stress Recovery 2001, 8, 241–260. [Google Scholar] [CrossRef]
- Martínez-Álvarez, R.M.; Morales, A.E.; Sanz, A. Antioxidant Defenses in Fish: Biotic and Abiotic Factors. Rev. Fish Biol. Fish. 2005, 15, 75–88. [Google Scholar] [CrossRef]
- Sigh, J.; Lindenstrøm, T.; Buchmann, K. Expression of pro-inflammatory cytokines in rainbow trout (Oncorhynchus mykiss) during an infection with Ichthyophthirius multifiliis. Fish Shellfish. Immunol. 2004, 17, 75–86. [Google Scholar] [CrossRef] [PubMed]
- Zou, J.; Secombes, C.J. The Function of Fish Cytokines. Biology 2016, 5, 23. [Google Scholar] [CrossRef]
- Garcia-Segura, S.; Brillas, E. Applied photoelectrocatalysis on the degradation of organic pollutants in wastewaters. J. Photochem. Photobiol. C Photochem. Rev. 2017, 31, 1–35. [Google Scholar] [CrossRef]
Publisher’s Note: MDPI stays neutral with regard to jurisdictional claims in published maps and institutional affiliations. |
© 2022 by the authors. Licensee MDPI, Basel, Switzerland. This article is an open access article distributed under the terms and conditions of the Creative Commons Attribution (CC BY) license (https://creativecommons.org/licenses/by/4.0/).