Article

Determinants Affecting Public Intention to Use Micro-Vertical Farming: A Survey Investigation

1
School of Architecture, Nanjing Tech University, Nanjing 211816, China
2
School of Architecture and Urban Planning, Shandong Jianzhu University, 1000 Fengming Road, Jinan 250101, China
*
Author to whom correspondence should be addressed.
These authors contributed equally to this work.
Sustainability 2022, 14(15), 9114; https://doi.org/10.3390/su14159114
Submission received: 13 June 2022 / Revised: 30 June 2022 / Accepted: 22 July 2022 / Published: 25 July 2022

Abstract

:
Vertical farming is a new branch of urban agriculture using indoor vertical space and soil-less cultivation technology to obtain agricultural products. Despite its many advantages over traditional farming, it still faces some challenges and obstacles, including high energy consumption and costs, as well as uncertainty and a lack of social acceptance. This study aims to investigate the influence of public acceptance on micro-vertical farming based on the deconstructed theory of planned behavior model. This model is adopted for statistical analysis to reveal the factors and their weights in influencing people’s behavioral intentions. The results indicate that the overall mean of the public’s behavioral intentions to use vertical farming is 3.9, which is above neutral (M = 3.00) but less than positive (M = 4.00). Differences in age, education level, and the living area of the public have significantly impacted behavioral intentions. Meanwhile, the statistical results support the hypotheses concerning the behavioral attitudes, subjective norms, and perceived behavioral control of the model, and also demonstrate that their decomposed belief structures considerably influence the public’s behavioral intentions to use vertical farming. Notably, perceived usefulness is the most critical driving factor in planting using vertical farming. The findings of this study contribute to better predictions of the effects of different elements of behavioral intention on vertical farming at the urban scale, which may provide a basis for decision making in the development of sustainable urban agriculture.

1. Introduction

The contemporary world, population expansion, and accelerating urbanization have become important reasons for the increase in the differences between agricultural land and construction land [1]. Apart from shrinking farmland, extreme weather caused by global climate change has had a huge impact on the traditional model of agricultural production, which has raised concerns about food security [2]. In 1999, Despommier introduced the concept of urban “vertical farming” and committed to promoting this new agricultural production mode to deal with the challenges of modern society [3].
The basic idea of vertical farming (VF) is to transform the original single-layer flat agricultural model into a multi-layer vertically stacked model that integrates modern agricultural technologies such as soil-less cultivation, artificial Light Emitting Diode (LED) sources, environmental control, and renewable energy to produce agriculture inside urban buildings [4]. Compared with traditional agriculture, the main advantages of VF include
  • Utilizing land resources efficiently and alleviating the struggles between humans and the land [5].
  • Improving production efficiency while avoiding the impact of extreme weather on agricultural production and ensuring food safety due to the controlled indoor environment [6].
  • Reducing environmental pollution caused by agricultural production processes using renewable-energy-recycling technology and avoiding the use of pesticides [2].
  • Establishing urban “local food supply chains” as a supplement and buffer to long-distance food supply chains [7].
  • Providing a new employment model and jobs [8].
In addition, VF has certain ecological and environmental benefits. On the urban scale, large commercial VF is usually combined with resource reuse and recycling facilities, such as solid waste treatment, wastewater treatment, and waste heat recycling that enhance the sustainability of the city [9]. In terms of the indoor environment, the air purification effects of the main indoor air pollutants have been verified including carbon dioxide, particulate matter, and some volatile organic compounds [10]. VF also helps to improve the physical and psychological environment due to the visual relaxation effects of ecological designs [11]. In addition, it enhances indoor daylight distribution by providing shade and diffuse reflection in front of the windows [12].
Despite its potential advantages, the concept of VF has been met with skepticism and even criticism. First, due to cost-effective constraints, the types of plants suitable for vertical farming are limited. Leafy greens with high water content rather than crops high in carbohydrates are much more suitable plant species for VF since they grow much faster and consume fewer resources such as electricity and water [13,14]. Second, VF may bring about certain favorable or unfavorable effects on the indoor environment. For example, plant transpiration increases indoor relative humidity by 9–12% [10]. This may be favorable for indoor comfort in arid regions but could be disadvantageous in hot and humid regions [15]. Other considerations include the noise made by hydroponic systems [16], a minor chance of discomfort as a result of allergies [17], and energy consumption and heat dissipation caused by the artificial growth lights [18]. Finally, the exhaust gases, wastewater, and heat emitted from VF could affect the urban environment if not properly treated or recycled [16]. Currently, a series of solutions has been already tested and implemented to deal with the aforementioned challenges. For example, the cost-effectiveness of VF could be greatly enhanced by the careful selection of crop varieties and continuous improvements to the energy efficiency of the VF equipment and systems [19]. As for VF’s possible negative impacts on the environment, the integration of different systems and technologies is needed to reduce, reuse, or recycle the waste from VF [20].
Technology should not be an obstacle as it continues to improve. However, there are still uncertainties around the economic feasibility and social acceptance of VF. Shao et al. [21] developed the world’s first evaluation software to simulate VF’s economic feasibility and energy consumption considering the impact of multiple factors such as region, type, and technology level. The simulated results show that VF could be preferable in areas with high vegetable prices, low energy costs, and high labor costs, where the annual rate of return on investment can be up to 25%. Conversely, it could be easy to develop the project in a state of loss for a long time, thereby reducing commercial attractiveness. Zhang et al. [22] analyzed the economic feasibility of introducing VF to a university park. The results showed that the payback period of a 5000 m2 vertical farm was 11.5 years and that the annual profit could reach $92,000. Avgoustaki et al. [23] analyzed and compared the internal rate of return and the net present value of VF and greenhouses for the same planting area (225 m2). The study showed that VF was economically more advantageous. Its internal rate of return was 34.74% with a payback period of 4 years. In contrast, Graff [24] estimated the return on investment for a 10-storey vertical farm in Toronto to be only about 8%, which was below the minimum acceptable rate of 10–12% for most investors.
Compared with an economic feasibility analysis of agriculture-oriented VF, studies on the social acceptance of small-scale mixed-use VF, especially family-run or office-based micro-VF, are scarcely documented. Mixed-use VF can be used not only for agricultural purposes, but also for other functions such as recreation [25], education [26], decoration, and exhibitions [27]. For this type of VF, agricultural production is usually considered a value-added function rather than the main function. In mixed-use VF, occupants are often more concerned with the improvements to the quality of the indoor environment brought about by vertical farming than the annual yield of agricultural produce. Mixed-use VF with the most market potential are family farms since the proportion of residential land is usually the largest in cities. However, the uncertainty lies in public acceptance and the preference for consumption. In order to research and develop this market, this study applies surveys and information systems to provide an important basis for market forecast analysis, taking a comprehensive consideration of objective conditions and subjective willingness [28].
In this study, the decomposed theory of planned behavior (DTPB) model was utilized to investigate the influence of public acceptance on the use of VF. Furthermore, partial least squares structural equation modeling (PLS-SEM) was adopted to test the hypothetical relationship in the theoretical framework. From a subjective perspective, an in-depth analysis of the factors that affect public acceptance and willingness to adopt VF was conducted in order to analyze the decision-making aspects of VF planting behavior and make tailored recommendations for its promotion and development.

2. Literature Review and Hypotheses

2.1. Theories and Models of Users’ Behavioral Intentions

In recent years, research on information systems applications has developed rapidly. The study of users’ behavioral intentions (BI) has become an important part of research on user acceptance [29]. Models and theories have been used to predict user behavior, including the Theory of Reasoned Action (TRA) [30], Theory of Planned Behavior (TPB) [31,32], and Decomposed Theory of Planned Behavior (DTPB) [33]. The TRA suggests that the execution of individual behavior is governed by BI [34], but this theory ignores the influence of objective reality on BI, resulting in its limited and questionable scope of application [34]. To compensate for the shortcomings of the TRA, Ajzen [35] incorporated Perceived Behavioral Control (PBC) into the theoretical model to form the TPB, which broadened the application area of the theory. However, as the research continued, many scholars found that the TPB has the same limitations as the TRA, and the belief dimensions of the two theories show multiple dimensions in many situations [36]. Accordingly, Taylor and Todd [37] combined the Diffusion of Innovation Theory (IDT) with the TPB in 1995 and proposed the DTPB using the second-order deconstruction of the three single linear structures in the TPB. Antecedent variables can be added or reduced in the model according to the specific research object and scenario, which is conducive to further explorations of the deeper psychological perceptual elements of individual behavior. Compared with the TRA and TPB, the DTPB has a broader perspective and greater explanatory power and applicability in multiple research fields, since a more stable belief structure can be built [38]. Therefore, although yet to be developed and applied in VF research, DTPB modeling could be an effective approach to investigating social acceptance and willingness to adopt VF.

2.2. Factors Influencing Acceptance and Willingness

From the perspective of behavioral theory, for individuals, acceptance and willingness to use new technologies are the result of the combined effects of various factors such as their socioeconomic attributes, social relationship norms, and behavioral control [39]. Studies have found that an individual’s attributes, such as gender, age, occupation, education level, income level, etc., have an impact on their willingness to use new technologies [40]. Studies have shown that people with higher income levels are more concerned about the quality of agricultural products than the price [41]. Younger groups are more receptive to and tolerant of new technologies. Women are more cautious in viewing and using new technologies than men [42]. As a new planting technology, the complexity of the planting process of vertical agriculture and the consumption of individual money, time, and energy in this process are also important factors that impact public planting intention. In addition, the advice and behavior of people around an individual are also important factors. Therefore, this paper first investigates the influence of an individual’s own socioeconomic attributes on planting intentions and then investigates the influence of other factors such as social relationship norms and behavior control.
There are two types of the disaggregate behavioral model of individual behavioral intentions [43]. RP (revealed preference) is an investigation of an individual’s completed choice behavior [44], and SP (stated preference) is an investigation of how an individual makes a choice and how he considers it under hypothetical conditions [45]. RP is for investigating the results and conditions of choices made by individuals in a certain actual state, mainly targeting actual or occurring schemes, that is, the contents of the survey are the observed behavioral choice data that have taken place [46]. SP is mainly used to investigate the factors and degree of influence that affect consumers’ acceptance of a product or service, and the main purpose is to obtain people’s subjective preferences for behavioral choices under assumed conditions that have not yet occurred [47]. Since there were no existing data on vertical agricultural planting behavior, the SP survey method was selected for this study.

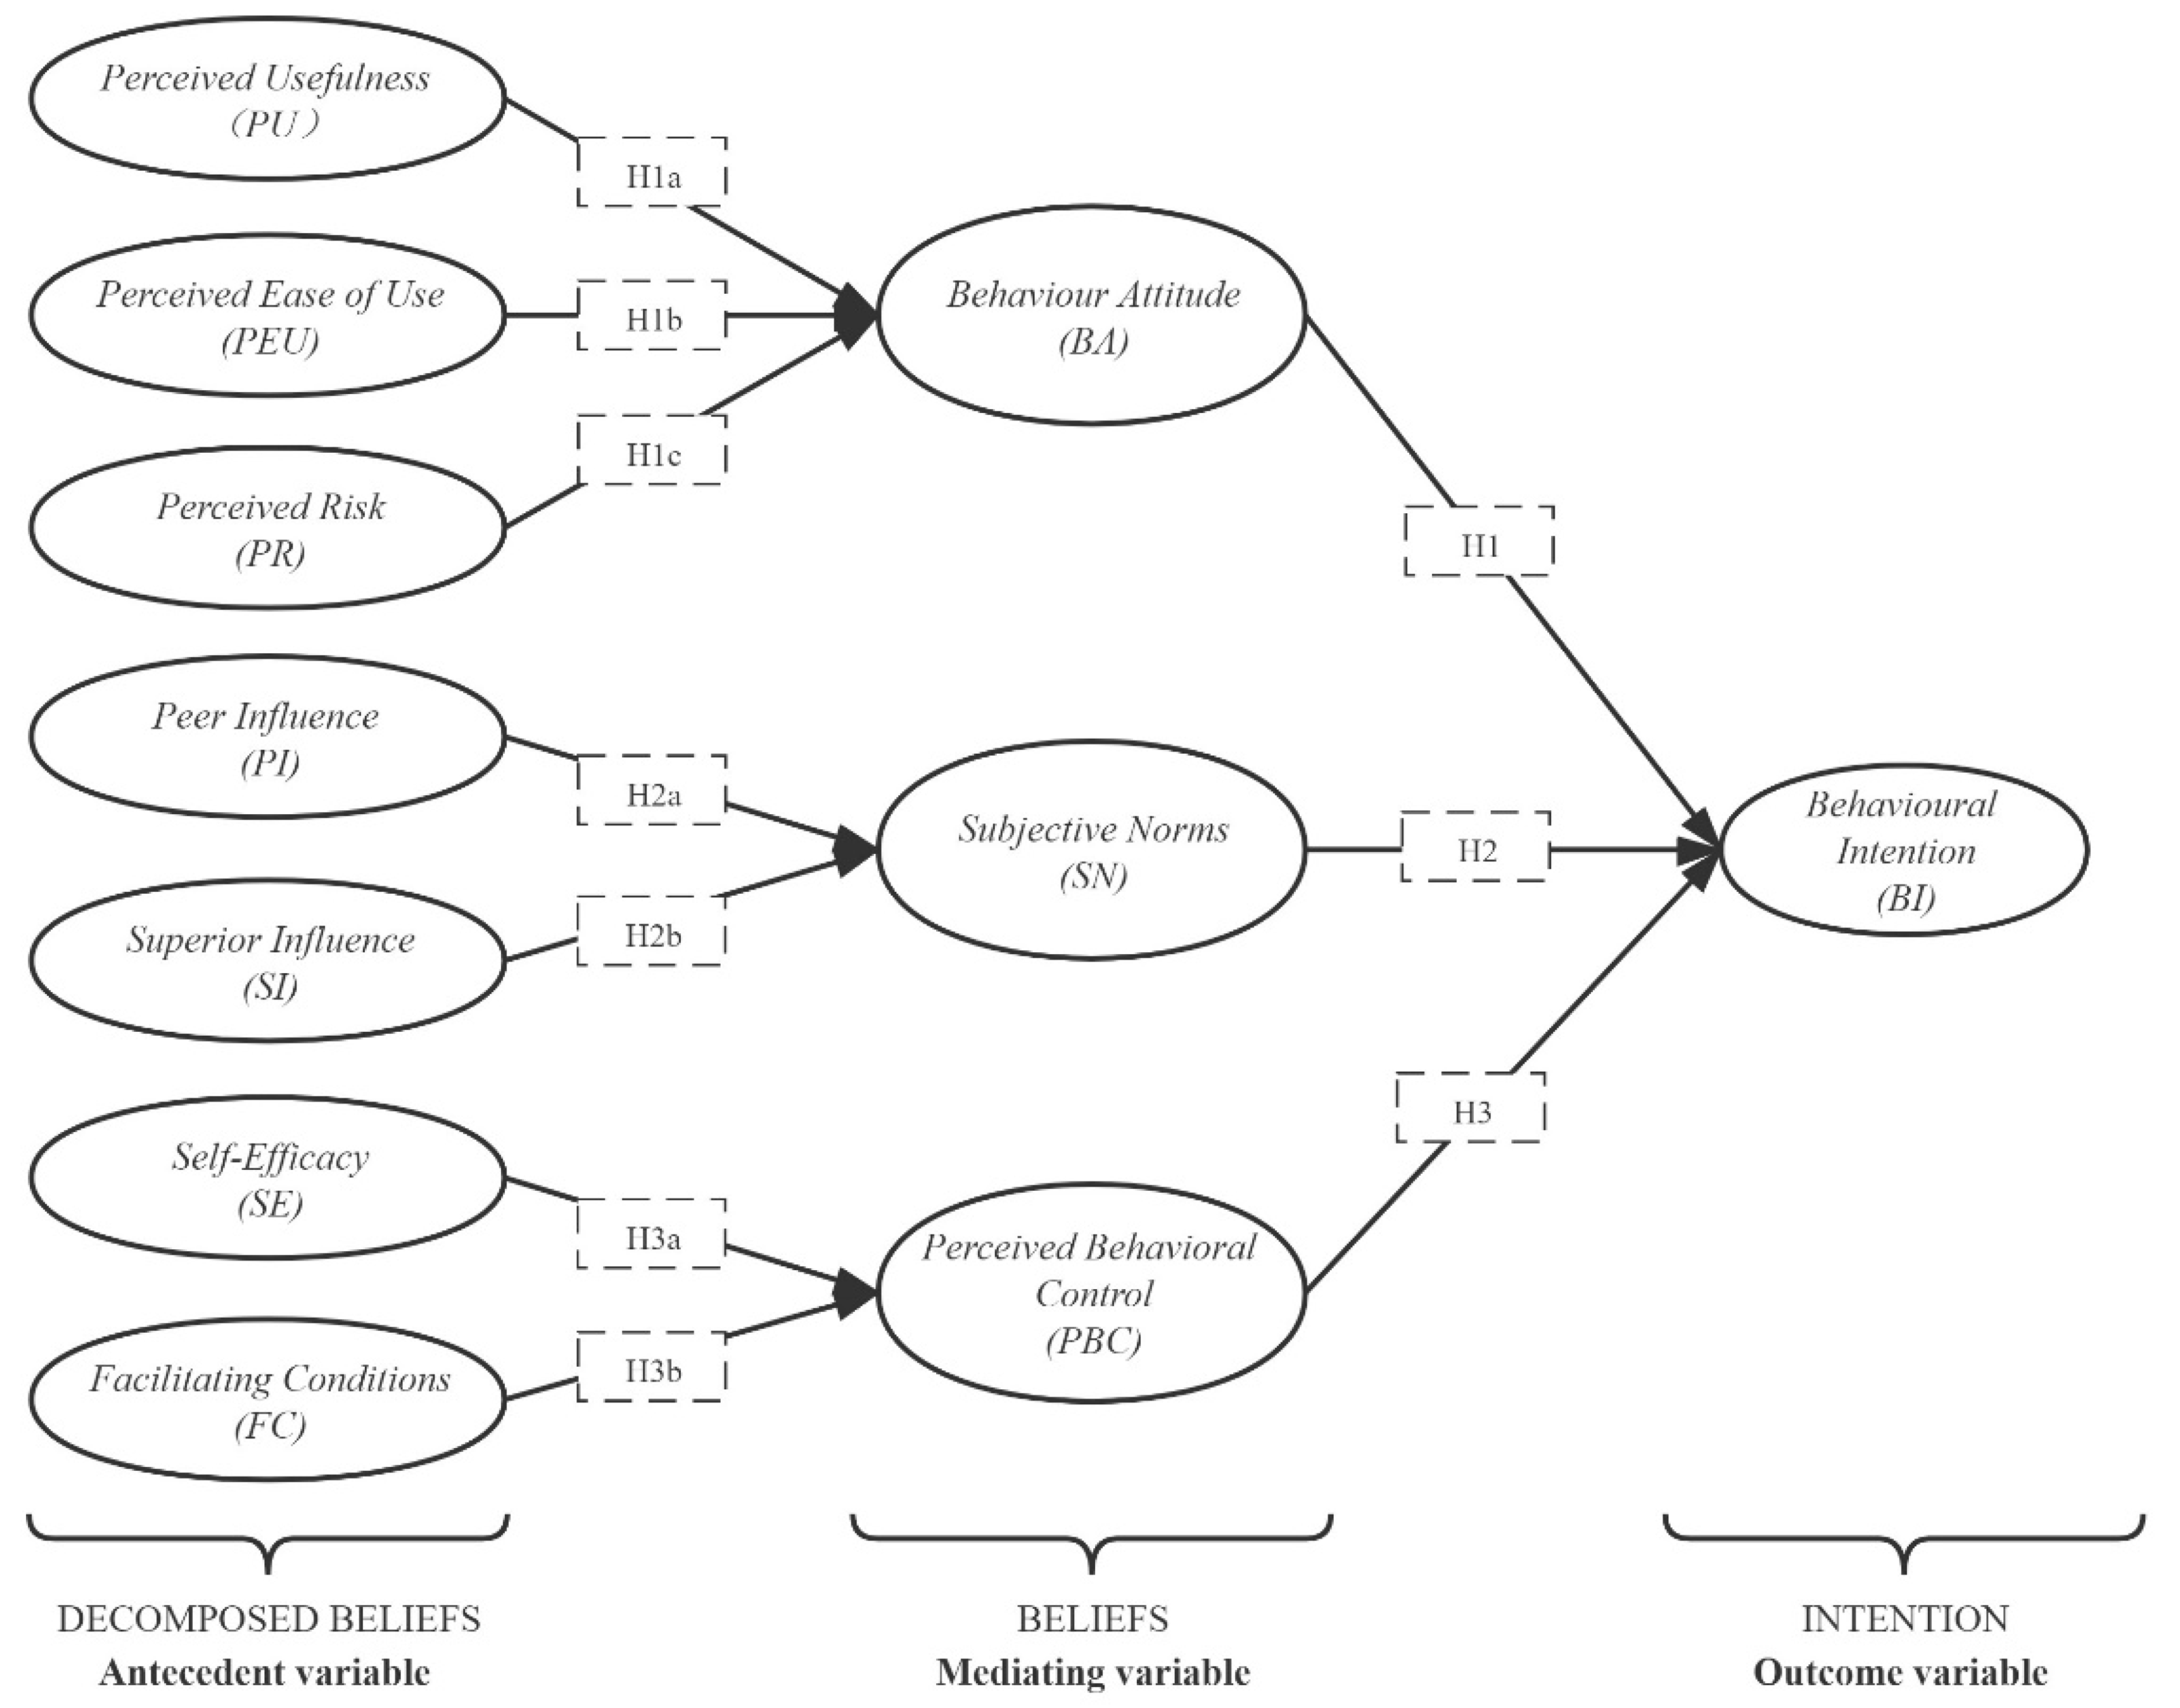
2.3. Decomposed Theory of Planned Behavior

The DTPB is a type of SP survey method that uses behavior intention (BI) to measure public acceptance of and willingness to use new technologies. The DTPB suggests that BI can have a direct effect on an individual’s behavior. It means that a strong intention to perform a certain behavior indicates that an individual is more likely to perform that behavior [48]. Meanwhile, the DTPB assumes that BI is determined by three main constructs: behavioral attitude (BA), subjective norm (SN), and perceived behavioral control (PBC) [49]. These three components are expressed in behavioral decision contexts as behavioral beliefs, normative beliefs, and control beliefs. BA is an individual’s evaluation of a particular behavior [50]. SN specifically refers to the expectations that the individual perceives from the surrounding group, which may have a significant influence on the individual when making a certain behavioral decision [51]. PBC is a person’s perception of the ease or difficulty of performing a particular behavior. It is mainly expressed in the perceived ability of the individual to control the required resources and opportunities [52]. The relationship between BI and the three determinants, BA, SN, and PBC, has been supported by previous research [53]. In the context of the present study, positive feelings toward the use of VF can encourage the public to accept it. Being introduced to the concept by family, relatives, friends, or colleagues, or encouraged by elders or superiors, can influence the public’s behavior toward using VF. Similarly, skills and conditions that facilitate VF can influence the intention to adopt VF. Based on the DTPB model and evidence from the empirical literature, the following are hypothesized:
H1. 
Behavioral attitude (BA) has a positive influence on the public’s behavioral intention (BI) to accept and plant using VF.
H2. 
Subjective norm (SN) has a positive influence on the public’s behavioral intention (BI) to accept and plant using VF.
H3. 
Perceived behavioral control (PBC) has a positive influence on the public’s behavioral intention (BI) to accept and plant using VF.
Behavioral belief refers to the possible results of VF perceived by the public, which is the determinant of BA [54]. Davis used PU and PEU in the TAM, which theorizes that an individual’s perception of system usefulness and ease of use influence his or her attitude toward system usage as well as his or her behavioral intention, which in turn determines system acceptance and its usage [55]. He defined PU as “the degree to which a person believes that using a particular system would enhance his or her job performance” and PEU as “the degree to which a person believes that using a particular system would be free from effort” [55]. In the planting process of vertical agriculture, PU can be redefined as the extent to which people perceive that VF can help them increase their income and improve their indoor environment, and even the extent to which VF plays a role in sustainable urban development; PEU represents the ease of mastering the planting process and operating the VF structure, as well as the convenience of accessing and navigating the intelligent control system. As for the indoor physical environment, VF will also have some negative effects. As well as the benefits, growers should also weigh the adverse effects of VF on their living or working environments.
Based on this, this paper deconstructs the behavioral beliefs into three constructs, PU, PEU, and PR, and selects four indicators to measure planting intention: economic benefits, environmental benefits, operational difficulties, and risk assessment. The higher the benefit of the planting behavior or the easier the grower perceives the planting operation to be, the stronger the attitude of the grower to perform the planting behavior; at the same time, the lower the negative impact of the planting behavior, the more positive the attitude of the grower to perform the planting behavior. Based on this argument, the following hypotheses are proposed:
H1a. 
Perceived usefulness (PU) has a positive influence on the public’s behavioral attitude (BA) to accept and plant using VF.
H1b. 
Perceived ease of use (PEU) has a positive influence on the public’s behavioral attitude (BA) to accept and plant using VF.
H1c. 
Perceived risk (PR) has a negative influence on the public’s behavioral attitude (BA) to accept and plant using VF.
Normative beliefs refer to the public’s perceptions of the expectations of significant others or teams about whether they should participate in planting using VF, which is the determinant of SN [35]. In reality, when the public is unfamiliar with the various outcomes of planting using VF, they rely on the groups around them to form the basis for their own decisions by integrating the voices of all parties, which in turn facilitates the formation of SNs about the public’s willingness to accept and plant using VF. In this study, SN does not focus on social influences on decision making. SI comes from elders at home or leaders at work, whereas PI comes from family, friends, and colleagues [56].
Based on the above analysis, this paper deconstructs normative beliefs into two constructs, PI and SI, and selects five indicators, family, friends, colleagues, elders, and leaders, to measure planting willingness. The more positive encouragement from the surrounding groups, the greater the willingness of the public to engage in planting using VF. The above statement leads to the following hypotheses:
H2a. 
Peer influence (PI) has a positive influence on the public’s subjective norm (SN) to accept and plant VF.
H2b. 
Superior influence (SI) has a positive influence on the public’s subjective norm (SN) to accept and plant VF.
Control belief refers to the factors that the public can perceive during the process of planting VF, which may promote or hinder this behavior [57]. This perception of control consists of two aspects: the internal aspect comes from the public’s perceptions of their own abilities, such as money and time, and the external aspect comes from the influence of the surrounding external forces on the public’s own behavior. In the process of planting, this external force mainly refers to convenience, that is, the sufficient degree of the resources that the public possesses in order to realize planting behavior, such as the VF product sales platform and planting knowledge learning platform, etc.
According to this analysis, this study deconstructs control beliefs into two constructs, SE and FC, corresponding to six indicators of planting knowledge, reserve, risk-aversion ability, time cost–tolerance, financial cost–tolerance, planting information acquisition ability, and product-trading-platform construction. The greater the public’s recognition of their own abilities or the more favorable the external facilitation conditions, the stronger their willingness to plant. The following two hypotheses reflect this position:
H3a. 
Self-efficacy (SE) has a positive influence on the public’s perceived behavioral control (PBC) to accept and plant using VF.
H3b. 
Facilitating conditions (FC) have a positive influence on the public’s perceived behavioral control (PBC) to accept and plant using VF.

2.4. Partial Least Squares Structural Equation Modeling (PLS-SEM)

In recent years, as an important tool for multivariate data analysis, structural equation modeling (SEM) has become a mainstream method in the field of social science research [58]. Based on different research techniques, SEM can be divided into covariance-based structural equation modeling (CB-SEM) [59] and partial least squares structural equation modeling (PLS-SEM) [60]. Recently, PLS-SEM applications have expanded into marketing research and practice with the recognition that PLS-SEM’s distinctive methodological features make it a possible alternative to the more popular CB-SEM approaches [61]. Compared with CB-SEM, PLS-SEM has the following main advantages: (1) it requires fewer samples; (2) it can handle complex models with multiple latent variables; (3) it can handle both reflective and formative indicators; (4) it can handle non-constant information; and (5) it can reduce the impact of multicollinearity on modeling accuracy and reliability [62].
As shown in Figure 1, PLS-SEM consists of two parts. The first part is the measurement model, also known as the external model. The external model assesses the contribution of each indicator in representing its related underlying variables and evaluates the degree to which a set of indicators fits a potential variable. The second part is the structural model, also known as the internal model, which measures the direct and indirect relationships between latent variables [63]. Among them, X1… X4 and Y1… Y3 represent the observed variables, ξ1 and ξ2 are the latent exogenous variables, η1 represents the latent variables, and e1… e7 represent the error terms associated with the observed variables [64]. Among them, the relationships between ξ, X, and e and η, Y, and e can be expressed by Equations (1) and (2), respectively:
ξ = λ X + e
η = λ Y + e
where λ represents the path coefficient. In SEM, the relationship between the observed variable and the latent variable is a linear function; the meaning of the latent variable is reflected in the observed variable, and a change in the latent variable will lead to a change in the observed scalar.
As shown in Figure 2, the basic evaluation process of PLS-SEM is divided into two stages. The first stage evaluates the measurement model and the second stage evaluates the structural model. The measurement model assessment is mainly to test the quality of the theoretical models. Prior to beginning, researchers usually check the indicator loading of each variable. The minimum threshold value for the loadings is 0.70, which indicates that the construct explains over 50% of the indicators’ variances. The structural model assessment covers structural theory, including determining whether structural relationships are important and meaningful and then testing the hypotheses. Consistent with other analytical methods, PLS-SEM relies on empirical rules to evaluate the results estimated by the model. What follows is a discussion and description of the thresholds for each indicator.

2.4.1. Measurement Model Assessment

The first step in the measurement model evaluation involves the assessment of the constructs’ internal consistency reliability. When using PLS-SEM, internal consistency reliability is typically evaluated using composite reliability (CR) and Cronbach’s alpha (CA) [65]. The values of CA and CR of all variables exceeding 0.7 assured reliability in the internal consistency among these constructs. However, CR values higher than 0.95 are considered problematic as they indicate that the items are redundant, leading to issues such as inflated correlations among the indicator error terms [66].
In the second step, the convergent validity of the measured constructs is examined. Convergent validity measures the extent to which a construct converges in its indicators by explaining the items’ variances [67]. Convergent validity is assessed by the average variance extracted (AVE) for all items associated with each construct. In the case of indicator loading and CR higher than 0.7, the recommended value of AVE is 0.50 or higher [68] as it indicates that on average, the construct explains over 50% of the variances in its items.
Once the reliability and convergent validities of the reflective constructs are successfully established, the final step is to assess the discriminant validities of the constructs. Discriminant validity refers to the extent to which a measure is distinct from other measures from which it is supposed to differ [58]. The most conservative criterion recommended to evaluate discriminant validity is the Fornell and Larcker criterion [69]. The method compares each construct’s AVE value with the squared inter-construct correlation of that construct with all other constructs in the structural model [70]. The evaluation criterion is that a construct should not exhibit shared variance with any other construct that is greater than its AVE value [71]. Another approach to assessing discriminant validity is to examine the cross-loadings [71]. The evaluation criterion for this approach is that an indicator variable should exhibit a higher loading on its own construct than on any other construct included in the structural model [71]. If the loadings of the indicators are consistently highest on the construct with which they are associated, then the construct exhibits discriminant validity.

2.4.2. Structural Model Assessment

The next step after having established the constructs’ validities is to examine the causal relationship among the latent constructs. This covers structural theory, which includes determining whether the structural relationships are significant and meaningful and then testing the hypotheses [71]. Prior to this assessment, researchers must test for potential collinearity between the structural model’s predictors. When the values of all variance inflation factors (VIF) are lower than 3.3, it indicates that there is no collinearity problem in the model [72].
The first step of the structural model evaluation is to test the goodness of fit of the model. This study adopted several criteria to assess the PLS-SEM model’s fit, including the standardized root mean square residual (SRMR), the squared Euclidean distance (d-ULS) and the geodesic distance (d-G), and the Normed Fit Index (NFI) [73]. The highest threshold of SRMR is 0.08 [74], whereas the recommended value of NFI is 0.7 and above [75].
Next, one of the important parts of evaluating an SEM is testing the predictive accuracy and predictive relevance of the model [76]. The predictive accuracy is tested using the coefficient of determination (R2 value), which presents the degree of variance explained in each endogenous construct. As explained by Hair et al. [77], a value of R2 ranging between 0 and 1 with a higher value of R2 indicated a higher level of predictive accuracy. Specifically, 0.19, 0.33, and 0.67, respectively, represent the three levels, small, medium, and large prediction accuracies [78]. Another means of assessing a model’s predictive relevance is the Q2, also known as blindfolding [79]. This method is based on the blindfolding procedure of PLS-SEM 3.0. As a rule of thumb, Q2 values greater than zero for a particular endogenous construct indicate that the model’s predictive accuracy is acceptable for that particular construct [71].
Finally, the strength and significance of the path coefficients are evaluated for the relationships hypothesized between the constructs. Generally, the direct and indirect relationships among the constructs are evaluated using regression coefficients (β) [59]. In terms of relevance, β values are standardized on a range from −1 to +1, with coefficients closer to +1 representing strong positive relationships and coefficients closer to −1 indicating strong negative relationships [71]. In addition, the bootstrap procedure was conducted to assess the significance of the β values in the indirect relationships among the constructs based on the t-value and p-value. When the t-value is higher than 1.96 or the p-value is less than 0.05, the path relationship is considered to be significant at the 95% significance level [80,81].

3. Materials and Methods

3.1. Research Framework

Figure 3 shows the workflow of the research that is divided into three parts: theoretical framework, survey, and hypothesis testing. In the first part, the theoretical framework includes three steps. Step A is to build a theoretical model by deconstructing the three dimensions, behavioral, normative, and control beliefs, in the DTPB based on the psychological characteristics of the public’s intentions to use VF. Step B is to determine the variables’ structures and define each variable. Step C is to formulate the hypotheses based on the operational logic of the theoretical model and the variable relationships. Step D focuses on the design, implementation, and data collection of the online survey. Finally, in Step E, the data are statistically analyzed to verify the hypotheses. This part includes the descriptive analysis, measurement model evaluation, and structural model evaluation.
The study was approved by the institutional review board of Nanjing Tech University, China. All participants provided written informed consent.

3.2. Theoretical Model

In view of the psychological basis and characteristics of the public’s intention to use vertical agricultural planting, this paper decomposed the three structures of BA, SN, and PBC into the DTPB model and divided them into seven levels: benefit, ease of use, risk, superior, partner, self, and outside. The specific model is shown in Figure 4. The measurement instrument was developed based on the original instrument used by Ahmed [82] for DTPB constructs and adapting the items to the context of VF. Among the constructs that affect BA, perceived risk (PR) was introduced into the model in conjunction with the specific context of VF, together with perceived usefulness (PU) and perceived ease of use (PEU) to constitute the behavioral beliefs [83]. Normative beliefs maintained the structure of the original model, retaining the two constructs of peer influence (PI) and superior influence (SI) [84]. PBC was divided into two constructs, self-efficacy (SE) and facilitating conditions (FC) [54].
As shown in Figure 4, the model framework established in this study is mainly based on the antecedent variables PU, PEU, PR, PI, SI, SE, and FC, the intermediary variables BA, SN, and PBC, and the outcome variable BI. Each variable and construct were defined, as summarized in Table 1.

3.3. Survey

The questionnaire consisted of four parts. Since VF is a relatively new concept to most consumers, to avoid any uncertainty or ambiguity about the term, information about it was provided in the first part of the questionnaire, including the definition, types, advantages, current problems, and cost-effectiveness. The second part was designed to check whether respondents fully understand the information given in the first part by asking a few clear questions as a preliminary test. Only if a respondent answered all the questions correctly were his questionnaire results retained for subsequent analysis. In the third part, respondents’ sociodemographic characteristics were collected including gender, age, education level, and annual household income. The last part of the questionnaire mainly focused on consumer attitudes and willingness to adopt VF, including acceptance, willingness to plant, and willingness to purchase. It consisted of 33 questions (see Table 1) corresponding to the 11 variables in the theoretical model. The questionnaire structure was measured using a 5-point Likert scale [96] ranging from strongly disagree (1) to strongly agree (5) to record respondents’ responses.
Before the large-scale questionnaire, three experts were pre-tested to determine the wording and order of the questions. After some modifications, a pilot survey was conducted with 30 respondents to ensure the clarity of the questions. After that, an online survey was initiated. In order to encourage respondents to complete the survey, they were informed that they could enter a lucky draw with a cash bonus after answering all the questions.
The questionnaire was distributed online from 10 February to 16 February 2021, and a total of 4065 questionnaires were returned, of which 987 passed the preliminary test and 61.5% had heard of the concept of VF. After excluding incomplete questionnaires and those with a high repetition rate of answers, the number of valid questionnaires was 740, and the effectiveness of the questionnaire was calculated to be 75.0%.

3.4. Data Analysis

SPSS22.0 was used for statistical analysis of the data collected from the survey. The data analysis process was divided into two parts: (1) descriptive analysis and (2) structural equation model analysis. In terms of the descriptive analysis, it mainly investigated the differences in the acceptance and willingness to adopt VF among people of different groups categorized by gender, age, educational level, annual household income, and living area. The main methods included descriptive statistics, variance analysis, and Least Significant Difference (LSD) [97]. In terms of the structural equation model analysis, the DTPB, which contains a third-order structure, was selected as the theoretical model. In order to reduce the influence of multicollinearity on modeling accuracy and reliability, the PLS-SEM was applied. SmartPLS 3.0 was used to evaluate the measurement model and the structural model, and the main evaluation method was the path analysis method. The correlation between different variables can be measured by the path correlation coefficient, or the mutual influence or causal effect relationship between the different variables can be directly judged using the calculation of the path correlation coefficient. The workflow of the PLS-SEM has been shown in Figure 2 and Section 2.3.

4. Results

4.1. Descriptive Statistics

The sociodemographic characteristics of the respondents are shown in Table 2. First, the ratio of male to female respondents is close to 3:2, with more respondents being male (60.8%). Second, more than 70% of people are under 30 years old and more than 90% are under 40 years old. The surveyed population has a relatively high level of education, with 64.5% of them having a bachelor’s degree or above. In addition, the survey shows that 63.3% of respondents have an annual household income of more than CNY 80,000, reaching the level of well-off and above.

4.1.1. The Overall Level of the Public’s Intentions to Plant Using VF

The overall mean of the public’s intentions to plant using VF is 3.90, and the means (M) of the three dimensions are between 3.49 and 3.83, all of which are above neutral (M = 3.00) but not relatively positive (M = 4.00). The mean values of each dimension from highest to lowest are “behavioral attitude” (M = 3.83), “subjective norm” (M = 3.73), and “perceived behavioral control” (M = 3.49). This shows that the general public has a positive attitude toward planting using VF but that there are also some concerns.
After further analysis of the internal indicators of each dimension, it is found that the public’s intentions to plant using VF are not balanced in each dimension. First of all, in terms of “behavioral attitude”, the average value of “perceived usefulness” (M = 4.26) is higher than the average of the “behavioral attitude” dimension (M = 3.83), and the overall average of “planting intention” (M = 3.90); The mean values of the indicators of “perceived ease of use” (M = 3.77) and “perceived risk” (M = 3.43) were lower than the mean of the dimension of “behavioral attitude” (M = 3.83) and also lower than the overall mean of “planting intention” (M = 3.90). This shows that public attitudes toward the usefulness of VF are very positive, which is an important factor in people’s willingness to engage in planting behavior. On the contrary, the VF planting process is considered to be complex and its complexity is also an important factor that restricts people’s planting behavior. In addition, people’s perceptions of the negative effects of VF are not significant.
Second, in terms of “subjective norms”, the mean values of “peer influence” (M = 3.83) and “superior influence” (M = 3.82) are both higher than the mean value of the “subjective norm” dimension (M = 3.73) but lower than the overall mean value of “planting intention” (M = 3.90). This suggests that the opinions of surrounding people can influence, but not determine, whether or not people plant using VF.
Finally, the mean of the “perceived behavioral control” dimension (M = 3.49) was significantly lower than the other two dimensions and the overall mean of “planting intention” (M = 3.90). Among them, the mean values of “self-efficacy” and “facilitating conditions” are 3.43 and 3.77, respectively. This indicates that “self-efficacy”, that is, people’s evaluations of their own abilities such as time and money, is an important factor that restricts their intention to plant using VF.

4.1.2. Multidimensional Differences in the Public’s Intentions to Use VF

(1)
Gender: The independent sample t-test results (Table 3) show that there are no significant differences between the different gender groups in behavioral intention, behavioral attitude, and subjective norms. Although there is a statistically significant difference in perceived behavioral control, the differences in the mean values are small.
(2)
Age: There are significant differences among the different age groups. The LSD multiple comparison method was used for post hoc testing and the specific data are shown in Table 4. Generally, the intention to use VF is an approximate normal distribution, with the highest value in the 31–40 aged group.
(3)
Education: The results show statistically significant differences among people with different educational levels (Table 5). The planting intentions of the group with a junior college degree, followed closely by the group with bachelor’s degrees, are slightly higher than the other groups.
(4)
Annual household income: The results (Table 6) show that there is no significant difference among people with different annual household income levels.
(5)
Living area: The results show significant differences among people in different living areas (Table 7). People living in the metropolis show higher intentions than those living in ordinary cities, towns, and villages. This indicates that there is a positive relationship between the density of the living environment and people’s intentions to use VF.

4.2. Measurement Model Assessment Results

First, the internal consistency between the components in each latent variable is checked using Cronbach’s alpha (CA) and composite reliability (CR). Table 8 shows that the CA values of all constructs are between 0.734 and 0.866, which are all higher than the minimum threshold of 0.70 proposed by Nunnally [98]. The CR values of all latent variables are between 0.85 and 0.924, which exceeds the minimum threshold of 0.70 and is lower than the maximum threshold of 0.95. The results from this work meet the minimum thresholds and do not exceed the highest threshold, indicating good convergent validity.
Next, the convergence validity of the questionnaire was checked. As shown in Table 3, the lowest indicator loading of 0.714, the lowest CR value of 0.85, and the lowest AVE value of 0.628 in this study satisfy the minimum threshold, indicating good convergent validity.
Finally, the discriminant validity of the questionnaire was checked. As shown in Table 9, the square root of the average variance extracted (AVE) for each latent variable is higher than the inter-construct correlation, providing sufficient evidence of discriminant validity for the constructs. In addition, the results of cross-loading are shown in Table 10. All the loadings of the indicators are consistently highest on the construct with which they are associated. Therefore, the evaluation of discriminant validity among the constructs satisfied the requirements.
In summary, the evaluations of the measurement model regarding internal consistency reliability, convergent validity, and discriminant validity all met their requirements, empirically validating the suitability of the measurement model in this study.

4.3. Structural Model Evaluation Results

After verifying the reliability and validity of the measurement model, the next step was to analyze the structural model to test the hypothetical relationship. First, to ensure that there was no multicollinearity problem, the VIF of the model was checked. The results show that the tolerance level in the measurement model construction is between 1.338 and 2.697, which is lower than the critical level of 3.3, indicating that no multicollinearity problem exists.
Next, the model’s goodness-of-fit was checked. The results show that the values of the selected model’s fit indicators basically satisfy the recommended values. For example, the SRMR = 0.058, which is lower than the threshold value of 0.08, and the NFI = 0.778, which is higher than the threshold value of 0.7. In addition, the d-ULS = 1.897 and the d-G = 0.714, which indicate that the goodness of fit of the structural model meets the requirements.
The results of the assessment of the prediction correlation are shown in Figure 5. The R2 value of BA is 0.314 (>0.19), which indicates an average prediction accuracy. Considering the high number of potential variables of BA, its prediction accuracy is acceptable; the R2 values of SN, PBC, and BI range from 0.496 to 0.644 (>0.33), which indicates a high level of prediction accuracy. Another method for assessing the predictive relevance is Q2 and the results are shown in Table 11, where the Q2 values of all the constructs are greater than zero, which indicates that the model proposed in this study has sufficient predictive relevance.
The final step in the structural model evaluation is to evaluate the path relationships. Table 12 shows that all the proposed hypotheses presenting direct relationships among the constructs were empirically supported, with all t-values being more than 2.067 at the significance level of 0.05. The results indicate that the exogenous variables have strong relationships with the endogenous variables, i.e., the paths were statistically significant and support the model.

5. Discussions

5.1. Conclusion of the Data Analysis

In terms of the descriptive analysis, the general public’s overall intention to use VF is generally above ‘neutral’ but slightly below ‘positive’. At the same time, differences in the age, education level, and living area of the public significantly affect their intentions to use VF. However, there are no significant differences in the intentions to use VF among people of different genders and annual household incomes. Overall intention is the highest among those aged 31–40 with a college degree and living in metropolitan areas. Among them, intention is approximately normally distributed with age and education level, and the middle-aged and middle-educated groups have the strongest intentions. Urban residents show higher enthusiasm toward VF than those living in the countryside. At the same time, the results of this part of the analysis show that perceived behavioral control, that is, people’s assessments of their own abilities, are the key factor limiting their intentions. In this survey, 77.7% of the 4065 returned questionnaires had heard of the concept of vertical farming. However, only 789 questionnaires passed the preliminary test. This suggests that people’s knowledge of VF is not rich enough to play a key role in their planting decisions. Better publicity and popularization of VF could help to improve public acceptance and willingness to use VF.
In terms of the structural equation model analysis, the results show the applicability of the DTPB in research into the intention to use VF. The evaluations of the measurement model and the structural model showed the theoretical adequacy of the hypothetical model. In the proposed model, BI has three direct predictors: behavioral attitude (BA), subjective norm (SN), and perceived behavioral control (PBC). The results show that all these predictors have a significant impact on BI with an R2 value of 0.569. R2 represents the prediction accuracy of the model, and higher values indicate a higher prediction accuracy. As mentioned above, the values 0.19, 0.33, and 0.67 represent the three levels of low, medium, and high prediction accuracies, respectively. This means that BA, SN, and PBC have 56.9% explanatory power for BI with an above-medium prediction accuracy [78]. The results of the path analysis showed that BA (β = 0.405), SN (β = 0.127), and PBC (β = 0.311) have significant effects on behavioral intention. Among them, BA has the most important influence on BI, followed by PBC, whereas SN has a weaker effect.
In the BA dimension, perceived usefulness (PU) is the strongest factors in determining BA (β = 0.406), followed by perceived ease of use (PEU) (β = 0.247) and perceived risk (PR) (β = −0.084). This indicates that people think that VF has more advantages than disadvantages for daily life and that they are not worried about the side effects of VF. For PU, the path coefficients of the two variables PU1 and PU4 representing the economic benefits are 0.827 and 0.789, respectively, which are higher than the path coefficients of PU2 (0.768) and PU3 (0.785) representing the environmental benefits. This suggests that compared with the environmental benefits, the economic benefits of VF are more attractive. When planting behavior can bring more economic benefits, people’s planting intentions can be improved. From this perspective, although micro-VF in mixed-use spaces could bring a lot of added value, how to improve the yield and reduce the costs are still the first things that people will consider. In addition, PEU also has a significant impact on people’s attitudes. Simplifying the planting process by equipping it with intelligent monitoring and control systems and even developing VF using an automatic mode in the future, could attract more people to participate in VF activities.
In the SN dimension, the two factors of SN, superior influence (SI) and peer influence (PI), explained 49.6% of the variance in SN, which is statistically significant. The path analysis results for each of the determinants of SN revealed that both SI (β = 0.336) and PI (β = 0.416) have a significant positive effect on SN. This indicates that public acceptance of VF is influenced by the opinions of the people around them and that the opinions of superiors are more influential for them to make decisions. In PI, the path coefficients reflecting the importance of the opinions of family members (PI1), colleagues (PI2), and friends (PI3) are all greater than 0.85, indicating that the public has a certain herd mentality when making decisions Similarly, in the influence of superiors, the results of the path analysis showed that both elders (SI1, β = 0.857) and leaders (SI2, β = 0.840) had a significant influence on the decision-making behavior of the public.
Finally, in the PBC dimension, the two factors, facilitating conditions (FC) and self-efficacy (SE), were statistically significant (64.4%). The path analysis results show that SE (β = 0.651) has a greater influence than FC (β = 0.199). It shows that in the decision-making process, the public are more obviously affected by their own knowledge and skills related to VF. In terms of FC, the least trusted was the intelligent control capability of VF (FC1, β = 0.802). This indicates that the public considers that the intelligent control system of VF is still not reliable and user friendly enough for them. Further studies and technical improvements to the control system are needed.

5.2. Comparison with Previous Related Studies

It may be a huge challenge for urban VF extension research to predict public acceptance and willingness to use VF, and few substantive attempts have been made to date. The most relevant study is by Jürkenbeck et al. [99], which used TAM to investigate consumer acceptance of the three VF systems. The results indicated that perceived sustainability is the major driver of German consumers’ acceptance of VF systems and that the “indoor vertical farm” is the most acceptable system for people. In contrast, in this study, perceived usefulness and facilitating conditions were the most important driving forces affecting Chinese consumers. Grebitus et al. [100] investigated the likelihood of consumers buying or growing food on urban farms. The study showed that subjective knowledge about urban agriculture and overall favorable attitudes toward urban farms increased the possibility that consumers would buy and grow produce on urban farms. In addition, women and older consumers are more likely to grow on urban farms. In this study, gender has little effect on acceptance and people aged 31–40 were more inclined to plant using VF. Suárez-Cáceres et al. [101] studied the knowledge, attitudes, and willingness to pay for aquaponics products among consumers in Spain and Latin America. The study showed that the quality, taste, and absence of pesticides or chemical residues of the products for aquaponics systems were the main purchasing motivations for consumers. In contrast, household income, concern for the environment, and a priori knowledge of aquaponics had a significant effect on the willingness to pay higher prices. However, in this study, the effect of household annual income on VF intention is not significant. At present, consumers from different countries and regions have different understandings, views, and concerns about VF. Future studies on this issue are also important for the worldwide research and development of VF.

5.3. Limitations and Future Research Direction

This study is a new attempt in the research of VF and there are still some limitations in the following aspects. First, the survey was conducted within mainland China; in comparison, consumer behavior may vary across countries and regions. Future researches need to be expanded to investigate aspects specific to other geographical locations and cultural regions to gain more insight into this topic. Second, this study used the behavior-based DTPB model to predict public acceptance and willingness to use VF. Apart from the DTPB model, there are other higher-order models, such as the Task-Technology Fit (TTF) [102] or the Unified Theory of Acceptance and Use of Technology (UTAUT) [103], to be explored. In addition, research on the driving forces of consumers to buy food is also of great significance. Research showed that local food production, naturalness, ethics, and contextual factors, e.g., price and availability, are important aspects that consumers consider when purchasing food [104]. Flores et al. [105] reported that consumers are more willing to pay for locally produced food than for products that are produced further away or do not have any clear origin markings. Better quality and taste, safety, and easier traceability are important driving factors for people in choosing to purchase local food. This study does not address these factors and future research could investigate these issues.

6. Conclusions

In this paper, public acceptance and willingness to plant using VF were investigated using the DTPB model. This study selected behavioral intention (BI) to assess to public willingness to use VF and hypothesized that behavioral attitude (BA), subjective norm (SN), and perceived behavioral control (PBC) directly influence BI. Then BA, SN, and PBC were deconstructed separately and it was hypothesized that the deconstructed factors have indirect effects on BI. Finally, the proposed hypotheses were tested by evaluating the measurement model and structural model using PLS-SEM as the data analysis method. The key findings are given as follows:
  • The level of the public’s attitudes and behavioral intentions toward micro-VF is better than “neutral” but slightly less than “positive”.
  • The results of the structural model evaluation showed that the proposed original hypotheses were all supported, that is, that the factors that influence public acceptance and willingness to plant using VF are behavioral attitude (perceived usefulness, perceived ease of use, and perceived risk), subjective norm (peer influence, superior influence), and perceived behavioral control (self-Efficacy, facilitating conditions). Among them, the most critical factors are the cost-effectiveness of VF and the consumption of time and money required for the planting process.
  • The biggest motivation for the public to engage in micro-VF is the possible economic benefits (β = 0.406). On the contrary, the biggest obstacle is the general lack of knowledge about VF and the unfamiliarity with its growing process and other expertise.
  • Further improving the cost-effectiveness of VF, simplifying the growing process, and enhancing the dissemination and popularization of professional knowledge are important research directions for the subsequent promotion of VF.

Author Contributions

Conceptualization, Y.S. and Z.W.; methodology, Y.S., Z.W. and Y.C.; software, Z.Z. (Zhiwei Zhou); validation, Z.W., Z.Z. (Zhiwei Zhou) and Y.C.; formal analysis, Z.Z. (Zhiwei Zhou) and H.C.; investigation, Y.S., Z.W., Z.Z. (Zhiwei Zhou) and H.C.; resources, Y.S.; data curation, Z.Z. (Zhenghuan Zhou), Z.Z. (Zhiwei Zhou) and H.C.; writing—original draft preparation, Y.S.; writing—review and editing, Z.W., Z.Z. (Zhiwei Zhou), and Y.C.; visualization, Z.Z. (Zhiwei Zhou); supervision, Y.S.; project administration, Y.S.; funding acquisition, Y.S. All authors have read and agreed to the published version of the manuscript.

Funding

This work was supported by the National Natural Science Foundation of China (grant number 51708283); the Natural Science Foundation of Jiangsu Province (grant number BK20171011), and the Postgraduate Research & Practice Innovation Program of Jiangsu Province (grant number KYCX22_1359).

Institutional Review Board Statement

Ethical review and approval were waived for this study because the online survey does not include any content that may have any potentially harmful effects to the participants.

Informed Consent Statement

Informed consent was obtained from all subjects involved in the study. Written informed consent has been obtained from the participants to publish this paper.

Data Availability Statement

The data presented in this study are available on request from the corresponding author.

Conflicts of Interest

The authors declare that they have no known competing financial interests or personal relationships that could have appeared to influence the work reported in this paper.

Nomenclature

DTPBDeconstructed Theory of Planned Behavior
BIBehavioral Intention
PLS-SEMPartial least squares structural equation modeling
BABehavioral Attitude
SNSubjective Norm
PBCPerceived Behavioral Control
PUPerceived Usefulness
PEUPerceived Ease of Use
PIPeer Influence
SISuperior Influence
SESelf-Efficacy
FCFacilitating Conditions
R2Coefficient of determination
HHypothesis
βRegression coefficients
TRATheory of Reasoned Action
TPBTheory of Planned Behavior
IDTDiffusion of Innovation Theory
CB-SEMCovariance-based structural equation modeling
SRMRStandardized root means square residual
VIFVariance inflation factor
d-ULSSquared Euclidean distance
d-GGeodesic distance
NFINormed fit index
CRComposite reliability
CACronbach’s Alpha
AVEAverage variance extracted
Q2Predictive relevance
VFVertical Farming
LSDLeast—Significant Difference

References

  1. Besthorn, F.H. Vertical Farming: Social Work and Sustainable Urban Agriculture in an Age of Global Food Crises. Aust. Soc. Work. 2013, 66, 187–203. [Google Scholar] [CrossRef]
  2. La Rosa, D.; Barbarossa, L.; Privitera, R.; Martinico, F. Agriculture and the city: A method for sustainable planning of new forms of agriculture in urban contexts. Land Use Policy 2014, 41, 290–303. [Google Scholar] [CrossRef]
  3. Despommier, D. The Rise of Vertical Farms. Sci. Am. 2009, 301, 80–87. [Google Scholar] [CrossRef]
  4. Marris, E. The Vertical Farm: Feeding the World in the 21st Century. Nature 2010, 468, 374. [Google Scholar] [CrossRef] [Green Version]
  5. Malochleb, M. Vertical farming to gain ground. Food Technol. Chic. 2019, 73, 10–11. [Google Scholar]
  6. Despommier, D. The vertical farm: Controlled environment agriculture carried out in tall buildings would create greater food safety and security for large urban populations. J. Fur Verbrauch. Lebensm. 2011, 6, 233–236. [Google Scholar] [CrossRef]
  7. Al-Kodmany, K. The Vertical Farm: A Review of Developments and Implications for the Vertical City. Buildings 2018, 8, 24. [Google Scholar] [CrossRef] [Green Version]
  8. Al-Chalabi, M. Vertical farming: Skyscraper sustainability? Sustain. Cities Soc. 2015, 18, 74–77. [Google Scholar] [CrossRef]
  9. Vaughan, A. Is vertical farming the way to a greener life? New Sci. 2019, 242, 15. [Google Scholar] [CrossRef]
  10. Shao, Y.; Li, J.; Zhou, Z.; Hu, Z.; Zhang, F.; Cui, Y.; Chen, H. The effects of vertical farming on indoor carbon dioxide concentration and fresh air energy consumption in office buildings. Build. Environ. 2021, 195, 107766. [Google Scholar] [CrossRef]
  11. Langemeyer, J.; Madrid-Lopez, C.; Mendoza Beltran, A.; Villalba Mendez, G. Urban agriculture—A necessary pathway towards urban resilience and global sustainability? Landsc. Urban Plan. 2021, 210, 104055. [Google Scholar] [CrossRef]
  12. Wong, C.E.; Zhi, W.; Shen, L.; Yu, H. Seeing the lights for leafy greens in indoor vertical farming. Trends Food Sci. Tech. 2020, 106, 48–63. [Google Scholar] [CrossRef]
  13. Santini, A.; Bartolini, E.; Schneider, M.; Vinicius, G.D.L. The crop growth planning problem in vertical farming. Eur. J. Oper. Res. 2021, 294, 377–390. [Google Scholar] [CrossRef]
  14. Li, Y.; Wang, C.; Zhu, S.; Yang, J.; Wei, S.; Zhang, X.; Shi, X. A Comparison of Various Bottom-Up Urban Energy Simulation Methods Using a Case Study in Hangzhou, China. Energies 2020, 13, 4781. [Google Scholar] [CrossRef]
  15. Shao, Y.; Li, J.; Zhou, Z.; Zhang, F.; Cui, Y. The Impact of Indoor Living Wall System on Air Quality: A Comparative Monitoring Test in Building Corridors. Sustainability 2021, 13, 7884. [Google Scholar] [CrossRef]
  16. Safikhani, T.; Abdullah, A.M.; Ossen, D.R.; Baharvand, M. A review of energy characteristic of vertical greenery systems. Renew. Sustain. Energy Rev. 2014, 40, 450–462. [Google Scholar] [CrossRef]
  17. Kalantari, F.; Tahir, O.M.; Joni, R.A.; Fatemi, E. Opportunities and Challenges in Sustainability of Vertical Farming: A Review. J. Landsc. Ecol. 2018, 11, 35–60. [Google Scholar] [CrossRef] [Green Version]
  18. Yusof, S.; Thamrin, N.M.; Nordin, M.K.; Yusoff, A.; Sidik, N.J. Effect of artificial lighting on typhonium flagelliforme for indoor vertical farming. In Proceedings of the 2016 IEEE International Conference on Automatic Control and Intelligent Systems (I2CACIS), Shah Alam, Malaysia, 22 October 2016. [Google Scholar]
  19. Touliatos, D.; Dodd, I.C.; McAinsh, M. Vertical farming increases lettuce yield per unit area compared to conventional horizontal hydroponics. Food Energy Secur. 2016, 5, 184–191. [Google Scholar] [CrossRef] [Green Version]
  20. Tan Gar Heng, A.; Bin Mohamed, H.; Bin Mohamed Rafaai, Z.F. Implementation of lean manufacturing principles in a vertical farming system to reduce dependency on human labour. Int. J. Adv. Trends Comput. Sci. Eng. 2020, 9, 512–520. [Google Scholar] [CrossRef]
  21. Shao, Y.; Heath, T.; Zhu, Y. Developing an economic estimation system for vertical farms. Int. J. Agric. Environ. Inf. Syst. 2016, 7, 26–51. [Google Scholar] [CrossRef]
  22. Zhang, H.; Asutosh, A.; Hu, W. Implementing Vertical Farming at University Scale to Promote Sustainable Communities: A Feasibility Analysis. Sustainability 2018, 10, 4429. [Google Scholar] [CrossRef] [Green Version]
  23. Avgoustaki, D.D.; Xydis, G. Indoor Vertical Farming in the Urban Nexus Context: Business Growth and Resource Savings. Sustainability 2020, 12, 1965. [Google Scholar] [CrossRef] [Green Version]
  24. Graff, G. Skyfarming. In Bachelor Type; University of Waterloo: Waterloo, ON, Canada, 2011. [Google Scholar]
  25. Pascual, M.P.; Lorenzo, G.A.; Gabriel, A.G. Vertical Farming Using Hydroponic System: Toward a Sustainable Onion Production in Nueva Ecija, Philippines. Open J. Ecol. 2018, 8, 25–41. [Google Scholar] [CrossRef] [Green Version]
  26. Khalil, H.I.; Wahhab, K.A. Advantage of vertical farming over horizontal farming in achieving sustainable city, Baghdad city-commercial street case study. IOP Conf. Ser. Mater. Sci. Eng. 2020, 745, 12115–12173. [Google Scholar] [CrossRef]
  27. Mo, Z.; Bonenberg, W.; Xia, W.; Liu, S. How Vertical Farming Influences Urban. Landscape Architecture and Sustainable Urban. Developments. In Proceedings of the International Conference on Applied Human Factors and Ergonomics, Orlando, FL, USA, 22–26 July 2018. [Google Scholar]
  28. Baliga, S.; Vohra, R. Market Research and Market Design. Adv. Theor. Econ. 2010, 3, 1059. [Google Scholar] [CrossRef] [Green Version]
  29. Compeau, D.R.; Higgins, C.A.; Huff, S.L. Social cognitive theory and individual reactions to computing technology. MIS Q. 1999, 23, 145–158. [Google Scholar] [CrossRef]
  30. Ajzen, I. Theory of reasoned action. Cloth. Text. Res. J. 2000, 25, 244–257. [Google Scholar]
  31. Botetzagias, I.; Dima, A.F.; Malesios, C. Extending the theory of planned behavior in the context of recycling: The role of moral norms and of demographic predictors. Resour. Conserv. Recycl. 2015, 95, 58–67. [Google Scholar] [CrossRef] [Green Version]
  32. Papaoikonomou, K.; Latinopoulos, D.; Emmanouil, C.; Kungolos, A. A Survey on Factors Influencing Recycling Behavior for Waste of Electrical and Electronic Equipment in the Municipality of Volos, Greece. Environ. Processes 2020, 7, 321–339. [Google Scholar] [CrossRef]
  33. Shih, Y.; Fang, K. The use of a decomposed theory of planned behavior to study Internet banking in Taiwan. Internet Res. 2004, 14, 213–223. [Google Scholar] [CrossRef] [Green Version]
  34. Hill, R. Belief, Attitude, Intention and Behavior: An Introduction to Theory and Research.by Martin Fishbein; Icek Ajzen. Contemp. Sociol. 1977, 6, 244–245. [Google Scholar] [CrossRef]
  35. Ajzen, I. The theory of planned behavior. Organ. Behav. Hum. Dec. 1991, 50, 179–211. [Google Scholar] [CrossRef]
  36. Davis, V.F.D. A Theoretical Extension of the Technology Acceptance Model: Four Longitudinal Field Studies. Manag. Sci. 2000, 46, 186–204. [Google Scholar]
  37. Taylor, S.; Todd, P.A. Understanding Information Technology Usage: A Test of Competing Models. Inf. Syst. Res. 1995, 6, 144–176. [Google Scholar] [CrossRef]
  38. Chang, I.C.; Chou, P.C.; Yeh, K.J.; Tseng, H.T. Factors influencing Chinese tourists’ intentions to use the Taiwan Medical Travel App. Telemat. Inform. 2016, 33, 401–409. [Google Scholar] [CrossRef]
  39. Poston, D.L.; Jing, S. Women entrepreneurship in relation to psychological demographic and socioeconomic Attributes. Popul. Dev. Rev. 2012, 13, 703. [Google Scholar] [CrossRef]
  40. Eleonora, P.; Di, P.L. Understanding Consumer’s Acceptance of Technology-Based Innovations in Retailing. J. Technol. Manag. Innov. 2012, 7, 1–19. [Google Scholar]
  41. Annunziata, A.; Scarpato, D. Factors affecting consumer attitudes towards food products with sustainable attributes. Agric. Econ. 2014, 60, 353–363. [Google Scholar] [CrossRef] [Green Version]
  42. Tacken, M.; Marcellini, F.; Mollenkopf, H.; Ruoppila, I.; Széman, Z. Use and acceptance of new technology by older people: Findings of the international MOBILATE survey ‘Enhancing mobility in later life’. Gerontechnology 2005, 3, 126–137. [Google Scholar] [CrossRef]
  43. Hirobata, Y.; Kawakami, S. Modeling disaggregate behavioral modal switching models based on intention data. Transp. Res. Part. B Methodol. 1990, 24, 15–25. [Google Scholar] [CrossRef]
  44. Stavins, R.N. The Costs of Carbon Sequestration: A Revealed-Preference Approach. Am. Econ. Rev. 1999, 89, 994–1009. [Google Scholar] [CrossRef] [Green Version]
  45. Bateman, I.; Carson, R.; Day, B.; Hanemann, W.; Hanley, N.; Hett, T.; Joneslee, M.; Loomes, G.; Mourato, S.; Ozdemiroolu, E. Economic Valuation with Stated Preference Techniques. Ecol. Econ. 2004, 50, 155–156. [Google Scholar]
  46. Varian, H.R. Revealed preference with a subset of goods. J. Econ. Theory 1988, 46, 179–185. [Google Scholar] [CrossRef] [Green Version]
  47. Adamowicz, W.; Boxall, P.; Williams, M.; Louviere, J. Stated Preference Approaches for Measuring Passive Use Values: Choice Experiments and Contingent Valuation. Am. J. Agric. Econ. 1998, 80, 64–75. [Google Scholar] [CrossRef]
  48. Ajzensupa Supsup Sup, I. The theory of planned behaviour: Reactions and reflections. Psychol. Health 2011, 26, 1113–1127. [Google Scholar]
  49. Shiue, Y.-M. Investigating the Sources of Teachers′ Instructional Technology Use through the Decomposed Theory of Planned Behavior. J. Educ. Comput. Res. 2007, 36, 425–453. [Google Scholar] [CrossRef]
  50. Manstead, A.S.R. Attitudes and Behaviour. Appl. Soc. Psychol. 1996, 20, 3–29. [Google Scholar]
  51. Wetzels, S.M. A meta-analysis of the technology acceptance model: Investigating subjective norm and moderation effects. Inf. Manag. Amster 2007, 44, 90–103. [Google Scholar]
  52. Gellman, M.D.; Turner, J.R. Perceived Behavioral Control; Springer: New York, NY, USA, 2013. [Google Scholar]
  53. Yousafzai, S.Y.; Foxall, G.R.; Pallister, J.G. Technology acceptance: A meta-analysis of the TAM: Part 1. J. Model. Manag. 2007, 2, 251–280. [Google Scholar] [CrossRef]
  54. Taylor, S.; Todd, P. Decomposition and crossover effects in the theory of planned behavior: A study of consumer adoption intentions. Int. J. Res. Mark. 1995, 12, 137–155. [Google Scholar] [CrossRef]
  55. Davis, F.D. Perceived Usefulness, Perceived Ease of Use, and User Acceptance of Information Technology. MIS Q. 1989, 13, 319–340. [Google Scholar] [CrossRef] [Green Version]
  56. Smarkola, C. A Mixed-Methodological Technology Adoption Study; Teo T. Technology Acceptance in Education; Sense Publishers: Rotterdam, The Netherlands, 2011; pp. 9–41. [Google Scholar]
  57. Ajzen, I. From Intentions to Actions: A Theory of Planned Behavior; Springer: Berlin/Heidelberg, Germany, 1985. [Google Scholar]
  58. Hair, J.F. Multivariate Data Analysis: An Overview; Springer: Berlin/Heidelberg, Germany, 2011. [Google Scholar]
  59. Hair, J.F.; Gabriel, M.; Patel, V. AMOS Covariance-Based Structural Equation Modeling (CB-SEM): Guidelines on its Application as a Marketing Research Tool. Soc. Sci. Electron. Publ. 2015, 13, 44–55. [Google Scholar]
  60. Sarstedt, M.; Ringle, C.M.; Hair, J.F. Partial Least Squares Structural Equation Modeling; Springer International Publishing: New York, NY, USA, 2014. [Google Scholar]
  61. Ringle, C.M.; Sarstedt, M.; Straub, D. A Critical Look at the Use of PLS-SEM in MIS Quarterly. Soc. Sci. Electron. Publ. 2012, 36, iii–xiv. [Google Scholar]
  62. Hair, J.F.; Sarstedt, M.; Ringle, C.M.; Mena, J.A. An assessment of the use of partial least squares structural equation modeling in marketing research. J. Acad. Mark. Sci. 2012, 40, 414–433. [Google Scholar] [CrossRef]
  63. Hair, J.; Hollingsworth, C.L.; Randolph, A.B.; Chong, A. An updated and expanded assessment of PLS-SEM in information systems research. Ind. Manag. Data Syst. 2017, 117, 442–458. [Google Scholar] [CrossRef]
  64. Sarstedt, M.; Ringle, C.M.; Smith, D.; Reams, R.; Hair, J.F. Partial least squares structural equation modeling (PLS-SEM): A useful tool for family business researchers. J. Fam. Bus. Strateg. 2014, 5, 105–115. [Google Scholar] [CrossRef]
  65. Mann, S. Research Methods for Business: A Skill-Building Approach. Leadersh. Org. Dev. J. 2013, 34, 700–701. [Google Scholar]
  66. Drolet, A.L.; Morrison, D.G. Do We Really Need Multiple-Item Measures in Service Research? J. Serv. Res. Us. 2001, 3, 196–204. [Google Scholar] [CrossRef]
  67. Straub, D.; Gefen, D. Validation Guidelines for IS Positivist Research. Commun. Assoc. Inf. Syst. 2004, 13, 24. [Google Scholar] [CrossRef]
  68. Hair, J.F.; Black, W.C.; Babin, B.J.; Anderson, R.E. Multivariate Data Analysis: A Global Perspective; Pearson Education: Essex, UK, 2010. [Google Scholar]
  69. Hamid, M.A.; Sami, W.; Sidek, M.M. Discriminant Validity Assessment: Use of Fornell & Larcker criterion versus HTMT Criterion. J. Phys. Conf. 2017, 890, 12163. [Google Scholar]
  70. Sarstedt, M.; Hair, J.F.; Ringle, C.M.; Thiele, K.O.; Gudergan, S.P. Estimation issues with PLS and CBSEM: Where the bias lies! J. Bus. Res. 2016, 69, 3998–4010. [Google Scholar] [CrossRef] [Green Version]
  71. Ketchen, D.J. A Primer on Partial Least Squares Structural Equation Modeling. Long Range Plan. 2013, 46, 184–185. [Google Scholar] [CrossRef]
  72. Akinwande, M.O.; Dikko, H.G.; Samson, A. Variance Inflation Factor: As a Condition for the Inclusion of Suppressor Variable(s) in Regression Analysis. Open J. Stat. 2015, 5, 754–767. [Google Scholar] [CrossRef] [Green Version]
  73. Henseler, J.; Hubona, G.; Ray, P.A. Using PLS path modeling in new technology research: Updated guidelines. Ind. Manag. Data Syst. 1980, 116, 2–20. [Google Scholar] [CrossRef]
  74. Henseler, J.; Ringle, C.M.; Sarstedt, M. Testing Measurement Invariance of Composites Using Partial Least Squares. Soc. Sci. Electron. Publ. 2015, 49, 41–46. [Google Scholar]
  75. Hu, L.T.; Be Ntler, P.M. Fit indices in covariance structure modeling: Sensitivity to underparameterized model misspecification. Psychol. Methods 1998, 3, 424–453. [Google Scholar] [CrossRef]
  76. Hair, J.F.; Ringle, C.M.; Gudergan, S.P.; Fischer, A.; Nitzl, C.; Menictas, C. Partial least squares structural equation modeling-based discrete choice modeling: An illustration in modeling retailer choice. Bus. Res. 2019, 12, 115–142. [Google Scholar] [CrossRef] [Green Version]
  77. Hair, J.; Astrachan, C.B.; Moisescu, O.I.; Radomir, L.; Ringle, C.M. Executing and Interpreting Applications of PLS-SEM: Updates for Family Business Researchers. J. Fam. Bus. Strateg. 2020, 12, 100392. [Google Scholar] [CrossRef]
  78. Henseler, J.; Ringle, C.M.; Sinkovics, R.R. The Use of Partial Least Squares Path Modeling in International Marketing; Emerald Group Publishing Ltd.: Bingley, UK, 2009; Volume 20, pp. 227–319. [Google Scholar]
  79. Rigdon, E.E. Rethinking Partial Least Squares Path Modeling: Breaking Chains and Forging Ahead. Long Range Plann. 2014, 47, 161–167. [Google Scholar] [CrossRef]
  80. Driessen, T.; Tijs, S.H. The t-value, the core and semiconvex games. Int. J. Game Theory 1985, 14, 229–247. [Google Scholar] [CrossRef] [Green Version]
  81. Rice, W.R. A Consensus Combined P-Value Test and the Family-Wide Significance of Component Tests. Biometrics 1990, 46, 303–308. [Google Scholar] [CrossRef]
  82. Ahmed, E.; Ward, R. Analysis of factors influencing acceptance of personal, academic and professional development e-portfolios. Comput. Hum. Behav. 2016, 63, 152–161. [Google Scholar] [CrossRef]
  83. Ajzen, I.; Fishbein, M. Attitudes and normative beliefs as factors influencing behavioral intentions. J. Personal. Soc. Psychol. 1972, 21, 1–9. [Google Scholar] [CrossRef]
  84. Manning, M. The effects of subjective norms on behaviour in the theory of planned behaviour: A meta-analysis. Brit. J. Soc. Psychol. 2011, 48, 649–705. [Google Scholar] [CrossRef]
  85. Karahanna, E.; Straub, D.W. The psychological origins of perceived usefulness and ease-of-use. Inform. Manag. Amster. 1999, 35, 237–250. [Google Scholar] [CrossRef]
  86. Venkatesh, V.; Davis, F.D. A Model of the Antecedents of Perceived Ease of Use: Development and Test. Decis. Sci. 1996, 27, 451–481. [Google Scholar] [CrossRef]
  87. Dowling, G.R.; Richard, S. A Model of Perceived Risk and Intended Risk-handling Activity. J. Consum. Res. 1994, 21, 119–134. [Google Scholar] [CrossRef]
  88. Prinstein, M.J.; Julie, B.; Anthony, S. Adolescents’ and Their Friends’ Health-Risk Behavior: Factors That Alter or Add to Peer Influence. J. Pediatr. Psychol. 2001, 26, 287–298. [Google Scholar] [CrossRef]
  89. Tarkiainen, A.; Sundqvist, S. Subjective norms, attitudes and intentions of Finnish consumers in buying organic food. Brit. Food J. 2005, 107, 808–822. [Google Scholar] [CrossRef] [Green Version]
  90. Bandura, A.; Freeman, W.H.; Lightsey, R. Self-Efficacy: The Exercise of Control. J. Cogn. Psychother. 1997, 19, 158–166. [Google Scholar] [CrossRef]
  91. Gray, B. Conditions Facilitating Interorganizational Collaboration. Hum. Relat. 1985, 38, 911–936. [Google Scholar]
  92. Ajzen, I.; Fishbein, M. Attitudes and the Attitude-Behavior Relation: Reasoned and Automatic Processes. Eur. Rev. Soc. Psychol. 2000, 11, 1–33. [Google Scholar] [CrossRef]
  93. Lam, T.; Baum, T.; Pine, R. Subjective norms. Ann. Tour. Res. 2003, 30, 160–177. [Google Scholar] [CrossRef]
  94. Ajzen, I.; Madden, T.J. Prediction of goal-directed behavior: Attitudes, intentions, and perceived behavioral control. J. Exp. Soc. Psychol. 1986, 22, 453–474. [Google Scholar] [CrossRef]
  95. Netemeyer, R.G.; Bearden, W.O. A comparative analysis of two models of behavioral intention. J. Acad. Market. Sci. 1992, 20, 49–59. [Google Scholar] [CrossRef]
  96. Likert, R.A. A Technique for Measurement of Attitudes. Arch. Psychol. 1932, 22, 1. [Google Scholar]
  97. Carmer, S.G.; Nyquist, W.E.; Walker, W.M. Least Significant Differences for Combined Analyses of Experiments with Two- or Three-Factor Treatment Designs. Agron. J. 1989, 81, 665–672. [Google Scholar] [CrossRef]
  98. Nunnally, J.C. Psychometric theory. Am. Educ. Res. J. 1978, 5, 83. [Google Scholar]
  99. Juerkenbeck, K.; Heumann, A.; Spiller, A. Sustainability Matters: Consumer Acceptance of Different Vertical Farming Systems. Sustainability 2019, 11, 4052. [Google Scholar] [CrossRef] [Green Version]
  100. Grebitus, C.; Lusk, J.L.; Nayga, R.M., Jr. Effect of distance of transportation on willingness to pay for food. Ecol. Econ. 2013, 88, 67–75. [Google Scholar] [CrossRef]
  101. Suárez-Cáceres, G.P.; Fernández-Cabanás, V.M.; Lobillo-Eguíbar, J.; Pérez-Urrestarazu, L. Consumers′ knowledge, attitudes and willingness to pay for aquaponic products in Spain and Latin America. Int. J. Gastron. Food Sci. 2021, 24, 100350. [Google Scholar] [CrossRef]
  102. Dishaw, M.T.; Strong, D.M. Extending the technology acceptance model with task-technology fit constructs. Inform. Manag. Amster. 1999, 36, 9–21. [Google Scholar] [CrossRef]
  103. Venkatesh, V.; Morris, M.G.; Davis, G.B.; Davis, F.D. User Acceptance of Information Technology: Toward a Unified View. MIS Q. 2003, 27, 425–478. [Google Scholar] [CrossRef] [Green Version]
  104. Aprile, M.C.; Caputo, V.; Nayga, R.M. Consumers’ Preferences and Attitudes Toward Local Food Products. J. Food Prod. Mark. 2015, 22, 1–26. [Google Scholar] [CrossRef]
  105. Flores, H.; Villalobos, J.R. A modeling framework for the strategic design of local fresh-food systems. Agric. Syst. 2018, 161, 1–15. [Google Scholar] [CrossRef]
Figure 1. Internal relationship diagram of PLS-SEM model [64].
Sustainability 14 09114 g001
Figure 2. Workflow of PLS-SEM evaluation.
Sustainability 14 09114 g002
Figure 3. Workflow for this study.
Sustainability 14 09114 g003
Figure 4. The conceptual model of VF acceptance based on the DTPB.
Sustainability 14 09114 g004
Figure 5. Structural model test results. β = Path Coefficient, R2 = R-square.
Sustainability 14 09114 g005
Table 1. Definition of the constructs and measurement items.
ConstructsDefinitionItemMeasurementReferences
Perceived Usefulness
(PU)
People perceive how much benefit can be obtained by planting using VF. PU1I think that planting using VF can bring a high yield of vegetables and fruits.[85]
PU2I think that planting using VF is beneficial to the sustainable development of the city.
PU3I think that indoor VF is not only pleasant to view but also improves the indoor environment.
PU4I think that VF is cost effective.
Perceived Ease of Use
(PEU)
People’s perceptions of the complexity of the VF planting process. PEU1The settings of the automatic control system on the VF equipment are easy for me.[86]
PEU2The VF planting process is easy for me.
Perceived Risk
(PR)
People’s perceptions of the unforeseen and uncertain consequences involved in the process of planting using VF. PR1I am worried that the noise generated during the operation of the VF water circulation system will affect work or rest. [87]
PR2I am worried that plant transpiration will release water vapor and adversely affect indoor humidity.
PR3I am worried that VF planting will increase the number of indoor mosquitoes.
PR4I am worried that VF will affect the normal use of indoor spaces.
Peer Influence
(PI)
The influence of the opinions of family, friends, and colleagues on people’s planting behavior.PI1My family should have a positive attitude toward planting using VF. [88]
PI2My colleagues should have a positive attitude toward planting using VF.
PI3Most of my friends should have a positive attitude toward VF planting.
Superior Influence
(SI)
The influence of the opinions of elders and leaders on people’s planting behavior.SI1The elders in my family should have a positive attitude toward planting using VF. [89]
SI2The leaders of our unit should have a positive attitude toward planting using VF.
SI3Under normal circumstances, I will do what my elders and leaders agree to.
Self-Efficacy
(SE)
People’s self-judgment on planting using VF. SE1I think I understand the knowledge and processes related to planting using VF. [90]
SE2I think I have the ability to deal with the possible negative effects of VF.
SE3I think I have enough time to plant using VF.
SE4I think I can afford the initial costs and operating expenses of VF.
Facilitating Conditions
(FC)
People’s perceptions of the availability of resources required for planting using VF. FC1I think that VF can be grown easily using smart control systems such as mobile phones. [91]
FC2I can easily purchase VF-related equipment from major e-commerce platforms.
FC3I can easily understand and learn VF-related knowledge from the Internet.
Behavior Attitude
(BA)
People’s positive or negative evaluations of planting using VF. BA1I think that planting using VF is worth promoting in the residential environment. [92]
BA2I think that planting using VF is worth promoting in the office environment.
BA3I think that VF should be used in living or working environments.
Subjective Norms
(SN)
People can feel social pressures about whether to plant using VF.SN1The people I value (colleagues or family members) approve of my practice of planting using VF in the office or at home. [93]
SN2People who have an influence on me (elders or leaders) agree that I plant using VF in the office or at home.
Perceived Behavioral Control
(PBC)
People’s perceptions of the mastery of planting using VF. PBC1I have the necessary conditions for VF. [94]
PBC2I have the ability to bear the negative effects and risks brought about by VF.
PBC3I think that there are many convenient reasons for planting using VF.
Behavioral Intention
(BI)
Intensity of people’s willingness to plant using VF. BI1I am willing to try VF within the next 12 months. [95]
BI2I am willing to share relevant knowledge of VF with people around me and will continue to pay attention to its development.
Table 2. Survey respondent characteristics.
ProfileCharacteristics FrequencyPercentage
AgeBelow 18263.5
18–2425133.9
25–3025534.5
31–4015320.7
41–50415.5
Above 50141.9
GenderMale45060.8
Female29039.2
EducationSecondary school and below00
Junior middle school212.9
Senior middle school11315.3
Junior college 12817.3
Bachelor’s degree 34045.9
Master’s degree and above 13818.6
Annual family income (CNY ten thousand)Below 3709.5
3–820127.2
8–3033244.8
30–10012016.2
Above 100172.3
Living areaMetropolis22430.3
Ordinary citie40054.0
Towns and villages11615.7
Table 3. Comparison of different gender groups’ intentions to use VF.
Gender (Mean ± SD)F-Valuep-Value
Male (n = 450)Female (n = 290)
BI3.90 ± 0.873.89 ± 0.860.0060.937
BA3.85 ± 0.863.79 ± 0.820.7490.387
SN3.75 ± 0.973.71 ± 1.010.2720.602
PBC3.57 ± 1.023.37 ± 1.076.410.012 *
Note: *: p < 0.05.
Table 4. Comparison of different age groups’ intentions to use VF.
Age (Mean ± SD)F-ValueLSD
Below 18 (A) (n = 26)18–24
(B) (n = 251)
25–30
(C) (n = 255)
31–40
(D) (n = 153)
41–50
(E) (n = 41)
Above 50
(F) (n = 14)
BI3.63 ± 0.913.83 ± 0.903.91 ± 0.874.06 ± 0.803.94 ± 0.753.50 ± 0.902.495 *D > A, D > B, D > F
BA3.68 ± 0.933.73 ± 0.863.81 ± 0.844.04 ± 0.793.88 ± 0.823.55 ± 0.803.211 **D > A, D > B, D > C, D > E, D > F
SN3.54 ± 0.943.65 ± 0.983.79 ± 0.953.90 ± 0.953.51 ± 1.153.18 ± 1.252.966 *D > B, C > F, D > E, D > F
PBC3.27 ± 0.983.32 ± 1.063.56 ± 1.023.76 ± 0.963.48 ± 1.102.88 ± 1.205.002 ***D > A, C > B, D > B, C > F, D > F
Note: *: p < 0.05, **: p < 0.01, ***: p < 0.001.
Table 5. Comparison of intentions of groups with different education levels to use VF.
Education (Mean ± SD)F-ValueLSD
Junior Middle School (B) (n = 21)Senior Middle School
(C) (n = 113)
Junior College (D) (n = 128)Bachelor’s (E) (n = 340)Master’s and Above
(F) (n = 138)
BI3.83 ± 0.753.86 ± 0.874.08 ± 0.733.95 ± 0.873.64 ± 0.955.032 **D > C, C > F, D > F, E > F
BA3.98 ± 0.813.87 ± 0.834.05 ± 0.683.88 ± 0.843.43 ± 0.9010.95 ***B > F, C > F, D > F, E > F
SN3.88 ± 1.083.91 ± 0.924.01 ± 0.763.72 ± 1.003.32 ± 1.049.959 ***B > F, C > F, D > E, D > F, E > F
PBC3.56 ± 1.073.74 ± 0.843.84 ± 0.793.53 ± 1.062.87 ± 1.0919.599 ***B > F, C > E, C > F, D > E, D > F, E > F
Note: **: p < 0.01, ***: p < 0.001.
Table 6. Comparison of intentions of groups with different annual household incomes to use VF.
Annual Household Income (Mean ± SD) (CNY Ten Thousand)F-Valuep-Value
Below 3
(A)
(n = 70)
3–8
(B)
(n = 201)
8–30
(C)
(n = 332)
30–100
(D)
(n = 120)
Above 100
(E)
(n = 17)
BI3.74 ± 0.933.87 ± 0.943.95 ± 0.783.89 ± 0.933.94 ± 0.880.9150.455
BA3.67 ± 0.833.81 ± 0.943.84 ± 0.803.89 ± 0.804.04 ± 0.721.0890.361
SN3.63 ± 0.953.75 ± 1.033.74 ± 0.953.72 ± 1.073.85 ± 0.610.280.891
PBC3.39 ± 0.993.46 ± 1.083.50 ± 0.993.56 ± 1.173.76 ± 0.800.6360.637
Table 7. Comparison of intentions of groups in different living areas to use VF.
Living Area (Mean ± SD)F-ValueLSD
Metropolis
(A)
(n = 224)
Ordinary Cities (B)
(n = 400)
Towns and Villages
(C)
(n = 116)
BI4.06 ± 0.773.86 ± 0.913.71 ± 0.837.181 **A > B, A > C
BA3.96 ± 0.693.78 ± 0.923.72 ± 0.834.561 *A > B, A > C
SN3.96 ± 0.853.66 ± 1.033.52 ± 0.9810.276 ***A > B, A > C
PBC3.74 ± 0.913.41 ± 1.103.28 ± 0.9710.273 ***A > B, A > C
Note: *: p < 0.05, **: p < 0.01, ***: p < 0.001.
Table 8. Construct validities.
ConstructsItemLoadings Cronbach’s AlphaAVECR
Perceived Usefulness PU10.8270.8050.6280.871
PU20.768
PU30.785
PU40.789
Perceived Ease of Use PEU10.9050.7640.8090.895
PEU20.894
Perceived RiskPR10.7140.8410.6460.879
PR20.778
PR30.886
PR40.827
Peer Influence PI10.8560.8360.7530.902
PI20.858
PI30.889
Superior InfluenceSI10.8570.7520.6690.858
SI20.840
SI30.753
Self-Efficacy SE10.8190.8660.7140.909
SE20.816
SE30.882
SE40.861
Facilitating ConditionsFC10.8020.7800.6940.872
FC20.876
FC30.820
Behavior AttitudeBA10.8480.7340.6530.850
BA20.808
BA30.767
Subjective NormsSN10.9280.8350.8580.924
SN20.925
Perceived Behavioral ControlPBC10.9100.8620.7850.916
PBC20.900
PBC30.846
Behavioral IntentionBI10.9020.7580.8050.892
BI20.892
Table 9. Fornell–Larcker criterion.
FCBABIPBCPEUPIPRPUSESISN
FC0.833
BA0.6490.808
BI0.5840.6980.897
PBC0.6560.6510.6630.886
PEU0.4560.4040.3560.4560.9
PI0.5320.6790.6070.6320.4280.868
PR0.092−0.07−0.0310.0040.151−0.0130.803
PU0.3690.5140.420.3830.4190.451−0.0580.792
SE0.7020.6360.5620.790.5120.6070.0450.3630.845
SI0.5620.6530.6000.6190.4310.747−0.0270.4730.6450.818
SN0.6170.7090.6310.6970.3510.647−0.0310.3960.6670.6680.926
Note: The diagonal bold is the radical value of AVE.
Table 10. Cross-loadings of measured items.
FCBABIPBCPEUPIPRPUSESISN
FC10.8020.5630.4880.4960.3500.4670.0930.3240.5740.4370.490
FC20.8760.5490.4990.6170.3900.4500.0760.3260.6580.4970.556
FC30.8200.5140.4750.5160.4010.4170.0630.2710.5150.4700.492
BA10.5600.8480.6420.5440.3000.536−0.0680.4360.5030.5260.605
BA20.5180.8080.5680.4950.2650.538−0.0850.3600.4690.5020.624
BA30.4920.7670.4740.5390.4200.576−0.0160.4500.5740.5570.488
BI10.5200.6250.9020.6280.3220.559−0.0260.3820.5290.5580.578
BI20.5280.6270.8920.5610.3170.530−0.0300.3730.4780.5180.554
PBC10.5720.5770.5880.9100.4100.5650.0190.3330.7420.5410.632
PBC20.6160.5570.5650.9000.4390.5460.0150.3190.7450.5480.615
PBC30.5530.5990.6130.8460.3600.569−0.0260.3680.6060.5580.604
PEU10.4180.3730.3360.4140.9050.3790.1360.3910.4560.3900.336
PEU20.4030.3530.3040.4060.8940.3920.1350.3620.4650.3850.294
PI10.4710.5960.5280.5890.4100.856−0.0260.4150.5830.6640.573
PI20.4400.5910.5010.5050.3660.858−0.0140.3770.4990.6380.540
PI30.4740.5810.5510.5480.3380.8890.0070.3810.4980.6420.572
PR10.141−0.0070.0450.0860.2480.0310.7140.0110.1460.0390.071
PR20.095−0.0410.0090.0560.1790.0380.778−0.0210.1200.0400.021
PR30.039−0.076−0.050−0.0560.097−0.0380.886−0.052−0.047−0.082−0.073
PR40.109−0.054−0.0270.0360.110−0.0140.827−0.0720.0820.006−0.009
PU10.3190.4220.3450.3310.3260.360−0.0730.8270.3010.3800.322
PU20.1910.3220.2430.1380.2530.261−0.0260.7680.1150.2830.205
PU30.2340.3780.3470.2550.2720.327−0.0470.7850.2330.3290.271
PU40.3850.4780.3750.4310.4390.447−0.0350.7890.4370.4700.416
SE10.5420.5020.4570.6200.4280.4950.0290.2790.8190.5390.526
SE20.5550.5030.4420.5960.4240.4860.0720.3010.8160.5200.540
SE30.6170.6040.5220.7260.4310.5660.0070.3430.8820.5790.617
SE40.6520.5340.4740.7150.4500.5020.0500.3010.8610.5410.566
SI10.4710.5830.5160.5650.3900.659−0.0320.4050.5930.8570.594
SI20.4960.5590.5250.5310.3650.665−0.0440.3840.5540.8400.568
SI30.4080.4480.4240.4080.2950.4920.0160.3730.4190.7530.465
SN10.5510.6530.5940.6460.3060.602−0.0540.3660.5830.6160.928
SN20.5930.6600.5740.6440.3450.598−0.0040.3680.6530.6210.925
Table 11. Evaluation of predictive accuracy and predictive relevance.
ConstructsR2SSOSSEQ2 (=1 − SSE/SSO)
BA0.31422201776.2760.2
SN0.4961480858.2230.42
PBC0.64422201108.750.501
BI0.5691480811.8110.451
Table 12. Results of direct effects among constructs.
PathHypothesis βSEt-Valuep-ValueResults
PU→BAH1a0.4060.03810.765<0.001Supported
PEU→BAH1b0.2470.0376.702<0.001Supported
PR→BAH1c−0.0840.042.0670.039Supported
PI→SNH2a0.3360.0516.611<0.001Supported
SI→SNH2b0.4160.0449.565<0.001Supported
SE→PBCH3a0.6510.03618.082<0.001Supported
FC→PBCH3b0.1990.0385.171<0.001Supported
BA→BIH10.4050.0439.334<0.001Supported
SN→BIH20.1270.0442.9070.004Supported
PBC→BIH30.3110.0466.812<0.001Supported
Note: β = Path coefficient.
Publisher’s Note: MDPI stays neutral with regard to jurisdictional claims in published maps and institutional affiliations.

