Abstract
The objective of this study was to explore how individuals perceive their different types of energy use and evaluate if this information could be useful for further understanding energy demand reduction. Based on a literature review, an innovative feedback exercise was developed that gave participants feedback on electricity use, travel, and then both electricity use and travel simultaneously. Through the use of an interdisciplinary mixed methods research approach, the findings indicate that electricity use and travel are viewed as being very different, there is an opportunity to improve travel-related feedback when compared to electricity, and most do not see a link between electricity and travel. A small number of participants did see a link between electricity and travel, and this was also explored. These findings, which until now have not been explored in the literature, take a first attempt at comparing how individuals perceive their different types of energy use and highlight the relevance of this type of research in order to further advance energy demand management. Implications for a low carbon energy transition and future areas of research were identified and discussed, including decreasing travel in a way that is perceived as being advantageous, improving feedback that illustrates the importance of individual choices, and the importance of examining multiple energy behaviours simultaneously.
1. Introduction
In order to facilitate an energy transition to meet the requirements of the Paris Agreement, supply side and demand side changes are required across sectors, including cities [1,2,3,4]. On the demand side, the role of feedback is one important element that can influence energy consumption [5]. Some studies explored the influence of feedback on household energy [6], and other studies focused on travel [7,8]. It was recognised that energy feedback had garnered much interest and policy attention [9,10]—the cost of living crisis has also increased interest in changing behaviour to decrease costs [11,12].
Instead of focusing on traditional energy feedback studies (such as how much more energy can be saved), Hargreaves concludes that new methods and approaches are required. This includes (but is not limited to) moving beyond conventional studies that examine the impact of an intervention on behaviour and focusing instead on how they fit within the greater context of an individual or their “everyday life.” By engaging in this form of analysis, Hargreaves argues that it has the potential to generate further insights that can help create interventions that focus on the broader context instead of the specific behaviour(s) of interest [9]. Similar points about the culture of energy use have highlighted that it also has the potential to generate interventions that are more efficacious [13,14].
Wynes et al. additionally highlighted that while interventions have been used to examine behaviour change in energy, they tend to focus on one behaviour. Based on a literature review, behavioural changes were examined between household energy use, personal transport, and meat consumption. It was found that simultaneous examination between behaviours was limited and identified as an area of future research [15]. This was identified elsewhere [16].
Research in other fields showed the value of interdisciplinary research in energy use. Pan et al. 2018 examined the importance of examining the relationship between tourism and sustainability, including the importance of holistic policies, investment in technologies, and sustainability education [17]. Gavrilović and Maksimović highlighted that successful green tourism needs to incorporate a perspective that is multidisciplinary, including buildings, energy, waste, and information and communication technologies to develop an integrated view of the sustainable tourism sector [18]. Bojnec and Papler highlighted that tourism development has many attributes, including tourist attractions, energy supply, and environmental preservation, and these need to be considered through a balanced approach in order to develop tourism sustainably [19]. Other studies found similar results, highlighting the importance of integration [20].
Presently, limited research explores how individuals perceive their different types of energy use. The aim of this paper was to originally assess how individuals perceive multiple energy use behaviours in order to better understand the context of individuals and ascertain the relevance of energy demand reduction by focusing on household energy and travel, which has not been examined in the literature to date. A unique opportunity exists to identify original and innovative insights and evaluate the implications that this carries for behavioural change and future energy demand reduction interventions and research. The objective is to evaluate the implications of these findings and discuss the relevance for energy demand management, behavioural change, and low carbon energy transitions. The paper is structured as follows: (a) background and overview of the relevant literature (including different types of feedback); (b) an innovative methodology based on the literature; (c) the results; and (d) a discussion and conclusion, including areas of future research.
2. Literature Review
Both supply and demand side changes are needed to facilitate an energy transition, and cities can play a major role in the energy transition [21,22]. Some research has focused on macro (city or community scale) changes on the supply side of energy use [23,24]. Other research has also focused on individual energy use and behaviour change from a demand side [25,26]. This paper focused on the latter.
Within the energy demand management literature, there have been various approaches to understanding, examining, and/or changing behaviour. This includes, for example, the impact of feed-in tariffs on solar energy in homes [27], demand for bike sharing [28], or travel behaviour [29]. Another mechanism provides information to individuals about their energy use [30].
Providing information to individuals about their energy use to better understand energy consumption was examined [31], and some authors evaluated how feedback can influence energy consumption [32,33,34]. Feedback can be given in a myriad of ways, and Petkov et al. identified different types of feedback mechanisms [35]. Feedback can be explanatory, temporal, normative, or in a ranking format. While there are extensive literature in other research domains (psychology and fitness [36]), there has not been extensive literature on ranking comparisons in an energy context [37]. A summary with an emphasis on individual energy behaviour is highlighted in Table 1.

Table 1.
Different types of energy-related feedback.
While explanatory and temporal feedback can help generate insights about an individual, normative feedback has been shown in the energy demand literature to be an important and potentially more influential factor. It may lead to more impactful interventions when compared to traditional explanatory and temporal feedback [50]. Grevet et al. [51] additionally noted that this also depends on whether an individual is being compared to another individual or to a group, the number of dimensions, whether the feedback is anonymous or not, and whether the feedback is carried out in a spirit of competition or cooperation. While other reviews and frameworks were examined [52,53], Grevet provided the most thorough framework for this paper [51]. To fully examine this, the additional literature was reviewed to understand the role of the normative/social factors when giving feedback and implications in an energy context (Table 2).
Table 2.
Normative/social factors influencing energy feedback.
This review suggests that when comparing an individual to a group or others that are similar, it may be able to generate further behavioural reactions and change because the comparison provides more impact/persuasiveness than generic information and is able to create a greater “adherence” to relevant “norms” [58]. This is true not only for individual behavioural change but has also been tested and found to apply in engineering and design interventions toward greater sustainability [59].
While providing feedback is a key part of behavioural change, understanding how and why participants did (or did not) change their behaviour by use of qualitative analysis is also an integral and, at present, unexplored element. As Lazowski et al. noted, by interviewing participants that were part of a multiyear study on residential electricity consumption, they were able to understand the “cultures of consumption” and the best way to educate consumers based on the interviews [60].
At present, there is limited research that (a) explores how and why individuals perceive their different types of energy use and (b) examines multiple behaviours simultaneously. The purpose of this paper is to address these gaps and assess if this information can be used to better understand energy demand management. By giving different types of feedback and qualitatively probing the impact of the feedback, the objective was to provide participants an opportunity to reflect on their different types of energy use. Specifically, how do participants perceive their use of electricity? Is this associated with travel, and do participants see a link between electricity and travel? Are they interested in feedback on electricity as well as on travel? An innovative feedback exercise that examines electricity and travel simultaneously was developed, which qualitatively explores how individuals perceive their different types of energy.
3. Materials and Methods
Participants were invited to take part in a research project, and the requirements of the study were (a) to not have or have had an electricity display installed in their homes before and (b) to own or mortgage their homes and to have lived in their home for at least a year [4]. The purpose was to recruit individuals who were interested in and willing to engage in a research project around energy; the objective was to provide a perspective of what the experience was like to the “energy enthusiast”. Participants were recruited through flyers and emails and were asked to complete an online survey. By recognising that attrition may occur, the goal was to have a sample of ~20 people so that the final sample would range between 10 and 15 [61].
If participants met the requirements of the study, they were invited to participate. In the first interview, they were interviewed about household electricity behaviour, travel behaviour, and social networks, and an electric display was installed in their homes. The electricity display (OWL + USB) was chosen because it was readily available, the installation was straightforward (it did not require the use of a specialist or 3rd party), and it was user-friendly [62]. For an illustration of the electricity display, please refer to Figure 1.
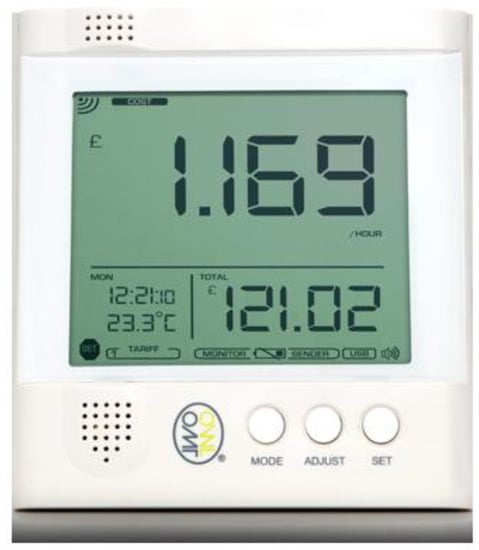
Figure 1.
OWL + USB [62].
This paper reports on a feedback exercise that had two parts (1 and 2), which are summarised in Table 3.
Table 3.
Exercise parts.
In the first part of the exercise, participants were given explanatory, temporal, and normative feedback first on their electricity, secondly on their travel, and finally on their electricity and travel simultaneously. Figure 2 provides an illustration of the behaviours examined as well as comparisons that took place.
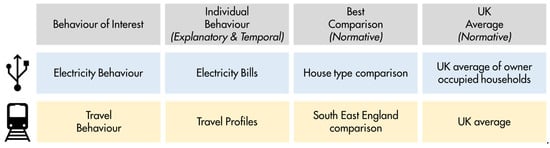
Figure 2.
Behaviours of interest and types of comparison.
Electricity data and travel profile data were obtained from the participant, and the data were used for the feedback exercise. Visuals were generated from this information, which is described in the next section. The data are categorised as explanatory because they show how much energy was used and temporal because they illustrate the amount of electricity and travel that was captured over the year. For the “best comparison” and “UK average” figures, comparisons based on the best available information/reports from external sources were used to showcase normative feedback.
3.1. Feedback on Electricity and Travel
Participants provided their most recent electricity bills, and from this, an explanatory and temporal bar graph was generated. Because of different billing structures across the different participants, data were available on a monthly basis for some households and on a quarterly basis for other households. Since there was a variety of billing structures, an average daily estimate was calculated. An average daily estimate is defined as the average amount of kWh a house would use on a given day in a month. When the participants were given this graph, they were told this was an average daily estimate of their electricity consumption and were asked to respond to what they thought about the graph.
Participants were then asked to flip over the sheet of paper, where a table was provided. The table includes their annual electricity consumption, the average consumption of someone who lived in the same house type (best comparison), and the average consumption of all owner-occupied houses (UK). This was provided in kWh (kilowatt hour) and the kg CO2/year equivalent (kilograms of carbon dioxide/year) [63]. Figures were from a study by the Energy Saving Trust entitled Powering the Nation [63]. This was the only study found that gave average electricity consumption over a year by house type (semi-detached, detached, terraced, flat, bungalow, etc.) for owner-occupied households in the UK. Since all participants either owned or mortgaged their homes, these figures were used. Participants were then asked to comment on this table. Examples are provided in Figure 3 and Table 4. Table 4 is an example that shows that the participant’s carbon emissions are higher than the best comparison house and average of all owner-occupied houses in the UK—this is illustrative and varied across participants.
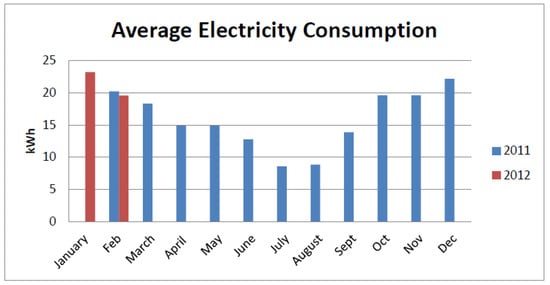
Figure 3.
Explanatory and temporal electricity feedback.
Table 4.
Normative electricity feedback.
In the next part of the interview, travel profiles were used to understand how an individual generally travels—usually over the course of 6 months to one year—and these profiles were aimed to capture “regular travel” as well as one-off trips. This data can then be used to develop carbon profiles for the travel of the individual.
There are a variety of mechanisms that examine travel behaviour, including travel diaries [64], activity diaries [65], or travel profiles [66]. Each method captures different travel information. Although a day-to-day travel diary can give an understanding of how the individual travels [67], it does not allow the researcher an opportunity to develop an understanding of how the individual generally travels over the course of six months or a year. A travel profile, on the other hand, quickly shows how frequently the individual uses a specific type of transport (public transport, car use, and flight use) while also providing a platform to inquire why they engage in some modes but not others (if this is the case). Therefore, travel profiles were used to develop an estimated understanding of travel patterns.
Participants were given a survey to complete, which asked them a variety of travel questions, such as how many vehicles they have, travel by personal and public transport, and flights they have taken. From this, distances were calculated, and carbon conversions were applied. An explanatory and temporal graph depicting their annual travel was generated and presented from the data. Pie charts illustrating individual travel behaviour were used in other studies [22]. Participants were asked to comment on this graph—including their reaction, impact, and reflections. After this was completed, participants were given a table that compared the participant to the footprint of a resident in South East England (kg and tonnes of CO2/year) and the average travel footprint of someone living in the UK. A variety of sources were consulted to find the average travel footprint of a resident in the UK and a resident in South East England [68,69,70,71]. The figures used were intended to compare the participant to someone who lived in the same geographic region as the UK average. Average carbon footprints ranged from 1.5 to 3.2 tonnes/year based on various assumptions made in the different studies. A UK average was used (1.9), as well as tonnes of carbon dioxide per resident in South East England (2.4). Sources 69 and 70 are online resources that were no longer available when submitted for publication—but those ranges were reconfirmed through other sources [72]. The participant was asked to reflect on this feedback. Please refer to Figure 4 and Table 5 for examples. Table 5 is an example that shows that the participant’s carbon emissions are higher than the best comparison house and average of all owner-occupied houses in the UK—this is illustrative and varied across participants.
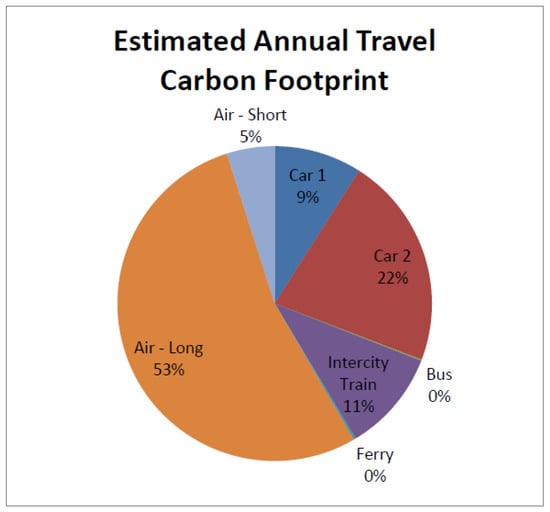
Figure 4.
Explanatory and temporal travel feedback.
Table 5.
Normative travel feedback.
3.2. Simultaneous Feedback on Electricity and Travel
Participants were given a figure that illustrated their electricity consumption and their travel (kg CO2) simultaneously based on the figures calculated, and they were asked to comment on this. Therefore, participants were given a graph that compared the participant to the best comparison scenario (electricity consumption for a similar-sized house and South East England travel average) and the UK average based on the figures explained earlier. They were asked to explain their reaction to the feedback. Sample graphs are displayed in Figure 5 and Figure 6.
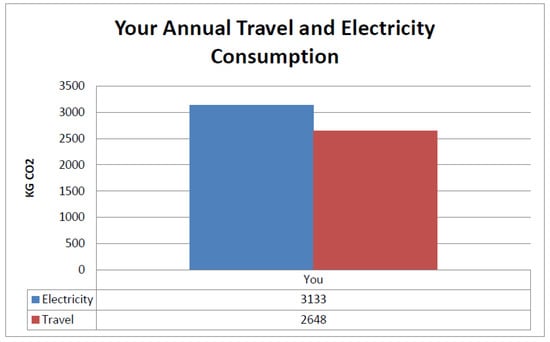
Figure 5.
Explanatory and Temporal Travel and Electricity Feedback.
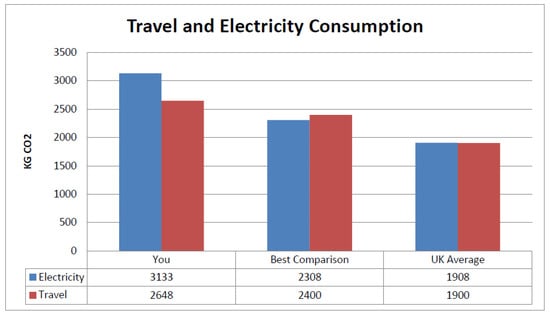
Figure 6.
Normative travel and electricity feedback.
After the first part of the exercise was completed (feedback provided for electricity, travel, and then electricity and travel simultaneously), the second part of the interview commenced. Participants were asked in a semi-structured format about the value of feedback given, the similarities and differences between electricity and travel, and a discussion about the usefulness and relevance of the information.
3.3. Analysis
The main sources of data were transcribed interviews, field notes, and interview notes. Data sources were analysed—a form of analysis for qualitative research methods [73,74,75]. Materials and transcripts were read with the objective of identifying themes based on the research objectives. This includes how and why individuals perceive their different types of energy behaviours and what insights can be generated by examining multiple behaviours simultaneously. Specifically, the following research questions were examined:
- Does the feedback exercise demonstrate or develop a link between travel-related behaviour and electricity behaviour?
- Are the participants interested in receiving feedback on their travel? Why/why not?
4. Results
4.1. Sample and Findings
In order to recruit the participants, emails were sent as well as ~900 flyers. From this, 70 individuals were interested in participating and were then asked to complete an online survey. Fifty-five individuals completed the online survey, and the first ~20 participants that met the requirements of the study were invited to participate. Twenty-one participants were recruited, and attrition occurred—two participants were unable to complete the interviews [4].
The sample recruited was based in the city of Oxford, UK, where this research was conducted. This study had specific recruitment requirements (specified earlier in the paper). The sample was aimed at a group of energy enthusiasts and was not representative of the Oxford population. The sample compared to the Oxford population by having a greater number of older participants, a higher number of females, and greater car ownership [4]. This is represented in Table 6.
Table 6.
Sample and comparison to oxford demographics (2011).
Figure 7 highlights whether participants saw a link between household electricity and travel and whether participants were interested in feedback on their travel (red indicates no, yellow indicates unsure, and green indicates yes). The findings are categorised according to the amount of behavioural change identified over the course of the study, of which there were three categories:
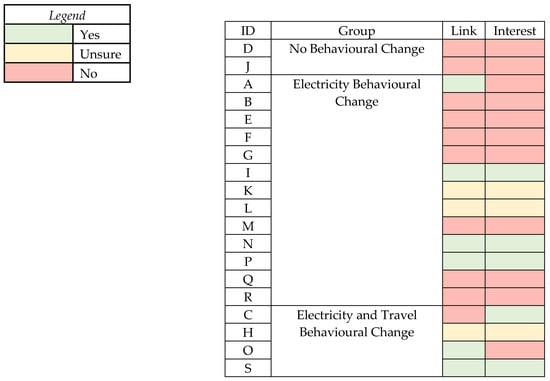
Figure 7.
Behavioural change with interests and links.
- No Behavioural Change: The display had no effect on my electricity usage and/or attitude or on any other energy behaviours (two participants);
- Electricity Behavioural Change: The display influenced my electricity attitude and/or usage (13 participants);
- Electricity and Travel Behavioural Change: The display influenced my electricity attitude and/or usage and travel (four participants).
The next section provides some of the key questions asked and provides qualitative insights into the results above.
4.2. Question 1: Does the Feedback Exercise Demonstrate or Develop a Link between Travel Related Behaviour and Household Electricity Behaviour?
Participants were asked if they saw a link between their travel-related behaviour and their household electricity behaviour. Out of the 19 participants, 13 said “no” or were “unsure”, while 6 indicated that they were. Why, then, did most of the participants not see a link between their household electricity behaviour and their travel-related behaviour? There were three types of responses: differences between household electricity and travel, quality of life issues, and whether there were means to find accurate travel information.
Firstly, participants noted that the connection between installing a display and having that influence on travel-related behaviour was too big of a stretch—the connections were quite far apart. As one participant noted:
“it’s relatively straightforward to make people aware of how much electricity they’re actually using, but of course it’s a big step from there to start talking about relative carbon footprints and that’s a gap which needs to be filled in for people in terms of where the carbon footprint comes from in electricity generation and all that as against the alternative modes of transport.”
Secondly, while participants were willing to turn the lights off or turn the computer off, the desire to cut down on travel or not travel was not prevalent. One participant said that holidays abroad were a part of his life that he quite enjoyed, and he was not willing to cut down. Another participant said that not travelling would have serious implications on their quality of life—both mentioning the use of the car and the use of the plane. This leads to another point—cutting down on household electricity was related to benefitting individuals (saving money, saving the environment), while cutting down on travel was associated with non-positive changes (not seeing friends, missing out on family events or holidays, decreasing quality of life). Individuals look at travel not as consuming a resource or fuel but as a means of getting from one place to another. This is not the case when compared to electricity; individuals mentioned that wasting electricity was something they were conscious of not doing and that electricity was a resource that could be conserved.
Thirdly, participants mentioned it was quite hard to receive or find generally accurate information on the impact of travel, such as the emissions associated with a travel journey when the train is half full compared to being completely full. This is quite different from electricity, as some participants noted that information on electricity was quite easy to understand. Many participants noted that travel-related feedback was difficult to understand and did not provide a sense of their travel impact. They thought that the calculations or process of understanding the impact of carbon was quite difficult, while household electricity was much easier to understand. Therefore, these factors (differences, quality of life, and complexity) played a role in highlighting the different perceptions that existed and the reason why linkages between household electricity and travel did not exist.
4.3. Question 2: Are the Participants Interested in Receiving Feedback on Their Travel? Why/Why Not?
Participants were asked if they were interested in receiving feedback on their travel. Out of the 19 participants, 11 said they were not, 3 were unsure, and 5 said they would be interested. Why would the majority of participants not be interested or be unsure? The reasons participants were not interested in travel-related feedback were because it was hard to understand, there were few realistic alternatives, changing behaviour toward travel was much harder than changing behaviour toward electricity, and they felt that travel-related changes did not really have an environmental impact.
Hard to understand: The respondents did not know or could not conceptualise how different modes of transport would be attributed to their own footprint. For example, if they travelled by bus, how large of a carbon footprint would be attributed to them when the bus is full, half-full, or empty? Because of this challenge, some were not interested in receiving feedback.
Realistic alternatives do not exist: Feedback on their travel would not really have an impact on their decisions. Feedback on alternative routes may be interesting, they noted, but feedback on the environmental impacts of travel was not so interesting because participants noted a necessity to travel for work, go on a school run, or participant in international work. They also noted that they had a general inflexibility to change the location of their work and commuted in the best and most time-efficient way already.
Travel was much harder to change than household electricity: Participants noted that it was easier to control household electricity use (turn things off) and change things in the house when compared to travel. While participants felt that they could control expenditure on travel, they could not control whether to travel or not. The commute to work, the school run, and the visits to family and friends, all of these activities had locations that could not be changed. Therefore, feedback was less interesting.
Changing mode of transport: It was thought that this would not have an environmental benefit. Choosing not to take a journey on a bus, train, or plane would not have an impact on climate change savings. Equally, participants mentioned that they had no incentive to decrease their travel when everyone else was being “profligate” and flying all over the world. Participants felt that they could not really influence the efficiency of public transport, but this was more possible for household electricity reductions (such as buying a more efficient fridge). As one participant noted: “apart from private motoring, the efficiency of buses and the fuel efficiency of these sorts of things is right outside our control.” For household electricity, however, they felt that this was much easier to control.
4.4. Question 3: Are There Any Exceptions—Do Some See a Link?
There were, however, five participants who did say they were interested in receiving feedback on travel, and there were six participants who did see a link between electricity and travel behaviour. These six all had behavioural changes in electricity, and some also had changes in travel, as noted in Figure 7. Those that were interested in receiving feedback on their travel also commented that they did not have an instinctive understanding of what the carbon implications of travel were, and this made travel information more interesting to them. For example, one participant noted:
“I couldn’t tell you what my own travel impact on the carbon emissions are by comparison with the gas and the electricity ones, I can’t even scale it, I wouldn’t know whether it’s half or tenth or five times, just don’t know.”
For those that indicated the feedback exercise did help link energy uses together, a variety of reasons were stated. One reason was that the feedback provided a perspective that highlighted where the emissions were attributed to and what was important. This helped, in the opinion of some participants, understand where their carbon footprint was across household electricity and travel and how to decrease it. As one participant noted:
“whenever you’re making a decision about some alteration that might be ecologically more friendly, it’s always important to know what the big ticket items are. There’s no point in monkeying around with the things which are only going to make 2% of difference anyway because they’re such small items. So this [feedback exercise] highlights the huge impact that air travel has.”
Other participants echoed this sentiment. One participant went through the feedback exercise and found that her household electricity consumption was below the UK average while her travel footprint was higher than the UK average. Subsequently, she noted that she frequently travels to South East England quite regularly and might start looking into car sharing opportunities. She noted that this type of feedback made her conscious of her travel and enabled her to compare her travel carbon footprint to her electricity use. As a result, she started to formulate a connection between the two, which she found very helpful. She noted that this type of feedback allowed her to focus her efforts on the sources that had a greater impact on climate change, so she learned that more attention should be placed on her travel: “It sort of indicates I should make more effort with the car than the household”. When asked to elaborate further, she noted that she did not want to be higher than the average for travel, and this prompted her to think of more ways to reduce the amount of travel.
5. Discussion
Three main themes have emerged from this small-scale qualitative study:
Household electricity and travel behaviour are viewed as being very different: Cutting down on household electricity was seen as being advantageous because money can be saved (because of the payment structure), it is helpful to the environment, and it decreases consumption without decreasing quality of life. For travel, participants felt that this was quite different. Even if they could choose not to travel (which is not always the case), the actual impact of not travelling was quite small, if not negligible, on the grand scale. As they described, it would also lead to missing social events and decreasing quality of life.
There is an opportunity to improve travel-related feedback: One participant noted that it could be quite easy to have some sort of monitor in the car that gave you feedback on travel consumption, carbon emissions, and other trip metrics, but it would be more complicated to receive feedback on other forms of transport, such as buses, the London Tube, train, or other forms of public transport. Therefore, an opportunity exists for ways to communicate personal travel-related feedback simply. Feedback could be improved by providing information on alternatives such as bicycles or public transport [7], eco-driving behaviours [78], or car/bike sharing or taxi sharing platforms [79].
Most participants do not see a link between electricity and travel behaviour, but some do: This exercise demonstrated that while most participants do not see a link between electricity and travel, some do. The participants that did indicate this all had changes in electricity behaviour, and some also had changes in travel. One participant mentioned that her household electricity consumption was below the UK average while her travel footprint was higher than the UK average, which helped them focus on which behaviours to target moving forward. This suggests that reactions to results are context-specific and relate to individuals and their specific circumstances.
More generally, while participants were willing to turn the lights off or turn the computer off, the desire to cut down on travel or not travel was not really considered an option. Cutting down on household electricity was related to benefiting individuals, while cutting down on travel was associated with non-positive changes. This is in line with some findings in the literature that suggests decreasing travel would significantly require major lifestyle changes that may be difficult or undesirable [80]. The findings also suggest that participants look at travel not as consuming a resource or fuel but as a means of getting from one place to another. This is not the case when compared to electricity individuals, who mentioned that wasting electricity was something they were conscious of not doing and that electricity was a resource that could be conserved.
It is acknowledged that the findings in this research area are mixed. Some studies found similar findings [80]. Other studies came to different conclusions, where individuals are more likely to connect transport with energy savings than household consumption [81]. Studies that examined transport and household energy consumption behaviour change highlighted that further research across these two fields is required [82,83].
This study is a small-scale exercise that sampled a group of “enthusiasts” who elected to participate. The findings are not intended to be generalisable, representative, or statistically significant. Additionally, while the data for comparison used the best available resources and references, the data for the individual are based on estimates (electricity bills in the UK are estimated, and travel profiles are based on a survey response from the participants). This is not to suggest it is inaccurate, but rather that it is important to recognise these limitations.
6. Conclusions
Differences exist between people’s perceptions of electricity and travel. Cutting down on electricity consumption was seen as benefiting individuals directly while cutting down on travel was not seen as being beneficial to the individual. Therefore, an area of future research would be to explore energy reductions in travel in a way that is seen as advantageous to the individual.
Given the changes that have taken place with the measures around COVID-19 during lockdowns, ways to adapt or work from home showcase the potential for such a change (including savings) is an area of further research. Further research that examines how the quality of life, working from home, and making extensive use of IT could work together.
As the interest in electric vehicles (EVs) continues to increase alongside the increase in global energy costs, one area of further research is to see if there is a relationship between travel behaviour, the price of electricity, and the use of EVs. While there is research that shows the economic benefits of EVs [84,85], this is an area that could be examined further by focusing on what risks/opportunities exist for EVs and travel behaviour in the current economic environment. This includes examining how policies can continue to encourage EVs. This could include a survey/qualitative investigation with owners of EVs and how they have seen their attitudes/perceptions change over time alongside changing energy prices.
Additionally, as noted earlier in the paper, demand side behavioural changes could benefit from a new framing. Instead of “decreasing” travel, opportunities to share bicycles, carpool, or other forms of collaborative community-based travel options could be explored with the intention of improving social ties. This would help reduce travel. One area of further research would be to explore how community building, travel options, and strengthening social ties could help contribute to this [86].
Furthermore, participants expressed that understanding their travel impact was difficult to understand. This suggests that there are several means by which information and awareness can be raised through better communication and engagement as it relates to travel. Further research that highlights the importance that individual decisions make (regular commute, flights, public transport, or otherwise) in a way that is simple, intuitive, and focuses on improving quality of life could further help enable behavioural changes.
Building on the previous point, participants mentioned that changing travel behaviour was seen as quite difficult. Additionally, even if they were to change their travel behaviour, participants said it would not have an influence from an environmental perspective. Another area of further research would be to explore how these two elements may or may not be interlinked. If the understanding of travel impact or perceived ability to change travel behaviour increases, either from a new framing, increased use of alternative modes of transport, or otherwise, would the perceived value and impact of changing individual travel behaviour still be seen as being immaterial? A deepening of this would help explore the best way to develop travel-based behavioural messages and changes.
Finally, the findings suggest that individuals that participated in this study do not see a link between electricity and travel. This study has focused on two behaviours (electricity and travel) and has attempted to qualitatively assess how individuals perceive their different types of energy use. Further research is required that looks at other behaviours not explored here, water usage, clothing choices, food choices, etc., and issues relating to the deployment of new technologies, such as privacy, developing social norms, etc. The benefit of further examining these nexuses could help generate insights for energy demand reduction interventions, transition to a low carbon lifestyle, and implications for sustainable cities. This paper sought to address a gap in the literature that explores how individuals perceive their different types of energy use. There is a much greater need to understand this issue more fundamentally and the best way to discuss this with individuals or groups so that effective policy packages can be developed that are both feasible and acceptable to people.
Author Contributions
Conceptualisation, methodology, formal analysis, and writing—original draft, M.A.-C.; conceptualisation, methodology, supervision, writing—review and editing, D.B. All authors have read and agreed to the published version of the manuscript.
Funding
This research received no external funding.
Institutional Review Board Statement
The study was approved by the Social Sciences and Humanities Inter Divisional Research Ethics Committee (SSD/CUREC1A/11-150—22 July 2011).
Informed Consent Statement
Informed consent was obtained from all subjects involved in the study.
Data Availability Statement
Not applicable.
Conflicts of Interest
The authors declare no conflict of interest.
References
- Farzaneh, H.; Doll, C.N.; de Oliveira, J.A.P. An integrated supply-demand model for the optimization of energy flow in the urban system. J. Clean. Prod. 2016, 114, 269–285. [Google Scholar] [CrossRef]
- Sijm, J.; Koutstaal, P.; Özdemir, O.; van Hout, M. Energy Transition Implications for Demand and Supply of Power System Flexibility: A Case Study of the Netherlands Within an EU Electricity Market and Trading Context. In The European Dimension of Germany’s Energy Transition; Gawel, E., Strunz, S., Lehmann, P., Purkus, A., Eds.; Springer: Berlin/Heidelberg, Germany, 2019. [Google Scholar]
- Martin, C.J.; Taylor, P.G.; Upham, P.; Ghiasi, G.; Bale, C.S.; James, H.; Owen, A.; Gale, W.F.; Slack, R.J.; Helmer, S. Energy in low carbon cities and social learning: A process for defining priority research questions with UK stakeholders. Sustain. Cities Soc. 2014, 10, 149–160. [Google Scholar] [CrossRef][Green Version]
- Al-Chalabi, M.; Banister, D.; Brand, C. On target? Examining the effects of information displays on household energy and travel behaviour in Oxford, United Kingdom. Energy Res. Soc. Sci. 2018, 44, 278–290. [Google Scholar] [CrossRef]
- Abrahamse, W.; Schuitema, G. Psychology and energy conservation: Contributions from theory and practice. In Energy and Behaviour; Academic Press: Cambridge, MA, USA, 2020; pp. 19–44. [Google Scholar]
- Wood, G.; Day, R.; Creamer, E.; van der Horst, D.; Hussain, A.; Liu, S.; Shukla, A.; Iweka, O.; Gaterell, M.; Petridis, P.; et al. Sensors, sense-making and sensitivities: UK household experiences with a feedback display on energy consumption and indoor environmental conditions. Energy Res. Soc. Sci. 2019, 55, 93–105. [Google Scholar] [CrossRef]
- Bucher, D.; Mangili, F.; Bonesana, C.; Jonietz, D.; Cellina, F.; Raubal, M. Demo Abstract: Extracting eco-feedback information from automatic activity tracking to promote energy-efficient individual mobility behavior. Comput. Sci.-Res. Dev. 2018, 33, 267–268. [Google Scholar] [CrossRef]
- Cellina, F.; Bucher, D.; Mangili, F.; Veiga Simao, J.; Rudel, R.; Raubal, M. A large scale, app-based behaviour change experiment persuading sustainable mobility patterns: Methods, results and lessons learnt. Sustainability 2019, 11, 2674. [Google Scholar] [CrossRef]
- Hargreaves, T. Beyond energy feedback. Build. Res. Inf. 2018, 46, 332–342. [Google Scholar] [CrossRef]
- Gasparo, J.; Antonini, E.; Marchi, L.; Vodola, V. Energy Transition at Home: A Survey on the Data and Practices That Lead to a Change in Household Energy Behavior. Sustainability 2021, 13, 5268. [Google Scholar] [CrossRef]
- Patrick, R.; Pybus, K. Cost of living crisis: We cannot ignore the human cost of living in poverty. BMJ 2022, 377, o925. [Google Scholar] [CrossRef]
- Edington, T. 2022. Fuel Cost: How to Save Petrol and Diesel. BBC. Available online: https://www.bbc.co.uk/news/business-61745697 (accessed on 9 June 2022).
- Rau, H.; Moran, P.; Manton, R.; Goggins, J. Changing energy cultures? Household energy use before and after a building energy efficiency retrofit. Sustain. Cities Soc. 2019, 54, 101983. [Google Scholar] [CrossRef]
- Chalal, M.L.; Medjdoub, B.; Bezai, N.; Bull, R.; Zune, M. Visualisation in energy eco-feedback systems: A systematic review of good practice. Renew. Sustain. Energy Rev. 2022, 162, 112447. [Google Scholar] [CrossRef]
- Wynes, S.; Nicholas, K.A.; Zhao, J.; Donner, S.D. Measuring what works: Quantifying greenhouse gas emission reductions of behavioural interventions to reduce driving, meat consumption, and household energy use. Environ. Res. Lett. 2018, 13, 113002. [Google Scholar] [CrossRef]
- Yang, D.; Timmermans, H. Effects of green policies on household transport and energy consumption in Europe. In Transport and Energy Research: A Behavioural Perspective; Elsevier: Oxford, UK, 2019; p. 31. [Google Scholar]
- Pan, S.Y.; Gao, M.; Kim, H.; Shah, K.J.; Pei, S.L.; Chiang, P.C. Advances and challenges in sustainable tourism toward a green economy. Sci. Total Environ. 2018, 635, 452–469. [Google Scholar] [CrossRef] [PubMed]
- Gavrilović, Z.; Maksimović, M. Green innovations in the tourism sector. Strateg. Manag. 2018, 23, 36–42. [Google Scholar] [CrossRef]
- Bojnec, Š.; Papler, D. Tourism demand, green energy supply and sustainable development. UREDNIŠTVO 2009, 11. Available online: https://d1wqtxts1xzle7.cloudfront.net/6541391/academicaturistica1_2_2009-with-cover-page-v2.pdf?Expires=1658658313&Signature=Zk35noHnX5Jzfm1VKcMyOr8qzClqTw1LpkwzZD2Adj7XfBuU~nlskd9nJQRg7v3W1MMf8Q3GFYDyH1606swJP5cbPqN40G4wKHt3lbT~SPpXIGusz6zpaX4V1~APv5nYuUySW65bApld6B9fSzF44sD8AhVddIr9kEyPvgmZiLOlwxT41mdcKCEZtHQln8wULuyfrK0aXIXEWWfthUSywj7GBwTDH6TX2rNBRCyvhVFYVKQnztvWtOw71KxmgeRmEyj802qT2CvQyVss7y2D3TY6SOdoep4jr~PWoq1cc4kRY4Vl1pSAWrndwmnoPFBgMx1RYAwp9ZOnf8xVbx3mgA__&Key-Pair-Id=APKAJLOHF5GGSLRBV4ZA#page=11 (accessed on 9 June 2022).
- Lu, C.W.; Huang, J.C.; Chen, C.; Shu, M.H.; Hsu, C.W.; Bapu, B.T. An energy-efficient smart city for sustainable green tourism industry. Sustain. Energy Technol. Assess. 2021, 47, 101494. [Google Scholar] [CrossRef]
- International Energy Association. 2016. Cities Are at the Frontline of the Energy Transition. Available online: https://www.iea.org/news/cities-are-at-the-frontline-of-the-energy-transition (accessed on 9 June 2022).
- Brand, C.; Preston, J.M. ‘60-20 emission’—The unequal distribution of greenhouse gas emissions from personal, non-business travel in the UK. Transp. Policy 2012, 17, 9–19. [Google Scholar] [CrossRef]
- Noorollahi, Y.; Itoi, R.; Yousefi, H.; Mohammadi, M.; Farhadi, A. Modeling for diversifying electricity supply by maximizing renewable energy use in Ebino city southern Japan. Sustain. Cities Soc. 2017, 34, 371–384. [Google Scholar] [CrossRef]
- Jacobson, M.Z.; Cameron, M.A.; Hennessy, E.M.; Petkov, I.; Meyer, C.B.; Gambhir, T.K.; Maki, A.T.; Pfleeger, K.; Clonts, H.; McEvoy, A.L.; et al. 100% clean and renewable Wind, Water, and Sunlight (WWS) all-sector energy roadmaps for 53 towns and cities in North America. Sustain. Cities Soc. 2018, 42, 22–37. [Google Scholar] [CrossRef]
- Al-Marri, W.; Al-Habaibeh, A.; Watkins, M. An investigation into domestic energy consumption behaviour and public awareness of renewable energy in Qatar. Sustain. Cities Soc. 2018, 41, 639–646. [Google Scholar] [CrossRef]
- Zarabi, Z.; Manaugh, K.; Lord, S. The impacts of residential relocation on commute habits: A qualitative perspective on households’ mobility behaviors and strategies. Travel Behav. Soc. 2019, 16, 131–142. [Google Scholar] [CrossRef]
- Lan, H.; Cheng, B.; Gou, Z.; Yu, R. An evaluation of feed-in tariffs for promoting household solar energy adoption in Southeast Queensland, Australia. Sustain. Cities Soc. 2019, 53, 101942. [Google Scholar] [CrossRef]
- Eren, E.; Uz, V.E. A review on bike-sharing: The factors affecting bike-sharing demand. Sustain. Cities Soc. 2019, 54, 101882. [Google Scholar] [CrossRef]
- Di Dio, S.; La Gennusa, M.; Peri, G.; Rizzo, G.; Vinci, I. Involving people in the building up of smart and sustainable cities: How to influence commuters’ behaviors through a mobile app game. Sustain. Cities Soc. 2018, 42, 325–336. [Google Scholar] [CrossRef]
- Henn, L.; Tabue, O.; Kaiser, F. The role of environmental attitude in the efficacy of smart-meter-based feedback interventions. J. Environ. Psychol. 2019, 63, 74–81. [Google Scholar] [CrossRef]
- Vassileva, I.; Wallin, F.; Dahlquist, E. Analytical comparison between electricity consumption and behavioural characteristics of Swedish households in rented apartments. Appl. Energy 2011, 90, 182–188. [Google Scholar] [CrossRef]
- Geelen, D.; Mugge, R.; Silvester, S.; Bulters, A. The use of apps to promote energy saving: A study of smart meter–related feedback in the Netherlands. Energy Effic. 2019, 12, 1635–1660. [Google Scholar] [CrossRef]
- Maan, S.; Merkus, B.; Ham, J.; Midden, C. Making it not too obvious: The effect of ambient light feedback on space heating energy consumption. Energy Effic. 2010, 4, 175–183. [Google Scholar] [CrossRef]
- DARBY, S. The Effectiveness of Feedback on Energy Consumption; Environmental Change Institute—University of Oxford: Oxford, UK, 2006. [Google Scholar]
- Petkov, P.; Köbler, F.; Foth, M.; Krcmar, H. Motivating domestic energy conservation through comparative, community-based feedback in mobile and social media. In Proceedings of the 5th International Conference on Communities and Technologies, Brisbane, Australia, 29 June—2 July 2011; pp. 21–30. [Google Scholar]
- Morano, M.; Colella, D.; Capranica, L. Body image, perceived and actual physical abilities in normal-weight and overweight boys involved in individual and team sports. J. Sports Sci. 2011, 29, 355–362. [Google Scholar] [CrossRef]
- Petkov, P.; Köbler, F.; Foth, M.; Medland, R.C.; Krcmar, H. 2011b. Engaging energy saving through motivation specific social comparison. In Proceedings of the CHI’11 Extended Abstracts on Human Factors in Computing Systems, Vancouver, BC, Canada, 7–12 May 2011. [Google Scholar]
- Bruhl, J.; Smith, G.; Visser, M. Simple is good: Redesigning utility bills to reduce complexity and increase understanding. Util. Policy 2019, 60, 100934. [Google Scholar] [CrossRef]
- Zhang, X.; Shen, J.; Yang, T.; Tang, L.; Wang, L.; Lit, Y.; Xu, P. Smart meter and in-home display for energy savings in residential buildings: A pilot investigation in Shanghai, China. Intell. Build. Int. 2019, 11, 4–26. [Google Scholar] [CrossRef]
- Öhrlund, I.; Linne, Å.; Bartusch, C. Convenience before coins: Household responses to dual dynamic price signals and energy feedback in Sweden. Energy Res. Soc. Sci. 2019, 52, 236–246. [Google Scholar] [CrossRef]
- Fischer, C. Feedback on household electricity consumption: A tool for saving energy? Energy Effic. 2008, 1, 79–104. [Google Scholar] [CrossRef]
- Sanguinetti, A.; Dombrovski, K.; Sikand, S. Information, timing, and display: A design-behavior framework for improving the effectiveness of eco-feedback. Energy Res. Soc. Sci. 2018, 39, 55–68. [Google Scholar] [CrossRef]
- Hermann, M.R.; Brumby, D.P.; Oreszczyn, T. Watts your usage? A field study of householders’ literacy for residential electricity data. Energy Effic. 2018, 11, 1703–1719. [Google Scholar] [CrossRef]
- Festinger, L. A Theory of Social Comparison Processes. Hum. Relat. 1954, 7, 117–140. [Google Scholar] [CrossRef]
- Goethals, G.R. Social Comparison Theory: Psychology from the Lost and Found. Personal. Soc. Psychol. Bull. 1986, 12, 261. [Google Scholar] [CrossRef]
- Hafner, B.R.; Elmes, D.; Read, D.; White, M.P. Exploring the role of normative, financial and environmental information in promoting uptake of energy efficient technologies. J. Environ. Psychol. 2019, 63, 26–35. [Google Scholar] [CrossRef]
- Nilsson, A.; Wester, M.; Lazarevic, D.; Brandt, N. Smart homes, home energy management systems and real-time feedback: Lessons for influencing household energy consumption from a Swedish field study. Energy Build. 2018, 179, 15–25. [Google Scholar] [CrossRef]
- Bator, R.J.; Phelps, K.; Tabanico, J.; Schultz, P.W.; Walton, M.L. When it is not about the money: Social comparison and energy conservation among residents who do not pay for electricity. Energy Res. Soc. Sci. 2019, 56, 101198. [Google Scholar] [CrossRef]
- Mi, L.; Ding, C.; Yang, J.; Yu, X.; Cong, J.; Zhu, H.; Liu, Q. Using goal and contrast feedback to motivate Chinese urban families to save electricity actively—A randomized controlled field trial. J. Clean. Prod. 2019, 226, 443–453. [Google Scholar] [CrossRef]
- de Dominicis, S.; Sokoloski, R.; Jaeger, C.M.; Schutlz, P.W. Making the smart meter social promotes long-term energy conservation. Palgrave Commun. 2019, 5, 51. [Google Scholar] [CrossRef]
- Grevet, C.; Mankoff, J.; Anderson, S.D. Design and Evaluation of a Social Visualization aimed at Encouraging Sustainable Behavior. In Proceedings of the 43rd Hawaii International Conference on System Sciences, Honolulu, HI, USA, 5–8 January 2010. [Google Scholar]
- Bird, S.; Legault, L. Feedback and Behavioural Intervention in Residential Energy and Resource Use: A Review. Curr. Sustain. Renew. Energy Rep. 2018, 5, 116–126. [Google Scholar]
- Mengolini, A.; Gangale, F.; Vasiljevska, J. Exploring community-oriented approaches in demand side management projects in Europe. Sustainability 2016, 8, 1266. [Google Scholar] [CrossRef]
- Burchell, K.; Rettie, R.; Roberts, T.C. Householder engagement with energy consumption feedback: The role of community action and communications. Energy Policy 2016, 88, 178–186. [Google Scholar] [CrossRef]
- Iweka, O.; Liu, S.; Shukla, A.; Yan, D. Energy and behaviour at home: A review of intervention methods and practices. Energy Res. Soc. Sci. 2019, 57, 101238. [Google Scholar] [CrossRef]
- Yang, D.; Timmermans, H. Households transport-home energy conservation strategies in response to energy price policies: A stated adaptation experiment based on portfolio choices and cross effects designs. Int. J. Sustain. Transp. 2016, 11, 133–147. [Google Scholar] [CrossRef]
- Anderson, K.; Song, K.; Lee, S.; Krupka, E.; Lee, H.; Park, M. Longitudinal analysis of normative energy use feedback on dormitory occupants. Appl. Energy 2017, 189, 623–639. [Google Scholar] [CrossRef]
- Song, K.; Anderson, K.; Lee, S. An energy-cyber-physical system for personalized normative messaging interventions: Identification and classification of behavioural reference groups. Appl. Energy 2020, 260, 114237. [Google Scholar] [CrossRef]
- Shealy, T.; Johnson, E.; Weber, E.; Klotz, L.; Applegate, S.; Ismael, D.; Bell, R.G. Providing descriptive norms during engineering design can encourage more sustainable infrastructure. Sustain. Cities Soc. 2018, 40, 182–188. [Google Scholar] [CrossRef]
- Lazowski, B.; Parker, P.; Rowlands, I.H. Towards a smart and sustainable residential energy culture: Assessing participant feedback from a long-term smart grid pilot project. Energy Sustain. Soc. 2018, 8, 27. [Google Scholar] [CrossRef]
- Breadsell, J.K.; Byrne, J.J.; Morrison, G.M. Household Energy and Water Practices Change Post-Occupancy in an Australian Low-Carbon Development. Sustainability 2019, 11, 5559. [Google Scholar] [CrossRef]
- OWL. OWL + USB. Energy Monitoring and Analysis. 2020. Available online: https://www.theowl.com/index.php/energy-monitors/standalone-monitors/owl-usb/ (accessed on 9 June 2022).
- Energy Saving Trust. 2012. Powering the Nation. London: Energy Saving Trust. Available online: https://energysavingtrust.org.uk/sites/default/files/reports/PoweringthenationreportCO332.pdf (accessed on 9 June 2022).
- Axhausen, K.W.; Zimmermann, A.; Schönfelder, S.; Rindsfüser, G.; Haupt, T. Observing the rhythms of daily life: A six-week travel diary. Transportation 2002, 29, 95–124. [Google Scholar] [CrossRef]
- Stopher, P.R. Use of an activity-based diary to collect household travel data. Transportation 1992, 19, 159–176. [Google Scholar] [CrossRef]
- Brand, C.; Boardman, B. Taming of the few—The unequal distribution of greenhouse gas emissions from personal travel in the UK. Energy Policy 2008, 36, 224–238. [Google Scholar] [CrossRef]
- Prelipcean, A.C.; Gidofalvi, G.; Susilo, Y.O. Comparative framework for activity-travel diary collection systems. In Proceedings of the 2015 International Conference on Models and Technologies for Intelligent Transportation Systems (MT-ITS), Budapest, Hungary, 3–5 June 2015; pp. 251–258. [Google Scholar]
- Druckman, A.; Jackson, T. The carbon footprint of UK households 1990–2004: A socio-economically disaggregated, quasi-multi-regional input–output model. Ecol. Econ. 2009, 68, 2066–2077. [Google Scholar] [CrossRef]
- Norfolk County Council, 2012-Last Update, What Is an Average Carbon Footprint in the UK? 2012. Available online: http://www.norfolk.gov.uk/Environment/Climate_change/Carbon_reduction/NCC099003 (accessed on 9 June 2013).
- Climate Change Wales, 2012-Last Update, The Average Carbon Footprint per Person in the UK. 2012. Available online: http://www.climatechangewales.org.uk/public/?id=112 (accessed on 9 June 2013).
- Herbert, I.; Brown, J. 2006-Last Update. Your Carbon Footprint Revealed. The Independent. 2013. Available online: http://www.independent.co.uk/environment/climate-change/your-carbon-footprint-revealed-climate-change-report-finds-we-each-produce-11-tons-of-carbon-a-year--and-breaks-down-how-we-do-it-427664.html (accessed on 9 June 2022).
- Department of Energy and Climate Change. Local Authority Carbon Dioxide Emissions Estimates 2012. 2014. National Statistics. Available online: https://assets.publishing.service.gov.uk/government/uploads/system/uploads/attachment_data/file/322819/20140624_Statistical_release_Local_Authority_CO2_emissions.pdf (accessed on 9 June 2022).
- Perakyla, A. Analyzing Talk and Text. In Collecting and Interpreting Qualitative Materials, 3rd ed.; Denzin, N.K., Lincoln, Y.S., Eds.; Sage Publications: London, UK, 2008; pp. 351–374. [Google Scholar]
- Holliday, A. Doing and Writing Qualitative Research, 2nd ed.; Sage Publications: London, UK, 2010. [Google Scholar]
- Burnard, P. Searching for meaning: A method of analysing interview transcripts with a personal computer. Nurse Educ. Today 1994, 14, 111–117. [Google Scholar] [CrossRef]
- Oxford City Council. Age and Gender. 2011 Census, Oxford City Council. 2018. Available online: https://www.oxford.gov.uk/downloads/file/1081/population_by_gender_and_age (accessed on 9 June 2022).
- Office for National Statistics. 2001 Vs 2011 Census—Car Ownership, (2013). Available online: http://www.ons.gov.uk/ons/interactive/census-map-2-1—car-ownership/index.html (accessed on 9 June 2013).
- Allison, C.K.; Stanton, N.A. Eco-driving: The role of feedback in reducing emissions from everyday driving behaviours. Theor. Issues Ergon. Sci. 2019, 20, 85–104. [Google Scholar] [CrossRef]
- Gossling, S. ICT and transport behavior: A conceptual review. Int. J. Sustain. Transp. 2018, 12, 153–164. [Google Scholar] [CrossRef]
- Buchs, M.; Bahaj, A.S.; Blunden, L.; Bourikas, L.; Falkingham, J.; James, P.; Kamanda, M.; WU, Y. Promoting low carbon behaviours through personalised information? Long-term evaluation of a carbon calculator interview. Energy Policy 2018, 120, 284–293. [Google Scholar] [CrossRef]
- Sustainable Development Commission. Seeing the Light: The Impact of Micro- Generation on the Way We Use Energy; Sustainable Development Commission: London, UK, 2005. [Google Scholar]
- Zhang, J. To connect the past with the future. In Transport and Energy Research; Elsevier: Amsterdam, The Netherlands, 2020; pp. 393–416. [Google Scholar]
- Zong, W.; Zhang, J.; Jiang, Y. 2020. Life-oriented household energy consumption research. In Transport and Energy Research; Elsevier: Amsterdam, The Netherlands, 2020; pp. 373–391. [Google Scholar]
- Noel, L.; de Rubens, G.Z.; Kester, J.; Sovacool, B.K. Beyond emissions and economics: Rethinking the co-benefits of electric vehicles (EVs) and vehicle-to-grid (V2G). Transp. Policy 2018, 71, 130–137. [Google Scholar] [CrossRef]
- Wu, G.; Inderbitzin, A.; Bening, C. Total cost of ownership of electric vehicles compared to conventional vehicles: A probabilistic analysis and projection across market segments. Energy Policy 2015, 80, 196–214. [Google Scholar] [CrossRef]
- Cellina, F.; Bucher, D.; Veiga Simao, J.; Rudel, R.; Raubal, M. Beyond Limitations of Current Behaviour Change Apps for Sustainable Mobility: Insights from a User-Centered Design and Evaluation Process. Sustainability 2019, 11, 2281. [Google Scholar] [CrossRef]


Publisher’s Note: MDPI stays neutral with regard to jurisdictional claims in published maps and institutional affiliations. |
© 2022 by the authors. Licensee MDPI, Basel, Switzerland. This article is an open access article distributed under the terms and conditions of the Creative Commons Attribution (CC BY) license (https://creativecommons.org/licenses/by/4.0/).