Article

Determination of Air Pollutants: Application of a Low-Cost Method for Preparation of VOC Mixtures at Known Concentration

Politecnico di Milano, Department of Chemistry, Materials and Chemical Engineering “Giulio Natta”, Piazza Leonardo da Vinci 32, 20133 Milano, Italy
*
Author to whom correspondence should be addressed.
Sustainability 2022, 14(15), 9149; https://doi.org/10.3390/su14159149
Submission received: 30 May 2022 / Revised: 13 July 2022 / Accepted: 19 July 2022 / Published: 26 July 2022

Abstract

:
Gas chromatography (GC) is an excellent tool to obtain qualitative and quantitative information on volatile organic compounds (VOCs) present in gaseous samples. However, to carry out an appropriate quantitative analysis of unknown samples, the use of known concentration gas mixtures, to exploit as standards, is required. Commonly, these mixtures are obtained from cylinders of compressed gas at known concentrations: this involves a considerable economic outlay and problems relating to their handling. This paper aims to apply a method, proposed as a versatile, simple, and economical alternative to the use of such cylinders, for preparing gaseous calibration standards useful to obtain calibration curves for quantification of air pollutants. In addition, the operative limits of this method were investigated. The method involves the continuous injection of volatile compounds in liquid form into a stream of neutral gas, such as air or nitrogen. Exploiting the high volatility of the compounds used, it is possible to generate a continuous gas stream containing the chosen VOC at the desired concentration based on the mass balance of the system. This method proved to be suitable for compounds with volatility ranging from 36 kPa to 0.1 kPa at 293 K and it showed relative bias and relative standard deviation (RSD) values of less than 16% and 8%, respectively. The described dynamic method results are repeatable and accurate. It can be used effectively for compounds with vapour pressure values within the stated limits and provides a more versatile and cost-effective alternative to compressed gas cylinders.

Graphical Abstract

1. Introduction

Gas chromatography (GC) is a common technique adopted for the analysis (both qualitative and quantitative) of complex mixtures of gaseous emissions. However, the response of GC is not absolute and different strategies can be used to correlate the signal produced by analytes and their concentration, mainly based on the calibration of the instrument. A common calibration procedure is the “external standard calibration method” [1,2]. In particular, this procedure is recommended for the analysis of air mixtures contained in polymer bags (mainly fabricated of Tedlar™ or Nalophan™) which are directly analysed, as in the case of odour samples as provided for by the regulations EN 13725:2022 [3]. Therefore, bags containing mixtures at known concentrations are required to be used as external standards [4]. One of the main problems of this type of analysis is the preparation of the external standards to be used to construct a calibration curve [1,5].
Commonly, to obtain these standards, cylinders containing the desired compounds in the gaseous form at the concentrations of interest, are adopted [6,7]. However, the use of gas cylinders involves critical issues mainly due to the management and storage aspects of the cylinders themselves [8].
One of the main problems related to the use of gas cylinders is due to their dangerousness. Depending on the chemical characteristics of the gas contained, a gas cylinder can cause different hazards [9]:
Under-oxygenated atmospheres with the danger of asphyxiation (inert gases);
Explosive atmospheres (flammable gases);
Over-oxygenated atmospheres (oxygen), in which case the slightest flame or spark can ignite any combustible substance present.
Therefore, strict safety rules must be followed to minimize these risks [8,10].
Another problem inherent in the use of cylinders is that they provide a gaseous sample at a single concentration. However, during analyses of real samples, several standards at different concentrations are required for accurate and precise calibration. This involves the purchase of a large number of cylinders or their dilution, resulting in relative errors or, in the case of high-precision dilution instruments, costs that are often prohibitive and long procurement times.
Focusing on volatile organic compounds (VOCs), which are by definition characterized by high volatility [11,12], a more economical and versatile solution lies in the application of a system able to provide, quickly and reliably, any desired mixture at a known concentration: VOC pure liquids can be used as raw materials, exploiting their volatility [13] to obtain gaseous external standards.
The use of pure liquids overcomes both the problems and constraints associated with the storage and the use of cylinders, because liquids are less sensitive to environmental conditions and occupy smaller volumes, making them easier to manage while complying with safety regulations.
In addition, this option is also much more versatile, since by varying the amount of liquid to be vaporised, samples of different concentrations can be obtained directly, without the need for dilution. The only physical constraint is the equilibrium concentration of the liquid and gas phases, i.e., the concentration at which the gas and liquid phases are in thermodynamic equilibrium so that the evaporation rate equals the condensation rate. Therefore, the creation of mixtures at a known concentration using pure liquids is particularly interesting, especially in the case of the analysis of complex mixtures, characterised by high variability, both in terms of nature and concentration of VOCs.
For these reasons, this work aims to describe, apply, and investigate the operative limits of an experimental method to produce gaseous standards at known concentrations from pure liquids to be subsequently used as reference material for the quantification of volatile organic compounds, useful to monitor and control VOCs emissions in the atmosphere.
In particular, a dynamic method for injection was investigated [14,15,16]. This method is based on the introduction of a dosed liquid into a dilution gas flow, such as air or nitrogen, and it produces a continuous gas flow of gas mixture at a known concentration. Similar methods have already been used for different applications [17,18,19]. However, a study of the applicability of this method for the creation of standards of a known concentration to be used in gas chromatography has not been carried out. For this reason, this paper aims to examine this experimental method, assessing its feasibility, characteristics, and operational limitations.

2. Materials and Methods

The dynamic method under investigation involves the continuous injection of a volatile liquid into a stream of neutral gas (i.e., which does not chemically interfere with the selected compounds), such as air or nitrogen. Exploiting the volatility of the compounds used, it is possible to generate a continuous gas stream containing the chosen organic compound due to the vaporization of the liquid. To obtain a controlled stream of a dilution gas, a mass flow controller was used, capable of providing a defined and constant gas flow. It is also essential to generate a continuous stream with a stable and defined flow rate of the liquid to be vaporised: a syringe pump was used for this purpose. The target concentration was obtained by the material balance conducted on the mixing node. A depiction of the fluxes present in the system is reported in Figure 1, a simplified diagram of the system. To meet the desired concentration, the degrees of freedom of the system are the flow rate of the gaseous stream, Qgas; and the pumping velocity of the syringe, v.

2.1. Equations

As mentioned, to characterise the system and estimate the outlet concentration, it is necessary to derive the equations describing the system.
The molar flow of the neutral gas used, Ngas (mol/h), entering the system is expressed by the following equation:
N gas = P · Q gas R · T
where:
P = standard pressure (1 atm);
Qgas = volumetric air flow rate (SL/h);
R = gas constant (0.082 L·atm/K/mol);
T = standard temperature (293 K).
The molar flow of the VOC entering the system (NVOC) is expressed as:
N VOC = A · v · ρ MW
where:
A = cross section (m2);
v = injection velocity (m/h);
ρ = liquid density (kg/m3);
MW = molecular weight (kg/mol).
The adopted injection velocities are reported in Supplementary Materials.
Finally, the concentration of VOC (CVOC), expressed in ppm at the outlet of the system can be expressed as:
C VOC = N VOC N VOC + N gas · 10 6  
where CVOC is the target known concentration, collected in a bag at the outlet of the system: v and Qgas may be set accordingly.

2.2. Materials

A variety of materials were used when conducting the experimental tests for preparing known bagged mixtures from VOC pure liquids:
Syringes: Hamilton™ 80384: glass liquid syringe with a maximum capacity of 10 µL, with an internal diameter equal to 0.485 mm, suitable for syringe pump use;
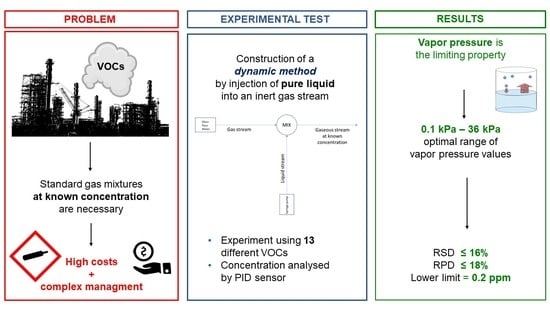
Reagents: Several VOCs, in pure liquid form, from different classes of compounds were chosen and are listed in Table 1 where producers and main properties are provided too, calculated at 293 K [20]. These VOCs were selected due to their potential presence in odorous emissions, their potential odorous/toxicological impact [21], and their different chemical–physical parameters, as shown in Table 1;
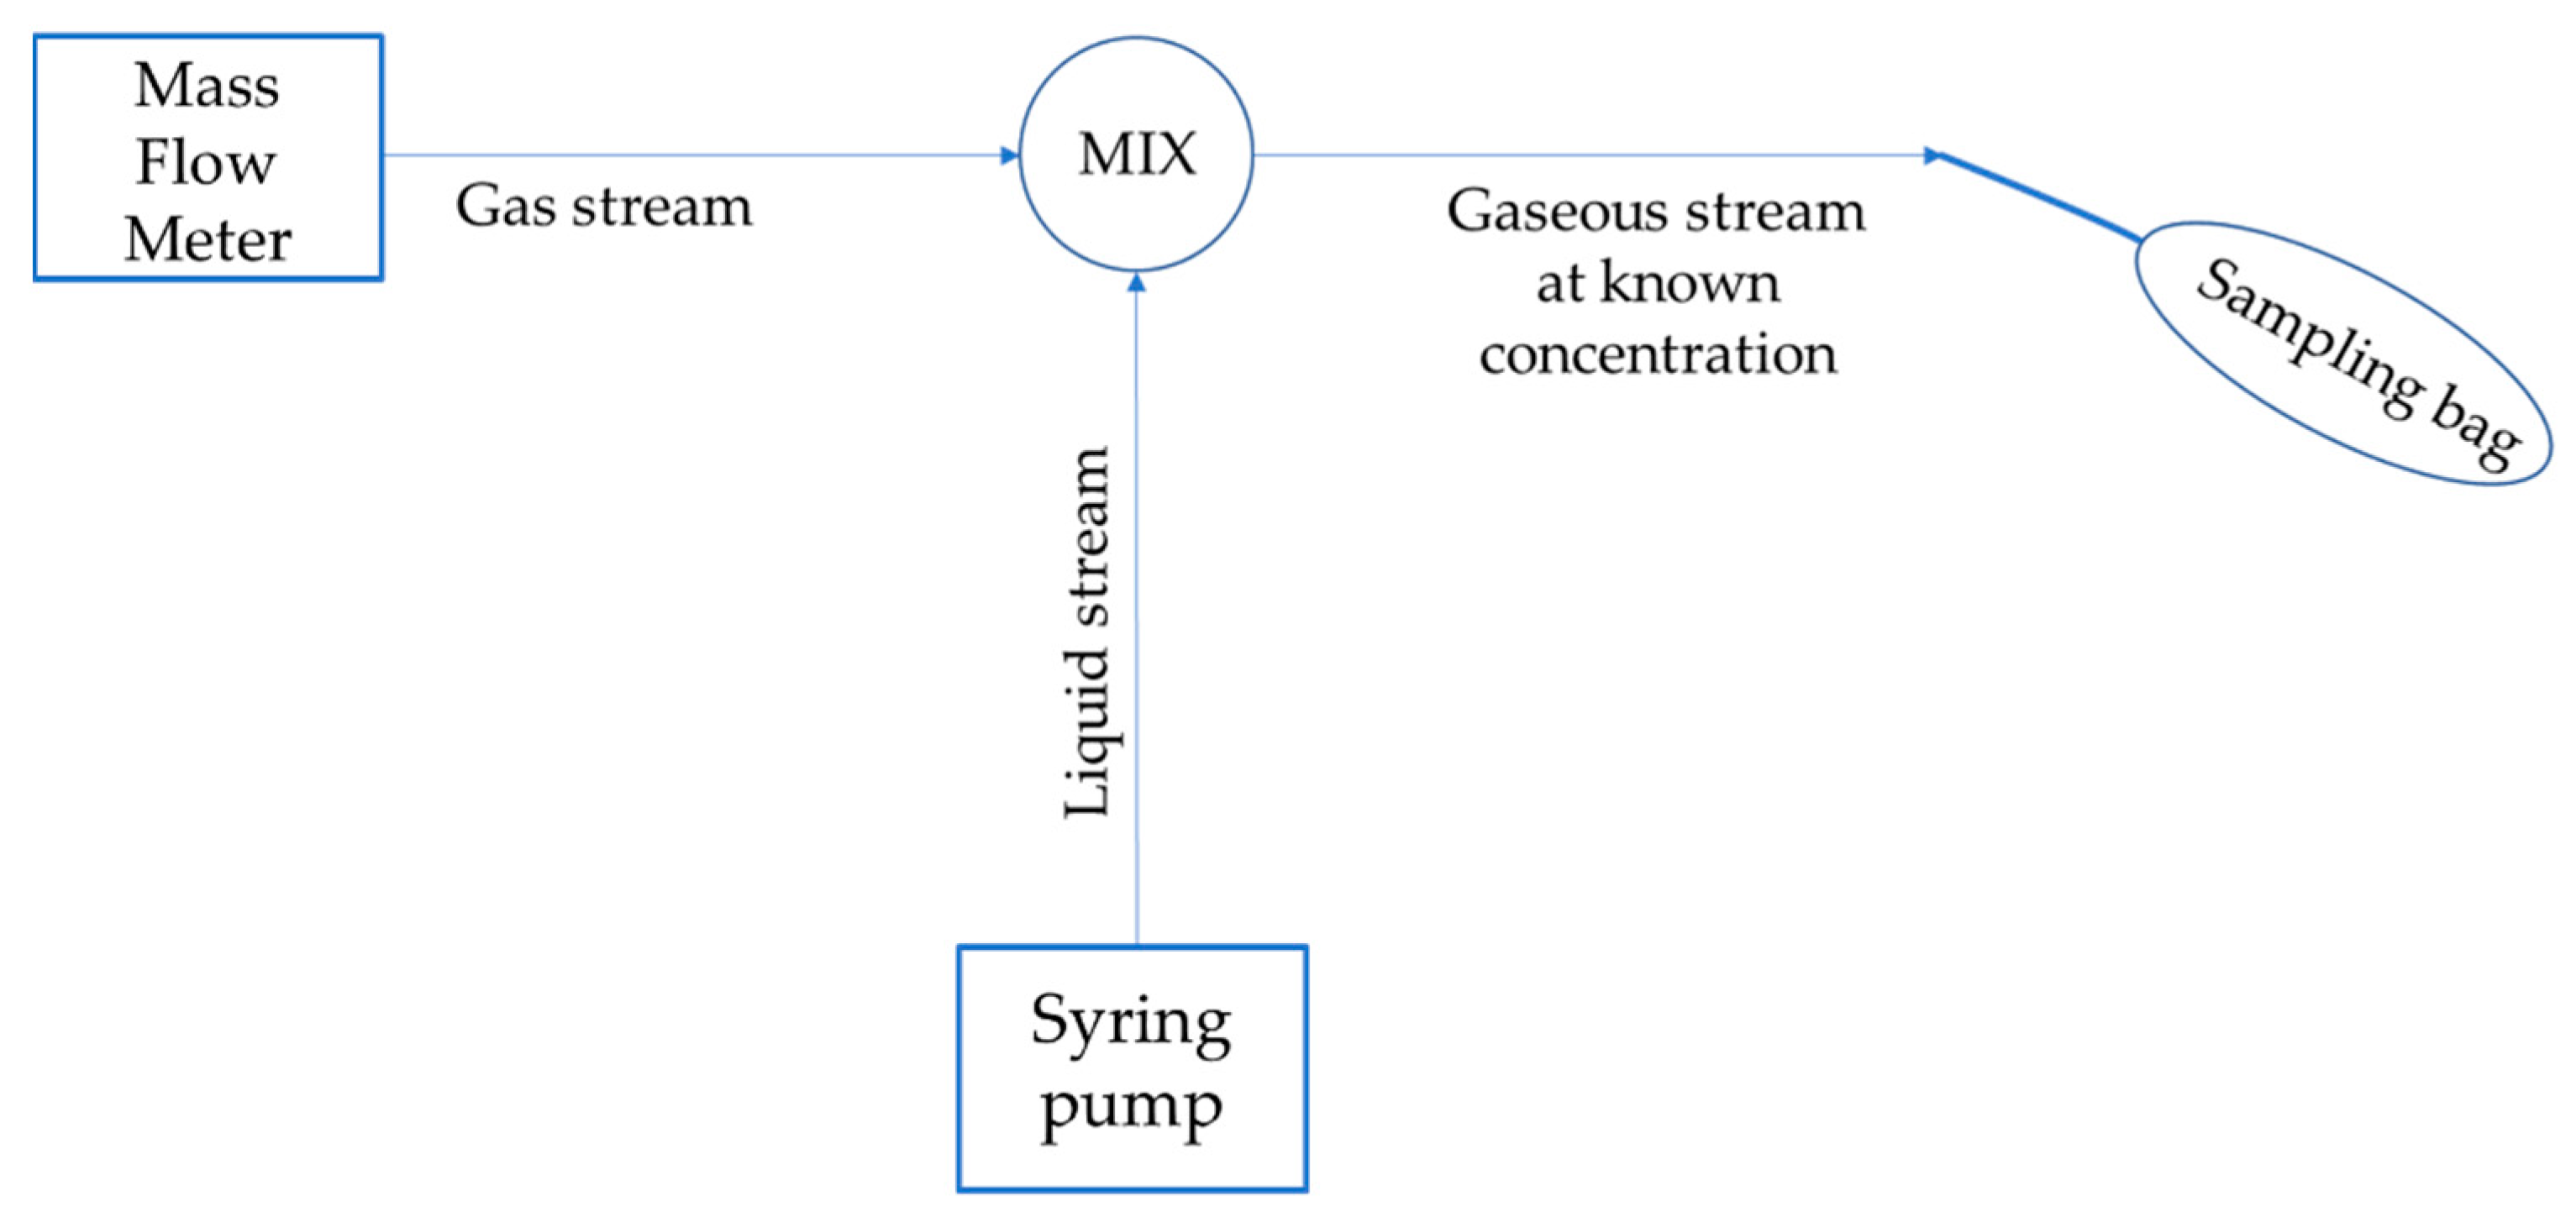
Mass flow meter: Alicat™ Portable Calibration Unit Mass Flow Meters, an instrument used to set the desired flow rate of the diluting gas;
Nitrogen: SAPIO® liquid evaporated pure nitrogen, used as diluent gas;
Syringe pump: NE-300 Just Infusion™ Syringe Pump. It allows obtaining the continuous injection of liquid inside the mixing node. By setting the diameter of the syringe used and the required injection rate, it maintains the proper linear velocity of the pump to control the set point liquid flow;
Nalophan: Nalo Kalle™. This is the constituent material of the bags used to sample the gaseous mixture flows to be analysed. It is a transparent material, with characteristics that make it particularly suitable for containing gas mixtures: it is impermeable, inert, odourless, and resistant to traction, tearing, and impact [3].

2.3. Analysis

To evaluate the effectiveness of the methods, a photoionization detector (PID) TIGER Ion Science® sensor, equipped with a 10.6 eV UV lamp, was used to assess the concentration levels present in the prepared mixtures.
This instrument allows the quick detection of the total concentration of VOCs in air, usually expressed in ppm of isobutylene.
The instrument is calibrated with isobutylene and allows the quantification of several volatile compounds by means of response factors (RFs), reported in Table 2, that corrects the signal of the sensor according to the selected compound. The sensor is not able to distinguish between different compounds, so it is an effective tool especially when the compound to be quantified is uniquely known in advance, as in the case of this work.
Because this study evaluates only single VOCs in a nitrogen mixture, the measurement carried out using this sensor provides instantaneous results: this is a great advantage over traditional chromatographic analysis, allowing more expeditious tests to be carried out [22].

3. Results and Discussion

3.1. Gross Results

To verify the efficiency of this method, tests were carried out for all 13 compounds, producing samples at target concentrations of 5 ppm, 10 ppm, and 15 ppm. The mixtures, prepared according to the described method, were analysed using PID.
For each compound, the graph in Figure 2 depicts the correlation of expected and measured concentrations, expressed in ppm. All tests were performed in duplicate.
All the mixtures analysed were prepared at the same working temperature of 293 K ± 1 K. To ensure steady-state conditions at the mixing node, 10 residence times were elapsed before sampling the outlet flow.
In all the graphs of Figure 2, which report the comparison of the expected (on x-axis) and measured concentration (y-axis), the regression lines (y = mx + q) are reported.
The ideal conditions, i.e., perfect correspondence between expected and measured values, leads to an equation of the type y = x (m = 1, q = 0), i.e., the bisector of the first quadrant.
Observing the numerical results, it can be noticed that the value of m is always between 0.93 and 1.09 (Table 3), which indicates that the slope of the lines diverges from the ideal value (m = 1) by a maximum of 10% in terms of percentage deviation.
As far as the value of the intercept q is concerned, it is always positive and almost constant: its value is in fact between 1.1 and 4.4 ppm among all the compounds analysed. This bias can be due to the measuring instrument itself, whose background signal never completely zeroes out.
These observations do not apply to dodecane and pentane. Indeed, these compounds show anomalous behaviour, both regarding the equations of the regression lines of the measured concentration/expected concentration graph and the value of the coefficient of determination R2 of the lines, whose dodecane and pentane values are the lowest of all the compounds considered.
The results obtained from these tests showed that the pentane-containing mixtures reveal measured concentrations higher than the expected ones, while mixtures containing dodecane reveal measured values almost constant despite varying the expected concentration. To investigate the discriminating factors for these compounds, several chemical–physical properties, related to the vaporization phenomenon or the motion of the liquid in the syringe [23,24], were examined (in fact, the described method is essentially driven by the capacity of the liquid to vaporise at the mixing node and the capacity to be effectively pushed out by the syringe pump).
For these reasons, the two most significant properties are vapour pressure, which denotes the tendency of a liquid particle to transform into gaseous form (the higher the vapour pressure the greater the tendency to vaporize); and viscosity, which quantifies the internal frictional force between adjacent layers of fluid that are in relative motion (the higher the viscosity the greater the resistance to motion).
In particular, Figure 3 shows that pentane and dodecane have extreme vapour pressure values compared with the other compounds considered: in fact, pentane is the most volatile compound and dodecane the least volatile.
In particular, for pentane, the measured concentration values are up to three times higher than expected. This difference is too high to be attributed to sensor uncertainty or fouling but can be caused by excessive and uncontrolled vaporisation of the pentane
Indeed, one of the most common problems linked to the injection of volatile compounds by syringe is the spontaneous evaporation of the compound from the syringe needle due to a non-optimal seal of the syringe itself [25].
Differently, in the case of dodecane, from the obtained equations, it can be seen that the angular coefficients have values much closer to the null value than to the expected value, representing an almost constant function when the expected value varies.
Moreover, in this case, the limiting factor appears to be the vapour pressure too, which is too low to ensure proper vaporisation. Indeed, it has been experimentally observed that the liquid accumulates on the needle tip and a droplet is formed. This droplet is unable to be vaporized by the entering gas stream; therefore, it enlarges and settles in the mixing node.

3.2. Repeatability and Accuracy

To determine the repeatability of the method in a wide concentration range, tests were carried out using toluene as a sample compound. In particular, mixtures with a broader theoretical concentration range, of 5–15–37–51–77 ppm, were analysed in triplicate. The results are shown in the graph below (Figure 4).
To study the repeatability, the value of the relative standard deviation (RSD %), and the relative uncertainties, evaluated as relative percent difference (RPD%) were calculated [26]. The values obtained are reported in Table 4.
As shown in the table, the relative standard deviation (RSD %) and the maximum relative bias values were less than 20% and 10%, respectively. This demonstrates the good reproducibility of the method [27].
The average relative percentage difference concerning the expected value was calculated to establish the accuracy of the method, its value can be set at 10% [27], which was calculated on all the tests conducted, confirming an acceptable accuracy of the method.

3.3. Low Concentration

Having established the reliability of the method for >1 ppm concentrations, the lower operating limits of the method were investigated. Mixtures containing toluene at 0.78 ppm, 0.40 ppm, and 0.20 ppm were prepared. The analyses were carried out using the PID sensor, and the results are shown in Figure 5.
The concentration of 0.2 ppm was identified as the minimum concentration directly obtainable by the described method. Below this concentration, there are operational limits due to the injection speed of the syringe pump and the gas flow rate to be supplied: lower concentrations can be achieved by increasing the gas flow rate or decreasing the syringe speed (or both). However, the tests showed that to achieve 0.1 ppm, the gas flow rate would have to be set too high and would not guarantee the correct operation of the process as the pressure results too high at the mixing node causing tightness problems. On the other side, the injection speed must be set too low, resulting in ineffective injection. As evidence of these considerations, the tests carried out to prepare mixtures containing 0.1 ppm of toluene detected no traces of the compound in the final mixture.
It was therefore concluded that the lower critical speed that could be imposed on the syringe pump was 0.03 μL/min, for the used 10 μL syringe, while the maximum gas flow rate was 1800 SL/h, which is the setting used to obtain the concentration of 0.2 ppm of toluene.

4. Conclusions

In the present work, the applicability of a dynamic injection method for the low-cost preparation of gaseous standards for GC analysis was investigated. The method appears simple, versatile, and useful and is based on the constant injection of VOC liquid through a pump syringe into a stream of diluting gas to obtain a gaseous flow at the desired concentration due to the vaporisation of the liquid itself.
From the results obtained, the studied dynamic method is repeatable and accurate, showing a relative percentage difference lower than 10% compared with the expected value, and a RSD and relative bias lower than 16% and 8%, respectively.Moreover, it allows concentrations as low as 0.2 ppm of toluene to be achieved directly (without further dilution), by setting a pumping rate of 0.03 μL/min and 1800 SL/h of gas flow rate. These two values were considered the lower limits for the proper functioning of the method.
The main limitation of this method is the volatility of the liquid compounds used. Indeed, from the results obtained, it appears that compounds such as pentane and dodecane are too volatile and not volatile enough, respectively; this leads in the first case to uncontrolled vaporisation of the liquid due to a non-optimal syringe tightness, and in the second case to an accumulation of liquid which does not vaporise during injection under stationary condition.
Through this experimental assessment, it is possible to consider acceptable vapour pressure, useful for guaranteeing the effectiveness of the method, as a range between 36 kPa and 0.1 kPa, identified through the vapour pressure values of cyclopentane and decane. In this range, the presented method can be a reliable and expeditious solution for external standard calibration for VOCinair analysis.
One possible future step is to implement dilution steps in series, to be added to the injection-generated gas stream, to achieve final concentrations of the mixtures even lower than the 0.2 ppm detected. To gain the same goal, the injection of water-VOC liquid solutions may also be implemented.
Finally, the use of VOCs liquid mixtures to produce a multi-component gas stream mixture can be an interesting option, since it is possible to obtain a simultaneously quantitative analysis of the relevant VOCs in real atmospheric samples, and make it possible to compare them with traditional calibration methods.

Supplementary Materials

The following supporting information can be downloaded at: https://www.mdpi.com/article/10.3390/su14159149/s1, Table S1: Pumping rates—n-Butanol; Table S2: Pumping rates—Cyclohexane; Table S3: Pumping rates—Cyclopentane; Table S4: Pumping rates—Decane; Table S5: Pumping rates—Dodecane; Table S6: Pumping rates—Dimethyl disulphide; Table S7: Pumping rates—Heptane; Table S8: Pumping rates—Hexane; Table S9: Pumping rates—Isooctane; Table S10: Pumping rates—Methyl ethyl ketone; Table S11: Pumping rates—2-methylpentane; Table S12: Pumping rates—Pentane; Table S13: Pumping rates—Toluene.

Author Contributions

Conceptualization, M.I. and S.S.; methodology, E.P. and M.I.; formal analysis, L.S. and M.I.; investigation, L.S.; data curation, L.S. and E.P.; writing—original draft preparation, L.S.; writing—review and editing, E.P., M.I. and S.S.; supervision, S.S. All authors have read and agreed to the published version of the manuscript.

Funding

This research received no external funding.

Institutional Review Board Statement

Not applicable.

Informed Consent Statement

Not applicable.

Data Availability Statement

Data are contained within the article or Supplementary Materials.

Conflicts of Interest

The authors declare no conflict of interest.

References

  1. Engewald, W.; Dettmer-Wilde, K. Practical Gas Chromatography; Springer: Berlin Heidelberg, Germany, 2014; ISBN 978-3-642-54639-6. [Google Scholar] [CrossRef]
  2. ASTM D7360; Standard Test Method for Analysis of Benzene by Gas Chromatography with External Calibration. ASTM: West Conshohocken, PA, USA, 2016.
  3. EN 13725:2022; Determination of Odour Concentration by Dynamic Olfactometry and Odour Emission Rate. CEN-CENELEC Management Centre: Brussels, Belgium, 2022.
  4. Papurello, D. Direct injection mass spectrometry technique for the odorant losses at ppb(v) level from nalophanTM sampling bags. Int. J. Mass Spectrom. 2019, 436, 137–146. [Google Scholar] [CrossRef]
  5. Lakshmi HimaBindu, M.R.; Angala Parameswari, S.; Gopinath, C. A review on GC-MS and method development and validation. Int. J. Pharm. Qual. Assur. 2013, 4, 42–51. [Google Scholar]
  6. Fernandes, Y.; Bry, A.; de Persis, S. Identification and quantification of gases emitted during abuse tests by overcharge of a commercial Li-ion battery. J. Power Sources 2018, 389, 106–119. [Google Scholar] [CrossRef]
  7. Liu, D.; Nyord, T.; Rong, L.; Feilberg, A. Real-time quantification of emissions of volatile organic compounds from land spreading of pig slurry measured by PTR-MS and wind tunnels. Sci. Total Environ. 2018, 639, 1079–1087. [Google Scholar] [CrossRef] [PubMed]
  8. EN 14470-2; Fire Safety Storage Cabinets—Part 2: Safety cabinets for pressurised gas cylinders. CEN-CENELEC Management Centre: Brussels, Belgium, 2006. [CrossRef]
  9. European Industrial Gases Association Aisbl. Hazards of Oxygen-Deficient Atmospheres; European Industrial Gases Association Aisbl: Bruxelles, Belgium, 2018. [Google Scholar]
  10. ISO 11625:2007; Gas Cylinders—Safe Handling. ISO: Geneva, Switzerland, 2007.
  11. Invernizzi, M.; Roveda, L.; Polvara, E.; Sironi, S. Lights and Shadows of the Voc Emission Quantification. Chem. Eng. Trans. 2021, 85, 109–114. [Google Scholar] [CrossRef]
  12. European Union Publications Office. The VOC Solvent Emission Directive EUR-Lex.; European Union Publications Office: Luxembourg, 2010. [Google Scholar]
  13. ISO 6145-2:2014; Gas analysis—Preparation of calibration gas mixtures using dynamic methods—Part 2: Piston pumps. ISO: Geneva, Switzerland, 2014.
  14. Platonov, I.A.; Rodinkov, O.V.; Gorbacheva, A.R.; Moskvin, L.N.; Kolesnichenko, I.N. Methods and devices for the preparation of standard gas mixtures. J. Anal. Chem. 2018, 73, 109–127. [Google Scholar] [CrossRef]
  15. Barratt, R.S. The preparation of standard gas mixtures a review. Analyst 1981, 106, 817–849. [Google Scholar] [CrossRef]
  16. ISO 6145-4:2004; Gas analysis—Preparation of calibration gas mixtures using dynamic volumetric methods—Part 4: Continuous syringe injection method. ISO: Geneva, Switzerland, 2004.
  17. Rhoderick, G.C.; Yen, J.H. Development of a NIST Standard Reference Material Containing Thirty Volatile Organic Compounds at 5 nmol/mol in Nitrogen. Anal. Chem. 2006, 78, 3125–3132. [Google Scholar] [CrossRef] [PubMed]
  18. Abdelkhalik, A.; Makhlouf, G.; Hassan, M.A. A new implementation of EN1839 method T mixture preparation to prepare calibration gas mixtures for anesthetic gas monitors. J. Clin. Monit. Comput. 2021, 35, 1069–1076. [Google Scholar] [CrossRef] [PubMed]
  19. Li, Y.; Täffner, T.; Bischoff, M.; Niemeyer, B. Test gas generation from pure liquids: An application-oriented overview of methods in a nutshell. Int. J. Chem. Eng. 2012, 2012, 417029. [Google Scholar] [CrossRef]
  20. Perry, R.; Green, D.W. Perry’s Chemical Engineers’ Handbook; McGraw-Hill Education: New York, NY, USA, 2018. [Google Scholar]
  21. Spinazzè, A.; Polvara, E.; Cattaneo, A.; Invernizzi, M.; Cavallo, D.M.; Sironi, S. Dynamic Olfactometry and Oil Refinery Odour Samples: Application of a New Method for Occupational Risk Assessment. Toxics 2022, 10, 202. [Google Scholar] [CrossRef] [PubMed]
  22. Spinelle, L.; Gerboles, M.; Kok, G.; Persijn, S.; Sauerwald, T. Review of portable and low-cost sensors for the ambient air monitoring of benzene and other volatile organic compounds. Sensors 2017, 17, 1520. [Google Scholar] [CrossRef] [PubMed] [Green Version]
  23. Alibakhshi, A. Enthalpy of vaporization, its temperature dependence and correlation with surface tension: A theoretical approach. Fluid Phase Equilib. 2017, 432, 62–69. [Google Scholar] [CrossRef]
  24. Zhang, Y.; Han, D.; Dou, Z.; Veilleux, J.C.; Shi, G.H.; Collins, D.S.; Vlachos, P.P.; Ardekani, A.M. The Interface Motion and Hydrodynamic Shear of the Liquid Slosh in Syringes. Pharm. Res. 2021, 38, 257–275. [Google Scholar] [CrossRef] [PubMed]
  25. Grob, K. Split and Splitless Injection for Quantitative Gas Chromatography; Wiley: Hoboken, NJ, USA, 2001; ISBN 3527298797. [Google Scholar]
  26. Hu, W.; Huang, B.; Weindorf, D.C.; Chen, Y. Metals Analysis of Agricultural Soils via Portable X-ray Fluorescence Spectrometry. Bull. Environ. Contam. Toxicol. 2014, 92, 420–426. [Google Scholar] [CrossRef] [PubMed]
  27. U.S. Environmental Protection Agency. Compendium of Methods for the Determination of Toxic Organic Compounds in Ambient Air: Compendium Method TO-15; Report No. EPA/625/R-96/010b; U.S. Environmental Protection Agency: Washington, DC, USA, 1999.
Figure 1. Simplified diagram of the system.
Sustainability 14 09149 g001
Figure 2. Measured vs expected value graphs.
Sustainability 14 09149 g002
Figure 3. Vapour pressure values for the compounds considered in the test.
Sustainability 14 09149 g003
Figure 4. Tests at 5–77 ppm of toluene.
Sustainability 14 09149 g004
Figure 5. Tests at 0.2–0.4–0.78 ppm of toluene.
Sustainability 14 09149 g005
Table 1. Tested compounds properties.
CompoundVapour Pressure @ 293 K(Pa)Viscosity (mm2/s)Density (kg/m3)Surface
Tension (mn/m)
Purity (%)Producer
Toluene29000.68672899.0%Sigma-Aldrich®
Pentane57,0000.462616≥99.0%Sigma-Aldrich®
Hexane16,0000.566018≥95.0%Sigma-Aldrich®
Heptane47030.66842099.0%Sigma-Aldrich®
2-Methylpentane22,7000.665317≥95.0%Sigma-Aldrich®
Isooctane53000.769022≥99.5%Sigma-Aldrich®
Decane1271.37302499.5%Sigma-Aldrich®
Dodecane122.075025≥99.0%Sigma-Aldrich®
n-Butanol6253.78107099.8%Sigma-Aldrich®
Cyclopentane36,6600.67512398.0%Sigma-Aldrich®
Cyclohexane10,3841.37792599.5%Sigma-Aldrich®
Methyl ethyl ketone (MEK)98670.580525≥99.0%Sigma-Aldrich®
Dimethyl disulphide (DMDS)30000.61′06044≥99.0%Sigma-Aldrich®
Table 2. PID response factor: the values are defined by the producer.
CompoundPID Response Factor (Lamp Type 10.6 eV)
Toluene0.56
Pentane7
Hexane3
Heptane2.2
2-Methylpentane3
Isooctane1.1
Decane1.2
Dodecane1
n-Butanol3.9
Cyclopentane10
Cyclohexane1.3
Methyl ethyl ketone (MEK)0.96
Dimethyl disulphide (DMDS)0.2
Table 3. m, q, and R2 values for the different compounds analysed.
CompoundmqR2
n-Butanol1.090.60.999
Cyclohexane1.003.40.999
Cyclopentane0.940.91.000
Decane1.070.20.999
Dodecane0.052.30.949
Dimethyl disulphide (DMDS)1.041.50.999
Heptane0.974.00.999
Hexane1.032.30.999
Isooctane1.091.21.000
Methyl ethyl ketone (MEK)1.014.30.999
2-methylpentane1.011.40.994
Pentane1.208.90.998
Toluene0.932.00.999
Table 4. Statistical parameters, RSD and RPD.
Theoretical Concentration
(ppm)
RSD%RPD%
515%8%
1513%7%
3716%8%
5116%8%
775%3%
Publisher’s Note: MDPI stays neutral with regard to jurisdictional claims in published maps and institutional affiliations.

