Article

Monitoring Land Use Land Cover Changes and Modelling of Urban Growth Using a Future Land Use Simulation Model (FLUS) in Diyarbakır, Turkey

Geography Department, Faculty of Humanity and Social Sciences, Fırat University, Elazığ 23150, Turkey
*
Author to whom correspondence should be addressed.
Sustainability 2022, 14(15), 9180; https://doi.org/10.3390/su14159180
Submission received: 25 May 2022 / Revised: 6 July 2022 / Accepted: 18 July 2022 / Published: 27 July 2022
(This article belongs to the Special Issue Assessment and Monitoring of Land Degradation)

Abstract

:
Land use and land cover (LULC) change corresponds to the greatest transformations that occur on the earth’s surface under physical, human and socio-economic geographical conditions. Increasing demand for residential and agricultural lands has been transforming all land classes and this should be investigated in the long term. In this study, we aim to determine LULC change and land use simulation in Diyarbakır with Geographical Information System (GIS) and Remote Sensing (RS) techniques. For this purpose, satellite images from 1984, 2002, and 2020 were classified at different levels by an object-based classification method. Accuracy assessments of the classified images were made and change detection analyses were performed using TerrSet software. The LULC changes were also estimated in different scenarios using a future land use simulation model (FLUS). The results show that natural and semi-natural areas are rapidly disappearing due to urban growth between 1984 and 2020. The results of the land use simulation show that by 2038, while the agricultural, pasture and water bodies will decrease, the built-up areas will increase. It is estimated that the city, which has developed in a west-northwest direction, will expand in the future and grow between Elazığ and Şanlıurfa Boulevard.

1. Introduction

Land significantly affects human life and provides raw materials such as food, water and energy for human survival [1]. It is the primary natural resource for terrestrial ecosystems and is very important for the development of a region or country [2]. As a natural resource, land is of vital importance for the nourishment of living things and the economic benefit of people [3]. Within the scope of the natural environment and human interaction, human beings have learned to benefit from land in various ways since its existence. The rapidly increasing world population and the increasing demands of this population have increased the pressure on land. In this respect, fragile ecosystems, especially forest lands and wetlands, have been exposed to anthropogenic land changes.
Land use/land cover (LULC) are concepts that are used together but often confused [4]. While land use is associated with human activities on the land, land cover refers to the physical and human elements that cover the surface [5,6]. The term LULC has often been discussed together in academic studies [6]. LULC change is defined as human modification of the terrestrial surface [7] and is one of the most important man-made changes between society and environment [8]. These changes incur significant global land cover transformation [9,10] and pressure from human activities has caused land degradation [11]. LULC change has accelerated prominently over the last 40 years [12,13]. This change generally occurs as a result of anthropogenic effects [14]. Land changes in metropolitan areas lead to the rapid disappearance of primary agricultural lands [15], which causes fragmentation of the rural landscape.
Urban lands can be defined as human-dominated ecosystems [16] and are characterized as a dense build-up containing physically man-made structures [17]. Natural and semi-natural areas around the city are rapidly changing and transforming due to human influence [18]. Urbanization is the main cause of environmental change and disrupts ecosystem structure and functions [19]. Local, regional and global dynamics of cities cause land degradation by destroying natural resources [20]. Dominant biophysical, social and economic factors in metropolises accelerate urban sprawl and deeply affect the landscape pattern around urban areas.
More than 25,000 studies were queried using the keyword “land use change” in the Web of Science (WoS) literature database. This keyword was used in the database for the first time in the 1970s, and after the 2000s the number of publications and citations increased rapidly as a result of developments in the field of GIS and RS. A significant portion (55%) of these studies are in the field of environmental science ecology research. In author analysis, Velburg, P.H. (145), Smith, P. (106), Ciais, P. (96), Kuemmerle, T. (96) are the authors who have published the most in the field of LULC. When evaluated according to countries, the USA (30.9%), China (20%) and Germany (10.7%) come to the fore. Turkey has approximately 1% of the total publications within the countries. When sorted by publication years, it is noteworthy that the first studies emerged after the 2000s [21,22].
Land use change models are effective tools that analyze the causes and consequences of land use dynamics [23,24]. Models are very useful for demonstrating LULC change and the effects of complex biophysical and socioeconomic variables that cause this change [23]. Although LULC prediction models have been used for a long time, advances in GIS and RS technologies have led to the emergence of many LULC models and applications [24]. Different statistical and mathematical models such as cellular automata (CA), Markov chains (MC), logistic regression (LR), machine learning (ML), artificial neural networks (ANNs), support vector machine (SVMs) are used to predict land cover [24,25,26].
Recently, there has been a rapid development in simulation models with integrated uses [27]. The hybrid CA-MC model is one of the most widely preferred models for modeling temporal and spatial variation [28] and is very successful in estimating LULC. This model can predict future situations according to the amount of transition among LULC. The future land use simulation (FLUS) model used in this study is a model in which ANN is also integrated into the system compared, as opposed to traditional CA models. Liu et al. (2017) [29] have proved that FLUS model results have higher accuracy rates than models such as CLUE-S, ANN-CA and LR-CA [30]. Compared with other models, FLUS has improved probability of occurrence and detailed conversion between LULC classes [31]. This has resulted in higher accuracy of FLUS among models.
As throughout Turkey, rapid urbanization has been experienced in Diyarbakır since the 1950s. Since this period, the rate of urbanization has increased due to industrial investments, technological developments and developments in basic urban function. Since the 1990s, demographic urbanization caused by forced migration due to terrorism in the rural areas of the region has led to different urban pattern. In this research, we claim that LULC change in Diyarbakır is controlled by various dynamics that cause urbanization, especially forced migration. This situation has caused the rapid destruction or damage of natural areas around the urban. In this research, it is aimed to examine the LULC changes under the influence of urban growth and to model them for the future. The results of this research show that the LULC has undergone a rapid change and transformation due to urban sprawl. It is estimated that in the future, built-up areas will grow by 22% over other land classes. In this research LULC change and transformation areas over the past three decades were determined, a trend analysis of LULC change was performed, LULC of 2038 was detected using FLUS model, and, according to the prediction results, discussions were held on the future interaction of natural and semi-natural areas and urban growth.

2. Materials and Methods

2.1. Research Area

Diyarbakir city is in the Tigris sub-region of the Southeast Anatolian Region and at the northern end of Mesopotamia between the Euphrates and Tigris rivers [32]. The city is between 37°50′ north latitudes and 37°59′ east longitudes. According to study by Karadoğan (2015) [33], the urban built-up area was established in the west of Diyarbakır Basin and on the eastern edge of a slightly sloping wide structural basalt plateau extending from Karacadağ towards the Tigris River. The average elevation of the city above sea level is 650 m, and its relative elevation from the Tigris valley is between 60–100 m on average [33]. The climate in the research area demonstrates different seasonal characteristics. According to the long-term (1926–2020) Turkish State Meteorological Service (TSMS) data, the annual average precipitation in the research area is 493.6 mm, the annual average temperature is 15.8 °C and there are semi-arid climate conditions. Climatic conditions and LULC properties have caused the surface temperatures to be quite high (28–51 °C). Diyarbakir was established on the banks of the Tigris River and is a historical city that has developed under the influence and control of rivers. It was established in Suriçi, where the volcanic effect was interrupted by the Tigris River and continues to develop mostly on basalt flows. Diyarbakir is one of the fastest growing cities in Turkey due to demographic urbanization. Diyarbakir has been chosen as the research area because of the large amount of spatial change and transformation. The research area corresponds to the “Master Plan” border covering 1079 km2, where the rural–urban interaction is dense in Diyarbakır city and its immediate surroundings (Figure 1).

2.2. Data Type and Source

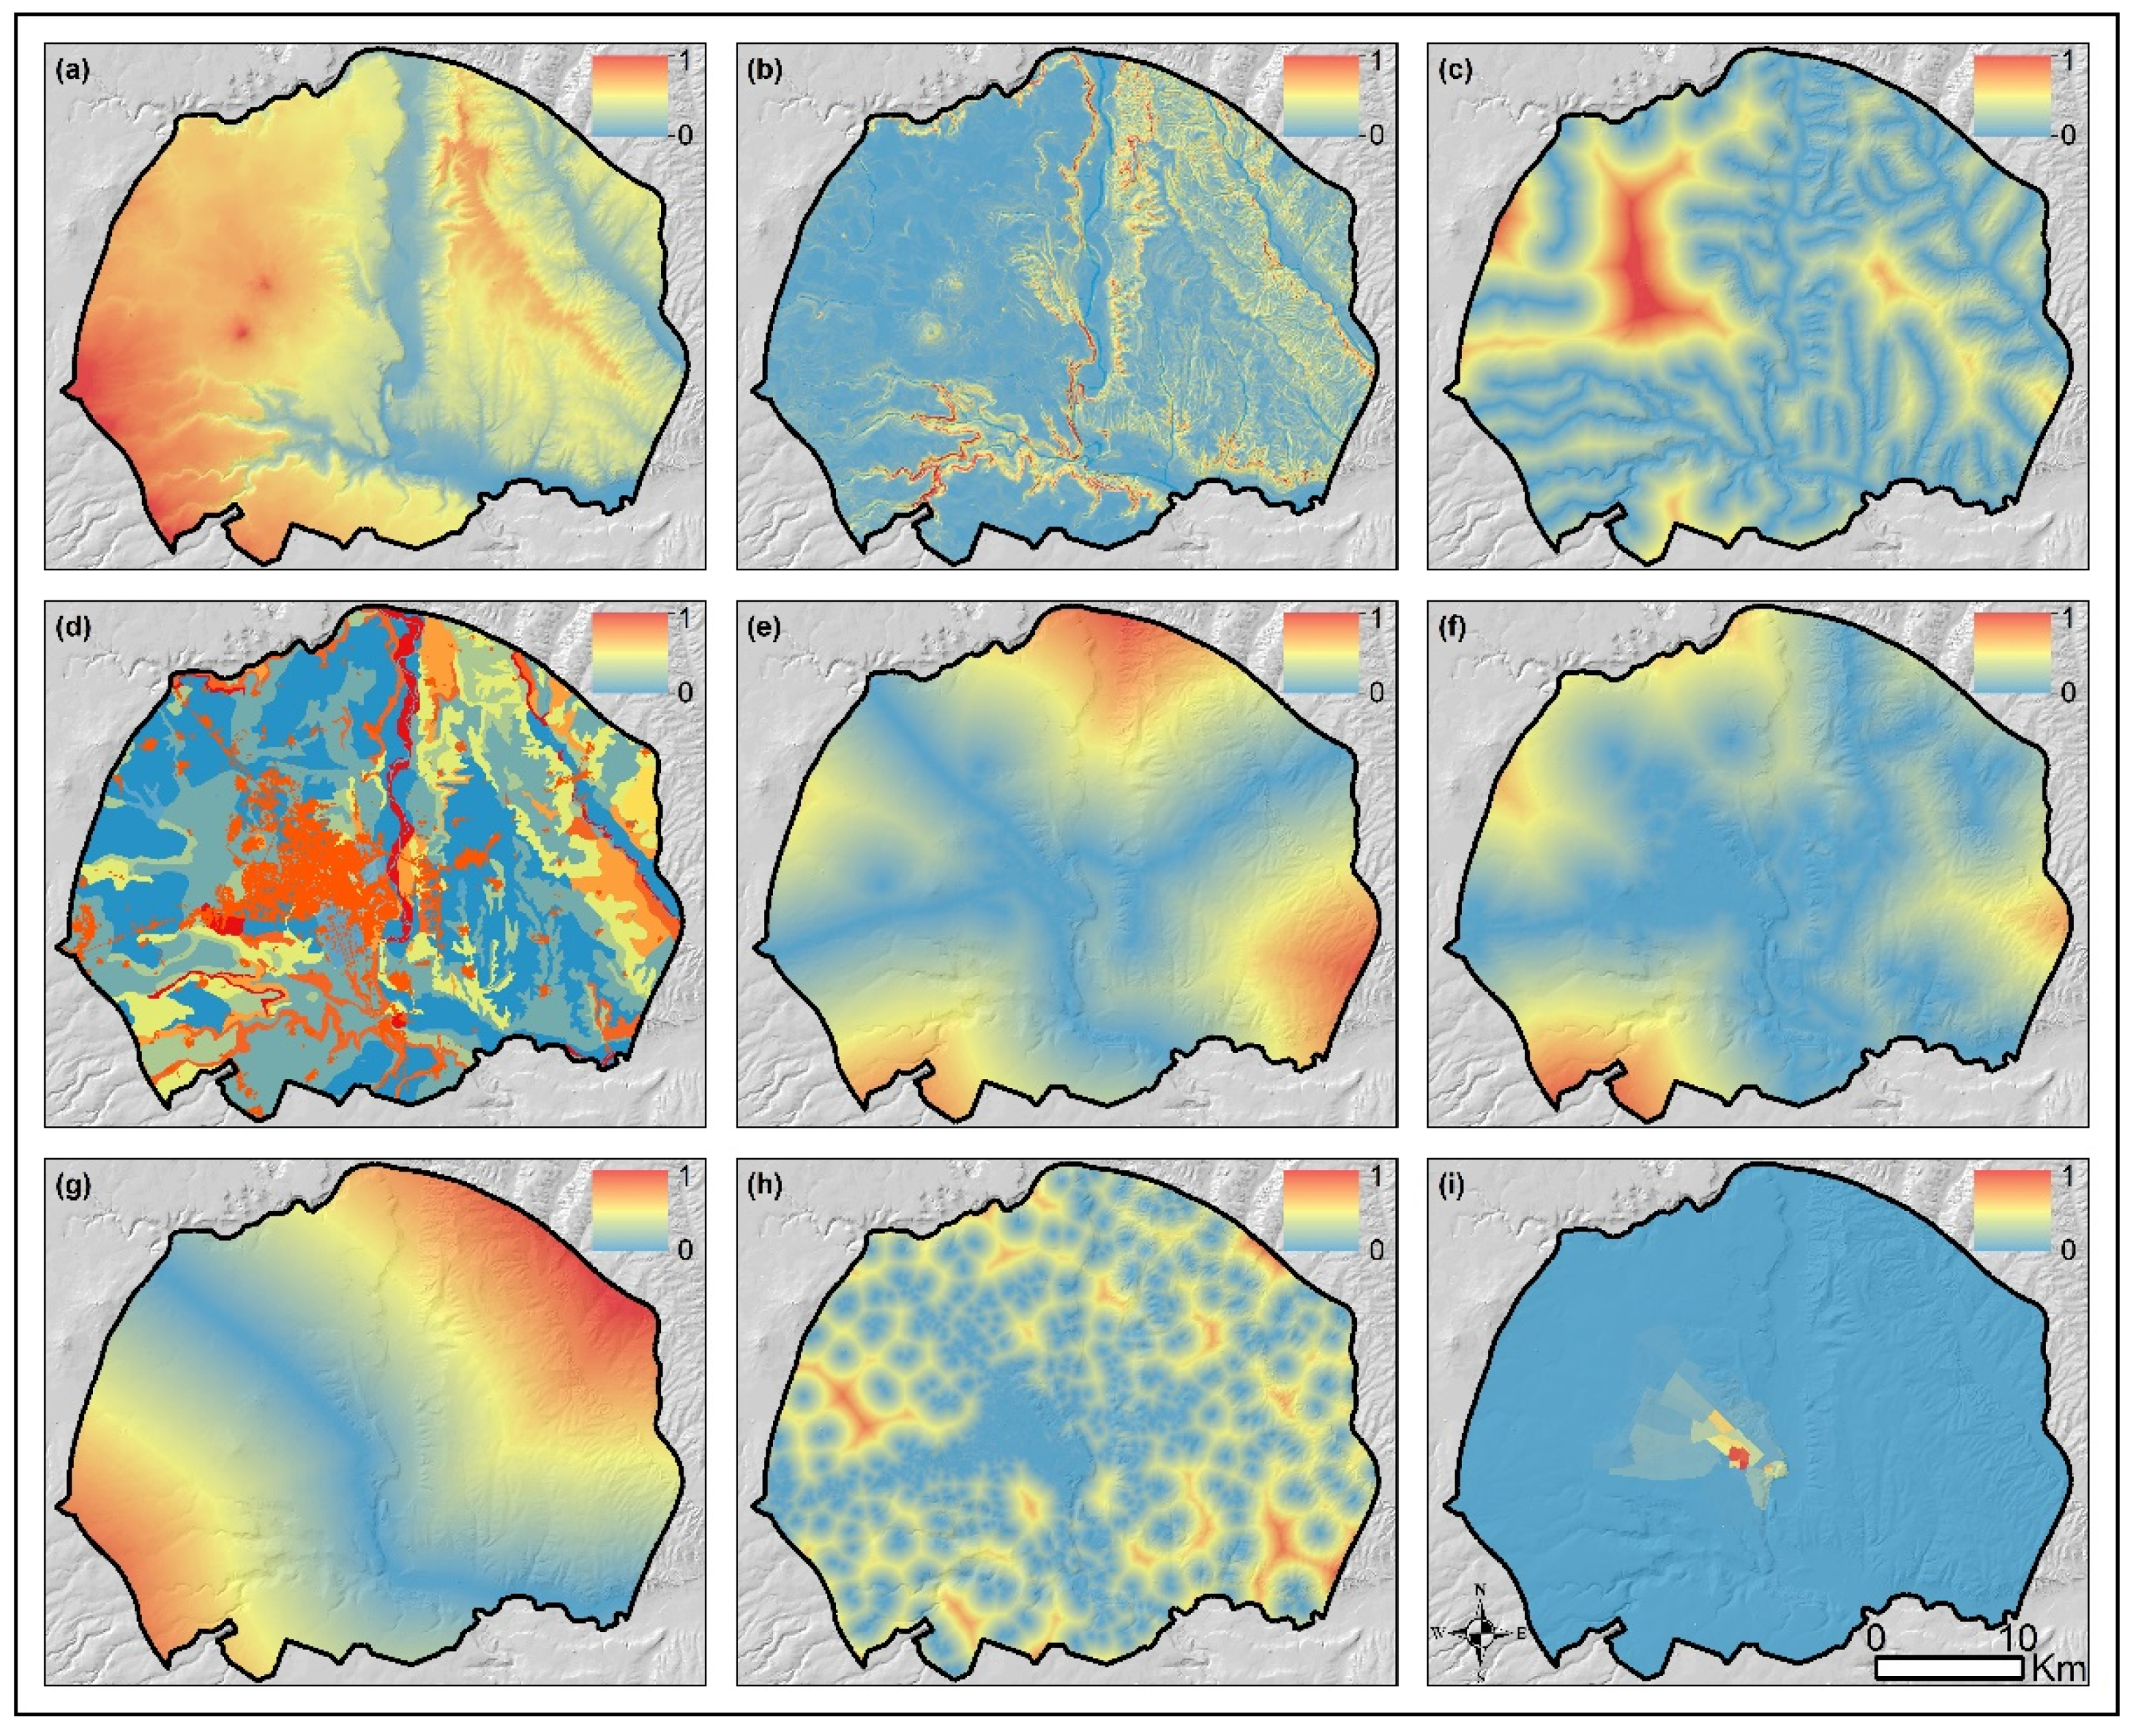
At over 40 years, Landsat has provided the longest term temporal data on the earth’s surface [34]. In this research, the most important data source used in the determination of LULC change is Landsat satellite images. Multi-time satellite images were downloaded from the USGS, Earth Explorer website (http://glovis.usgs.gov/, accessed on 15 May 2020) for Diyarbakir and its surroundings (Path: 172, Row: 34). Landsat TM 1984, Landsat ETM 2002 and Landsat OLI 2020 satellite images were cut for the research area and used as the basic data base [35], (Table 1). In the land use simulation, 9 different basic parameters were determined. Elevation, slope and aspect parameters were created from the 10-m high resolution digital elevation model (DEM) obtained from the General Directorate of Mapping. The rivers were digitized on the 1/25.000 scaled topography maps prepared by the General Directorate of Mapping and the distance to the rivers parameters were obtained. Soil types were created from the data of the Diyarbakır Directorate of Provincial Agriculture and Forestry. The distance variables to the main roads and streets were determined by downloading the road data from the Open Street Map database. The distance to built-up area was created by obtaining the current building data and neighborhood boundaries from the Metropolitan Municipality of Diyarbakır. Finally, the population density variable was used in the LULC simulation by downloading the population data from the Turkish Statistical Institute (TUIK). In this research, ArcGIS 10.2.2, TerrSet 18.3, ENVI 5.3 and eCognition Developer 64 and GEOSOS-FLUS 2.4 were used for land use classification and simulation.

2.3. LULC Classification

2.3.1. Pre-Processing of Satellite Data

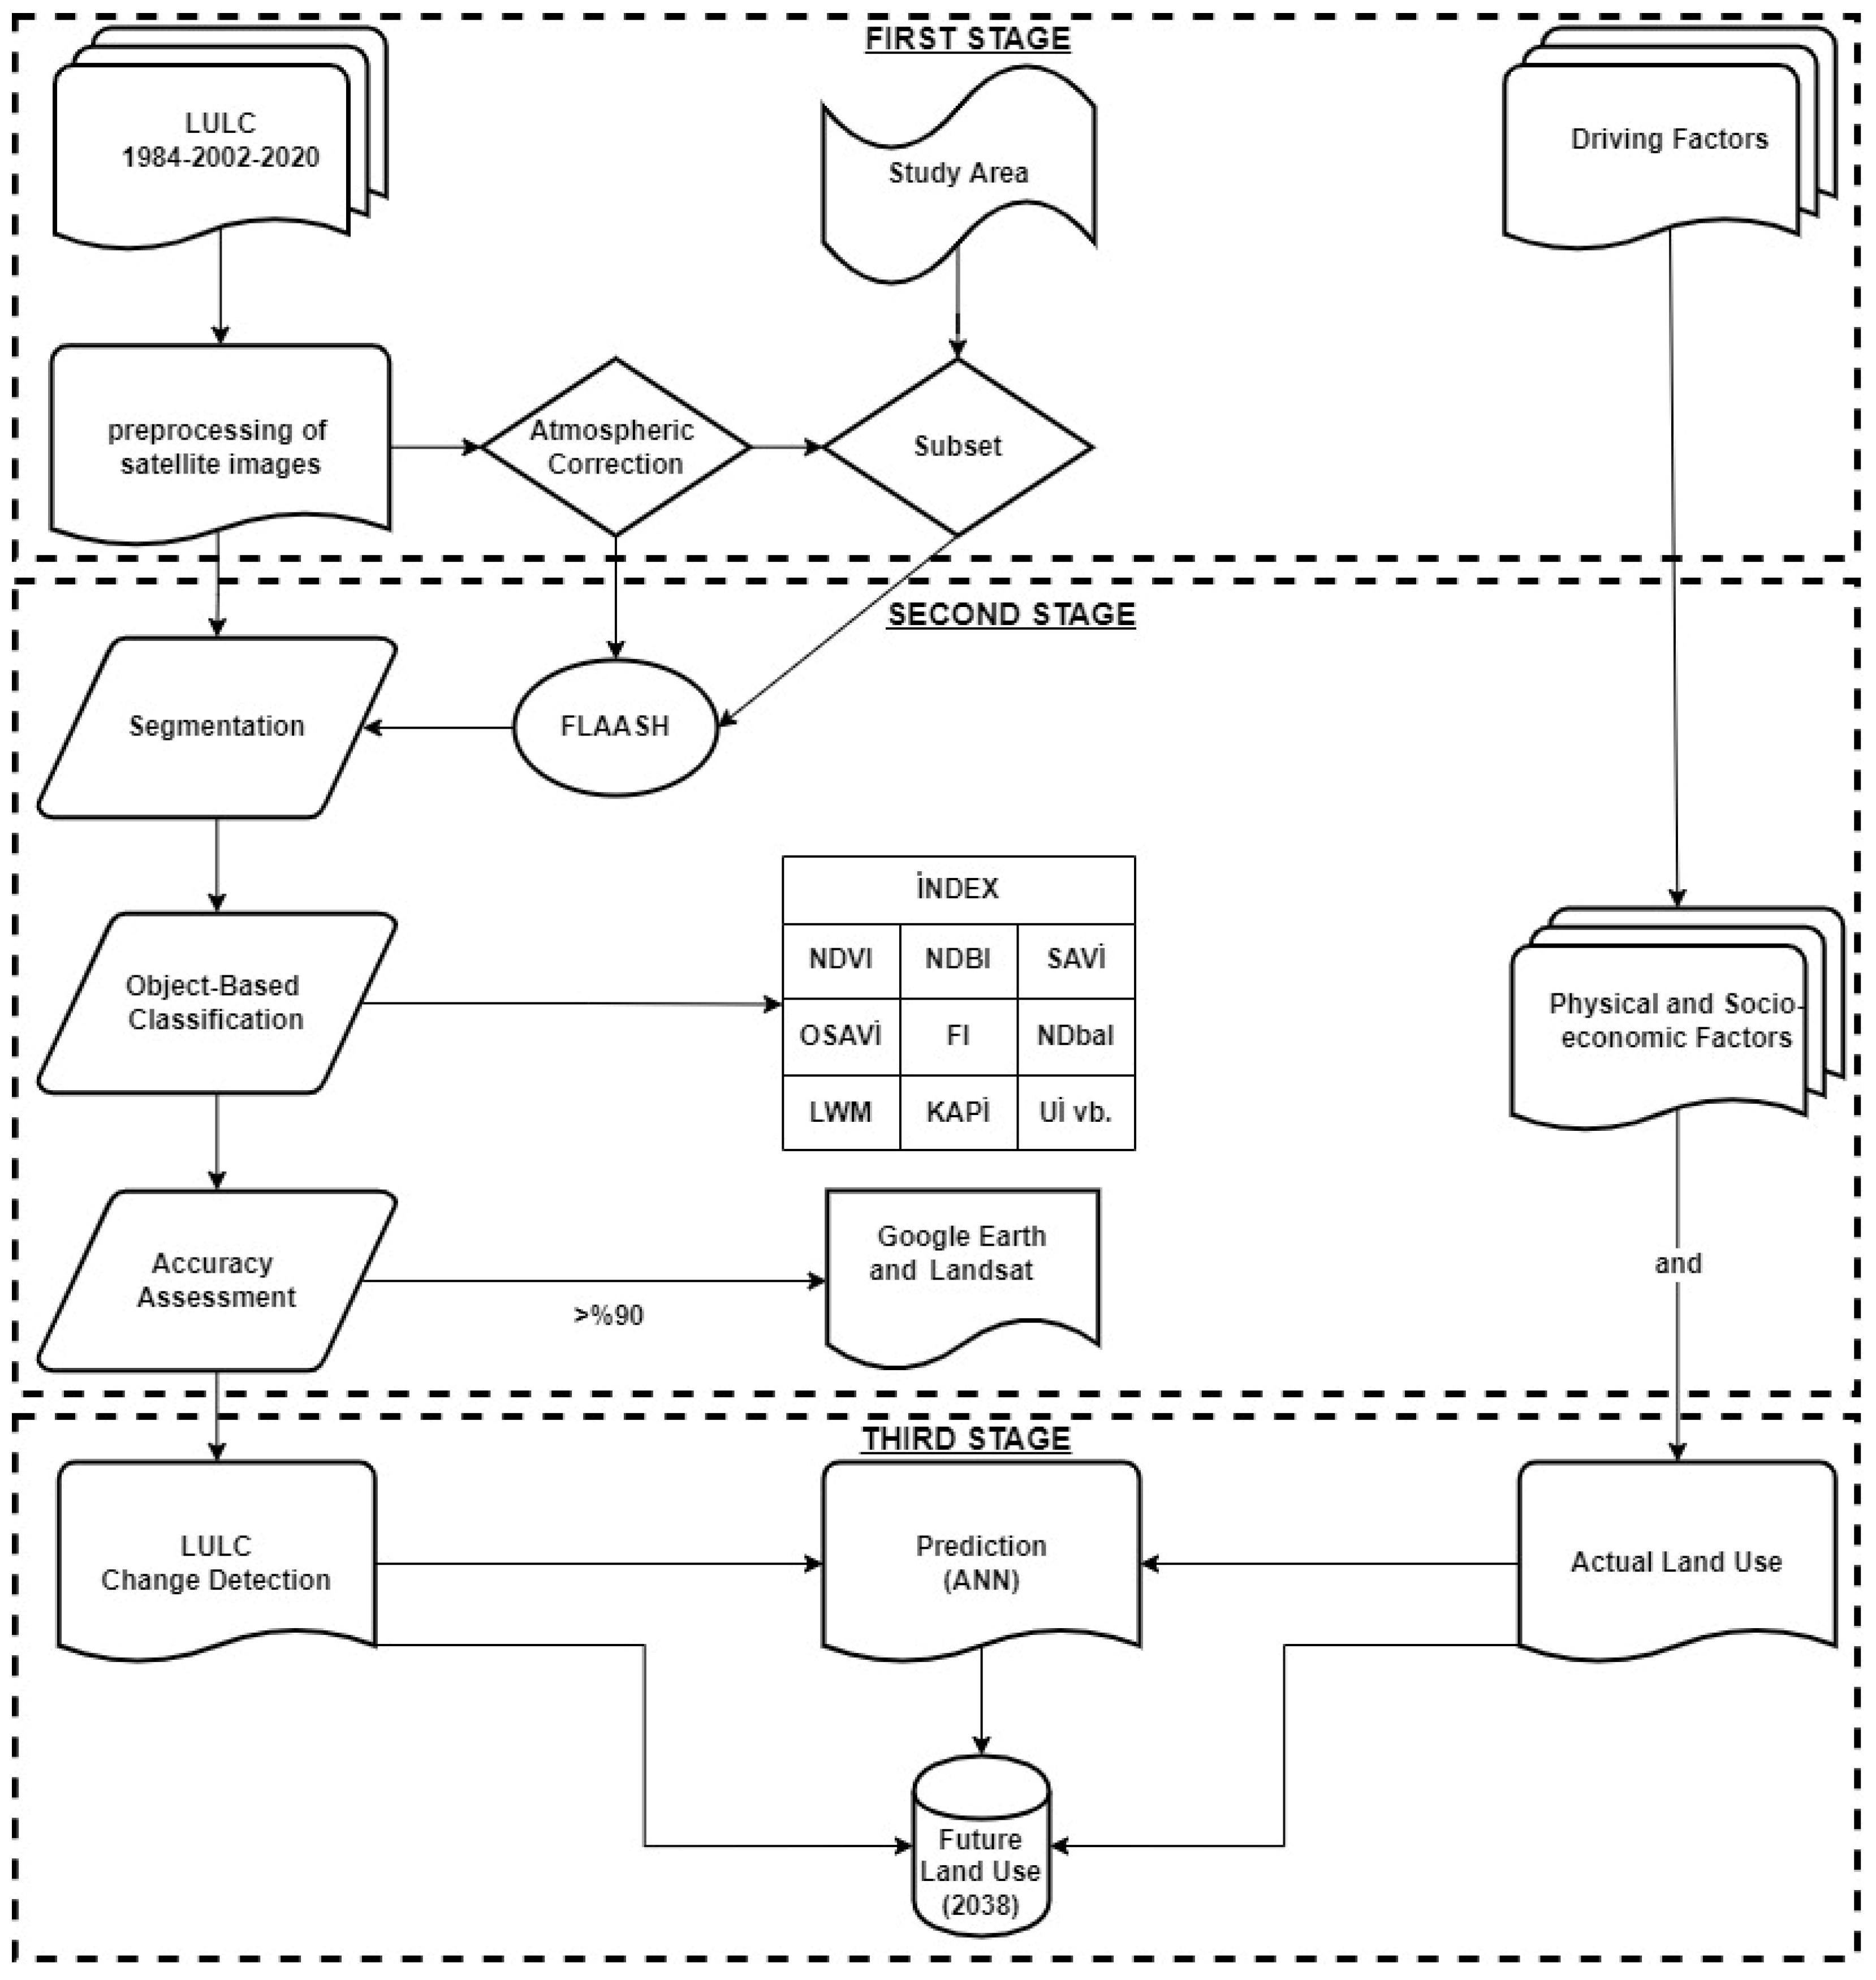
Since satellite images contain systematic and unsystematic errors, certain corrections must be applied before using the data [36]. The process of reducing system errors and atmospheric effects in sensors is expressed as image pre-processing [36,37]. ENVI software includes geometric, radiometric and atmospheric corrections [38]. With geometric correction, ground control points are determined and the image is transferred to a different coordinate system [39]. By using ground control points with many references, satellite images are fitted and overlapped. Since the Root Mean Square Error (RMSE) value in satellite images is smaller than 0.5 pixels, geometric correction was not performed [40]. In the radiometric and atmospheric correction process, spectral brightness values of multi-time data were created to reduce the effects caused by atmospheric effects. The “FLAASH Atmospheric Correction Model” was applied by entering spatial feature information to the images and a new spectral reflection range was created. Multi-time Landsat satellite images were pre-processed in ENVI software, minimizing undesirable errors in the images and making the images more usable (Figure 2).

2.3.2. Object Based Classification

Object-based classification, unlike pixel-based classification, is an advanced classification technique that classifies image objects by dividing them into homogeneous segments according to their form and pattern as well as their reflection values [41,42]. Separation of the image into homogeneous subunits at the desired scales according to reflectance values is called segmentation. Pixels or objects that are homogeneous are connected to segments in a hierarchical order using various algorithms. Segmentation, which is the first stage of object-based classification was created by testing different scale, shape and compactness parameters.
After segmentation is done on the images, the classes to which the segments correspond should be determined. Object-based classification allows classification consisting of a set of rules and hierarchy of various indexes according to the sample segments determined by the user. In this research, object-based classification was performed using the “nearest neighbor” algorithm in eCognation 64 software [43]. LULC has been redefined as first level 4 classes and second level 10 classes by utilizing CORINE land use classification.

2.3.3. Accuracy Assessment

Accuracy assessment is the comparison of classified images with reference images or ground truth data that are considered correct. After the land use classification is done, accuracy assessment is important in the compatibility of these classes with actual images. Thus, accuracy assessment measures the quality of the classified land use map and the accuracy of a classified map should not be less than 80% [44,45].
Accuracy assessments were performed on reference images using the “confusion matrix” algorithm in ENVI 5.3 software. Area-based accuracy assessment was created under user control, corresponding to 10% of the land cover classes. With this method, taking reference areas from all classes at a certain rate makes the accuracy results valid. The selection of referenced sample areas is made by different methods such as topography maps, current maps, orthophoto images, satellite images, or Google Earth images. In this research, Google Earth and Landsat satellite images were used to obtain referenced sample areas from different periods. Cells obtained on the reference images and cells belonging to classified land use maps were compared and calculated with formulas. As a result of the calculations, producer accuracy, user accuracy, overall accuracy and kappa coefficient were over 90% for all classes [46]. The equations used in the accuracy assessment are expressed as follows [47,48]:
P r o d u c e r   a c c u r a c y = N u m   o f   c o r r e c t l y   c l a s s i f i e d   p i x e l s   ( d i a g o n a l ) T o t a l   n u m b   o f   r e f e r e n c e   p i x e l s   i n   e a c h   c a t e g o r y   ( c o l u m n ) × 100 %
U s e r   a c c u r a c y = N u m .     o f     c o r r e c t l y     c l a s s i f i e d     p i x e l s     i n     e a c h     c a t e g o r y T o t a l     n u m b     o f     r e f e r e n c e     p i x e l s     i n     e a c h     c a t e g o r y     ( r o w     t o t a l ) × 100
O v e r a l l   a c c u r a c y = T o t a l     n u m     o f     c o r r e c t e d     c l a s s i f i e d     p i x e l s     ( d i a g o n a l ) T o t a l     n u m     o f     r e f e r e n c e     p i x e l s     × 100 %
K a p p a = T o t a l   s a m p l e   n u m b e r × T o t a l   c o r r e c t e d   s a m p l e   n u m b e r ( c o l . t o t × r o w   t o t )   T o t a l   s a m p l e   n u m b e r 2 ( c o l . t o t × r o w   t o t ) × 100 %

2.4. Land Change Modeler and Trend Analysis

Today, satellite images are used to reveal the changes in natural and human environment and GIS programs are used to classify these images. With the RS method, temporal changes of land use, agriculture, forest cover, settlements, lake or sea levels and pollution can be determined with less expense and high accuracy. Thus, in addition to a better understanding of the environment, changes in a space are revealed with the satellite images obtained over the years and future land use planning can be made with the statistical methods used.
Terrset-Land Change Modeler (LCM) and Envi-Change Detection modules—frequently used in the literature—were used in mapping LULC [49]. LULC changes were carried out at Level 1 in the 1984–2002, 2002–2020 and 1984–2020 periods. Thus, increases (gains), decreases (losses) and unchanged areas in land cover classes were analyzed. There are various indexes in the literature to determine the temporal rate of change of LULC. By using the integrated dynamic land use index, the general trend of change of land classes annually and during a certain period was determined according to the following formulas [50,51,52]:
K = u b u a u a × 1 T × 100 %
K t o t a l = i = 1 n | u b i u a i | 2 i = 1 n u a i × 1 T × 100 %
where, u b u a expresses the area at the beginning and at the end of land use class, T expresses the length of the research period, n expresses the number of land use classes, K t o t a l expresses the annual integrated area change of rate all land use classes in year T [52]. In cases where the research period is not taken into account, the total percentage change in certain classes emerges. In cases where the research period is taken into account, the size of the change is divided by the research period examined. According to the formulas used above, the LULC change in the research area is expressed annually and periodically.
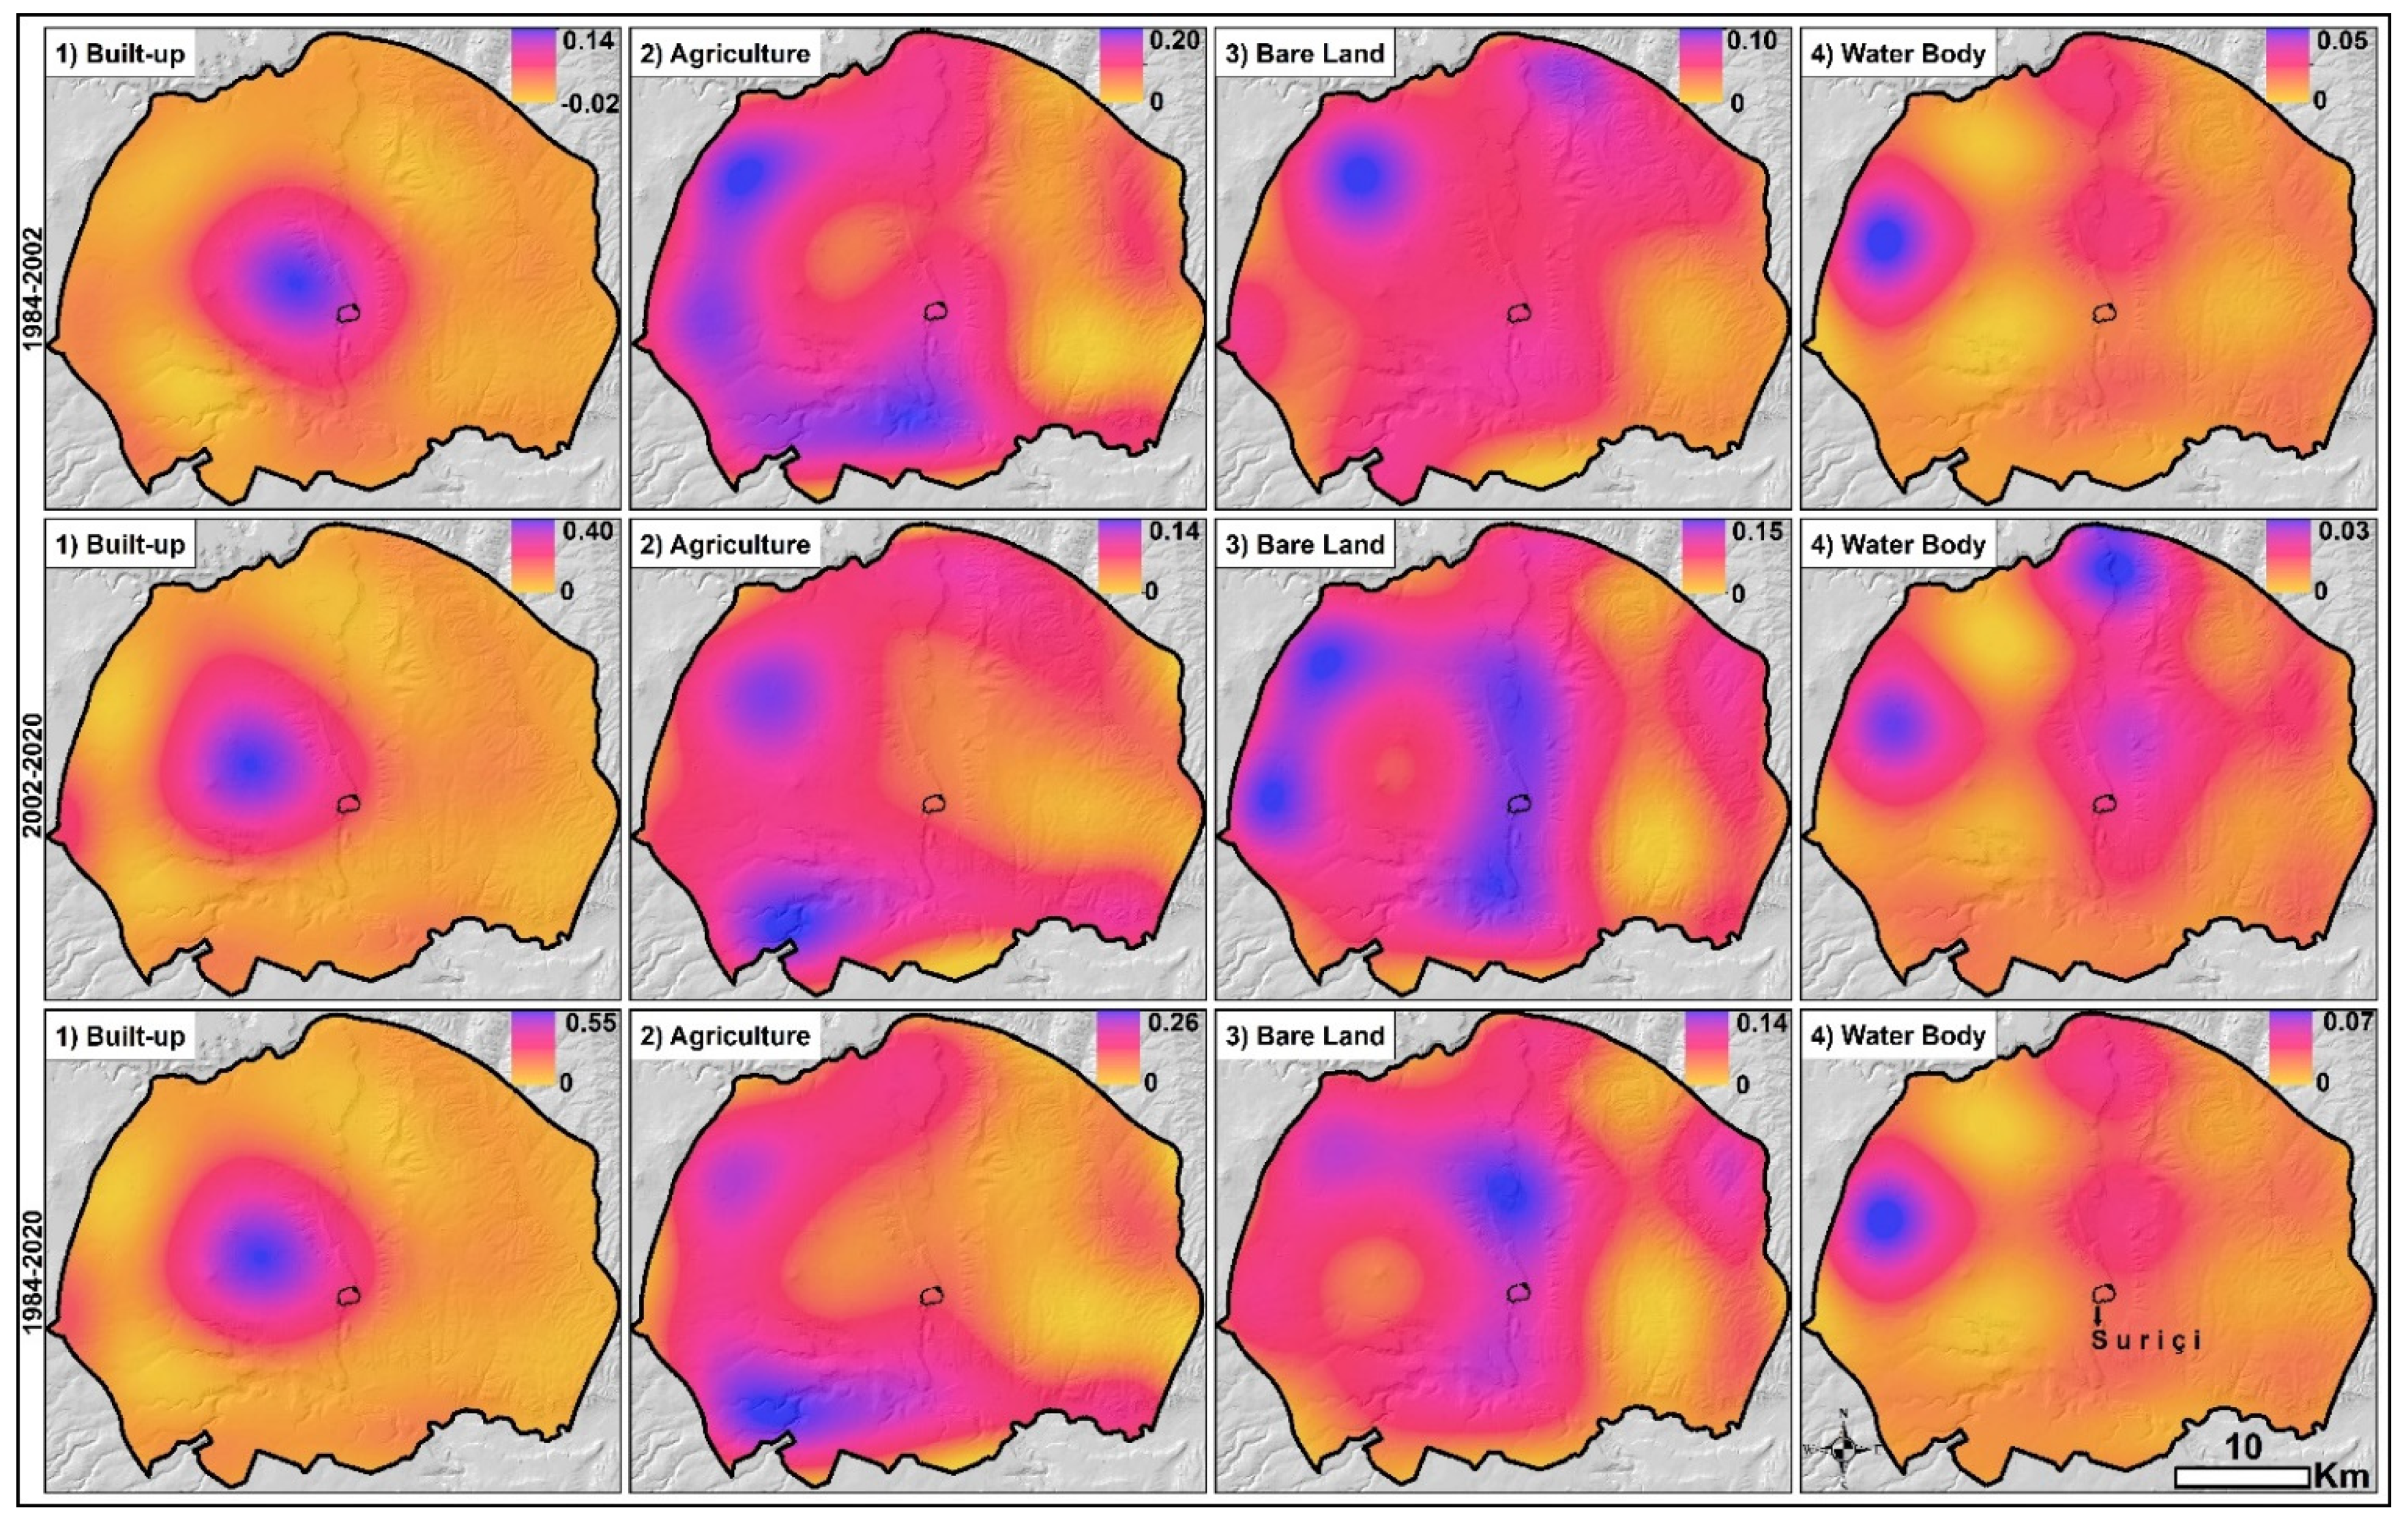
In order to reveal the dimensions of the LULC change, a trend analysis was performed using the transition probability image among the land classes. In Terrset software, the general trend of land change is mapped with different order of polynomial. İn this research, the 9th order trend was used in the analysis and was carried out in 3 different periods.

2.5. FLUS Model

The integrated use of urban prediction models provides stronger simulation results. In this research, the CA-based ANN model was applied in the creation of the urban simulation and the results were evaluated comparatively. GEOSOS-FLUS software was preferred in the creation of simulation maps. Firstly, LULC transition probability and transition area matrices were obtained with MC in the model. Then, a transition probability map was created using these matrices.
Another step in the LULC prediction model is the creation of transition rules. At this stage, training and estimation stages were tried in the application of ANN. In the training phase, the data was integrated into the model as input layers, hidden layers and output layers and trained. The variables affecting the LULC change were integrated into the system and the simulation was applied with a self-adaptive CA. These variables were renormalized between 0–1 and suitability maps of the variables were created. A value close to 1 on the scale increases the suitability and has a greater effect on the simulation results. The value of 0 in the variables does not affect the simulation results.
In another step of the FLUS model, the Self-Adaptive Inertia and Cellular Automaton Competition Mechanism tool is run. At this stage, a set of simulation rules are entered. Using the cost matrix, it is decided whether there will be a transformation between the land cover classes. Zero means that there will be no transformation between the land cover classes and 1 means that there may be a transformation between the classes. Weight of neighborhood between land cover classes were determined by giving values between 0–1 according to class transition status. Also, different scenarios were developed by entering the restricted area where there will be no urban growth.
“By considering the probability of occurrence, neighborhood effect, inertia coefficient and conversion cost, the combined probability of a cell occupied by a particular land use type is estimated using the following equation” [29]:
T P p , k t = P p , k × p , k t × I n e r t i a k t × ( 1 S C c k )
“where, T P p , k t denotes the combined probability of grid cell p to covert from the original land use type to the target type k at iteration time t ; P p , k denotes the probability-of-occurrence of land use type k on grid cell p ; p , k t denotes the neighborhood effect of land use type k on grid cell p at iteration time t ; I n e r t i a k t denotes the inertia coefficient of land use type k at iteration time t ; and S C c k denotes the conversion cost from the original land use type c to the target type k ” [29].
“After estimating the combined probability for each iteration time, the CA simulation will determine whether a grid cell is converted or not. If it is converted, the simulation will determine which land use type will occupy the grid cell in the next iteration. n most previous models, such as CLUE-S, the land use type of a specific grid cell is simply allocated to the dominant cell with the highest conversion probability” [29].
Projection maps for the future were created by using multi-time LULC maps and variables affecting land classes. Simulation maps for 2020 and 2038 were created using actual land use maps and geographical variables. The simulation maps were compared with the actual LULC maps of different periods, and their accuracy assessment was expressed as a percentage. The simulation maps obtained with the FLUS model were compared with the actual LULC maps. The validity of the model was tested with Kappa (K) and Figure of Merit (FoM) indices and calculated by the following formula:
K = P ( o ) P e 1 P ( e )
F o M = B A + B + C + D
where, Kappa ( K ) is the measurement of the difference in observed agreement between the two maps [53]. Here, P ( o ) refers to the overlap rate, and P ( e ) refers to the random expected rate [54]. FoM expresses the overlap between observed and predicted change as a percentage. Zero percent of FoM results indicates that there is no overlap, and 100% indicates that the simulation results are completely correct [55]. Here, “A denotes the total number of observed changed cells that are predicted to be unchanged cells; D denotes the total number of observed unchanged land use cells simulated as changed cells; and B and C are the total number of observed changed cells that are predicted to be changed cells with correct and incorrect land use types, respectively” [56].

3. Results

3.1. LULC Classes

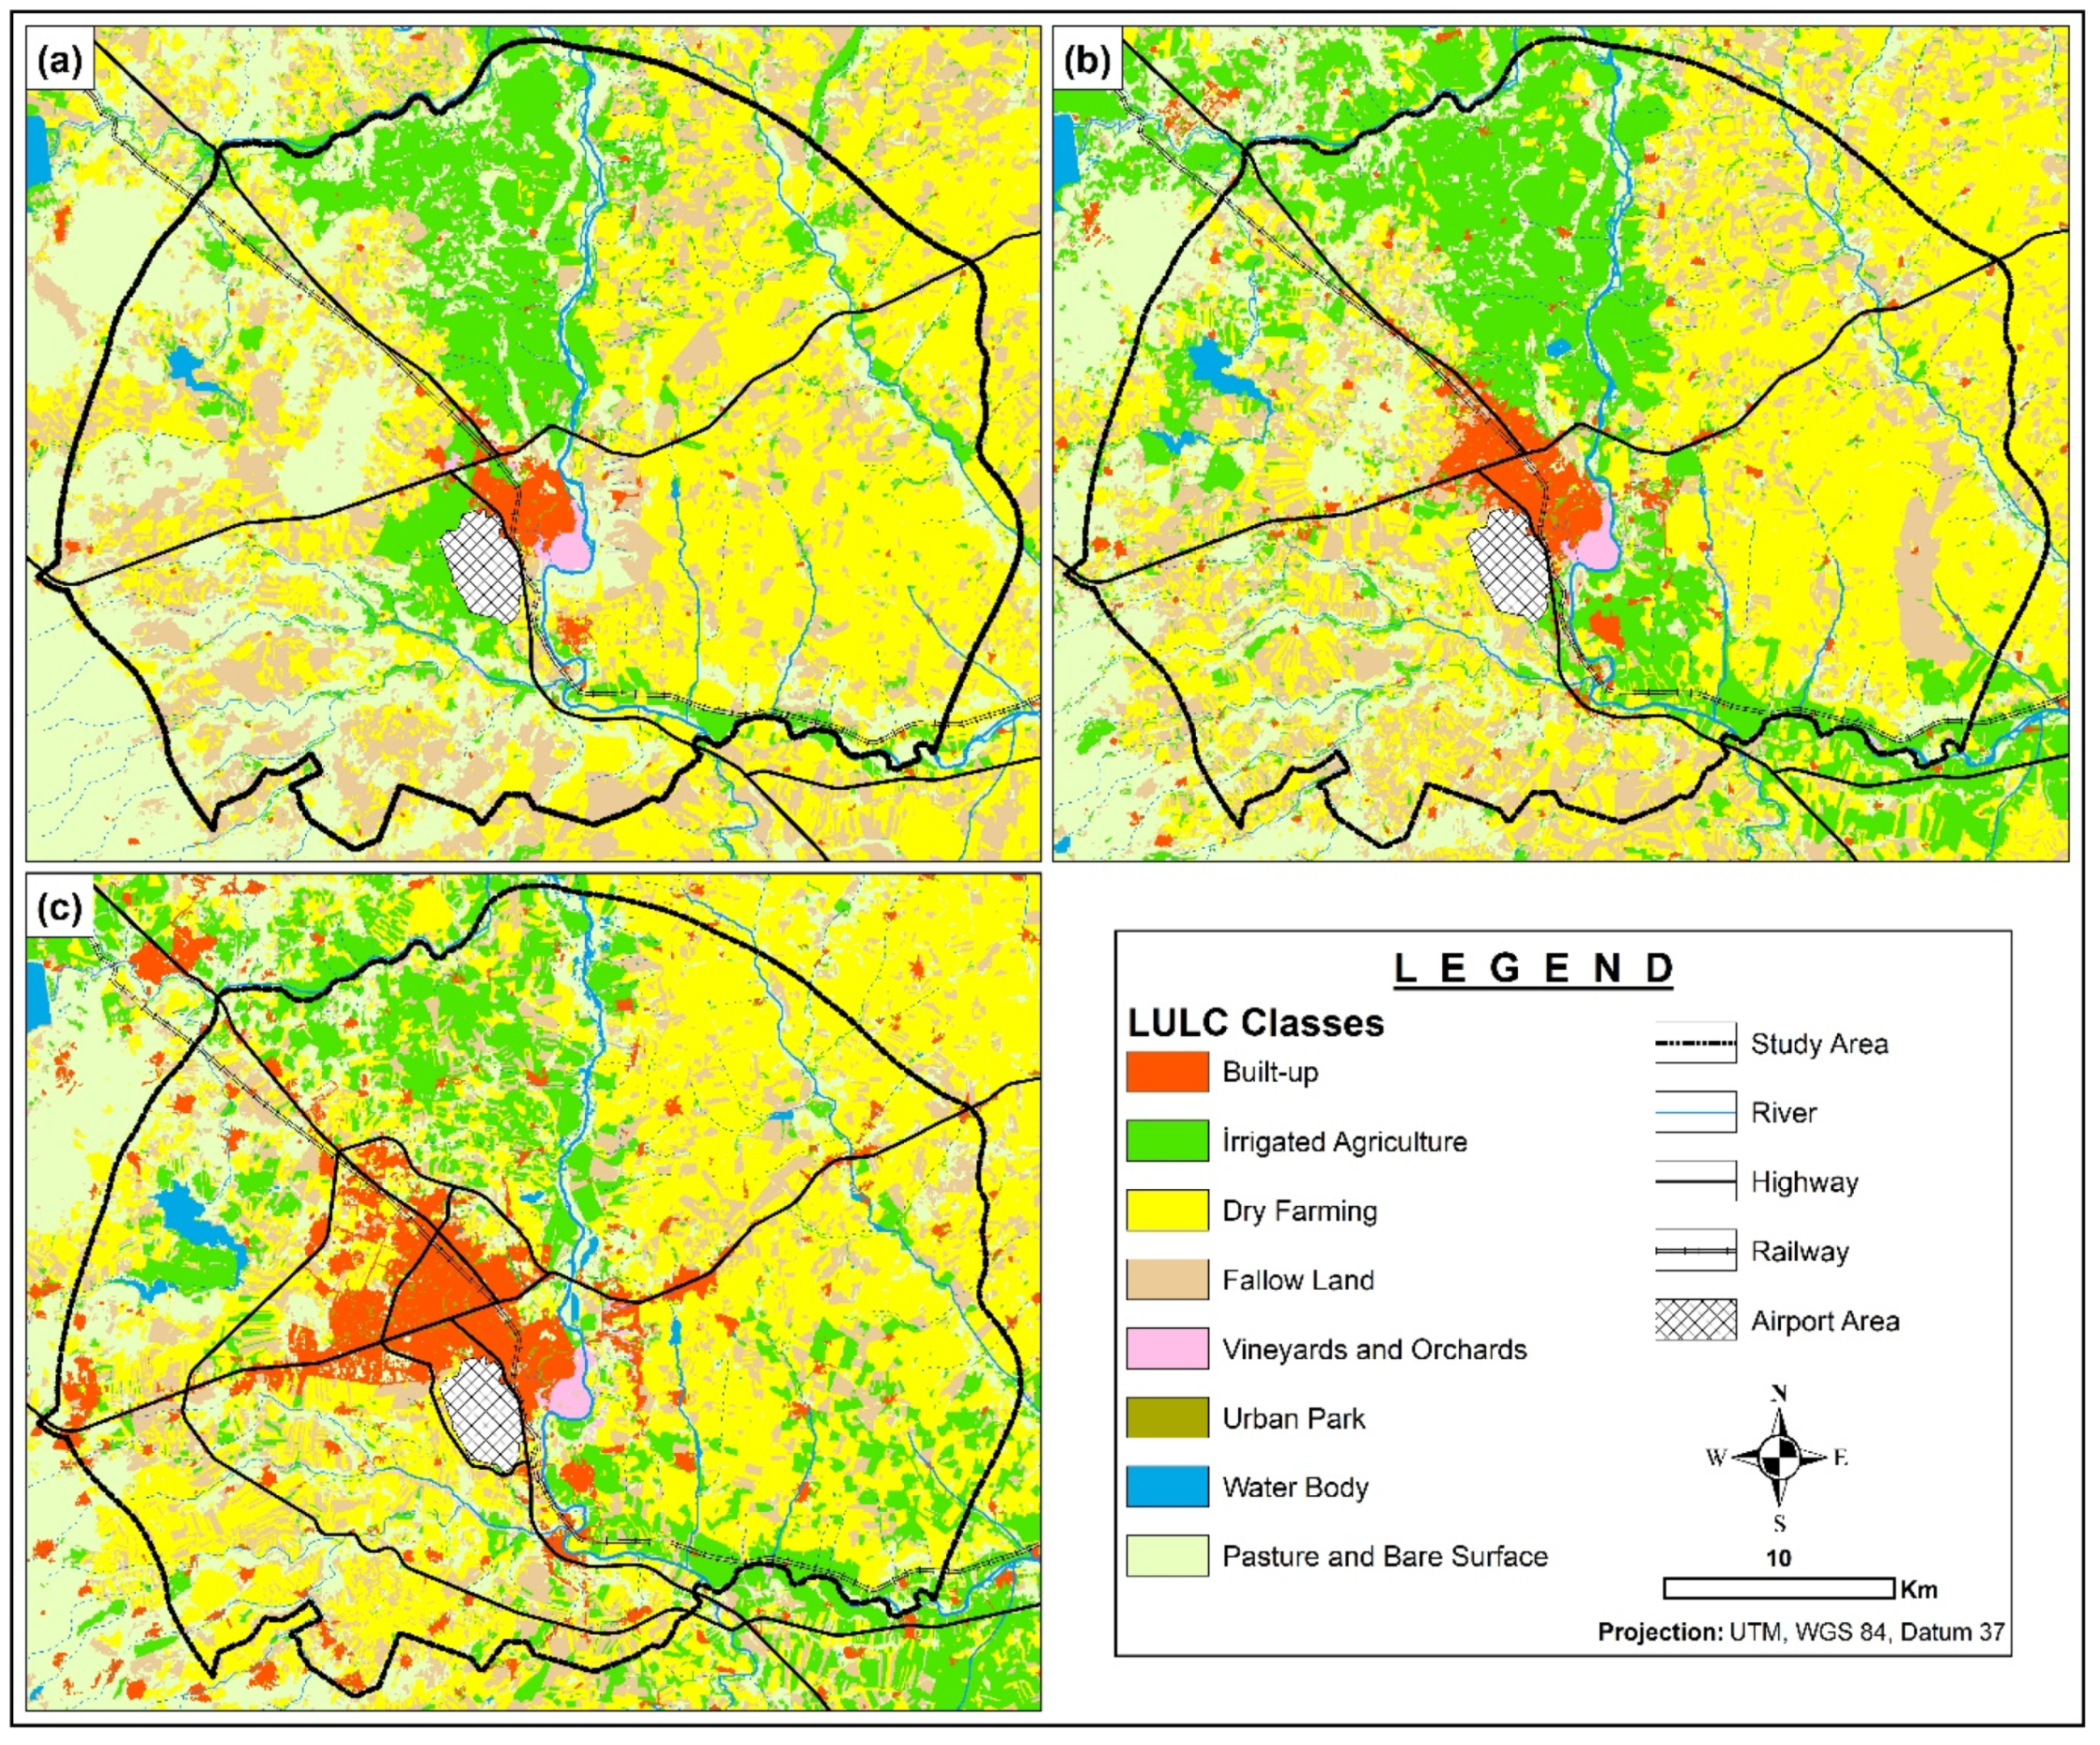
In 1984, agricultural areas were dominant, corresponding to 72% of the total area. In Diyarbakir, where the continental climate type prevails, half of the agricultural land is dry agricultural area (35.8%). Dry farming areas are mostly found together with fallow lands in the research area. Dry farming and fallow lands account for more than half (55%) of the total area and are generally distributed over terrestrial deposits east of the Tigris River. Together with the vineyard areas, irrigated agricultural areas correspond to only 16.3% of the total area. These areas are mostly located at the bottom of the alluvial valley formed by the Tigris River. Although a significant part of the built-up areas in Diyarbakır are urban areas, they cover a total area of 23 km2. It is noteworthy that the rural settlements are quite small. Although the built-up areas cover a very small area in the total area, they will experience the greatest spatial change over the years. Urban parks, on the other hand, cover only 0.3 km2 in certain parts of the urban areas. The water body in Diyarbakır corresponds to approximately 1% of the total area. Some ponds built on the Tigris River and its tributaries are important water surfaces. Another important land cover class is pasture-bare surfaces. Although these surfaces constitute 25.1% of the total area, they are in a decreasing trend over recent years. These surfaces are distributed in areas where the volcanic mass of Karacadağ shows fluidity and forms dense stony areas on the surface (Table 2; Figure 3a).
As of 2002, there has been an increase in agricultural areas with the exception of fallow lands. Along with the developing irrigation technologies, there has been a remarkable increase (6%) in the irrigable lands in the down of the Tigris valley. The ratio of dry agricultural lands covering the largest area among the land cover classes has not changed much. The biggest decrease trend among agricultural areas occurred in fallow lands. The decrease in fallow lands is related to the transition to dry agriculture. Among the agricultural areas, vineyard areas are distributed around the urban and inside the Tigris valley. As of 2002, there has been an increase of 7% in total agricultural areas. Built-up areas have grown more than twice over the course of the year 2002. The rapid increase in built-up areas is related to urban land uses. With the expansion of the urban areas in the west-northwest direction, there has been a significant increase in urban land as opposed to agricultural lands. With the increase in the use of urban areas, urban park areas have also tended to increase. The proportion of water surfaces covering very little area in Diyarbakır was 1.2%. The areal increase in water bodies is related to some newly built ponds in the research area. Pasture-bare surfaces correspond to 17.7% of the research area. In these areas, there was a large decrease (7.4%) during the period of 1984–2002, and basically two factors were effective. First, with developing technology, stony lands with low slopes are transformed into needed agricultural areas depending on the clearing of the stones. Another factor causing a decreasing trend is the conversion of unused areas around the city into urban areas due to urban growth (Table 2; Figure 3b).
By 2020, significant changes have occurred in the LULC map. The main reason for the change in the research area is the built-up areas. The remarkable point is that there has been a significant increase in built-up areas and urban park areas in recent years. Depending on the development of the city, the biggest changes have occurred around the urban areas, which have grown approximately 10 times since 1984. In addition, rural settlements, which have a high relationship with the city, have also grown rapidly due to the growth of the urban. However, there has been a remarkable growth in the number and area of urban parks in Kayapınar and Bağlar. As in all years, dry agricultural areas constitute a significant part of the research area and have grown by more than 4%. Compared to the previous year, the largest areal losses occurred in irrigated agriculture (−6.9%) and fallow (−3.4%) areas. This situation is related to crop rotation in agricultural areas. Although there are spatial changes in the water surface, vineyard-garden and pasture-bare areas, they have not changed much proportionally (Table 2; Figure 3c).

3.2. Accuracy Assessment of LULC

The accuracy of the images obtained by classification of satellite images should be tested. Although different methods were used in accuracy assessment, spatial comparisons were made in this research. By using Level 2, error matrices for 1984, 2002 and 2020 were created. The highest pixel mixing between the referenced and classified images was observed in land cover classes such as agriculture, fallow, pasture-bare surface. On the other hand, less errors occurred in land classes with small areas such as built-up, urban park, vineyards and water bodies.
Producer accuracy, user accuracy, overall accuracy and kappa coefficient values were obtained from the error matrix table [57], (Table 3). In the classifications of 1984, 2002 and 2020, the overall accuracy rate was successful over 90% [58]. Overall accuracy and Kappa coefficient rates are higher in recent years. After the classification phase, a manual correction procedure was applied for incorrect class assignments [59]. Due to classification errors, manual correction was made in all classes at a certain scale level. Landsat satellite images and high resolution orthophoto images of the same period were used for manual corrections.

3.3. LULC Change Detection Analysis

The land use change in Diyarbakır was determined as the total change over the periods and annually. The remarkable situation here is that the urban park areas are experiencing the greatest change and transformation process among the residential areas. In these areas, the biggest change (5% per year) occurred in the total period examined. By years, the second biggest change (−2.3%) occurred in pasture-bare surfaces. Due to the fact that these areas are opened to urban and agricultural uses, a proportional decrease is observed in all periods. Agricultural areas generally tend to decrease. İrrigated agricultural lands and fallow lands have experienced areal losses. However, dry agricultural lands and vineyards have gained area in annual and total period. Significant areal increases (2.3%) have been experienced on water bodies due to the construction of new ponds. In other land cover classes, the total and annual land changes are proportionally less in the research area (Table 4).
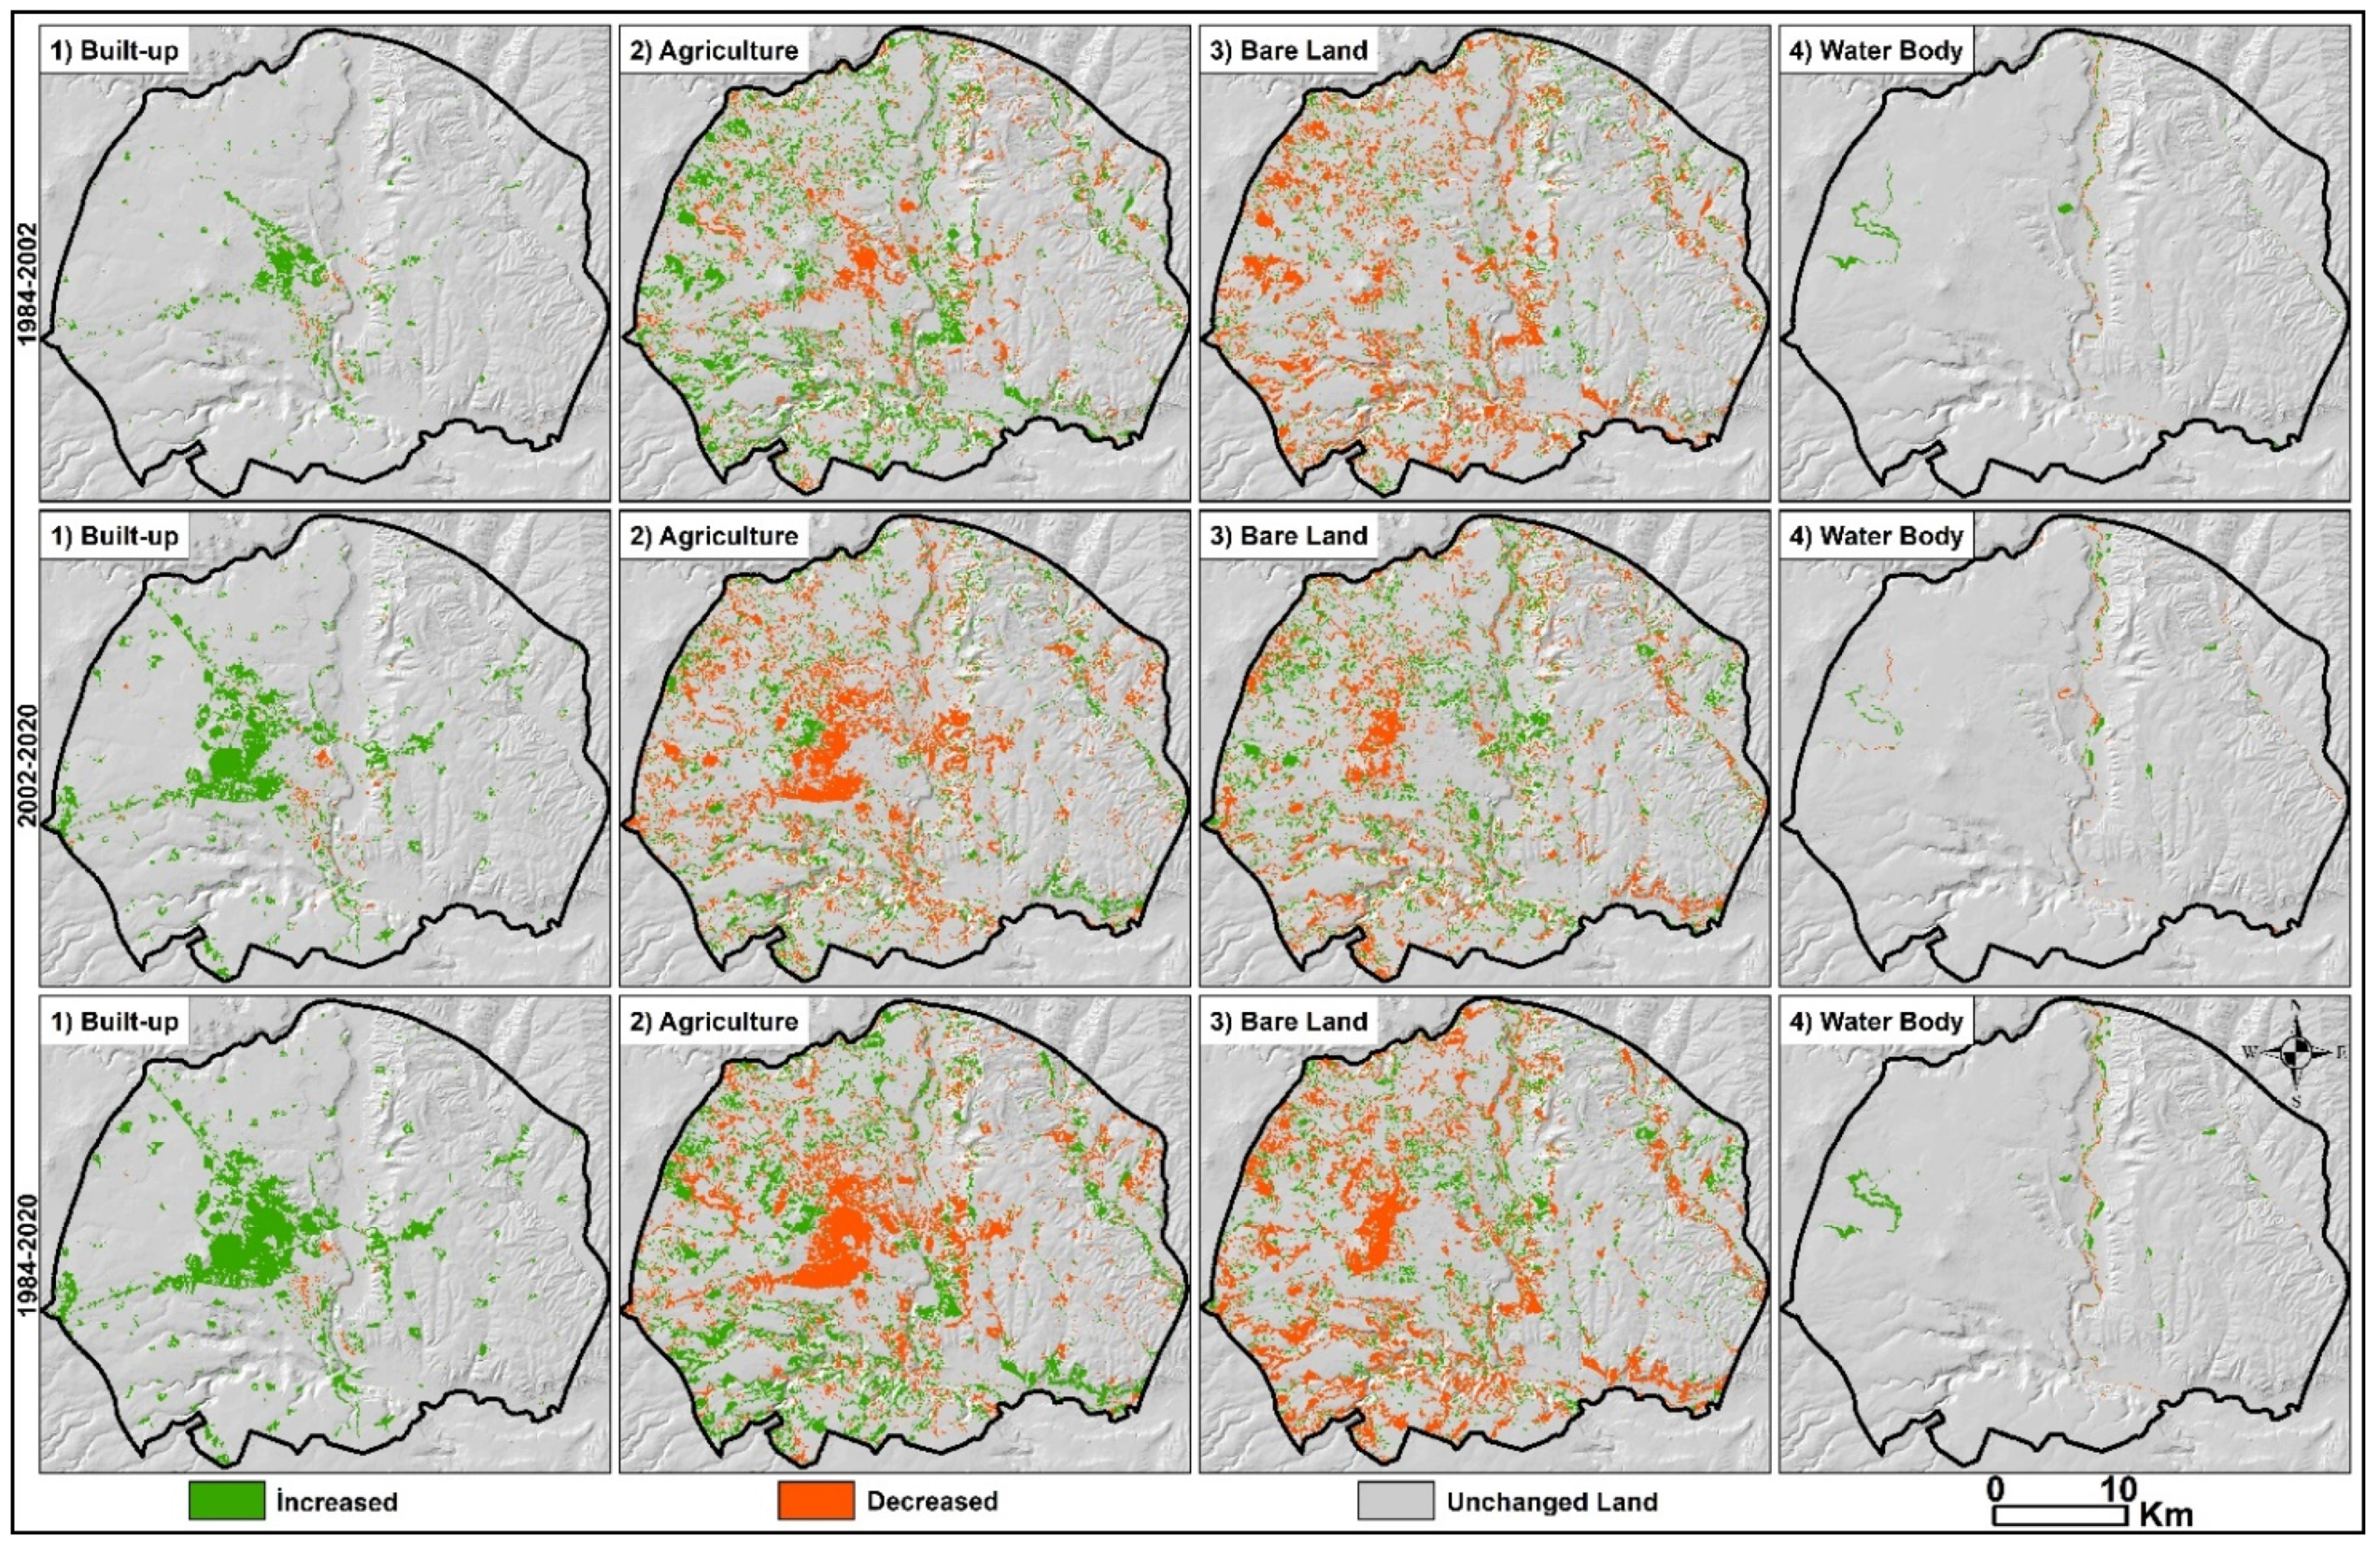
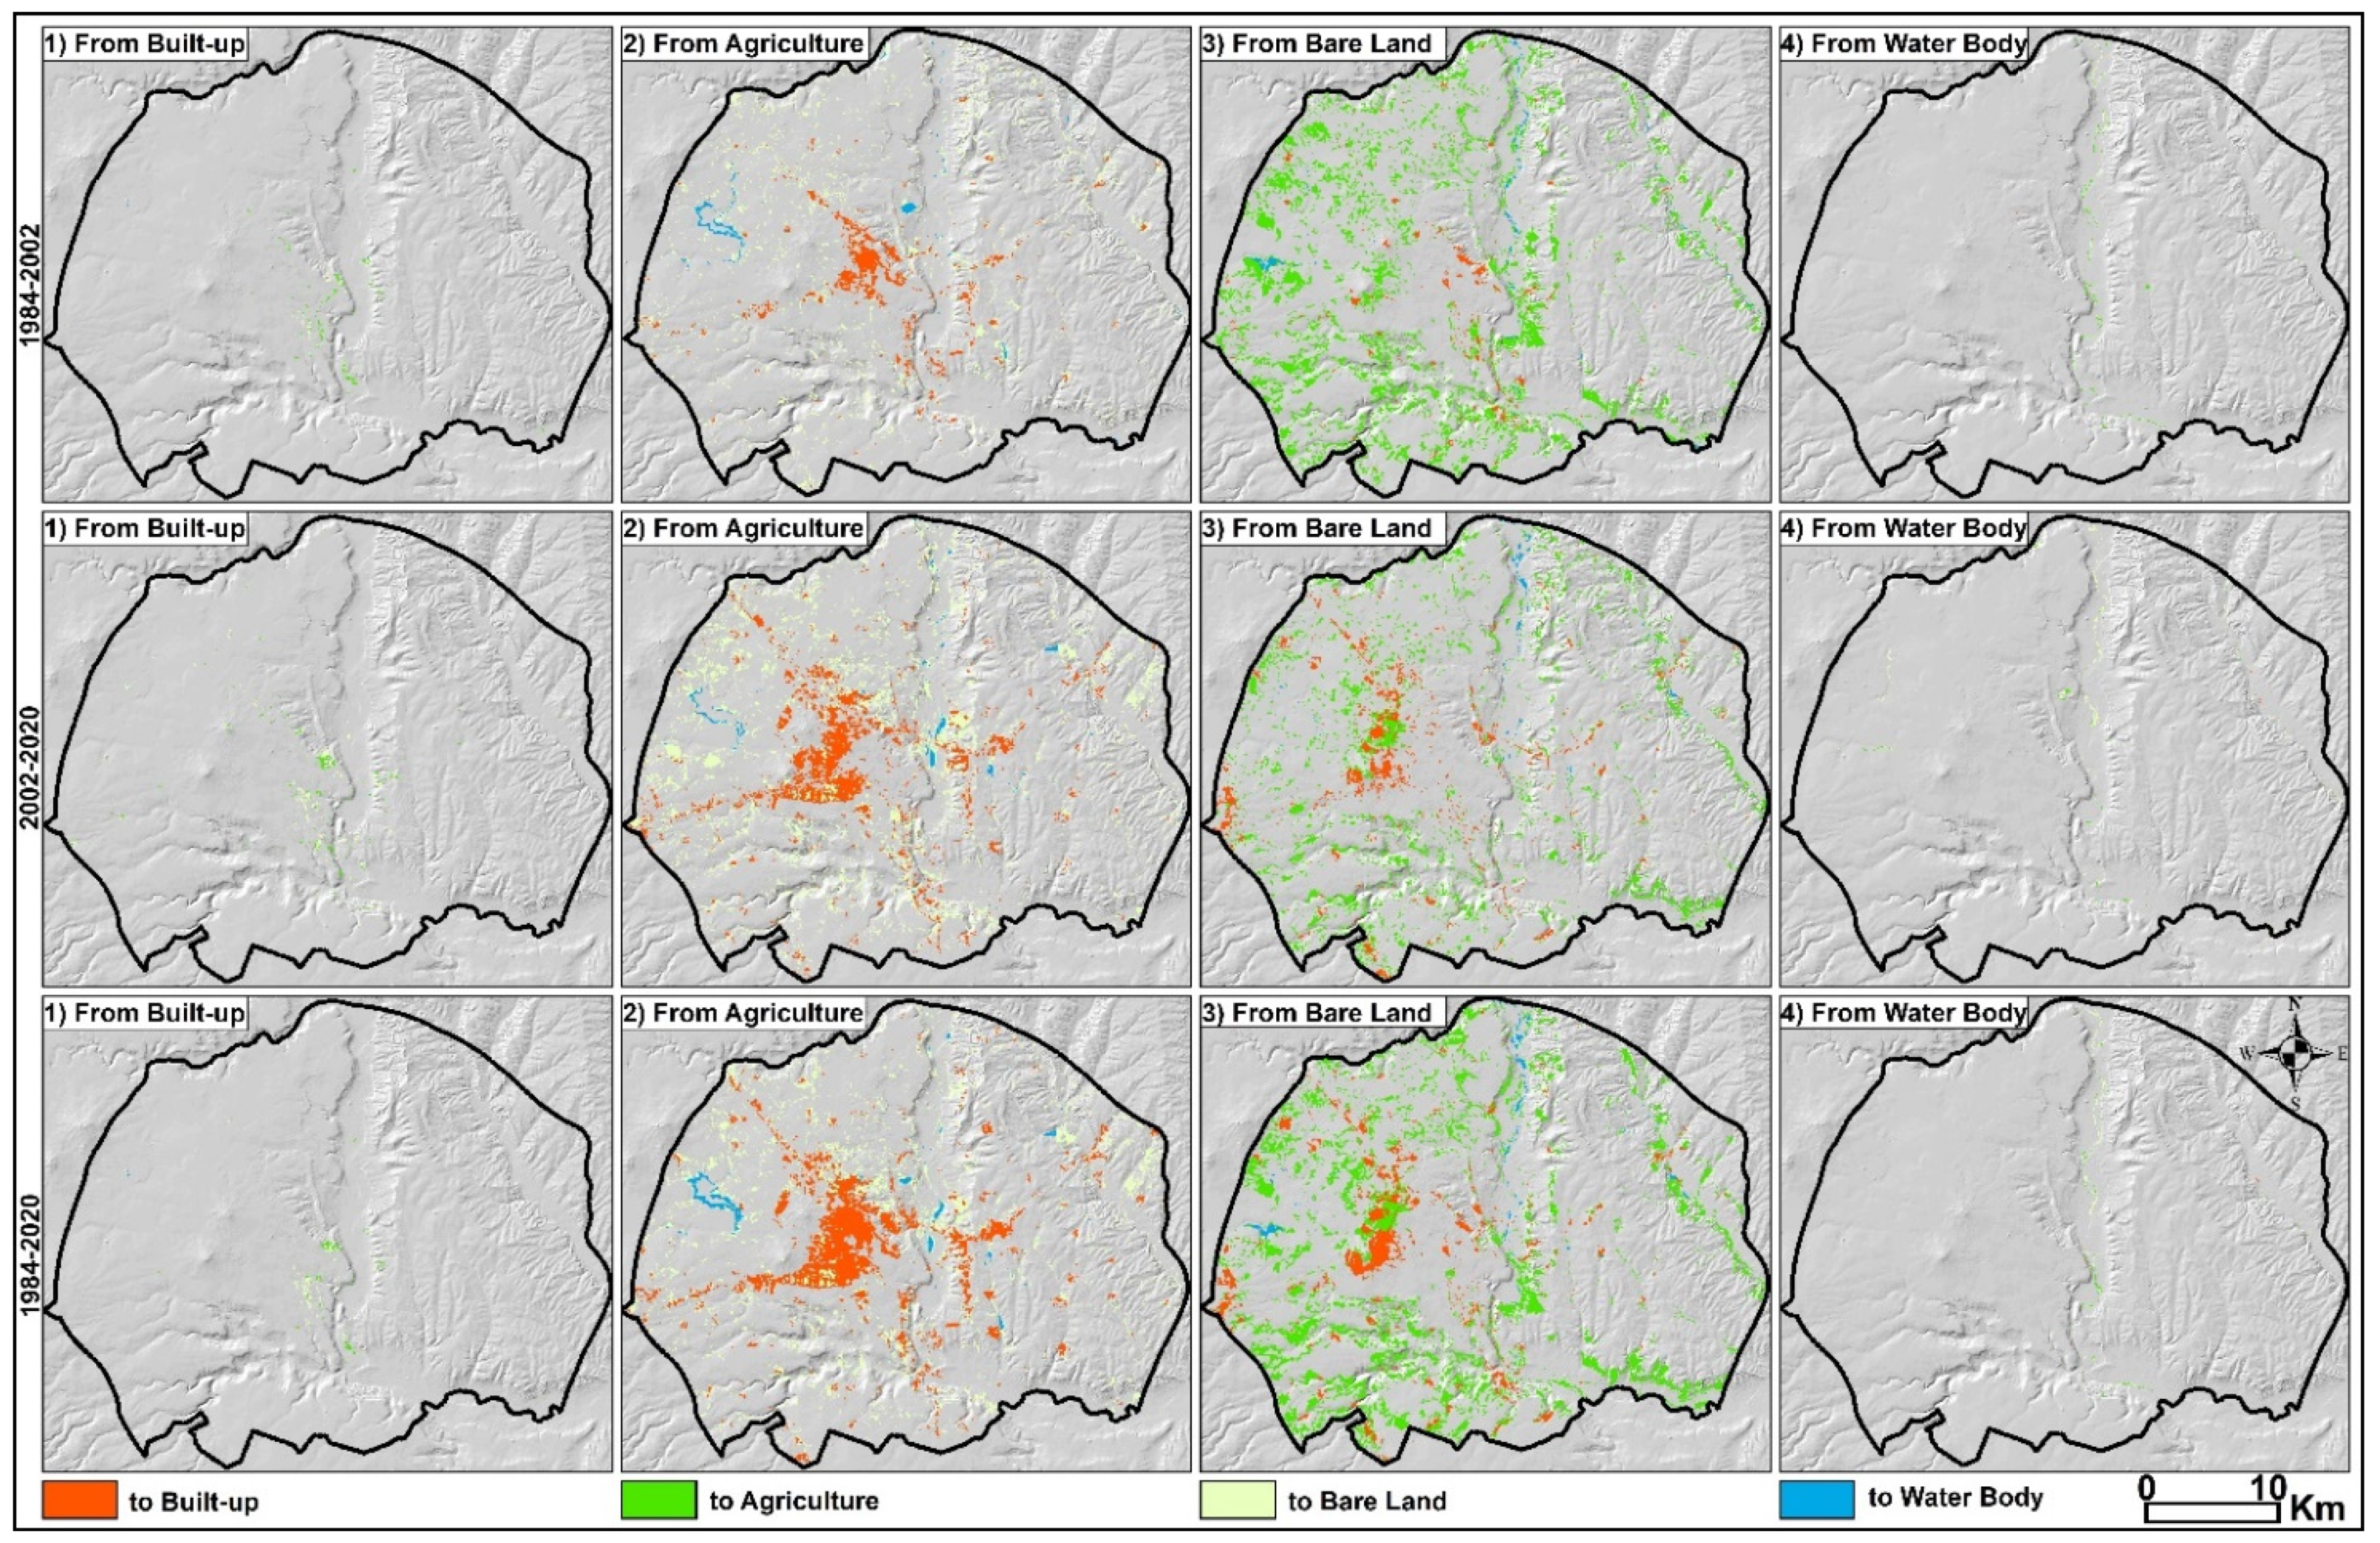
LULC was carried out at Level 1 to avoid land change occurring in the same classes. Change analysis using land change model, gained-loss maps, change detection maps and transition matrix were created. In the change detection, the total land change was obtained for the periods of 1984–2002, 2002–2020, and 1984–2020. (Table 5; Figure 4). In the period between 1984–2002, the built-up areas gained 27.2 km2 and lost 2.5 km2. The built-up areas are proportionally one of the fastest growing in LULC classes. These areas have grown mostly by destroying agricultural lands. More than 70% of the built-up areas were gained from agricultural lands. Built-up areas also gained area (7.8%) from pasture-bare surfaces. There are few transitions from residential areas to other land cover classes. These areas have mostly turned into agricultural areas (1.53 km2) and pasture-bare surfaces (0.9 km2). The change in agricultural areas has been triggered by urban growth and this has increased the pressure on pasture areas. In this period, agricultural lands gained 121.3 km2 area, lost 70.6 km2 area and +50.7 km2 net change area occurred. There were more spatial changes between agricultural areas and pasture-bare surfaces. Approximately 95% of the agricultural areas gained were pasture-bare surfaces. In addition, due to the growth of the urban over time, approximately 20 km2 of productive agricultural area has disappeared. There is a decreasing trend due to the growth of agricultural areas and built-up areas on pasture areas (Figure 5 and Figure 6).
Between 1984 and 2002, pasture-bare surfaces have 49.2 km2 gained, 129.5 km2 lost and −80.3 km2 total net change areas. Class transitions are quite high on pasture-bare surfaces and almost all of the gained areas are in agricultural areas. However, the pasture-bare areas that transition into agricultural areas are much more. Pasture-bare surfaces have also suffered land loss due to urban growth. The open surfaces around the urban have turned into built-up areas. Water surface is the land cover class that has an increasing trend over the years. Between 1984 and 2002, an area of 7.5 km2 gained, 2.5 km2 lost and +5 km2 net change occurred on the water bodies. In this period, more than 50% of the total area gained was obtained from agricultural lands. Gözegöl Pond, which was built in the fertile agricultural areas in the northeast of the research area during this period, is the main reason for this change. Another land cover class where the water body gains area is pasture-bare surfaces. Continuous bed change in the Tigris River valley causes gain–loss situations between water bodies and pasture-bare surfaces (Figure 5 and Figure 6).
Between 2002 and 2020, 70.6 km2 of built-up areas was gained and 5.5 km2 was lost. As in the previous period, a significant portion (65%) of the urban areas gained was on agricultural lands. Significant spatial losses have also occurred on pasture-bare surfaces due to urbanization. The volcanic hills in the west-northwest of the urban areas are in the class of pasture-bare surface in LULC. Due to the expansion of the urban areas in this direction these have transitioned into built-up areas. Losses in built-up areas mostly occurred around Sur within the scope of urban renewal processes. More than half of the built-up areas (3.5 km2) have been turned into pasture-bare surfaces, while the remaining part has turned into agricultural areas (2.0 km2). As of this period, while 74.1 km2 of agricultural land was gained, 133.9 km2 of area was lost and approximately −60 km2 of net areal change has been experienced. Almost all of the agricultural lands gained (96%) were obtained from pasture-bare surfaces. While agricultural areas decreased around the urban, new agricultural areas were gained by making the stony lands suitable for agricultural areas. Losses in agricultural areas (83.9 km2) occurred in pasture-bare surface and built-up areas (46.6 km2). The sprawl of build-up over agricultural areas has doubled. In this period, 90.5 km2 area was gained on pasture-bare surfaces, 97.2 km2 area was lost and a net −6.7 km2 area change occurred. The areas gained were mostly obtained from agricultural fields, as in the previous period. Areas lost are more than areas gained. Although the rate of agricultural land is high in the areas lost on pasture-bare surfaces, this rate tends to decrease. Because the rate of built-up areas has increased in the occupation of pasture-bare surfaces. With the urban growth on pasture-bare surfaces, built-up areas have increased more than three times. Water bodies gained 5.6 km2 area, lost 4.1 km2 area and + 1.5 km2 net change occurred. The increase in the area gained is related to the level changes in the lakes. The areas gained on the water body continued to grow against agriculture, especially irrigated agricultural areas (Figure 5 and Figure 6).
The LULC change in the 1984–2020 period shows similar characteristics with other periods. Built-up areas are the fastest growing land cover among the land cover classes, and it has grown by rapidly destroying the agricultural and pasture areas around it. The greatest losses due to built-up areas (31.3 km2) occurred on pasture-bare surfaces. Talay and Mastfroş volcanic hills which have a different appearance compared to their surroundings have turned into built-up areas. In the long annual period, agricultural lands gained 126.5 km2, lost 136.3 km2 and experienced a net change of approximately −10 km2. Almost all of the agricultural lands were gained from pasture-bare surfaces. The lands lost in agricultural areas were mostly in the pasture-bare surface and built-up areas, as in the previous periods. On pasture-bare surfaces, 72.8 km2 area was gained, 159.8 km2 area was lost and as a result, net change occurred in approximately −90 km2 area. The share of agricultural lands on the lost areas has started to decrease proportionally. The rapid growth of the built-up areas has caused a rapid change and transformation in the pasture-bare surfaces. These areas decreased with urban growth in the periphery of the urban areas and with agricultural growth throughout the research area. For this reason, the greatest spatial changes and transformations by periods have been experienced on pasture-bare surfaces. Water bodies gained an area of 9.7 km2 in this wide period, lost an area of 3.4 km2 and a net change occurred in a total area of +6.3 km2. The spatial distribution of the gained water surfaces increases with the newly constructed lakes and ponds. The water surfaces have grown on fertile agricultural lands, causing the loss of agricultural land (Figure 5 and Figure 6).

3.4. LULC Trend Analysis

Trend analysis provides a visual opportunity to understand possible directions of urban expansion [60]. In the research area, LULC change is a phenomenon triggered by urban sprawl. The existence of transition areas from land cover classes towards the built-up area is an observed phenomenon. The increasing pressure of built-up areas on any land cover class triggers the change of other land cover classes with each other. The spatial trend of land change is especially from agricultural areas to built-up areas. There are three different situations here, as expressed by Atay Kaya and Kut Görgün (2020) [61]. Existing built-up areas, main road networks and urban land uses such as industry-mining are the main reasons for the transition from agricultural areas to built-up areas. The spatial trend of the transition from all land cover classes to the built-up class in the examined periods shows parallelism with the direction of urban expansion. It is expected that the trend of land change will tend to move in the west-northwest direction.
The trend analysis of the transition from agricultural areas to built-up areas shows similar characteristics in all 3 periods. The trend of change in agricultural areas is low in the east of the research area and higher in the west. Urban growth has led to the relocation of farmland to the west-northwest. Due to the agricultural losses occurring around the urban areas, agricultural areas have regained space by putting pressure on pasture-bare surfaces. It is thought that agricultural areas will be pushed out of the research area in the west-northwest direction in the future. The spatial trend of land change on pasture-bare surfaces is similar to agricultural areas. Although the spatial trend is constantly increasing, it is due to the transitional areas between agricultural areas and water bodies. In the total period, land transition areas are increasing due to the turn into water bodies along the Tigris River and agricultural areas north of the city center to pasture-bare surface. A dispersed spatial trend is observed on water bodies compared with other land cover classes. It is observed that the trend for water bodies does not change spatially, but concentrates in certain areas such as lakes, ponds and rivers. In the total period, the probability and trend of land transition is high due to the regained water body around Gözegöl Pond (Figure 7).

3.5. Simulation of LULC Classes

An FLUS model working with CA-based ANN was used in the simulation of future urban growth. In the creation of the model, the past and current situations were used and predictions were made for the future. In the first stage of the simulation, transition probability matrix and transition areas matrix of different periods were created using the MC. The transition probability matrix is a text file that expresses the probability of crossing of land classes, and the transition areas matrix is the number of pixels that are expected to transition from one land cover to another in a certain period [62]. According to the transition probability matrix, the highest transition probability in terms of periods is in built-up and agricultural areas. The Markov probability value of these classes is over 0.90 in some periods. The high probability value in built-up and agricultural areas shows that transition areas are high among these classes. These probability values refer to the land cover classes that will be most subject to change. The lowest probability among land cover classes is on pasture-bare surface and water bodies. In addition, there is a high probability of transition between pasture-bare surfaces and agricultural areas. Finally, at this stage, the transition probability map was obtained in different periods by using the transition probability matrix.
In the other stage of the FLUS model, the Self-Adaptive Inertia and Competition Mechanism CA was run. A set of simulation rules such as land use demand, cost matrix and weight of neighborhood and threshold are entered in the creation of simulation maps. Simulation settings in the FLUS model were determined according to expert user knowledge. Based on the possibility of transition between LULC classes, current and future LULC demand pixels were determined. The cost matrix shows whether there will be transitions between land cover classes in the simulation. In user control, a value of 1 indicates the possibility of class transitions, and 0 indicates that there will be no transitions between classes. Weight of neighborhood is the ratio of transitions between classes between 0 and 1. High neighborhood value is assigned to LULC classes in which the pixel transition is high when under expert control (Table 6).
The simulation was created by including the transition probability image in the model. MC are powerful tools for predicting the change that may occur in the future based on the experience of change in different periods. However, it has difficulty with predicting the spatial situation of LULC classes in the future. For this reason, MC are used with ANN, which is a powerful method to measure the spatial distribution of LULC. During the training stage of the ANN, the common variables affecting the land cover classes were normalized between 0 and 1. Finally, according to the suitability classes, data were entered into the model as a hidden layer (Figure 8).
Projected LULC results were compared with the current LULC of the same year using the MC method [60], (Table 7). The LULC map of 2002 was predicted using the LULC maps of 1984 and 1993. In the 2002 projection, the existing built-up areas and the simulated built-up areas overlapped by 88%. In other land cover classes, where the change showed an increase or decrease in a certain trend, the accuracy rate was above 90%. The highest level of accuracy rate (99%) was most particularly reached for agricultural areas where the land change is continuous. On the water bodies, where land transitions between classes are less frequent, high accuracy rates are available in all periods. The LULC map of 2011 was predicted using the LULC maps of 1993 and 2002. The fact that the built-up areas in Diyarbakır grow at different rates causes the accuracy rate to be lower in all periods. The same is valid for the next period. The LULC map of 2020 was predicted using the LULC maps of 2002 and 2011 and compared with the current 2020 LULC. As stated before, the lowest Markov estimation rate was found in the built-up area (approximately 80%). For other land cover classes, the prediction accuracy is over 90%.
Acceptable accuracy was achieved by comparing existing LULC and simulated LULC maps from the same year. This proves that the Markov-based model can be used to predict the future LULC [63]. Thus, LULC prediction for 2038 was created using existing LULC maps. The simulation results show that the biggest positive change will occur in the built-up areas. It is estimated that the built-up area will expand towards its surroundings by gaining 22 km2 in 2038. In other land cover classes, land change is expected in the negative direction caused by urban growth. It is understood that pasture-bare surfaces within these classes will be exposed to more pressure in the future. Pasture-bare surfaces are constantly being changed and transformed by both the agricultural class and the built-up area. It is predicted that until the simulated 2038, there will be a negative area loss in an area of approximately 10 km2. On the water bodies, it is expected that there will be less spatial changes and transformations compared with the current situation. It is more difficult to predict future water bodies due to the lakes and ponds that will be built (Figure 9).

3.6. Accuracy Assessment of LULC Simulation

In ANN, actual images and simulated images are obtained according to the intersection of the horizontal and vertical axis in the same cell. For this purpose, the validity of the model was first checked according to the Kappa coefficient index. The real LULC maps of the control models for 2002, 2011 and 2020 were compared with the simulation maps of the same years that were predicted. By matching the control model years with the simulation results, the overall accuracy was 0.78 and kappa 0.65 in 2002, the overall accuracy was 0.82 and kappa 0.75 in 2011, and the overall accuracy was 0.84 and kappa 0.77 in 2020. When evaluated according to land cover classes, the kappa value is above 0.5 in all classes (Table 8). Another approach to evaluate the validity of simulation results is the Figure of Merit (FoM) index [64]. This approach calculates only by comparing simulated areas with their actual location. According to the results of the validity analysis of the FoM index, the producer accuracy and the user accuracy was obtained at a usable level. The FoM value, on the other hand, increases from past years to the present and is above 0.70 in all periods.
The simulation results show the trend of LULC classes in Diyarbakır over the years. According to these results, it is understood that the built-up area will gain positive area in the future, while other land cover classes will lose negative area. In the future, farmland and pasture-bare surfaces will be the land classes that are more exposed to change. Agricultural lands have lost the most area in the past due to urban growth. Urban growth has been faster on agricultural lands, especially after the 2000s. As a result, agricultural lands will continue to lose area negatively in the future, especially around the urban. However, agricultural lands that have lost area around the urban will gain area again over pasture-bare surfaces. As a result, losses in agricultural lands will continue in a decreasing trend.
In the future, it is expected that the largest lost areas will be on pasture-bare surfaces. It is estimated that 10% of losses will be experienced in 2038 due to the growth of agricultural areas. In addition, it is highly probable that the pasture-bare surfaces will transition into the built-up area in the direction of the urban expansion. Conversion of unused bare lands around the urban to built-up areas will prevent the loss of agricultural areas. Water bodies are the land cover class where the least change is expected. It is predicted that there will be a change in a stable or decreasing trend in the future.

4. Discussion and Conclusions

Identifying LULC changes in Diyarbakır is vital for future decision and planning. In the examined period, LULC experienced approximately 30% change. The biggest change occurred in agricultural areas. As for the ratio, the biggest change occurred in the built-up areas. It has been determined that the gain-loss and net change show similar characteristics in the different periods. In general, while built-up areas and water bodies area gained, agriculture and pasture-bare surfaces lost area. Area transitions between land cover classes are highly complex. Increasing areas in the built-up area transform all land cover classes. With urbanization, built-up areas gain area by creating pressure on agricultural areas and agricultural areas on pasture-bare surfaces. Urban sprawl on agricultural areas has decreased agricultural areas around the city. On the other hand, the need for agricultural lands has been provided from pasture-bare surfaces and the greatest areal reductions occurred on pasture-bare surfaces.
Different dynamics have played a role in urban development and the resulting LULC change in Diyarbakır. As in all of Turkey, Diyarbakir has been greatly affected by the urbanization movement. In addition, regional and local actors have caused the LULC change in Diyarbakır to be more deeply affected. It has been determined that the LULC change is directly proportional to the internal migration periods that cause rapid urbanization. Until the 1990s, industrial investments and the service sector had an impact on migration. After 1990, however, the terror that was effective in the region accelerated the migration from rural areas to the urban. Increasing housing due to population growth triggered land change. This situation caused by rapid population has led to unplanned urbanization. It has been determined that there is a strong correlation between the land change trend and the direction of urban expansion. Bağlar district, which expansion on agricultural lands, was most affected by this situation.
Multilayer ANN, which is another method in urban modeling, are used together with MC. It has been determined that the model can be used in the simulation of dynamic and fast-growing cities. In the model, urban growth simulation was created for the year 2038. Transition probability images obtained from LULC change and key variables affecting LULC as hidden layer were entered into the model. According to the model results, it is predicted that other land cover classes will lose area due to the urban sprawl.
It is estimated that the urban will continue to grow by destroying agricultural and pasture areas in the west-northwest direction. The simulation results show that by 2038, approximately 20 km2 of agricultural land will be destroyed due to urban growth. It is thought that agricultural lands will disappear until the new beltway in the west-northwest, which is the expansion direction of the urban. It is highly probable that the agricultural lands located between Bağcılar and Yeşildalı Village will be covered with settlement areas in the future. In addition, it is predicted that urban growth will destroy the agricultural areas around the university in the east of the Tigris River. Agricultural areas between Elazığ Boulevard and the Tigris River valley in Yenişehir-Dönümlü, Elidolu, Dokuzçeltik are considered as urban growth areas in the future by local governments. These areas are not suitable for the natural grow of the urban areas. These areas contain some risk factors such as landslides and rockfalls in some places.
It is expected that approximately five square kilometers of land on pasture-bare surfaces will disappear by 2038, depending on urban growth. It is thought that the pasture-bare surfaces in Talaytepe and Mastfroş Hills in the northwest of the city will disappear in the future. In addition, the urban pattern will intensify on open surfaces in suburban built-up areas. According to the uncontrolled scenario, it is estimated that about 30% of protected areas and natural sites will disappear due to urban growth. It is very important to protect natural heritage areas such as “Hevsel Gardens” from the uncontrolled growth of urban areas. For this reason, ecologically sensitive areas should be determined in upper-scale regional plans and protected in sub-scale plans.
In Turkey, plans implemented at different times based on laws have directed urban growth. With the Municipal Law No. 1580 enacted in 1930 in the Republican period, municipalities were given the authority to build houses. In this direction, the first development plan of Diyarbakır was made in 1937. Although master plans were prepared at different intervals (1962, 1965, 1985, 1994) after this date, they could not be implemented to a large extent due to the intense migration to the urban. Today, the urban area is growing under the control of the 1/25.000 scaled master plan approved on 15 December 2006 and the 1/100.000 scaled Adıyaman-Şanlıurfa-Diyarbakır Planning Region Environmental Plan approved on 30 October 2012. The sub-scale 1/5000 master plans and 1/1000 implementation plans made later in the urban were shaped within this framework. The expansion of the urban area in the west-northwest direction with the effect of the existing plans caused the urban simulation to be in this direction. Both urban plans and simulation results show that agricultural and pasture lands around the urban will be lost more in the future. However, there are suitable bare surfaces for urban expansion in the direction of the natural urban growth. These areas should be included in the planning process as priority built-up areas. In urban planning, more realistic solutions should be produced by ensuring coordination between lower-upper scale plans. There should be a planning process where the pressure on natural area ecosystems is the least in urban areas. In addition, it is necessary to develop rural-urban interactive plans that take into account the needs of rural areas around the urban.
Urban expansion areas in urban plans are determined by population criteria, away from geographical information. It is understood that the 1.7 million 2040 population projection for Diyarbakır central districts will be reached in a short time in the Environmental Plan. However, it is thought that plans that do not take into account geographical factors will trigger urban environmental problems even more in the future.
In Diyarbakır, LULC is under threat due to urban sprawl. It is necessary to control ecologically sensitive protected areas and plans based on sustainable development that will benefit future generations. The efficient and effective use of natural resources is possible by developing studies and plans that simulate the future.

Author Contributions

Conceptualization, A.Ç.; formal analysis, A.Ç. and D.D.; investigation, A.Ç. and D.D.; methodology, D.D.; resources, A.Ç.; writing—original draft, D.D.; writing-review and editing, A.Ç. and D.D. All authors have read and agreed to the published version of the manuscript.

Funding

This research was produced from the PhD study supported within the scope of Fırat University Scientific Research Projects (grant number ISBF. 19.04).

Institutional Review Board Statement

Not applicable.

Informed Consent Statement

Not applicable.

Data Availability Statement

Not applicable.

Acknowledgments

The authors would like to thank the anonymous reviewers for their highly constructive comments and suggestions.

Conflicts of Interest

The authors declare no conflict of interest.

References

  1. Xu, X.; Guan, M.; Jiang, H.; Wang, L. Dynamic Simulation of Land Use Change of the Upper and Middle Streams of the Luan River, Northern China. Sustainability 2019, 11, 4909. [Google Scholar] [CrossRef] [Green Version]
  2. Ritse, V.; Basumatary, H.; Kulnu, A.S.; Dutta, G.; Phukan, M.M.; Hazarika, N. Monitoring Land Use Land Cover Changes in the Eastern Himalayan Landscape of Nagaland, Northeast India. Environ. Monit. Assess. 2020, 192, 711. [Google Scholar] [CrossRef]
  3. Ganaie, T.A.; Jamal, S.; Ahmad, W.S. Changing Land Use/Land Cover Patterns and Growing Human Population in Wular Catchment of Kashmir Valley, India. GeoJournal 2021, 86, 1589–1606. [Google Scholar] [CrossRef]
  4. Negewo, T.; Sarma, A. Anthropogenic Land Use/Cover Change Detection and Its Impacts on Hydrological Responses of Genale Catchment, Ethiopia. Res. Sq. 2021. [Google Scholar] [CrossRef]
  5. Alam, A.; Bhat, M.S.; Maheen, M. Using Landsat Satellite Data for Assessing the Land Use and Land Cover Change in Kashmir Valley. GeoJournal 2020, 85, 1529–1543. [Google Scholar] [CrossRef] [Green Version]
  6. Al Kafy, A.; Naim, M.N.H.; Subramanyam, G.; Faisal, A.A.; Ahmed, N.U.; Rakib, A.A.; Kona, M.A.; Sattar, G.S. Cellular Automata Approach in Dynamic Modelling of Land Cover Changes Using RapidEye Images in Dhaka, Bangladesh. Environ. Challenges 2021, 4, 100084. [Google Scholar] [CrossRef]
  7. Mishra, V.; Rai, P.; Mohan, K. Prediction of Land Use Changes Based on Land Change Modeler (LCM) Using Remote Sensing: A Case Study of Muzaffarpur (Bihar), India. J. Geogr. Inst. Jovan Cvijic SASA 2014, 64, 111–127. [Google Scholar] [CrossRef]
  8. Gounaridis, D.; Chorianopoulos, I.; Koukoulas, S. Exploring Prospective Urban Growth Trends under Different Economic Outlooks and Land-Use Planning Scenarios: The Case of Athens. Appl. Geogr. 2018, 90, 134–144. [Google Scholar] [CrossRef]
  9. Hadgu, K.M. Temporal and Spatial Changes in Land Use Patterns and Biodiversity in Relation to Farm Productivity at Multiple Scales in Tigray, Ethiopia; Wageningen University: Wageningen, The Netherlands, 2008. [Google Scholar]
  10. Lambin, E.F.; Meyfroidt, P. Global Land Use Change, Economic Globalization, and the Looming Land Scarcity. Proc. Natl. Acad. Sci. USA 2011, 108, 3465–3472. [Google Scholar] [CrossRef] [Green Version]
  11. Hamad, R.; Balzter, H.; Kolo, K. Predicting Land Use/Land Cover Changes Using a CA-Markov Model under Two Different Scenarios. Sustainability 2018, 10, 3421. [Google Scholar] [CrossRef] [Green Version]
  12. Metzger, M.J.; Rounsevell, M.D.A.; Acosta-Michlik, L.; Leemans, R.; Schröter, D. The Vulnerability of Ecosystem Services to Land Use Change. Agric. Ecosyst. Environ. 2006, 114, 69–85. [Google Scholar] [CrossRef]
  13. Calzada, L.; Meave, J.A.; Bonfil, C.; Figueroa, F. Lands at Risk: Land Use/Land Cover Change in Two Contrasting Tropical Dry Regions of Mexico. Appl. Geogr. 2018, 99, 22–30. [Google Scholar] [CrossRef]
  14. Aksoy, H.; Kaptan, S. Monitoring of Land Use/Land Cover Changes Using GIS and CA-Markov Modeling Techniques: A Study in Northern Turkey. Environ. Monit. Assess. 2021, 193, 507. [Google Scholar] [CrossRef]
  15. Marraccini, E.; Debolini, M.; Moulery, M.; Abrantes, P.; Bouchier, A.; Chéry, J.P.; Sanz Sanz, E.; Sabbatini, T.; Napoleone, C. Common Features and Different Trajectories of Land Cover Changes Insix Western Mediterranean Urban Regions. Appl. Geogr. 2015, 62, 347–356. [Google Scholar] [CrossRef]
  16. Vitousek, P.M.; Mooney, H.A.; Lubchenco, J.; Melillo, J.M. Human Domination of Earth’s Ecosystems. Science 1997, 277, 494–499. [Google Scholar] [CrossRef] [Green Version]
  17. Mendiratta, P.; Gedam, S. Assessment of Urban Growth Dynamics in Mumbai Metropolitan Region, India Using Object-Based Image Analysis for Medium-Resolution Data. Appl. Geogr. 2018, 98, 110–120. [Google Scholar] [CrossRef]
  18. Kaya, A.Y. Enes Karadeniz Afet Sonrası Kent ve Planlama: Elazığ Örneği. In Depremler, Kent Planlama ve Geoteknik Zemin Uygulamaları; Güner, A.B.S., Ed.; Iksad Publications: Ankara, Turkey, 2020; pp. 65–96. ISBN 978-625-7279-88-8. [Google Scholar]
  19. Cui, N.; Feng, C.C.; Han, R.; Guo, L. Impact of Urbanization on Ecosystem Health: A Case Study in Zhuhai, China. Int. J. Environ. Res. Public Health 2019, 16, 4717. [Google Scholar] [CrossRef] [Green Version]
  20. Seto, K.C.; Güneralp, B.; Hutyra, L.R. Global Forecasts of Urban Expansion to 2030 and Direct Impacts on Biodiversity and Carbon Pools. Proc. Natl. Acad. Sci. USA 2012, 109, 16083–16088. [Google Scholar] [CrossRef] [Green Version]
  21. Alphan, H. Land-Use Change and Urbanization of Adana, Turkey. Land Degrad. Dev. 2003, 14, 575–586. [Google Scholar] [CrossRef]
  22. Tanrivermis, H. Agricultural Land Use Change and Sustainable Use of Land Resources in the Mediterranean Region of Turkey. J. Arid Environ. 2003, 54, 553–564. [Google Scholar] [CrossRef]
  23. Verburg, P.H.; Schot, P.P.; Dijst, M.J.; Veldkamp, A. Land Use Change Modelling: Current Practice and Research Priorities. GeoJournal 2004, 61, 309–324. [Google Scholar] [CrossRef]
  24. Kourosh Niya, A.; Huang, J.; Kazemzadeh-Zow, A.; Karimi, H.; Keshtkar, H.; Naimi, B. Comparison of Three Hybrid Models to Simulate Land Use Changes: A Case Study in Qeshm Island, Iran. Environ. Monit. Assess. 2020, 192, 302. [Google Scholar] [CrossRef] [PubMed]
  25. Aburas, M.M.; Ho, Y.M.; Ramli, M.F.; Ash’aari, Z.H. The Simulation and Prediction of Spatio-Temporal Urban Growth Trends Using Cellular Automata Models: A Review. Int. J. Appl. Earth Obs. Geoinf. 2016, 52, 380–389. [Google Scholar] [CrossRef]
  26. Shafizadeh-Moghadam, H.; Asghari, A.; Taleai, M.; Helbich, M.; Tayyebi, A. Sensitivity Analysis and Accuracy Assessment of the Land Transformation Model Using Cellular Automata. GIScience Remote Sens. 2017, 54, 639–656. [Google Scholar] [CrossRef]
  27. Alan, İ.; Demirörs, Z.; Bayar, R.; Karabacak, K. Markov Zincirleri Temelli Arazi Örtüsü Tahmin Modeli Geliştirilmesi: Ankara İli Örneği. lnternational J. Geogr. Geogr. Educ. 2020, 42, 650–667. [Google Scholar] [CrossRef]
  28. Girma, R.; Fürst, C.; Moges, A. Land Use Land Cover Change Modeling by Integrating Artificial Neural Network with Cellular Automata-Markov Chain Model in Gidabo River Basin, Main Ethiopian Rift. Environ. Challenges 2022, 6, 100419. [Google Scholar] [CrossRef]
  29. Liu, X.; Liang, X.; Li, X.; Xu, X.; Ou, J.; Chen, Y.; Li, S.; Wang, S.; Pei, F. A Future Land Use Simulation Model (FLUS) for Simulating Multiple Land Use Scenarios by Coupling Human and Natural Effects. Landsc. Urban Plan. 2017, 168, 94–116. [Google Scholar] [CrossRef]
  30. Guo, H.; Cai, Y.; Yang, Z.; Zhu, Z.; Ouyang, Y. Dynamic Simulation of Coastal Wetlands for Guangdong-Hong Kong-Macao Greater Bay Area Based on Multi-Temporal Landsat Images and FLUS Model. Ecol. Indic. 2021, 125, 107559. [Google Scholar] [CrossRef]
  31. Zhang, D.; Wang, X.; Qu, L.; Li, S.; Lin, Y.; Yao, R.; Zhou, X.; Li, J. Land Use/Cover Predictions Incorporating Ecological Security for the Yangtze River Delta Region, China. Ecol. Indic. 2020, 119, 106841. [Google Scholar] [CrossRef]
  32. Tözün, V. Diyarbakır Şehir Coğrafyası. Dil ve Tar. Coğrafya Fakültesi Yıllık Araştırmalar Derg. 1941, 1, 481–498. [Google Scholar]
  33. Karadoğan, S. Yerleşmeye Etkileri Açısından Diyarbakır Kenti ve Yakın Çevresinin Doğal Peyzaj Unsurları. In Diyarbakır Kalesi ve Hevsel Bahçeleri kültürel peyzajı; Soylukaya, N., Ed.; Diyarbakır Büyükşehir Belediyesi Yayınları: Diyarbakır, Turkey, 2015; pp. 1–16. [Google Scholar]
  34. Roy, D.P.; Wulder, M.A.; Loveland, T.R.; Woodcock, C.E.; Allen, R.G.; Anderson, M.C.; Helder, D.; Irons, J.R.; Johnson, D.M.; Kennedy, R.; et al. Landsat-8: Science and Product Vision for Terrestrial Global Change Research. Remote Sens. Environ. 2014, 145, 154–172. [Google Scholar] [CrossRef] [Green Version]
  35. Aksoy, H.; Kaptan, S.; Varol, T.; Cetin, M.; Ozel, H.B. Exploring Land Use/Land Cover Change by Using Density Analysis Method in Yenice. Int. J. Environ. Sci. Technol. 2022. [Google Scholar] [CrossRef]
  36. Tombuş, F.E. Çorum İli ve Yakın Çevresinin Uzaktan Algılama Yöntemleri Ile Arazi Kullanımının Değerlendirilmesi; Ankara Üniversitesi: Ankara, Turkey, 2019. [Google Scholar]
  37. Balçık, F.B.; Göksel, Ç. SPOT 5 ve farklı görüntü birleştirme algoritmaları. Jeodezi Jeoinformasyon Derg. 2010, 101. Available online: https://dergipark.org.tr/en/pub/hkmojjd/issue/53143/704637 (accessed on 24 May 2022).
  38. Rimal, B.; Zhang, L.; Keshtkar, H.; Haack, B.N.; Rijal, S.; Zhang, P. Land Use/Land Cover Dynamics and Modeling of Urban Land Expansion by the Integration of Cellular Automata and Markov Chain. ISPRS Int. J. Geo-Inf. 2018, 7, 154. [Google Scholar] [CrossRef] [Green Version]
  39. Altuntaş, C. Özşen Çorumluoğlu Uzaktan Algılama Görüntülerinde Digital Görüntü Işleme ve RSImage Yazılımı. In Proceedings of the Selçuk Üniversitesi Jeodezi ve Fotogrametri Mühendisliği Öğretiminde 30. Yıl Sempozyumu, Konya, Turkey, 16–18 October 2002; pp. 434–442. [Google Scholar]
  40. Sertel, E.; Robock, A.; Ormeci, C. Impacts of Land Cover Data Quality on Regional Climate Simulations. Int. J. Climatol. 2010, 30, 1942–1953. [Google Scholar] [CrossRef]
  41. Liu, D.; Xia, F. Assessing Object-Based Classification: Advantages and Limitations. Remote Sens. Lett. 2010, 1, 187–194. [Google Scholar] [CrossRef]
  42. Ersoy Mirici, M.; Satir, O.; Berberoglu, S. Monitoring the Mediterranean Type Forests and Land-Use/Cover Changes Using Appropriate Landscape Metrics and Hybrid Classification Approach in Eastern Mediterranean of Turkey. Environ. Earth Sci. 2020, 79, 492. [Google Scholar] [CrossRef]
  43. Teixeira, L.; Hedley, J.; Shapiro, A.; Barker, K. Comparison of Two Independent Mapping Exercises in the Primeiras and Segundas Archipelago, Mozambique. Remote Sens. 2016, 8, 52. [Google Scholar] [CrossRef] [Green Version]
  44. Anderson, J.R.; Hardy, E.E.; Roach, J.T.; Witmer, R.E. Land Use and Land Cover Classification System for Use with Remote Sensor Data; United State Geological Survey: Washington, DC, USA, 1976. [Google Scholar]
  45. Naikoo, M.W.; Rihan, M.; Ishtiaque, M. Shahfahad Analyses of Land Use Land Cover (LULC) Change and Built-up Expansion in the Suburb of a Metropolitan City: Spatio-Temporal Analysis of Delhi NCR Using Landsat Datasets. J. Urban Manag. 2020, 9, 347–359. [Google Scholar] [CrossRef]
  46. Gashu, K.; Gebre-Egziabher, T. Spatiotemporal Trends of Urban Land Use/Land Cover and Green Infrastructure Change in Two Ethiopian Cities: Bahir Dar and Hawassa. Environ. Syst. Res. 2018, 7, 8. [Google Scholar] [CrossRef] [Green Version]
  47. Johnson, J.M.; Clarke, K.C. An Area Preserving Method for Improved Categorical Raster Resampling. Cartogr. Geogr. Inf. Sci. 2021, 48, 292–304. [Google Scholar] [CrossRef]
  48. Morshed, S.R.; Fattah, M.A.; Haque, M.N.; Morshed, S.Y. Future Ecosystem Service Value Modeling with Land Cover Dynamics by Using Machine Learning Based Artificial Neural Network Model for Jashore City, Bangladesh. Phys. Chem. Earth 2021, 126, 103021. [Google Scholar] [CrossRef]
  49. Canpolat, F.A.; Dağlı, D. Elazığ İli’nde arazi kullanımı değişimi (2006-2018) ve simülasyonu (2030). Int. J. Geogr. Geogr. Educ. 2020, 42, 702–723. [Google Scholar] [CrossRef]
  50. Liu, J.; Zhang, Z.; Zhuang, D.; Wang, Y.; Zhou, W.; Zhang, S.; Li, R.; Jiang, N.; Wu, S. A study on the spatial-temporal dynamic changes of land-use and Driving Forces Analyses of China in the 1990s. Geogr. Res. 2003, 21, 1–12. [Google Scholar]
  51. Pfaffenbichler, P.; Emberger, G.; Shepherd, S. The Integrated Dynamic Land Use and Transport Model MARS. Netw. Spat. Econ. 2008, 8, 183–200. [Google Scholar] [CrossRef] [Green Version]
  52. Li, Y.; Liu, G.; Huan, C. Dynamic Changes Analysis and Hotspots Detection of Land Use in the Central Core Functional Area of Jing-Jin-Ji from 2000 to 2015 Based on Remote Sensing Data. Math. Probl. Eng. 2017, 2017, 1–16. [Google Scholar] [CrossRef]
  53. Campbell, J.B.; Wynne, R.H. Introduction to Remote Sensing, 5th ed.; Guilford Publications: New York, NY, USA, 2011; ISBN 9781609181772. [Google Scholar]
  54. Yildiz, S.; Doker, M.F. Monitoring Urban Growth by Using Segmentation-Classification of Multispectral Landsat Images in Izmit, Turkey. Environ. Monit. Assess. 2016, 188, 393. [Google Scholar] [CrossRef]
  55. Yang, Y.; Bao, W.; Liu, Y. Scenario Simulation of Land System Change in the Beijing-Tianjin-Hebei Region. Land Use Policy 2020, 96, 104677. [Google Scholar] [CrossRef]
  56. Cao, M.; Zhu, Y.; Quan, J.; Zhou, S.; Lü, G.; Chen, M.; Huang, M. Spatial Sequential Modeling and Predication of Global Land Use and Land Cover Changes by Integrating a Global Change Assessment Model and Cellular Automata. Earth’s Futur. 2019, 7, 1102–1116. [Google Scholar] [CrossRef] [Green Version]
  57. Daba, M.H.; You, S. Quantitatively Assessing the Future Land-Use/Land-Cover Changes and Their Driving Factors in the Upper Stream of the Awash River Based on the CA–Markov Model and Their Implications for Water Resources Management. Sustainability 2022, 14, 1538. [Google Scholar] [CrossRef]
  58. Butt, A.; Shabbir, R.; Ahmad, S.S.; Aziz, N. Land Use Change Mapping and Analysis Using Remote Sensing and GIS: A Case Study of Simly Watershed, Islamabad, Pakistan. Egypt. J. Remote Sens. Space Sci. 2015, 18, 251–259. [Google Scholar] [CrossRef] [Green Version]
  59. Verde, N.; Kokkoris, I.P.; Georgiadis, C.; Kaimaris, D.; Dimopoulos, P.; Mitsopoulos, I.; Mallinis, G. National Scale Land Cover Classification for Ecosystem Services Mapping and Assessment, Using Multitemporal Copernicus EO Data and Google Earth Engine. Remote Sens. 2020, 12, 3303. [Google Scholar] [CrossRef]
  60. Mishra, V.N.; Rai, P.K.; Prasad, R.; Punia, M.; Nistor, M.M. Prediction of Spatio-Temporal Land Use/Land Cover Dynamics in Rapidly Developing Varanasi District of Uttar Pradesh, India, Using Geospatial Approach: A Comparison of Hybrid Models. Appl. Geomatics 2018, 10, 257–276. [Google Scholar] [CrossRef]
  61. Atay Kaya, İ.; Kut Görgün, E. Land Use and Land Cover Change Monitoring in Bandırma (Turkey) Using Remote Sensing and Geographic Information Systems. Environ. Monit. Assess. 2020, 192, 430. [Google Scholar] [CrossRef]
  62. Bozkaya, A.G. İğneada Koruma Alanının Uzaktan Algılama ve Coğrafi Bilgi Sistemleri Ile Zamansan Değerlendirilmesi ve Geleceğe Yönelik Modellenmesi; İstanbul Teknik Üniversitesi: Maslak, Turkey, 2013. [Google Scholar]
  63. Moradi, F.; Kaboli, H.S.; Lashkarara, B. Projection of Future Land Use/Cover Change in the Izeh-Pyon Plain of Iran Using CA-Markov Model. Arab. J. Geosci. 2020, 13, 998. [Google Scholar] [CrossRef]
  64. Lv, J.; Wang, Y.; Liang, X.; Yao, Y.; Ma, T.; Guan, Q. Simulating Urban Expansion by Incorporating an Integrated Gravitational Field Model into a Demand-Driven Random Forest-Cellular Automata Model. Cities 2021, 109, 103044. [Google Scholar] [CrossRef]
Figure 1. Geographic location of research area. (a) Continent; (b) administrative division of Turkey; (c) Diyarbakır City.
Sustainability 14 09180 g001
Figure 2. Flowchart of the research.
Sustainability 14 09180 g002
Figure 3. The spatial distribution of land use/land cover (LULC). (a) 1984; (b) 2002; (c) 2020.
Sustainability 14 09180 g003
Figure 4. Gain, loss and net change distribution in LULC classes.
Sustainability 14 09180 g004
Figure 5. Areas gained, lost and unchanged in LULC classes.
Sustainability 14 09180 g005
Figure 6. Change detection in LULC Classes.
Sustainability 14 09180 g006
Figure 7. Trend analysis of the LULC classes.
Sustainability 14 09180 g007
Figure 8. Maps of the variables used for the simulation. (a) Digital elevation model (DEM); (b) slope; (c) distance to stream; (d) soil type; (e) distance to highways; (f) distance to streets; (g) distance to railway; (h) distance to built-up; (i) population density.
Sustainability 14 09180 g008
Figure 9. Simulated land use and land cover for 2020 and 2038. (a) Simulation for 2020; (b) 2020 simulation by protected status; (c) transition probability for 2020; (d) 2038 simulation; (e) 2038 simulation by protected status; (f) transition probability for 2038; (g) actual built-up for 2020; (h) actual built-up for 2020; (i) intersecting actual and simulation built-up.
Sustainability 14 09180 g009
Table 1. Satellite data used in research area.
Landsat
Images
Spatial
Resolution
BandsRangePath/RowAcquisition Date
Landsat 4–5 TM30 m1,2,3,40.48–0.84172/03422 July 1984
Landsat 7 ETM+30 m1,2,3,40.48–0.83172/03416 July 2002
Landsat 8 OLİ30 m2,3,4,50.44–0.86172/03425 July 2020
Table 2. LULC change statistics (km2).
198420022020
LULC Classeskm2%km2%km2%
Built-up (BP)232.1474.411010.2
İrrigated Agriculture (İA)17015.823521.816114.9
Dry Farming (DF)38635.838836.043340.1
Fallow Land (FL)215.320.0198.618.416215.0
Vineyards (VY)5.20.55.70.56.60.6
Urban Park (UP)0.30.030.70.12.40.2
Water Body (WB)8.20.8131.2141.3
Pasture/Bare (PB)27125.119117.719017.6
Total107910010791001079100
Table 3. Accuracy assessment of LULC classes (%).
1984BPİADFFLVYUPWBPB
Producer Accuracy97.294.497.384.596.585.797.294.9
User Accuracy99.692.193.993.967.51009994.4
Overall Accuracy93.7
Kappa Coefficient0.91
2002
Producer Accuracy97.598.897.290.510095.397.188.7
User Accuracy98.791.79988.710093.999.797.9
Overall Accuracy94.8
Kappa Coefficient0.93
2020
Producer Accuracy9799.198.495.997.182.197.885
User Accuracy96.397.297.488.679.671.197.588.6
Overall Accuracy95.6
Kappa Coefficient0.94
Table 4. Total and annual change of LULC classes.
Total Change (%)Annual Change (%)
LULC Classes1984–20022002–20201984–20201984–20022002–20201984–2020
Built-up51.157.379.12.83.24.4
İrrigated Agriculture27.7−46.0−5.61.5−2.5−0.3
Dry Farming0.510.410.90.020.60.6
Fallow Land−9.1−23.0−34.2−0.5−1.3−1.9
Vineyards10.513.622.70.50.71.3
Urban Park57.873.388.83.24.04.9
Water Body36.97.141.42.00.42.3
Pasture/Bare−41.9−0.5−46.6−2.3−0.02−2.4
Table 5. Transition matrix of LULC between 1984 to 2002.
PeriodFrom/toBuilt-upAgriculturePasture/BareWater BodyTotal Loss
1984–2002Built-up20.01.530.90.022.5
Agriculture19.4708.147.23.970.6
Pasture/Bare7.8118.2139.43.5129.5
Water Body0.0091.51.015.52.5
Total Gain27.2121.349.27.5205.7
Chi-square = 3,069,529.5, df = 16, p-Level = 0.000, Cramer’s V = 0.6773, Overall Kappa = 0.76
From/toBuilt-UpAgriculturePasture/BareWater BodyTotal Loss
2002–2020Built-up42.12.03.50.025.5
Agriculture46.6695.183.93.5133.9
Pasture/Bare23.971.291.22.197.2
Water Body0.080.93.28.84.1
Total Gain70.674.190.55.6240.8
Chi-square = 3,009,415.0, df = 16, p-Level = 0.000, Cramer’s V = 0.6707, Overall Kappa = 0.72
From/toBuilt-UpAgriculturePasture/BareWater BodyTotal Loss
1984–2020Built-Up19.71.11.50.022.7
Agriculture61.7642.169.15.4136.3
Pasture/Bare31.3124.2109.44.2159.8
Water Body0.041.12.24.73.4
Total Gain93.1126.572.89.7302.2
Chi-square = 2,398,673.2, df = 16, p-Level = 0.000, Cramer’s V = 0.5988, Overall Kappa = 0.67
Table 6. Simulation settings of LULC classes.
LULCBuilt-UpAgriculturePasture/BareWater Body
Cost MatrixBuilt-up1010
Agriculture1111
Pasture/Bare1111
Water Body0001
Weight of Neighborhood110.750.50
Table 7. Land use projection and accuracy analysis according to Markov chains method.
Year20022011202020382020–2038
LULCActualPredic.Accur.%ActualPredic.Accur.%ActualPredic.Accur.%Predic.Differ.%
Built-up47.553.788.399.67575.3112.6142.279.1137.8+22.3
Agriculture821.8828.899.1764.4823.892.4761.1720.894.4753.4−1.02
Pasture/Bare196.1182.192.8200.1182.791.2190.3200.494.9172.9−9.1
Water Body1313.894.414.31497.514.31595.714.3−0.2
Total1079107910010791079100107910791001079
Table 8. Kappa coefficient of simulation results.
2002Built-UpAgriculturePasture/BareWater Body
Producer Accuracy0.610.540.560.88
User Accuracy0.720.550.570.87
Overall Accuracy0.78
Kappa Coefficient0.65
2011
Producer Accuracy0.650.550.580.86
User Accuracy0.750.580.670.88
Overall Accuracy0.82
Kappa Coefficient0.75
2020
Producer Accuracy0.760.750.620.88
User Accuracy0.780.610.670.87
Overall Accuracy0.84
Kappa Coefficient0.77
Publisher’s Note: MDPI stays neutral with regard to jurisdictional claims in published maps and institutional affiliations.