Digital Economy, Financial Development, and Energy Poverty Based on Mediating Effects and a Spatial Autocorrelation Model
Abstract
:1. Introduction
2. Literature Review
3. Theoretical Analysis
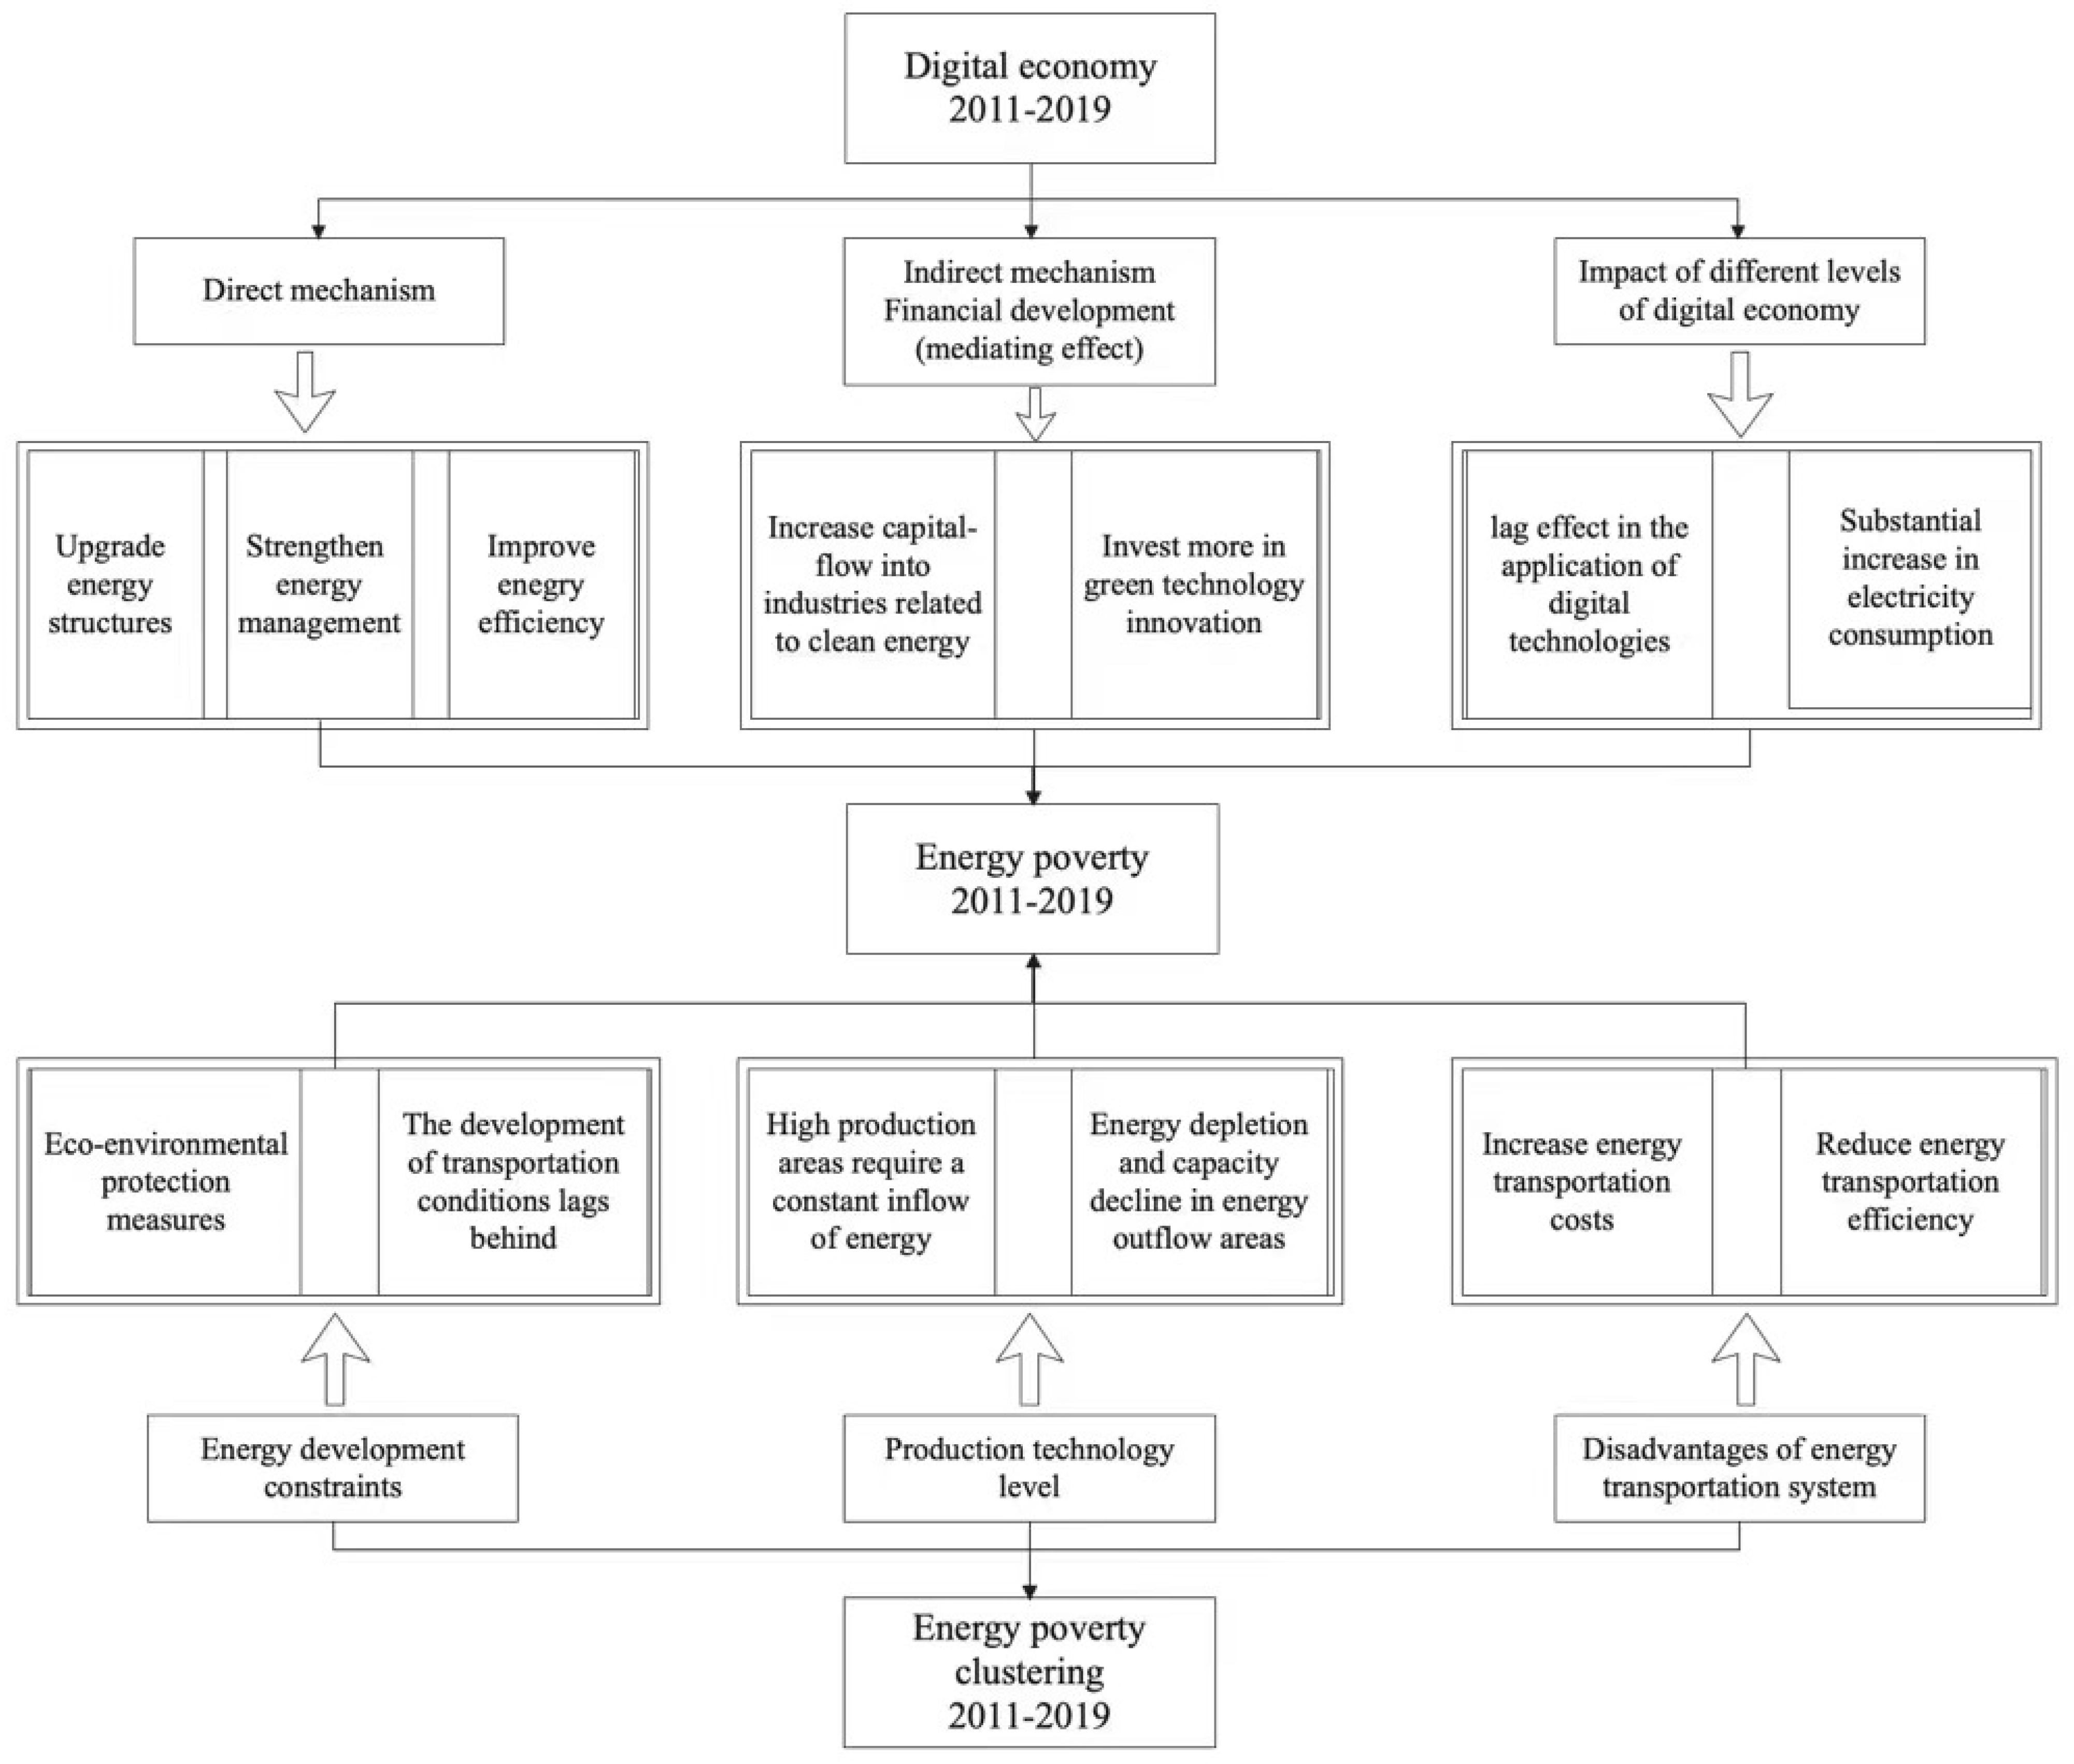
3.1. Direct Mechanism of Digital Economy Affecting Energy Poverty
3.2. Impact of Different Levels of Digital Economy Development on Energy Poverty
3.3. Indirect Mechanism of Digital Economy Affecting Energy Poverty
3.4. Spatial Clustering of Energy Poverty
4. Research Design and Description of Variables
4.1. Model Settings
4.2. Variable Description
4.2.1. Explained Variable: Energy Poverty Index (REPI)
4.2.2. Core Explanatory Variables: Digital Economy (DE)
4.2.3. Mediating Variable: Financial Development (FD)
4.2.4. Control Variables
4.2.5. Data Sources
5. Analysis of Empirical Results
5.1. Benchmark Regression
5.2. Mediation Effect
5.2.1. Full-Sample Regression Results
5.2.2. Regional Regression Results
5.3. Robustness Test
5.3.1. Adding Control Variables
5.3.2. Endogenous Test
6. Further Analysis
6.1. Spatial Autocorrelation Analysis of Energy Poverty
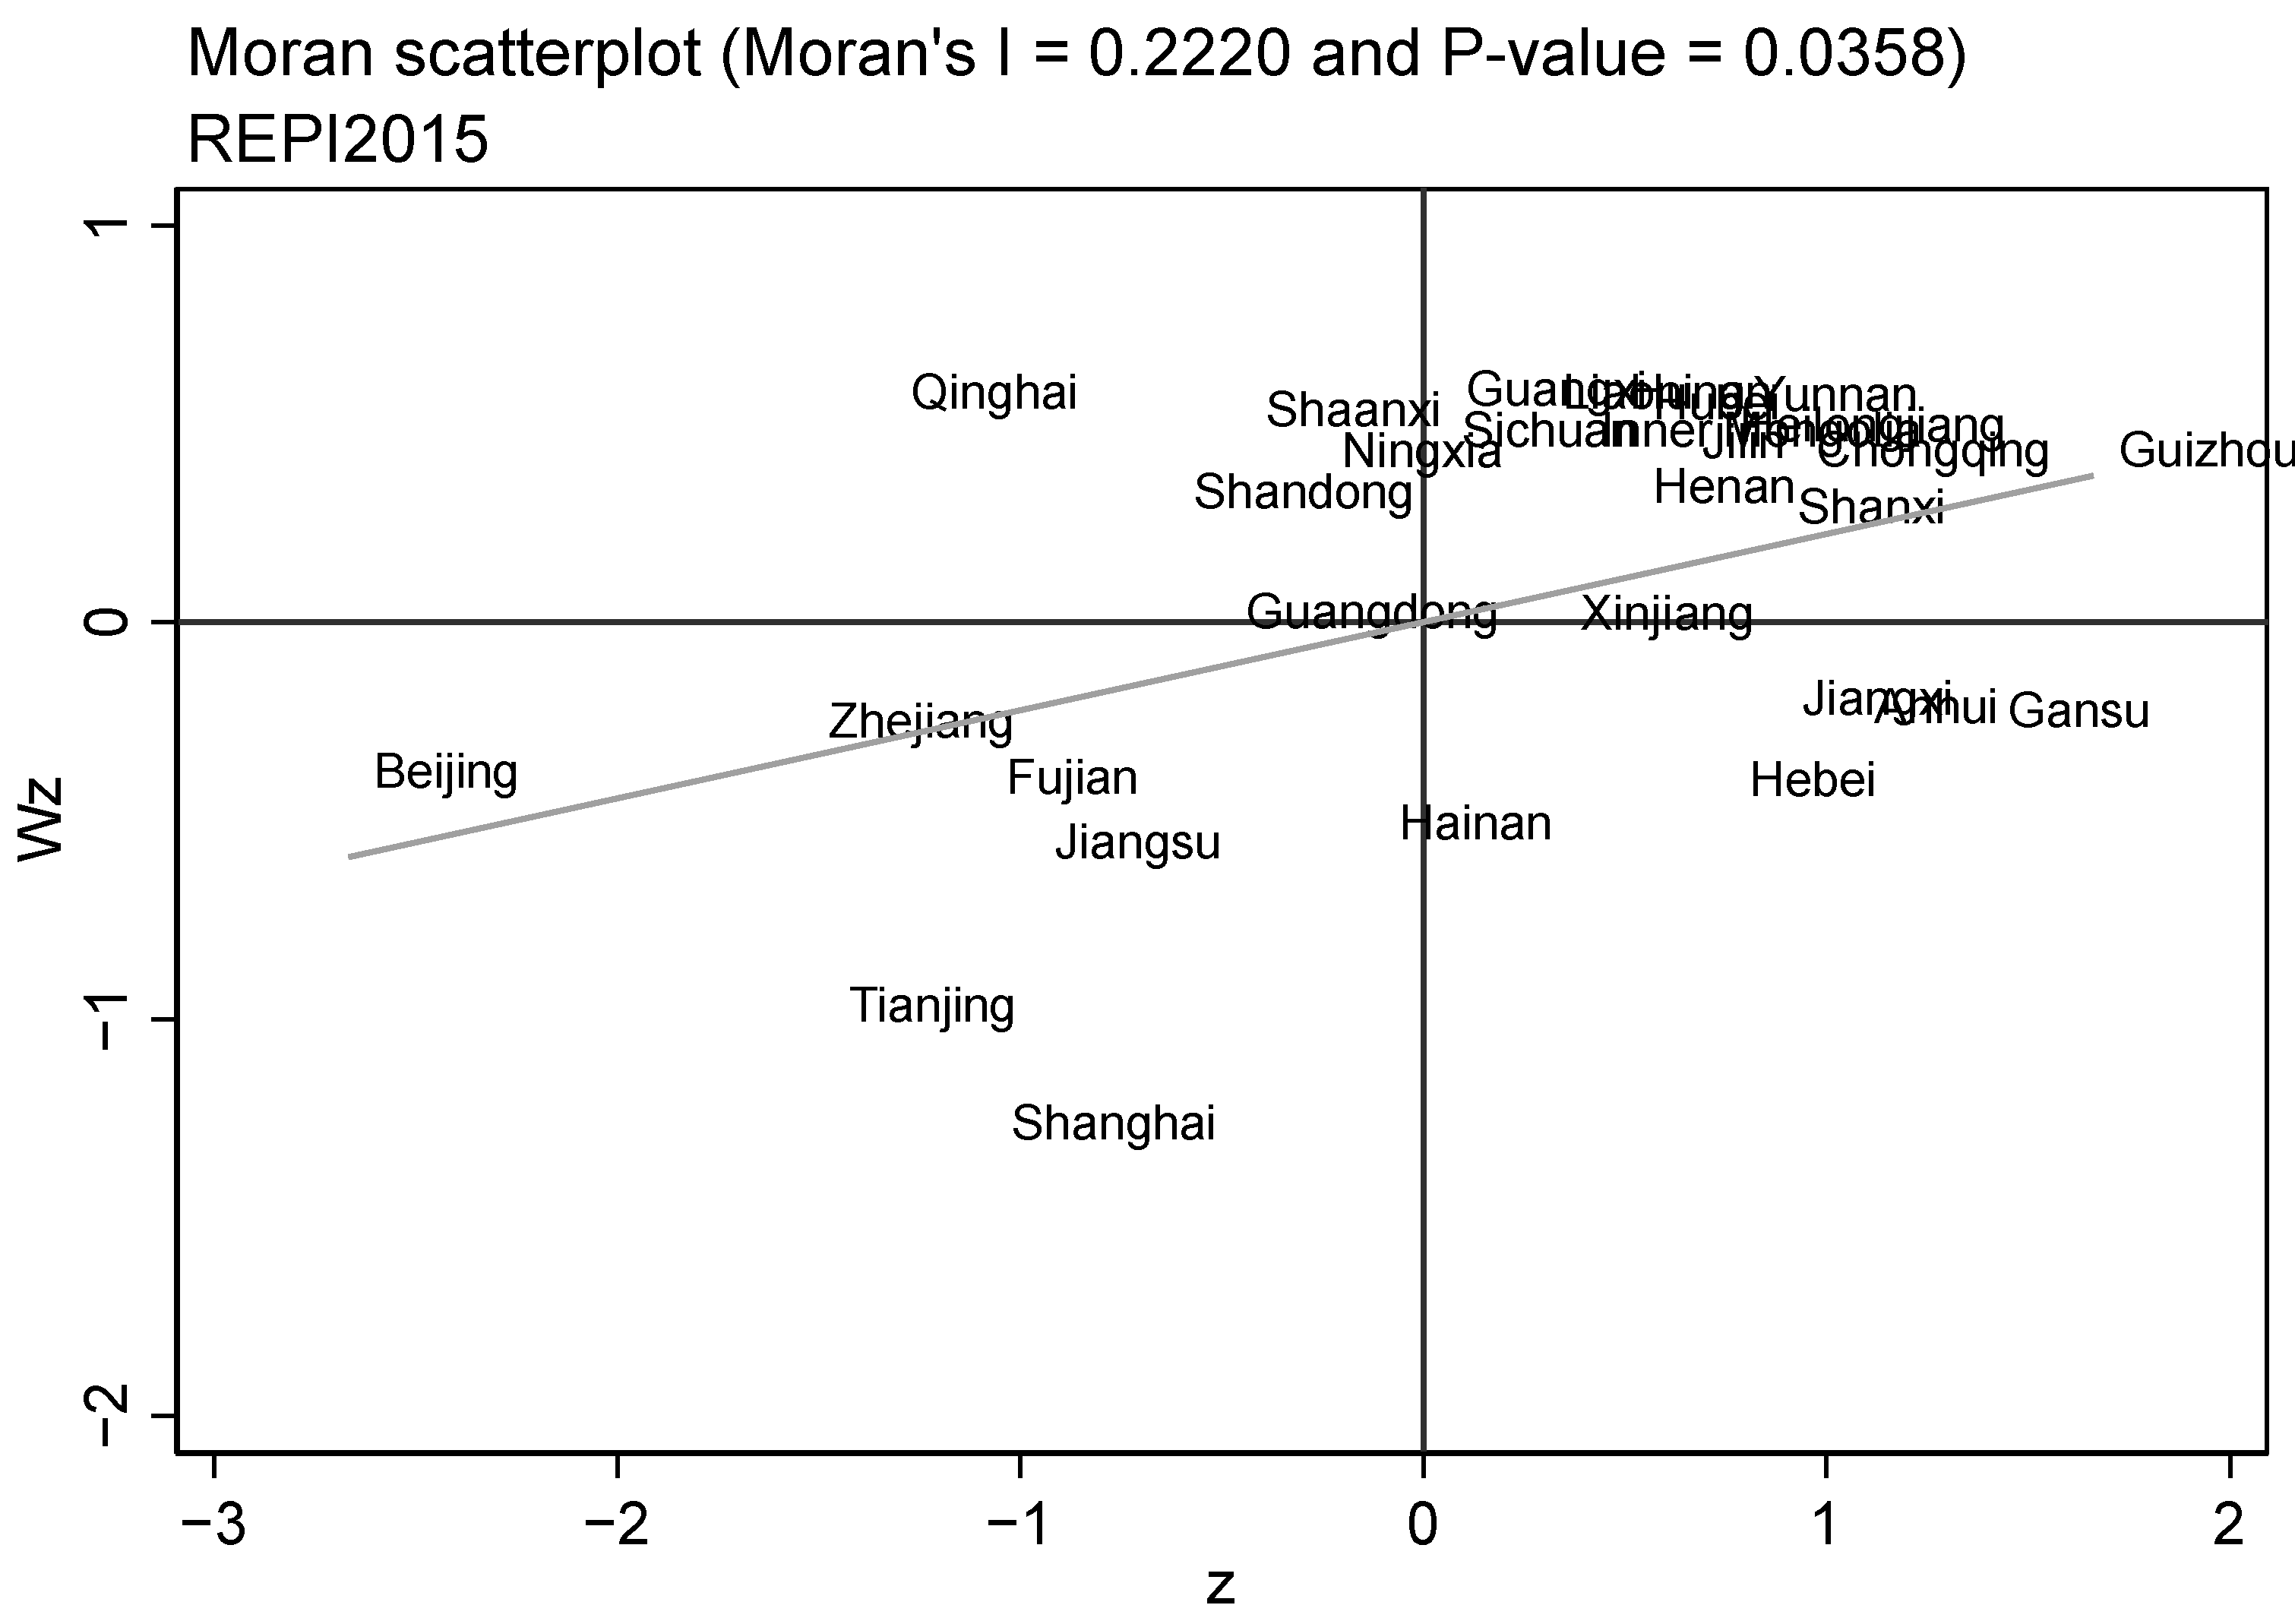
6.1.1. Global Spatial Autocorrelation Analysis
6.1.2. Local Spatial Autocorrelation Analysis
6.2. Heterogeneity Analysis
7. Conclusions and Recommendations
Author Contributions
Funding
Institutional Review Board Statement
Informed Consent Statement
Data Availability Statement
Conflicts of Interest
References
- Wu, H.; Hao, Y.; Weng, J.H. How does energy consumption affect China’s urbanization? new evidence from dynamic threshold panel models. Energy Policy 2019, 127, 24–38. [Google Scholar] [CrossRef]
- Hao, Y.; Gai, Z.; Wu, H. How do resource misallocation and government corruption affect green total factor energy efficiency? Evidence from China. Energy Policy 2020, 143, 111562. [Google Scholar] [CrossRef]
- Nie, P.; Li, Q.; Sousa-Poza, A. Energy poverty and subjective well-being in China: New evidence from the China Family Panel Studies. Energy Econ. 2021, 103, 105548. [Google Scholar] [CrossRef]
- Lin, B.; Wang, Y. Does energy poverty really exist in China? From the perspective of REPIdential electricity consumption. Energy Policy 2020, 143, 111557. [Google Scholar] [CrossRef]
- Wu, H.; Xu, L.; Ren, S.; Hao, Y.; Yan, G. How do energy consumption and environmental regulation affect carbon emissions in China? New evidence from a dynamic threshold panel model. Resour. Policy 2020, 67, 101678. [Google Scholar] [CrossRef]
- Wu, H.; Hao, Y.; Ren, S.; Yang, X.; Xie, G. Does Internet development improve green total factor energy efficiency? Evidence from China. Energy Policy 2021, 153, 112247. [Google Scholar] [CrossRef]
- Hao, Y.; Li, Y.; Guo, Y.; Chai, J.; Yang, C.; Wu, H. Digitalization and electricity consumption: Does internet development contribute to the reduction in electricity intensity in China? Energy Policy 2022, 164, 112912. [Google Scholar] [CrossRef]
- Ren, S.; Hao, Y.; Xu, L.; Wu, H.; Ba, N. Digitalization and energy: How does internet development affect China’s energy consumption? Energy Econ. 2021, 98, 105220. [Google Scholar] [CrossRef]
- Dasgupta, P.S.; Heal, G.M. Economic Theory and Exhaustible Resources; Cambridge University Press: Cambridge, UK, 1979. [Google Scholar]
- Solow, R.M. The economics of resources or the resources of economics. In Classic Papers in Natural Resource Economics; Palgrave Macmillan: London, UK, 1974; pp. 257–276. [Google Scholar]
- Stiglitz, J.E. Growth with Exhaustible Natural Resources: Efficient and Optimal Growth Paths. Rev. Econ. Stud. 1974, 41, 123–137. [Google Scholar] [CrossRef] [Green Version]
- Tapscott, D. The Digital Economy: Promise and Peril in the Age of Networked Intelligence; McGrawHill: New York, NY, USA, 1997. [Google Scholar]
- Xue, Y.; Tang, C.; Wu, H.; Liu, J.; Hao, Y. The emerging driving force of energy consumption in China: Does digital economy development matter? Energy Policy 2022, 165, 112997. [Google Scholar] [CrossRef]
- Cao, S.; Nie, L.; Sun, H.; Sun, W.; Taghizadeh-Hesary, F. Digital finance, green technological innovation and energy-environmental performance: Evidence from China’s regional economies. J. Clean. Prod. 2021, 327, 129458. [Google Scholar] [CrossRef]
- Feng, S.; Zhang, R.; Li, G. Environmental decentralization, digital finance and green technology innovation. Struct. Chang. Econ. Dyn. 2022, 61, 70–83. [Google Scholar] [CrossRef]
- Lange, S.; Pohl, J.; Santarius, T. Digitalization and energy consumption. Does ICT Reduce Energy Demand? Ecol. Econ. 2020, 176, 106760. [Google Scholar] [CrossRef]
- Siksnelyte-Butkiene, I.; Streimikiene, D.; Lekavicius, V.; Balezentis, T. Energy poverty indicators: A systematic literature review and comprehensive analysis of integrity. Sustain. Cities Soc. 2021, 67, 102756. [Google Scholar] [CrossRef]
- Adusah-Poku, F.; Takeuchi, K. Energy poverty in Ghana: Any progress so far? Renew. Sustain. Energy Rev. 2019, 112, 853–864. [Google Scholar] [CrossRef]
- Longhurst, N.; Hargreaves, T. Emotions and fuel poverty: The lived experience of social housing tenants in the United Kingdom. Energy Res. Soc. Sci. 2019, 56, 101207. [Google Scholar] [CrossRef]
- Scarpellini, S.; Hernández, M.A.S.; Moneva, J.M.; Portillo-Tarragona, P.; Rodríguez, M.E.L. Measurement of spatial socioeconomic impact of energy poverty. Energy Policy 2019, 124, 320–331. [Google Scholar] [CrossRef]
- Khanna, R.A.; Li, Y.; Mhaisalkar, S.; Kumar, M.; Liang, L.J. Comprehensive energy poverty index: Measuring energy poverty and identifying micro-level solutions in South and Southeast Asia. Energy Policy 2019, 132, 379–391. [Google Scholar] [CrossRef]
- Bonatz, N.; Guo, R.; Wu, W.; Liu, L. A comparative study of the interlinkages between energy poverty and low carbon development in China and Germany by developing an energy poverty index. Energy Build. 2019, 183, 817–831. [Google Scholar] [CrossRef]
- Li, W.; Chien, F.; Hsu, C.C.; Zhang, Y.; Nawaz, M.A.; Iqbal, S.; Mohsin, M. Nexus between energy poverty and energy efficiency: Estimating the long-run dynamics. Resour. Policy 2021, 72, 102063. [Google Scholar] [CrossRef]
- Sharma, S.V.; Han, P.; Sharma, V.K. Socio-economic determinants of energy poverty amongst Indian households: A case study of Mumbai. Energy Policy 2019, 132, 1184–1190. [Google Scholar] [CrossRef]
- Uche-Soria, M.; Rodríguez-Monroy, C. Energy planning and its relationship to energy poverty in decision making. A first approach for the Canary Islands. Energy Policy 2020, 140, 111423. [Google Scholar] [CrossRef]
- Halkos, G.E.; Gkampoura, E.C. Evaluating the effect of economic crisis on energy poverty in Europe. Renew. Sustain. Energy Rev. 2021, 144, 110981. [Google Scholar] [CrossRef]
- Nawaz, S. Energy poverty, climate shocks, and health deprivations. Energy Econ. 2021, 100, 105338. [Google Scholar] [CrossRef]
- Crentsil, A.O.; Asuman, D.; Fenny, A.P. Assessing the determinants and drivers of multidimensional energy poverty in Ghana. Energy Policy 2019, 133, 110884. [Google Scholar] [CrossRef]
- Tabata, T.; Tsai, P. Fuel poverty in Summer: An empirical analysis using microdata for Japan. Sci. Total Environ. 2020, 703, 135038. [Google Scholar] [CrossRef]
- Hargreaves, T.; Middlemiss, L. The importance of social relations in shaping energy demand. Nat. Energy 2020, 5, 195–201. [Google Scholar] [CrossRef]
- Boardman, B. Fuel Poverty: From Cold Homes to Affordable Warmth; Belhaven Press: London, UK, 1991. [Google Scholar]
- Hills, J. Fuel Poverty: The Problem and Its Measurement; Interim Report of the Fuel Poverty Review, CASE Reports; Centre for Analysis of Social Exclusion, LSE: London, UK, 2011. [Google Scholar]
- Belaïd, F. Exposure and risk to fuel poverty in France: Examining the extent of the fuel precariousness and its salient determinants. Energy Policy 2018, 114, 189–200. [Google Scholar] [CrossRef]
- Nussbaumer, P.; Bazilian, M.; Modi, V. Measuring energy poverty: Focusing on what matters. Renew. Sustain. Energy Rev. 2012, 16, 231–243. [Google Scholar] [CrossRef] [Green Version]
- Sadath, A.C.; Acharya, R.H. Assessing the extent and intensity of energy poverty using Multidimensional Energy Poverty Index: Empirical evidence from households in India. Energy Policy 2017, 102, 540–550. [Google Scholar] [CrossRef]
- Li, Y.; Yang, X.; Ran, Q.; Wu, H.; Irfan, M.; Ahmad, M. Energy structure, digital economy, and carbon emissions: Evidence from China. Environ. Sci. Pollut. Res. 2021, 28, 64606–64629. [Google Scholar] [CrossRef]
- Okushima, S. Gauging energy poverty: A multidimensional approach. Energy 2017, 137, 1159–1166. [Google Scholar] [CrossRef] [Green Version]
- Aristondo, O.; Onaindia, E. Counting energy poverty in Spain between 2004 and 2015. Energy Policy 2018, 113, 420–429. [Google Scholar] [CrossRef]
- Fylan, F.; Glew, D.; Smith, M.; Johnston, D.; Brooke-Peat, M.; Miles-Shenton, D.; Fletcher, M.; Aloise-Young, P.; Gorse, C. Reflections on retrofits: Overcoming barriers to energy efficiency among the fuel poor in the United Kingdom. Energy Res. Soc. Sci. 2016, 21, 190–198. [Google Scholar] [CrossRef]
- Zhao, J.; Jiang, Q.; Dong, X.; Dong, K. Assessing energy poverty and its effect on CO2 emissions: The case of China. Energy Econ. 2021, 97, 105191. [Google Scholar] [CrossRef]
- Dong, K.; Jiang, Q.; Shahbaz, M.; Zhao, J. Does low-carbon energy transition mitigate energy poverty? The case of natural gas for China. Energy Econ. 2021, 99, 105324. [Google Scholar] [CrossRef]
- Zhao, J.; Ding, K.; Dong, X.; Shahbaz, M. How renewable energy alleviate energy poverty? A global analysis. Renew. Energy 2022, 186, 299–311. [Google Scholar] [CrossRef]
- Koomson, I.; Danquah, M. Financial inclusion and energy poverty: Empirical evidence from Ghana. Energy Econ. 2021, 94, 105085. [Google Scholar] [CrossRef]
- Xu, Y.; Xu, L. Technological progress, energy poverty and inclusive green development in China. J. Dalian Univ. Technol. (Soc. Sci. Ed.) 2020, 41, 24–35. [Google Scholar] [CrossRef]
- Fortier, M.P.; Teron, L.; Reames, T.G.; Munardy, D.T.; Sullivan, B.M. Introduction to evaluating energy justice across the life cycle: A social life cycle assessment approach. Appl. Energy 2019, 236, 211–219. [Google Scholar] [CrossRef]
- Murshed, M. An empirical analysis of the non-linear impacts of ICT-trade openness on renewable energy transition, energy efficiency, clean cooking fuel access and environmental sustainability in South Asia. Environ. Sci. Pollut. Res. 2020, 27, 36254–36281. [Google Scholar] [CrossRef]
- Tang, C.; Xu, Y.; Hao, Y.; Wu, H.; Xue, Y. What is the role of telecommunications infrastructure construction in green technology innovation? A firm-level analysis for China. Energy Econ. 2021, 103, 105576. [Google Scholar] [CrossRef]
- Ma, Q.; Tariq, M.; Mahmood, H.; Khan, Z. The nexus between digital economy and carbon dioxide emissions in China: The moderating role of investments in research and development. Technol. Soc. 2022, 68, 101910. [Google Scholar] [CrossRef]
- Zhou, X.; Zhou, D.; Wang, Q. How does information and communication technology affect China’s energy intensity? A three-tier structural decomposition analysis. Energy 2018, 151, 748–759. [Google Scholar] [CrossRef]
- Ramsden, S. Tackling fuel poverty through household advice and support: Exploring the impacts of a charity-led project in a disadvantaged city in the United Kingdom. Energy Res. Soc. Sci. 2020, 70, 101786. [Google Scholar] [CrossRef]
- Avom, D.; Nkengfack, H.; Fotio, H.K.; Totouom, A. ICT and environmental quality in Sub-Saharan Africa: Effects and transmission channels. Technol. Forecast. Soc. Chang. 2020, 155, 120028. [Google Scholar] [CrossRef]
- Haas, R.; Ajanovic, A.; Ramsebner, J.; Perger, T.; Knápek, J.; Bleyl, J.W. Financing the future infrastructure of sustainable energy systems. Green Financ. 2021, 3, 90–118. [Google Scholar] [CrossRef]
- Tisdell, C.A. Renewable energy use and the renewable energy sector’s development: Public finance, environmental externalities and sustainability. Green Financ. 2019, 1, 156–173. [Google Scholar] [CrossRef]
- Krozer, Y. Financing of the global shift to renewable energy and energy efficiency. Green Financ. 2019, 1, 264–278. [Google Scholar] [CrossRef]
- Park, Y.; Meng, F.; Baloch, M.A. The effect of ICT, financial development, growth, and trade openness on CO2 emissions: An empirical analysis. Environ. Sci. Pollut. Res. 2018, 25, 30708–30719. [Google Scholar] [CrossRef]
- Durusu-Ciftci, D.; Soytas, U.; Nazlioglu, S. Financial development and energy consumption in emerging markets: Smooth structural shifts and causal linkages. Energy Econ. 2020, 87, 104729. [Google Scholar] [CrossRef]
- Cui, W.; Lu, B. A bi-objective approach to minimize makespan and energy consumption in flow shops with peak demand constraint. Sustainability 2020, 12, 4110. [Google Scholar] [CrossRef]
- Deng, Y.; Xu, L. Study on the regional characteristics and sustainable development of renewable energy development in western ethnic areas. Resour. Dev. Mark. 2018, 34, 17–22. [Google Scholar] [CrossRef]
- Zhang, S.; Meng, L.; Li, Y. The impact of spatial agglomeration of energy capacity on regional energy efficiency. China Popul.—Resour. Environ. 2021, 31, 58–66. [Google Scholar]
- Yao, X.; Kong, Q.B. China’s integrated energy transportation system and its macro impact. Financ. Stud. 2010, 4, 33–43. [Google Scholar]
- Wang, K.; Wang, Y.X.; Li, K.; Wei, Y.M. Energy poverty in China: An index based comprehensive evaluation. Renew. Sustain. Energy Rev. 2015, 47, 308–323. [Google Scholar] [CrossRef]
- Zhang, W.; Liu, X.; Wang, D.; Zhou, J. Digital economy and carbon emission performance: Evidence at China’s city level. Energy Policy 2022, 165, 112927. [Google Scholar] [CrossRef]
- Li, J.; Dai, C.; Lv, B.; Xu, A.; Zhang, J. The Meaning and Evaluation of High-quality Financial Development in the New Era: An Empirical Analysis Based on Provincial Panel Data. Financ. Regul. Res. 2019, 1, 15–30. [Google Scholar] [CrossRef]
- Zhu, J.; Huang, Z.; Li, Z.; Albitar, K. The Impact of Urbanization on Energy Intensity—An Empirical Study on OECD Countries. Green Financ. 2021, 3, 508–526. [Google Scholar] [CrossRef]
- Xu, X.; Hou, P.; Liu, Y. The impact of heterogeneous environmental regulations on the technology innovation of urban green energy: A study based on the panel threshold model. J. Green Financ. 2022, 1, 115–136. [Google Scholar] [CrossRef]
- He, X. Environmental Regulation and China’s Economic Growth Quality—An Empirical Analysis Based on Provincial Panel Data. Mod. Econ. Sci. 2018, 40, 124. [Google Scholar]
- Li, Z.; Bai, X. How does industrial policy promote green total factor productivity in manufacturing industry? Based on the synergistic perspective of encouraging policy and restrictive policy. Ind. Econ. Res. 2020, 6, 28–42. [Google Scholar] [CrossRef]
- Dubin, R.A. Spatial autocorrelation: A primer. J. Hous. Econ. 1998, 7, 304–327. [Google Scholar] [CrossRef]


| Energy poverty index | First-level indicator | Secondary indicator | Third-level indicator |
| Availability of energy services | Energy for life | Electricity consumption per capita | |
| Natural gas consumption per capita | |||
| Energy supply capacity | Urban gas penetration rate | ||
| Urban per capita natural gas supply | |||
| Cleanliness for daily use | Low-carbon energy structure | Proportion of clean energy power generation | |
| Energy structure modernization | Proportion of traditional biomass energy in total energy consumption | ||
| Energy management efficiency | Energy management infrastructure | Rural energy management extension institutions per million per capita | |
| Energy investment | Rural energy investment per capita | ||
| State-owned economy electricity, steam, hot water production, and supply per capita fixed assets | |||
| Living energy level | Living energy cost | Per capita electricity and fuel expenditure in cities and towns as a share of total income | |
| Per capita domestic fuel expenditure in rural areas as a percentage of total income | |||
| Energy consumption equipment | Number of range hoods owned by every 100 households in rural areas | ||
| Number of energy-saving coal stoves per 100 people in rural areas | |||
| Rural household biogas digester usage ratio | |||
| Health effects of energy pollution | Domestic sulfur dioxide emissions per capita | ||
| Domestic soot emissions per capita |
| Comprehensive Indicators | First-Level Indicator | Secondary Indicator | Nature |
|---|---|---|---|
| Digital economy | Digital infrastructure construction level | Total telecom business | + |
| Number of mobile phone users | + | ||
| Internet penetration rate | + | ||
| Digital industry development level | Output of information service industry | + | |
| Employment in information services industry | + | ||
| Information service business income | + | ||
| Digital technology innovation and scientific research level | R&D spending | + | |
| Total number of talents, with bachelor’s degree or above | + |
| Variable | N | Mean | S.D. | Min. | Max. |
|---|---|---|---|---|---|
| Energy poverty (REPI) | 270 | 0.4995 | 0.0873 | 0.2590 | 0.6870 |
| Digital economy (DE) | 270 | 0.2308 | 0.1132 | 0.0600 | 0.6200 |
| Financial development (FD) | 270 | 0.3246 | 0.0954 | 0.1780 | 0.6620 |
| Economic development (GDP) | 270 | 10.8098 | 0.4340 | 9.7058 | 12.0090 |
| Permanent REPIdent (RP) | 270 | 8.2042 | 0.7349 | 6.3424 | 9.3519 |
| Industrial structure (ISU) | 270 | 2.3591 | 0.1221 | 2.1660 | 2.8320 |
| Capital stock (PCS) | 270 | 10.5505 | 0.7605 | 8.2451 | 12.0693 |
| Urbanization rate (UR) | 270 | 0.5763 | 0.1217 | 0.3500 | 0.8960 |
| Environmental regulation (ER) | 270 | 0.4764 | 0.3504 | 0.0004 | 2.4100 |
| Variable | (1) | (2) | (3) | (4) | (5) |
|---|---|---|---|---|---|
| REPI | REPI | REPI | REPI | REPI | |
| DE | −0.4802 *** | −0.3019 *** | −0.2754 *** | ||
| (−4.61) | (−3.98) | (−3.23) | |||
| L.DE | −0.3871 *** | ||||
| (−4.40) | |||||
| H_DE×DE | −0.2855 *** | ||||
| (−3.59) | |||||
| L_DE×DE | −0.2263 ** | ||||
| (−2.48) | |||||
| GDP | −0.0985 *** | −0.0990 *** | −0.0903 ** | −0.0920 *** | |
| (−2.99) | (−3.11) | (−2.36) | (−2.97) | ||
| RP | −0.0821 | −0.0368 | −0.1477 | −0.1286 | |
| (−0.52) | (−0.21) | (−0.90) | (−0.75) | ||
| ISU | −0.0126 | −0.0094 | 0.0128 | −0.0238 | |
| (−0.21) | (−0.17) | (0.21) | (−0.42) | ||
| PCS | 0.1302 ** | 0.1292 ** | 0.1251 ** | 0.1567 *** | |
| (2.57) | (2.58) | (1.99) | (2.84) | ||
| UR | −0.3317 | ||||
| (−1.36) | |||||
| ER | 0.0108 | ||||
| (0.67) | |||||
| Constant | 0.6061 *** | 1.0070 | 0.6370 | 1.4524 | 1.2477 |
| (39.84) | (0.79) | (0.45) | (1.25) | (0.93) | |
| Time effect | YES | YES | YES | YES | YES |
| Individual effect | YES | YES | YES | YES | YES |
| N | 270 | 270 | 270 | 240 | 270 |
| AR2 | 0.567 | 0.618 | 0.624 | 0.604 | 0.627 |
| Variable | (1) | (2) | (3) |
|---|---|---|---|
| REPI | FD | REPI | |
| DE | −0.3019 *** | −0.3184 *** | −0.2140 ** |
| (−3.98) | (4.00) | (−2.41) | |
| FD | −0.2763 *** | ||
| (−3.08) | |||
| Control | YES | YES | YES |
| Constant | 1.0070 | 3.6149 *** | 2.0058 |
| (0.79) | (3.95) | (1.47) | |
| Time effect | YES | YES | YES |
| Individual effect | YES | YES | YES |
| N | 270 | 270 | 270 |
| R2 | 0.618 | 0.833 | 0.641 |
| Mediation effect | 95% confidence interval | Is it significant | |
| FD | −0.0458 | [−0.0788, | YES |
| (0.02) | −0.0187] |
| East | Central | West | ||||
|---|---|---|---|---|---|---|
| Variable | (1) | (2) | (3) | (4) | (5) | (6) |
| FD | REPI | FD | REPI | FD | REPI | |
| DE | 0.5497 *** | −0.2474 ** | 0.2126 | −0.5963 *** | 0.2164 ** | −0.2167 |
| (5.84) | (−2.37) | (0.68) | (−5.39) | (2.46) | (−1.27) | |
| FD | −0.2271 ** | −0.1703 | −0.4245 * | |||
| (−2.62) | (−1.08) | (−2.05) | ||||
| YES | YES | YES | YES | YES | YES | |
| Constant | 1.7451 | 0.3598 | −2.6014 | 6.4829 * | 3.9021 * | 8.0872 ** |
| (1.74) | (0.17) | (−0.53) | (2.11) | (−1.94) | (3.10) | |
| Time effect | YES | YES | YES | YES | YES | YES |
| Individual effect | YES | YES | YES | YES | YES | YES |
| N | 99 | 99 | 72 | 72 | 99 | 99 |
| AR2 | 0.796 | 0.744 | 0.895 | 0.743 | 0.895 | 0.631 |
| FD | Mediation Effect | 95% Confidence Interval | Significant |
|---|---|---|---|
| Eastern regions | −0.0510 | [−0.0991, −0.0136] | YES |
| (0.02) | |||
| Central regions | 0.0007 (0.13) | [−0.2339, 0.2717] | NO |
| Western regions | −0.0958 | [−0.2165, | NO |
| (0.05) | 0.0006] |
| Year | Moran’s I | E(I) | Sd(I) | z | p-Value |
|---|---|---|---|---|---|
| 2011 | 0.193 ** | −0.034 | 0.123 | 1.857 | 0.032 |
| 2012 | 0.105 | −0.034 | 0.120 | 1.160 | 0.123 |
| 2013 | 0.088 | −0.034 | 0.121 | 1.014 | 0.155 |
| 2014 | 0.154 * | −0.034 | 0.121 | 1.564 | 0.059 |
| 2015 | 0.222 ** | −0.034 | 0.122 | 2.100 | 0.018 |
| 2016 | 0.361 *** | −0.034 | 0.123 | 3.213 | 0.001 |
| 2017 | 0.276 *** | −0.034 | 0.124 | 2.500 | 0.006 |
| 2018 | 0.282 *** | −0.034 | 0.124 | 2.561 | 0.005 |
| 2019 | 0.263 *** | −0.034 | 0.123 | 2.414 | 0.008 |
| Variable | East | Central | West |
|---|---|---|---|
| (1) | (2) | (3) | |
| DE | −0.3722 ** | −0.6325 *** | −0.3086 |
| (−4.14) | (−4.06) | (−1.67) | |
| Control variable | YES | YES | YES |
| Constant | −0.0365 | 6.9260 * | 6.4307 * |
| (−0.02) | (1.96) | (2.22) | |
| Time effect | YES | YES | YES |
| Individual effect | YES | YES | YES |
| N | 99 | 72 | 99 |
| R2 | 0.723 | 0.736 | 0.607 |
Publisher’s Note: MDPI stays neutral with regard to jurisdictional claims in published maps and institutional affiliations. |
© 2022 by the authors. Licensee MDPI, Basel, Switzerland. This article is an open access article distributed under the terms and conditions of the Creative Commons Attribution (CC BY) license (https://creativecommons.org/licenses/by/4.0/).
Share and Cite
Qu, J.; Hao, X. Digital Economy, Financial Development, and Energy Poverty Based on Mediating Effects and a Spatial Autocorrelation Model. Sustainability 2022, 14, 9206. https://doi.org/10.3390/su14159206
Qu J, Hao X. Digital Economy, Financial Development, and Energy Poverty Based on Mediating Effects and a Spatial Autocorrelation Model. Sustainability. 2022; 14(15):9206. https://doi.org/10.3390/su14159206
Chicago/Turabian StyleQu, Junhong, and Xiaoli Hao. 2022. "Digital Economy, Financial Development, and Energy Poverty Based on Mediating Effects and a Spatial Autocorrelation Model" Sustainability 14, no. 15: 9206. https://doi.org/10.3390/su14159206
APA StyleQu, J., & Hao, X. (2022). Digital Economy, Financial Development, and Energy Poverty Based on Mediating Effects and a Spatial Autocorrelation Model. Sustainability, 14(15), 9206. https://doi.org/10.3390/su14159206


