Article

Study on Shape Characteristics of Plastic Zone in Heterogeneous Roadway-Surrounding Rock

1
School of Energy & Mining Engineering, China University of Mining and Technology (Beijing), Beijing 100083, China
2
School of Computer Science, North China Institute of Science and Technology, Langfang 065201, China
*
Authors to whom correspondence should be addressed.
Sustainability 2022, 14(15), 9480; https://doi.org/10.3390/su14159480
Submission received: 18 June 2022 / Revised: 29 July 2022 / Accepted: 29 July 2022 / Published: 2 August 2022

Abstract

:
Aiming at the surrounding rock failure of heterogeneous and unequal pressure circular roadways, the approximate analytical algorithm of the plastic zone is proposed. Through the comparison of analytical calculations and numerical simulation, the shape characteristics and evolution law of the surrounding rock’s plastic zone are studied, and the relative error of the two calculation methods is analyzed. The results show the following: (1) With an increase or decrease in the lateral pressure coefficient, the shape of the plastic zone of the roadway-surrounding rock presents a circular-ellipse-butterfly shape change law, and the outer edge of the plastic zone presents a scattered shape, without a continuous boundary. (2) In the butterfly-shaped plastic zone, the butterfly leaf always lies between the maximum confining pressure and the minimum confining pressure and rotates with the pressure. (3) There is a certain amount of error between the maximum value of the plastic zone solved by an analytical algorithm and numerical simulation, and the relative error is positively related to the burial depth and lateral pressure coefficient of the roadway and negatively related to the strength of the surrounding rock. (4) In addition, the relative error of the plastic zone calculation of the multi-layer heterogeneous combination roadway is larger than that of the single heterogeneous roadway.

1. Introduction

The deformation and failure of roadway-surrounding rock are essentially caused by the development of a plastic zone, and the shape characteristics of the plastic zone determine the failure mode and degree of the roadway [1,2,3]. It is one of the key problems that must be solved in engineering practice, using methods such as the stability analysis of surrounding rock, support design, and roof-fall disaster and rock-burst prevention and control, to master the shape characteristics of the plastic zone of roadway-surrounding rock [4,5,6]. Compared with the numerical simulation method, it is simpler and more efficient to use the analytical algorithm of the surrounding rock’s plastic zone to study the shape evolution characteristics of the plastic zone [7,8].
According to the different boundary stress conditions adopted in the mechanical model, the study of the surrounding rock’s plastic zone can be divided into two categories: Equal pressure and unequal pressure [9,10]. Under the conditions of equal pressure, scholars have used the Fenner equation (Fenner, 1938) or Kastner equation (Kastner, 1951) to study the boundary range of the surrounding rock’s plastic zone [11,12]. For unequal pressure conditions, most scholars use approximate analytical algorithms based on the elastic-plastic theory [13,14,15], and there is no accurate stress analytical solution at present. Zhao et al. [16,17] obtained the shape characteristics and distribution law of the surrounding rock’s plastic zone through the boundary equation of a homogeneous circular roadway, which is widely used to guide the stability control of a coal mine roadway [18,19,20,21]. Guo et al. put forward the analytical solution of the radius characteristics of the plastic zone of the surrounding rock and obtained the shape characteristics of the plastic zone under the conditions of equal pressure or unequal pressure [17,22]. These analytical algorithms have made important contributions to understanding the shape evolution characteristics of the homogeneous surrounding rock plastic zone. However, in the real rock mass environment, the shape characteristics and distribution law of the plastic zone of roadway-surrounding rock are inevitably different from such homogeneous surrounding rock [23,24]. At present, the research on heterogeneous rocks mainly focuses on the influence of mechanical parameters on the failure behavior of rocks. Specifically, Wang et al. studied the deformation behavior, damage accumulation, and progressive failure process of heterogeneous coal through FLAC3D and experiments [25], while Zhang et al. studied the influence of shale bedding on the stress–strain response, failure mode, and shear strength by establishing a heterogeneous numerical simulation model [26]. Furthermore, Jonak et al. studied the rock fracture process and its influencing factors using a numerical simulation method [27,28,29].
Through theoretical analysis, this paper creatively puts forward an analytical algorithm for calculating the plastic zone of the heterogeneous surrounding rock. Then, through the comparative calculation of an analytical algorithm and numerical simulation, the shape characteristics and evolution law of the surrounding rock’s plastic zone under equal and unequal pressure conditions are obtained. Finally, the errors of the two methods in calculating the plastic zone of the surrounding rock are discussed. The analytical algorithm proposed in this paper and the obtained plastic zone evolution law of heterogeneous surrounding rock are of great significance to the stability control of roadway-surrounding rock.

2. Analytical Algorithm for Plastic Zone of Surrounding Rock in Heterogeneous Circular Roadway

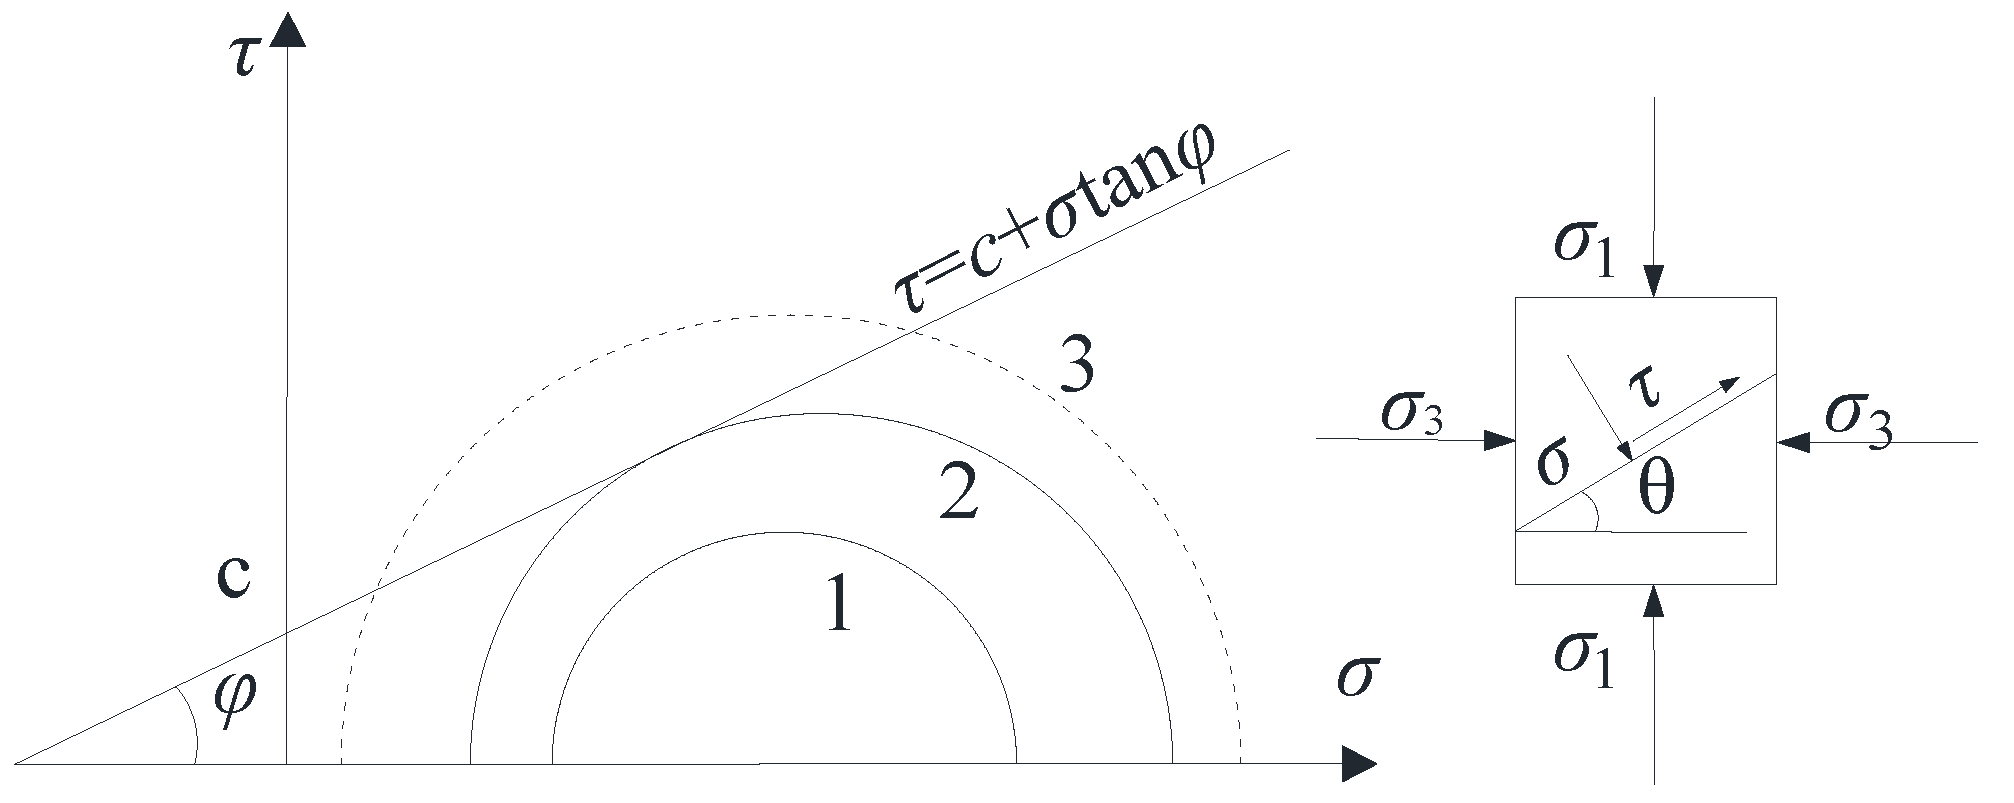
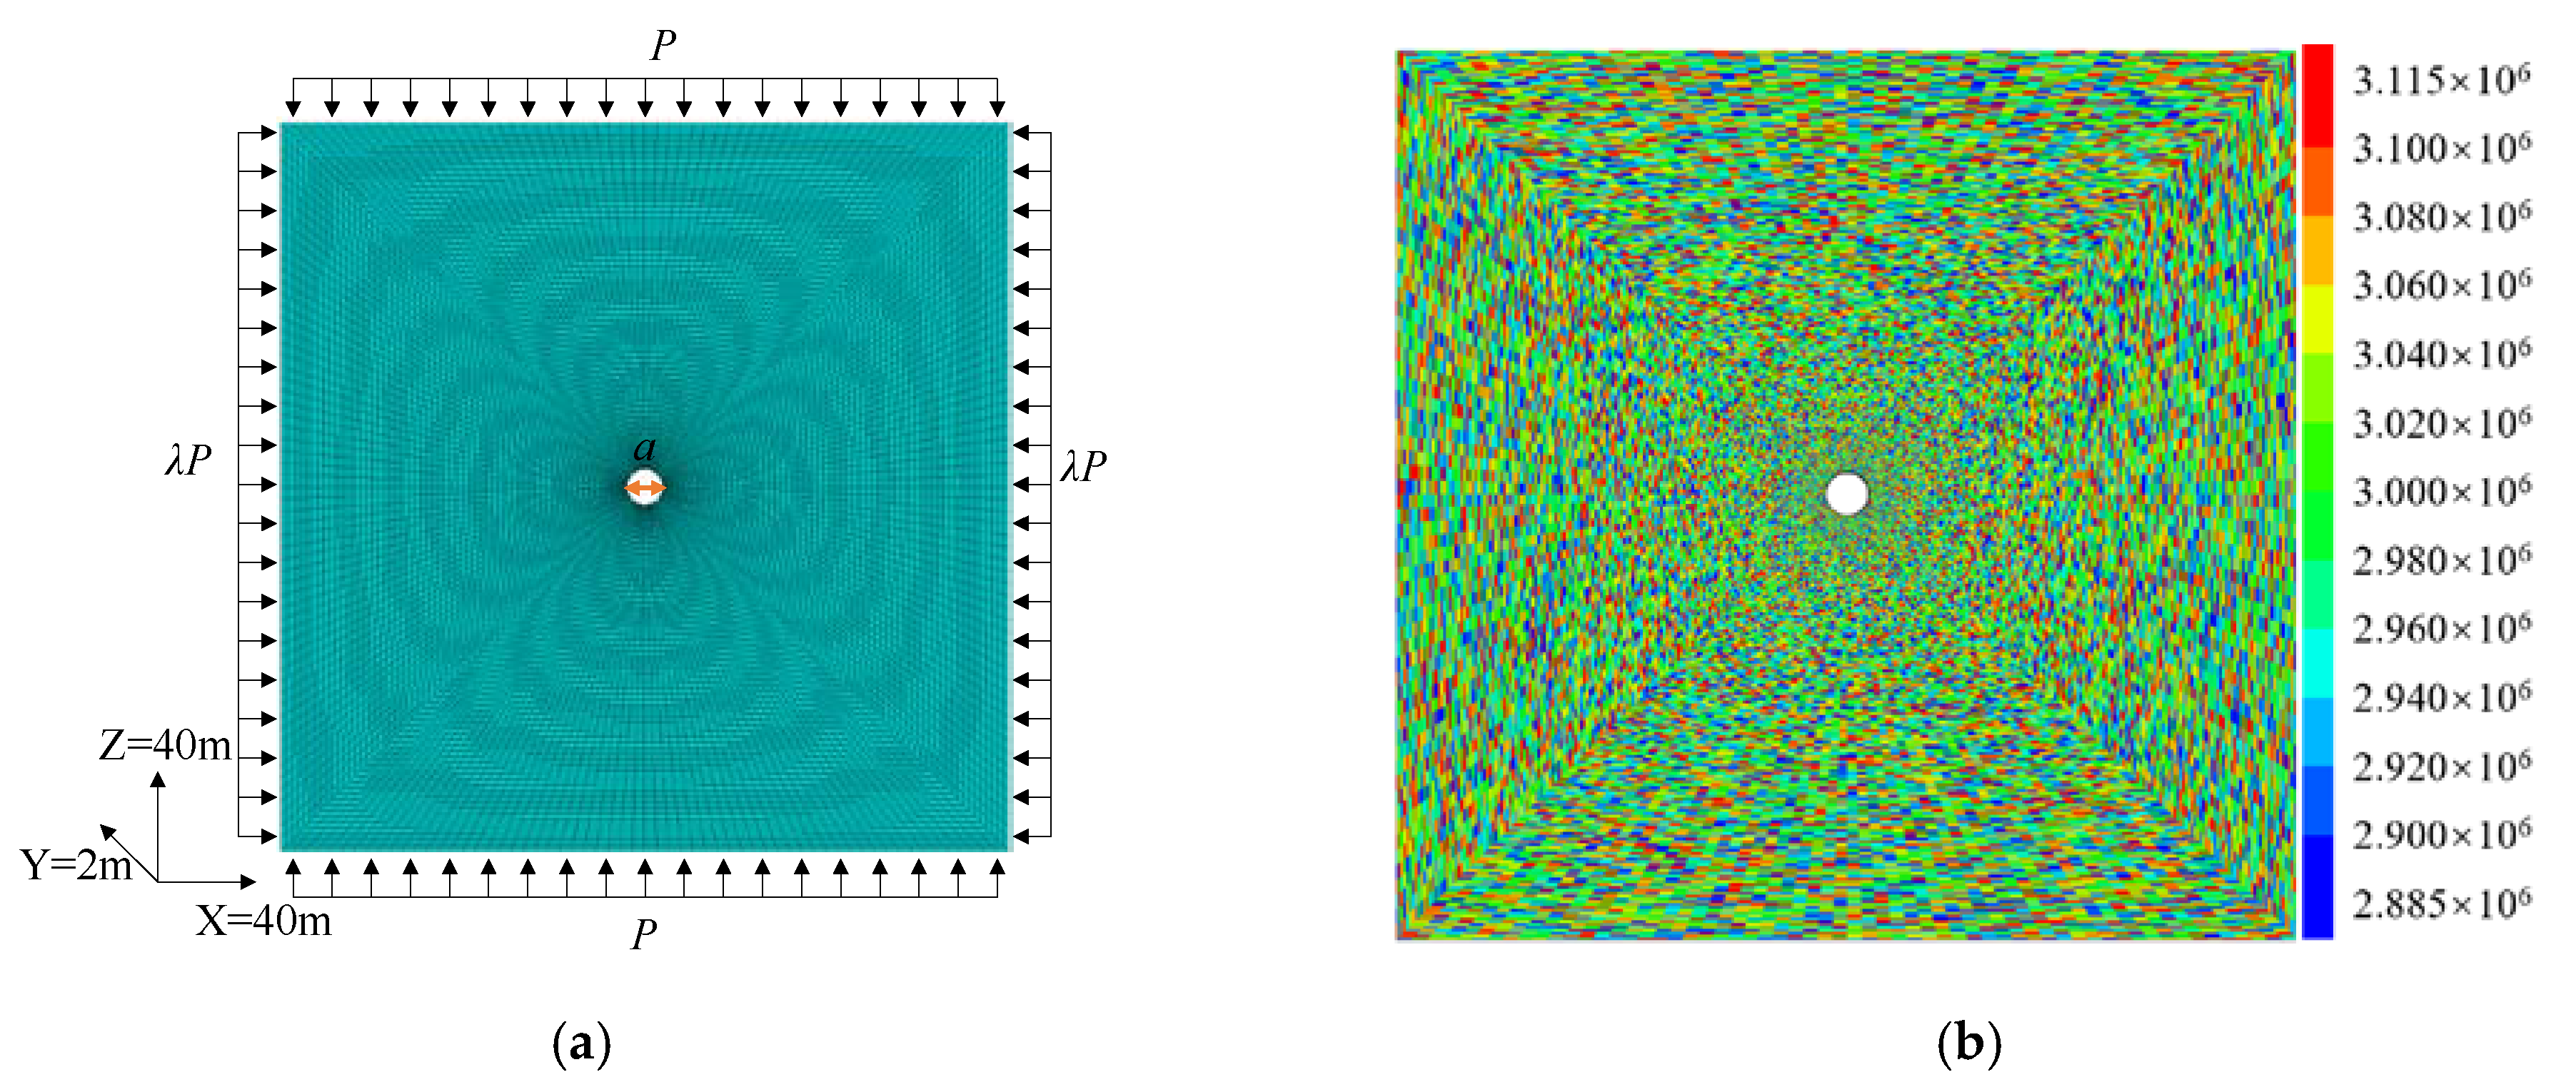
2.1. Elastic Mechanics of Surrounding Rock of General Circular Roadway

The general roadway model can be simplified as a plane hole in elastic-plastic mechanics [30]. According to the theory of elastic mechanics, when the medium satisfies the basic assumptions of being homogeneous, continuous, and isotropic, the stress state at any point of the surrounding rock of the roadway can be expressed by Equation (1).
{ σ r = P 2 [ ( 1 + λ ) ( 1 a 2 r 2 ) + ( λ 1 ) ( 1 4 a 2 r 2 + 3 a 4 r 4 ) cos 2 θ ] σ θ = P 2 [ ( 1 + λ ) ( 1 + a 2 r 2 ) ( λ 1 ) ( 1 + 3 a 4 r 4 ) cos 2 θ ] τ r θ = P 2 [ ( 1 λ ) ( 1 + 2 a 2 r 2 3 a 4 r 4 ) sin 2 θ ]
where σ r , σ θ , and τ r θ are the radial stress, circumferential stress, and shear stress at any point in the surrounding rock, (MPa); r, θ is the polar coordinate of any point; a is the radius of the roadway, (m); P is the minimum confining pressure, (MPa); λ is the ratio of the maximum confining pressure to the minimum confining pressure, which is called the lateral pressure coefficient.

2.2. Mechanical Model of Heterogeneous Circular Roadway Surrounding Rock

Figure 1 shows the mechanical model of heterogeneous surrounding rock in a circular roadway. It can be seen from Equation (1) that the equation does not contain any parameters related to the properties of the medium, which indicates that the stress distribution around the circular hole has nothing to do with the properties of the medium in the fully elastic state. This Equation can be used to analyze the stress around the hole in the heterogeneous surrounding rock. For this reason, the following assumptions are made: Firstly, it is assumed that the analytical Equation (1) of the stress distribution of the surrounding rock in an elastic state of an inhomogeneous medium is the same as in Equation (1); secondly, the formation of the plastic zone of the heterogeneous surrounding rock of the roadway is only related to the elastic stress state and mechanical parameters of the surrounding rock; in other words, whether any point of the roadway-surrounding rock is in a plastic state only depends on the stress state and mechanical parameters of the point, and has nothing to do with the formation process of the plastic state.

2.3. Shape of Plastic Zone in Surrounding Rock of Heterogeneous Circular Roadway

The Mohr–Coulomb criterion can be used to judge whether any point of the roadway-surrounding rock is in an elastic state or a plastic state, as shown in Equation (2) and Figure 2.
τ C ( i , j ) + σ tan ( φ ( i , j ) ) 0
where τ is the shear stress, (MPa); C ( i , j ) is the cohesive force at a certain point of the roadway-surrounding rock (MPa); σ is the normal stress (MPa); φ ( i , j ) is the friction angle of a certain point of the roadway-surrounding rock (°). It can be seen from Equation (2) that the plastic state of the surrounding rock medium is related to the mechanical parameters (cohesion and friction angle) of the surrounding rock medium at a certain point. When there is no intersection between the Mohr stress circle and the strength envelope (Mohr stress circle 1), the surrounding rock at point A is in an elastic state. If the Mohr stress circle is tangential to the strength envelope (Mohr stress circles 2 and 3), the surrounding rock at point A is in a state of plastic.
Since Equation (1) is the stress state at any point of the surrounding rock after excavation and Equation (2) is the strength envelope of the Mohr–Coulomb criterion, the implicit equation for judging whether the surrounding rock of the roadway is in a plastic state in a heterogeneous medium can be obtained by solving the two equations simultaneously (Equation (3)).
f ( a R ) = K 1 ( a R ) 8 + K 2 ( a R ) 6 + K 3 ( a R ) 4 + K 4 ( a R ) 2 + K 5 > 0
where
  • K 1 = 9 ( 1 λ ) 2
  • K 2 = 12 ( 1 λ ) 2 + 6 ( 1 λ 2 ) cos 2 θ
  • K 3 = 10 ( 1 λ ) 2 cos 2 2 θ 4 ( 1 λ ) 2 sin 2 ( φ ( i , j ) ) cos 2 2 θ 2 ( 1 λ ) 2 sin 2 2 θ 4 ( 1 λ 2 ) cos 2 θ + ( 1 + λ ) 2
  • K 4 = 4 ( 1 λ ) 2 cos 4 θ + 2 ( 1 λ 2 ) cos 2 θ 4 ( 1 λ 2 ) sin 2 ( φ ( i , j ) ) cos 2 θ 4 P ( 1 λ ) cos 2 θ sin ( 2 φ ( i , j ) ) C ( i , j )
  • K 5 = ( 1 λ ) 2 sin 2 ( φ ( i , j ) ) ( 1 + λ + 2 C ( i , j ) P cos ( φ ( i , j ) ) sin ( φ ( i , j ) ) ) 2
where a is the roadway radius, λ is the lateral pressure coefficient (the ratio of the maximum confining pressure to the minimum confining pressure), P is the minimum confining pressure, C ( i , j ) , φ ( i , j ) are the cohesive force and internal friction angle functions about a point coordinate, respectively, and R is the radial plastic zone boundary of the roadway-surrounding rock. It can be seen from Equation (3) that only the cohesion and internal friction angle are involved in the parameters of medium properties, that is, point A of the heterogeneous circular roadway-surrounding rock is elastic or plastic, which is only related to the cohesion and internal friction angle of the point, and has nothing to do with other medium properties of the point.

3. Shape Characteristics and Evolution Law of Plastic Zone

Based on the analytical solution (Equation (3)), the shape of the plastic zone of the surrounding rock of the roadway under specified conditions is drawn by MATLAB programming. Because the only mechanical parameters related to the heterogeneous rock mass medium in the analytical algorithm are cohesion and internal friction angle, only cohesion and the internal friction angle are selected within a certain range in the application of the analytical algorithm and FLAC3D numerical simulation calculation (they obey uniform distribution), and other mechanical parameters are fixed. The rock’s mechanical parameters used for numerical calculation and analytical calculation are shown in Table 1.

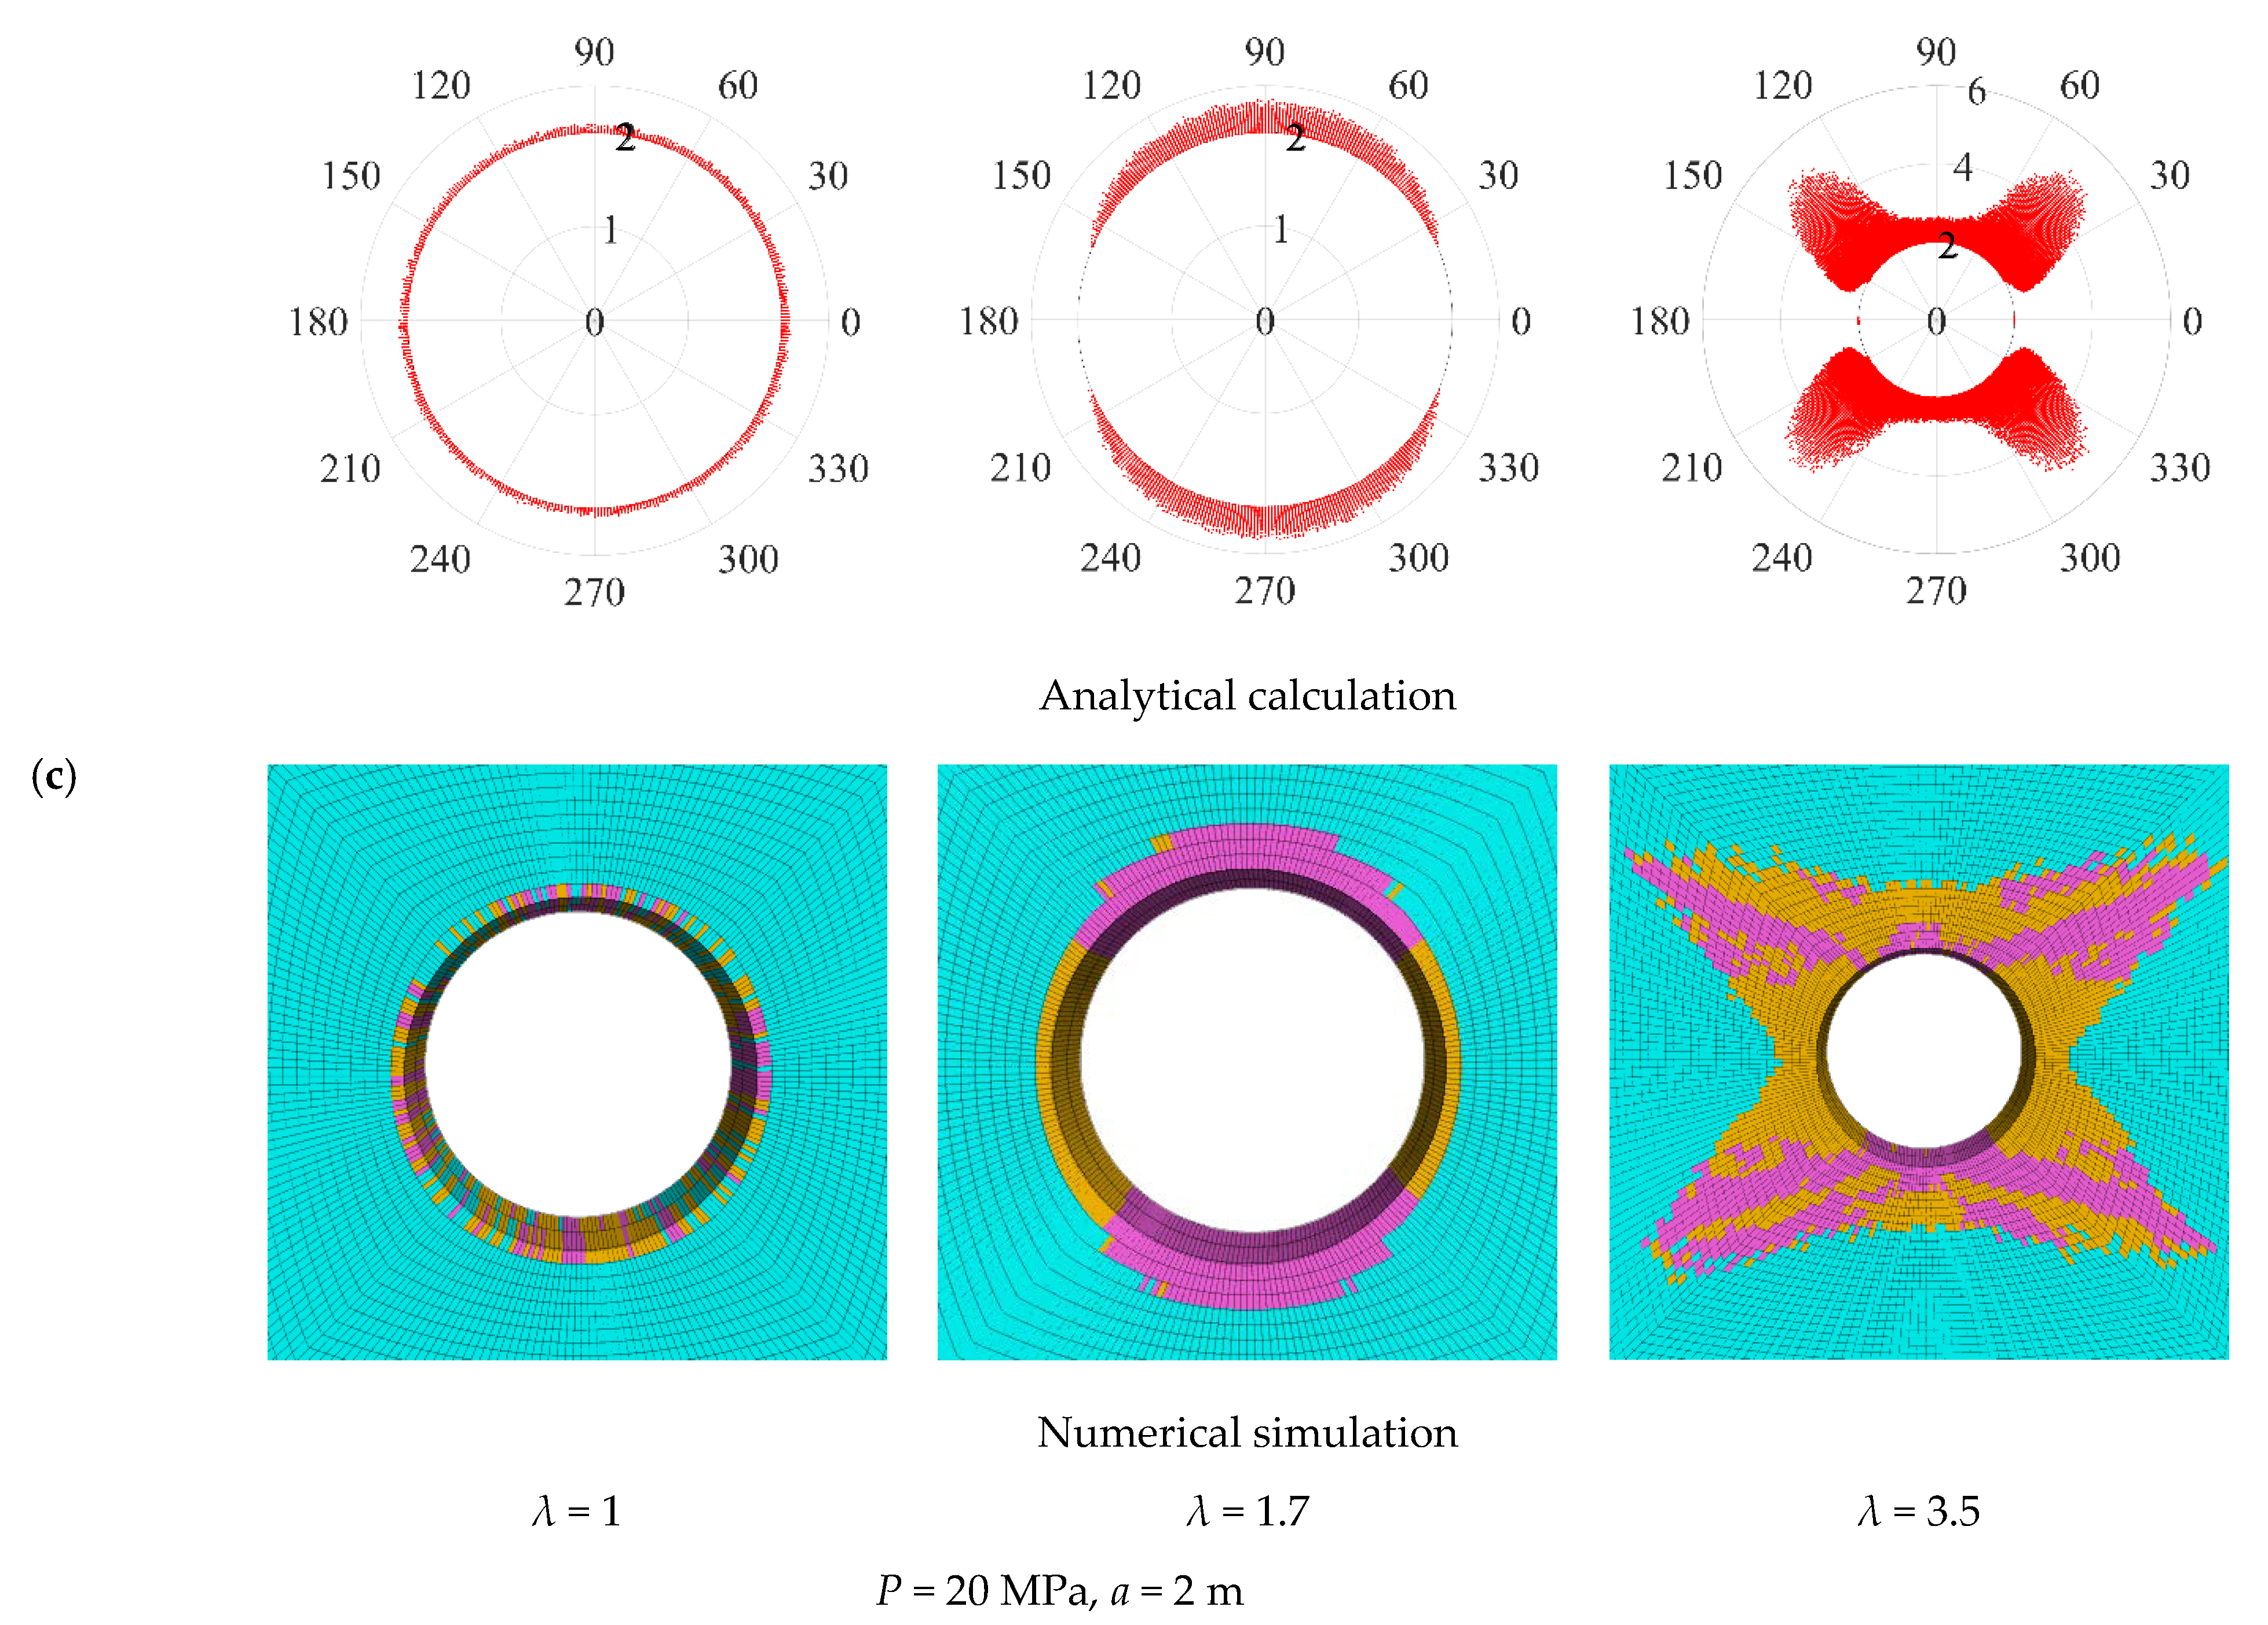
3.1. Shape Characteristics of Plastic Zone in Surrounding Rock of Single-Layer Heterogeneous Roadway

When the size of a rock layer is large enough, the plastic zone of the surrounding rock of the roadway is usually in a single layer. In order to simplify the problem, it is assumed that the particles in the layered structure are uniform in size and distribution. The numerical calculation of FLAC3D adopts the Mohr–Coulomb constitutive model, which is consistent with the analytical calculation. In the model, X × Y × Z = 40 m × 2 m × 40 m, as shown in Figure 3a. The total number of zones and gridpoints is 120,000 and 180,720, respectively. Figure 3b is the result of the random assignment of the cohesion of zone elements in the FLAC3D single-layer Coal model.
The shape of the plastic zone of single-layer heterogeneous coal, mudstone, and sandy mudstone under different lateral pressure coefficients, calculated by an analytical algorithm and FLAC3D numerical simulation, is shown in Figure 4. It can be seen that with the increase in the lateral pressure coefficient, the range of the plastic zone is gradually expanded, and the shape of the plastic zone obtained by the two methods shows a change from circular to ellipse to butterfly, which indicates that the plastic zone shape obtained by the two methods is similar. It can also be seen from the figure that there is an irregular serrated shape at the outermost edge of the plastic zone. When the plastic zone of the surrounding rock changes from an ellipse to a butterfly shape, there is no continuous boundary in the plastic zone, and the plastic zone and non-plastic zone crisscross each other. In the analytical calculation and numerical simulation, the outer edge of the plastic zone presents the characteristics of the scattered distribution. The cohesive force, friction angle, and strength of mudstone and sandy mudstone are larger than those of coal, so the scope of the plastic zone of mudstone and sandy mudstone is smaller than that of coal, but the shape and characteristics of the plastic zone of the three rock masses are highly consistent.

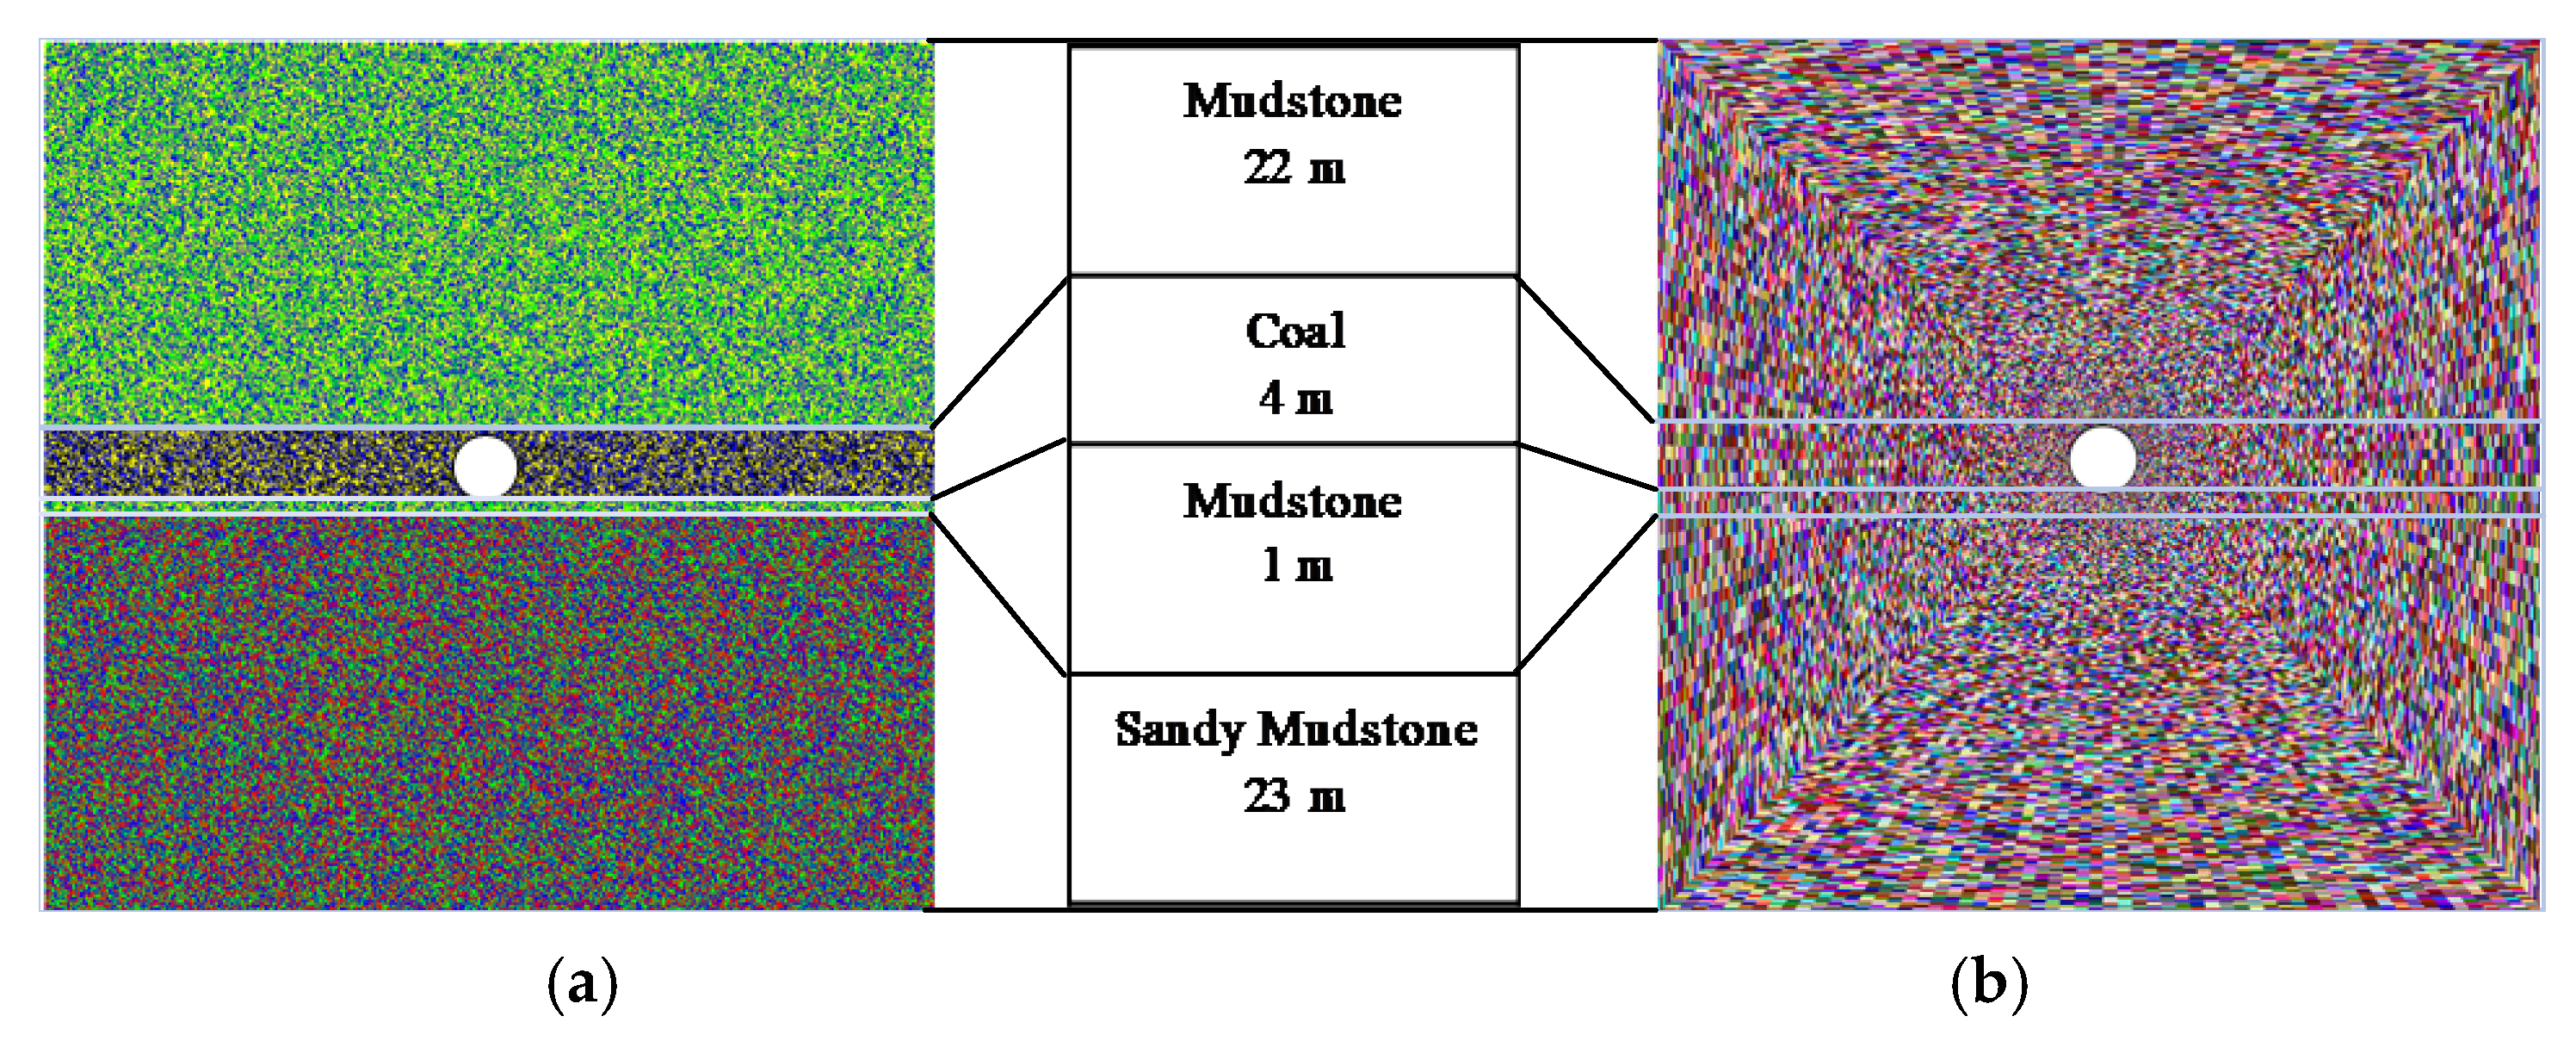
3.2. Shape Characteristics of Plastic Zone in Surrounding Rock of Multi-Layer Heterogeneous Composite Roadway

When the plastic zone of the roadway is large, it usually crosses multiple strata. In this case, the influence of multiple strata combinations should be considered to analyze the shape of the plastic zone of roadway-surrounding rock. Without considering the sequence of strata combination, the plastic zone shape of a multi-layered heterogeneous rock mass under different lateral pressure coefficients is obtained by using the calculation model shown in Figure 5 and comparing the analytical calculation and numerical simulation. In each rock stratum, the random selection of the cohesion and friction angle follows a uniform distribution, and the value range is shown in Table 1. For the numerical calculation, the model size, boundary conditions, and loading method are shown in Figure 3a.
It can be seen from Figure 6 that in a multilayer heterogeneous rock mass medium, regardless of whether in the analytical calculation or numerical simulation, the shape of the plastic zone of the surrounding rock of a roadway can be regarded as the combination of the plastic zone shape of single heterogeneous rock under the same conditions, and the shape of the plastic zone changes from circular to ellipse to butterfly, because the cohesion, friction angle, and strength of mudstone and sandy mudstone are larger than coal. When the lateral pressure coefficient is 2.5, only the plastic zone in the coal seam becomes butterfly-shaped. With the increase in the lateral pressure coefficient, the plastic zone and non-plastic zone crisscross each other, the plastic zone cannot be clearly defined, and the outer edge of the plastic zone also changes from serrated to scattered.

3.3. Directional Characteristics of Butterfly Shaped Plastic Zone

According to the mechanical model shown in Figure 1, specifying the stress state of point A (R, θ), when the angle between the maximum confining pressure and the horizontal direction is α, then the stress state corresponding to point A is also transferred to point B (R, θ + α). Assume θ1 = θ + α, that θ = θ1 − α. If we take (R, θ1 − α) into Equation (1) and combine Equation (2), then the shape equation of the plastic zone of the roadway-surrounding rock with different rotation angles (α) can be obtained (Equation (4)).
f ( a R ) = K 1 ( a R ) 8 + K 2 ( a R ) 6 + K 3 ( a R ) 4 + K 4 ( a R ) 2 + K 5 > 0
  • K 1 = 9 ( 1 λ ) 2
  • K 2 = 12 ( 1 λ ) 2 + 6 ( 1 λ 2 ) cos ( 2 ( θ 1 α ) )
  • K 3 = 10 ( 1 λ ) 2 cos 2 ( 2 ( θ 1 α ) ) 4 ( 1 λ ) 2 sin 2 ( φ ( i , j ) ) cos 2 ( 2 ( θ 1 α ) ) 2 ( 1 λ ) 2 sin 2 ( 2 ( θ 1 α ) ) 4 ( 1 λ 2 ) cos ( 2 ( θ 1 α ) ) + ( 1 + λ ) 2
  • K 4 = 4 ( 1 λ ) 2 cos ( 4 ( θ 1 α ) ) + 2 ( 1 λ 2 ) cos ( 2 ( θ 1 α ) ) 4 ( 1 λ 2 ) sin 2 ( φ ( i , j ) ) cos ( 2 ( θ 1 α ) ) 4 P ( 1 λ ) cos ( 2 ( θ 1 α ) ) sin ( 2 φ ( i , j ) ) C ( i , j )
  • K 5 = ( 1 λ ) 2 sin 2 ( φ ( i , j ) ) ( 1 + λ + 2 C ( i , j ) P cos ( φ ( i , j ) ) sin ( φ ( i , j ) ) ) 2
According to Equation (4), when the maximum confining pressure deflects the α angle (α = 0°/30°/60°/90°), the shape and direction characteristics of the plastic zone of the surrounding rock are shown in Figure 7. It can be seen that when the direction of the maximum confining pressure deflects, the shape of the plastic zone of the surrounding rock of the roadway also deflects, but the butterfly leaf of the plastic zone is always between the maximum confining pressure and the minimum confining pressure.

3.4. Shape Evolution of Plastic Zone

Taking coal as the research medium, according to Equation (3), the plastic zone maximum radius and the shape of the plastic zone of roadway-surrounding rock under different lateral pressure coefficients are obtained, as shown in Figure 8. As can be seen, when λ = 1, the plastic zone is standard circular. With the increase or decrease in the lateral pressure co-efficient λ, the shape of the plastic zone changes from circular to ellipse and butterfly. The difference is that when the lateral pressure coefficient decreases gradually (0 < λ < 1), the plastic zone gradually becomes a vertical butterfly. When the coefficient of lateral pressure increases gradually (λ > 1), the plastic zone gradually changed into a horizontal butterfly.
In addition, it can be seen from the curve in Figure 8 that the plastic zone ranges of the butterfly-shaped plastic zone are particularly sensitive to a change in the lateral pressure coefficient. When the plastic zone of the roadway-surrounding rock changes to become butterfly-shaped, a small change in the lateral pressure coefficient will cause the sharp expansion of the plastic zone, and then cause the large-scale failure of the roadway-surrounding rock.

4. Error Analysis of Analytical Algorithm

Because the analytical solution of Equation (3) has two basic assumptions that are different from the actual situation, the calculation result can only be an approximate solution of the plastic zone distribution of the surrounding rock of the heterogeneous circular roadway. In order to analyze the relative error between the analytical algorithm and the numerical simulation, the center of the roadway is taken as the circle center, and the maximum plastic state point of the surrounding rock is taken as the radius of the circumscribed circle. The radius of the circumscribed circle is the boundary of the plastic zone in the error analysis (as shown in Figure 9). The physical and mechanical parameters of each lithology in the calculation process are shown in Table 1.

4.1. Error Analysis of Plastic Zone Boundary of Single Layer Heterogeneous Surrounding Rock

4.1.1. Error Analysis of Plastic Zone Boundary under Isobaric Condition

Under the condition of bi-directional equal pressure (λ = 1), the statistical results of the plastic zone boundary obtained by applying the analytical algorithm and numerical simulation calculation for three kinds of heterogeneous surrounding rock at different depths are shown in Figure 10.
It can be seen from Figure 10 that the calculation result obtained by the analytical algorithm is smaller than that by numerical simulation. With the increase in the roadway burial depth, the boundary of the plastic zone continuously increases. The boundary of the plastic zone calculated by numerical simulation increases almost linearly with the increase in the burial depth, while the boundary of the plastic zone obtained by the analytical algorithm increases relatively slightly with the increase in the burial depth. The relative error of the two methods increases with the increase in the burial depth, that is, the relative error is positively correlated with the burial depth. Under the same burial depth, comparing the three kinds of surrounding rock with different strengths in Figure 10a–c, it can be seen that the relative error of the two calculation methods decreases with the increase in the surrounding rock strength, and its relative error is negatively correlated with the strength of the surrounding rock.

4.1.2. Error Analysis of Plastic Zone Boundary under Non-Isobaric Conditions

Under the condition of bi-directional unequal pressure (λ ≠ 1), the statistical results of the analytical calculation and numerical simulation of the plastic zone boundary of the single heterogeneous surrounding rock are shown in Figure 11. It can be seen from Figure 11 that with the increase in the lateral pressure coefficient, the boundary of the plastic zone increases gradually. When the plastic zone is elliptical, the increase in the boundary of the plastic zone is small. At this time, although the relative error between the analytical algorithm and numerical simulation has an upward trend, the change is not large. When the shape of the plastic zone changes to a butterfly shape, the boundary of the plastic zone begins to increase greatly with the increase in the lateral pressure coefficient, and the relative error of the two calculation methods also increases. On the whole, the relative error of the two calculation methods is positively correlated with the lateral pressure coefficient. When λ = 2.1, the shape of the plastic zone begins to transform from an ellipse into a butterfly, and the maximum value of the plastic zone boundary also transfers from the vertical direction of the ellipse to the shoulders and two bottoms of the roadway. At this time, the plastic zone boundary increases slightly, and the relative error of the two calculation methods is approximately 26.8%. When λ is 2.4 and 2.7, respectively, the shape of the plastic zone shows an obvious butterfly shape, and the boundary of the plastic zone begins to expand rapidly along the butterfly leaf. It is worth noting that when λ is 2.7, the boundary ranges of the plastic zone obtained by the analytical calculation are larger than that of numerical simulation, and the relative error of the two methods is also reduced.
Similarly, for mudstone and sandy mudstone (as shown in Figure 11b,c), the variation law of relative error of the two calculation methods with a lateral pressure coefficient is basically consistent with that of coal, but because the strength of the surrounding rock increases gradually, the relative error of the two calculation methods decreases gradually with the same lateral pressure coefficient, and the relative error is negatively correlated with the strength of the surrounding rock.

4.2. Error Analysis of Plastic Zone Boundary of Multi-Layer Heterogeneous Composite Surrounding Rock

Without considering the change in strata combination, the relative error of the plastic zone boundary between the analytical algorithm and numerical simulation is analyzed. The rock combination and rock mechanics parameters adopted by the two calculation methods are shown in Figure 5 and Table 1.

4.2.1. Error Analysis of Plastic Zone Boundary under Isobaric Condition

Figure 12 shows the statistical results of the plastic zone boundary of a multi-layer heterogeneous composite roadway under the conditions of equal pressure using an analytical algorithm and numerical simulation. It can be seen from Figure 12 that with the increase in burial depth, the plastic zone boundary calculated by the two methods gradually increases. In contrast, the plastic zone boundary calculated by the analytical algorithm increases slowly, and the numerical simulation increases rapidly. For example, when the burial depth is 700 m, 800 m, 900 m, and 1000 m, the plastic zone boundary calculated by the analytical algorithm is 2.7 m, 2.75 m, 2.77 m, and 2.82 m, respectively, while the numerical simulation results are 3.81 m, 3.95 m, 4.21 m, and 4.4 m. It can be seen from Figure 12 that with the increase in burial depth, the relative error of the analytical calculation and numerical simulation increases gradually and decreases in some cases. For example, when the burial depth is 1200 m, the error is 39.2%, while when the burial depth is 1300 m, the error is reduced to 35.5%. On the whole, the error of the plastic zone boundary of the multi-layer heterogeneous composite roadway is larger than that of the single-layer heterogeneous roadway.

4.2.2. Error Analysis of Plastic Zone Boundary under Non-Isobaric Conditions

Figure 13 shows the statistical results of the plastic zone boundary under non-isobaric conditions using an analytical algorithm and numerical simulation. It can be seen that with the increase in the lateral pressure coefficient, the boundary of the plastic zone increases with the increase in the lateral pressure coefficient.
As can be seen from Figure 8 and Figure 13, when λ is 1.5 or 1.8, the shape of the plastic zone is an ellipse, and the boundary of the plastic zone is mainly extended in the coal seam with lower strength. The relative error of the two calculation methods is less than 25%. When λ = 2.1, the shape of the plastic zone is a butterfly, and the boundary of the plastic zone turned into a mudstone layer of the roadway floor. At the same time, the relative error of the two methods also increases.
The plastic zone boundary and its relative error obtained by the two methods are almost the same as those in the single heterogeneous surrounding rock, but for multi-layer heterogeneous surrounding rock, the error of the plastic zone calculated by analytical calculation and numerical simulation is often larger than that of the single heterogeneous surrounding rock.

5. Discussion

5.1. Shape of Plastic Zone of Roadway Surrounding Rock

It can be seen from Figure 4 and Figure 6 above that with the increase in the lateral pressure coefficient, the shape of the surrounding rock plastic zone calculated by the analytical algorithm changes from circular to elliptical, and finally to butterfly, whether in single-layer heterogeneous surrounding rock or multi-layer heterogeneous surrounding rock. This is consistent with the numerical simulation method. Moreover, the outer edges of the plastic zone are scattered, which is consistent with the numerical simulation results under the same parameters. Due to the density of the numerical simulation mesh division and the step distance between theoretical calculation drawings, there is inevitably a certain difference in the shape of the plastic zone obtained by the two methods, but this difference does not affect the shape characteristics of the plastic zone.
The above analysis shows that the shape of the plastic zone obtained by the two methods is consistent in terms of the shape of the plastic zone. This also shows the effectiveness of the proposed analytical algorithm.

5.2. Range of Plastic Zone of Roadway Surrounding Rock

According to the comparison between the analytical algorithm and the numerical simulation results, based on the current general in situ stress and rock conditions, there is a certain amount of error (generally no more than 30%) between the analytical algorithm and the numerical simulation results. There is also a certain amount of error (generally less than 40%) in the boundary of the plastic zone in multi-layer heterogeneous composite rock masses. This is mainly due to the fact that the two assumptions in the analytical algorithm do not fully conform to the principle of elastoplastic mechanics. Considering its mechanical essence, (1) the first assumption is that all rock strata and their interfaces in the rock mass are elastic; (2) the second assumption ignores the effect of plastic failure on the stress redistribution of the surrounding rock in the elastic zone, and further reduces the maximum value of the plastic zone boundary. In addition, the error is also related to the grid density of numerical simulation modeling. In the analytical calculation, each scattered point in the coordinate is regarded as a heterogeneous medium point, while in the numerical simulation, each grid of the model is regarded as a heterogeneous medium point. In order to save calculation time, the grid cannot be infinitely encrypted, which leads to a large grid in the numerical simulation, so there are some errors in the two methods. These problems need to be further combined with the actual project to be solved.

5.3. Comparison with Existing Experimental Results

Through strict formula derivation, the analytical algorithm of the plastic zone of surrounding rock in a heterogeneous roadway is obtained. The shape characteristics of the plastic zone of the surrounding rock calculated by the analytical algorithm are highly similar to those obtained by other scholars. For example, Leon carried out the test with marble with tunnel-shaped holes, and butterfly failure occurred in rock samples with a single hole and two holes [12]. In 2014, Eyvind Aker studied the acoustic emissions of compressed sandstone samples with prefabricated holes in the laboratory. It was found that the angle between the direction of macro cracks around the holes and the vertical direction was approximately 45°. The extended form is similar to the two butterfly leaves, and the source location statistical map captured by AE is similar to the butterfly distribution [31]. Chongjin Li, Xibing Li, et al. (2017) studied the crack growth process of marble samples with holes under uniaxial compression and found that the final macro crack direction of circular, rectangular, and horseshoe shapes under uniaxial compression is almost consistent with the angle of the vertical direction. They also studied the crack growth process of marble samples with voids under biaxial compression, and the failure mode of marble samples with voids under biaxial compression is similar to the butterfly shape [32]. These results of experiments and numerical simulation show that the algorithm proposed by this paper is practical and reliable.

6. Conclusions

(1)
The analytical algorithm proposed by this study uses several simple and commonly known independent variables to express the important unknown quantity of the range and shape of the plastic zone of the surrounding rock of the roadway, so that the functional relationship between them is clearer, and the failure law of the roadway can be revealed by studying the properties of the function, which is incomparable with other methods such as numerical simulation.
(2)
The comparison results show that the shape and range characteristics of the plastic zone obtained by the analytical algorithm are highly consistent with those obtained by the numerical simulation method, and are also consistent with the existing experimental results, so the analytical algorithm is effective. Compared with other methods, this method can guide field practice more conveniently and simply.
(3)
There are some errors between the analytical method and the numerical simulation. In addition, the relative error of the plastic zone calculation of a multi-layer heterogeneous roadway is larger than that of a single heterogeneous roadway. According to the accuracy required by the actual project, these problems can be ignored.

Author Contributions

Conceptualization, J.L., N.M., and S.G.; methodology, J.L. and Z.W.; software, J.L. and Z.W.; writing—original draft preparation, J.L.; writing—review and editing, W.Z.; visualization, J.L. and W.Z.; supervision, N.M. and S.G. All authors have read and agreed to the published version of the manuscript.

Funding

This work was partially supported by the National Natural Science Foundation of China (Grant No. 52004289 and 51704294) and the Fundamental Research Funds for the Central Universities (3142017108).

Institutional Review Board Statement

Not applicable.

Informed Consent Statement

Not applicable.

Data Availability Statement

Not applicable.

Conflicts of Interest

The authors declare no conflict of interest.

References

  1. Zou, H.; Yan, E.C. The surrounding rock deformation and failure mechanism of wudang group schists tunnel. Elec. J. Geot. Eng. 2015, 20, 6557–6576. [Google Scholar]
  2. Kang, H.P.; Xu, G.; Wang, B.M.; Wu, Y.Z.; Jiang, P.F.; Pan, J.F.; Ren, H.W.; Zhang, Y.J.; Pang, Y.H. Forty years development and prospects of underground coal mining and strata control technologies in China. J. Min. Strat. Control. Eng. 2019, 1, 7–39. [Google Scholar] [CrossRef]
  3. Yuan, C.; Cao, L.M.; Wang, W.J.; Fan, L.; Huang, C. Case study on rock support technology for roadways based on characteristics of plastic area. KSCE J. Civ. Eng. 2021, 25, 705–723. [Google Scholar] [CrossRef]
  4. Cai, M.F. Key theories and technonogies for surrounding rock stability and ground control in deep mining. J. Min. Strat. Control. Eng. 2020, 2, 5–13. [Google Scholar] [CrossRef]
  5. Palumbo, D.; Finis, R.D.; Ancona, F.; Galietti, U. Damage monitoring in fracture mechanics by evaluation of the heat dissipated in the cyclic plastic zone ahead of the crack tip with thermal measurements. Eng. Frac. Mech. 2017, 181, 65–76. [Google Scholar] [CrossRef]
  6. Zhang, T.; Wang, Y. Study on deformation evolution law and support technology of surrounding rock in multiple mining roadway. J. Min. Strat. Control. Eng. 2020, 2, 66–73. [Google Scholar] [CrossRef]
  7. Xia, C.C.; Liu, Y.P.; Wu, F.B.; Xu, C.; Deng, Y.G. Viscoelasto-viscoplastic solutions for circular tunnel based on nishihara model. Rock Soil Mech. 2019, 40, 1638–1648. [Google Scholar] [CrossRef]
  8. Eugie, K.; Murat, K.; Emmanuel, K.C. Proposed solution for the ground reaction of non-circular tunnels in an elastic-perfectly plastic rock mass. Comput. Geotech. 2020, 119, 103354. [Google Scholar] [CrossRef]
  9. Jiang, B.S.; Zhang, Q.; He, Y.N.; Han, L. Elastoplanstic analysis of cracked surrounding rocks in deep circular openings. Chin. J. Rock Mech. Eng. 2007, 26, 982–986. [Google Scholar] [CrossRef]
  10. Wang, Z.Q.; Wu, C.; Shi, L.; Su, Z.H.; Wang, P.; Huang, X. Analysis of surrounding rock stress and plastic zone of two-way unequal pressure circular roadway based on complex variable theory. J. China Coal Soc. 2019, 44, 419–429. [Google Scholar] [CrossRef]
  11. Zeng, K.; Ju, H.; Sheng, G.; Zhang, C.G. Elastic-plastic analytical solutions for surrounding rocks of tunnels and its engineering applications. J. China Coal Soc. 2011, 36, 752–755. [Google Scholar] [CrossRef]
  12. Kastner, H. Statik des Tunel und Stollenbauess; Springer: Berlin/Heidelberg, Germany, 1962. [Google Scholar]
  13. Ren, Q.; Zhang, H. The correction of Fenner formula. J. Hehai Univ. 2001, 29, 109–111. [Google Scholar]
  14. Bagheri, B.; Soltani, F.; Mohammadi, H. Prediction of plastic zone size around circular tunnels in non-hydrostatic stress field. Int. J. Min. Sci. Technol. 2014, 24, 81–85. [Google Scholar] [CrossRef]
  15. Pan, Y.; Chen, Y. Plastic zones and characteristics-line families for openings in elasto-plastic rock mass. Rock. Mech. Rock Eng. 1990, 23, 275–292. [Google Scholar] [CrossRef]
  16. Zhao, Z. Study on Mechanism and Control Method of Deformation and Failure of Surrounding Rock in Large Deformation Mining Roadway. Master’s Thesis, China University of Mining and Technology (Beijing), Beijing, China, 2014. [Google Scholar]
  17. Guo, X.F.; Zhao, Z.Q.; Gao, X.; Wu, X.; Ma, N. Analytical solutions for characteristic radii of circular roadway surrounding rock plastic zone and their application. Int. J. Min. Sci. Technol. 2019, 29, 263–272. [Google Scholar] [CrossRef]
  18. Zhao, Z.; Ma, N.; Guo, X.; Zhao, X. Falling principle and support design of butterfly-failure roof in large deformation mining roadways. J. China Coal Soc. 2016, 41, 2932–2939. [Google Scholar] [CrossRef]
  19. Ma, N.; Zhao, X.; Zhao, Z.; Li, J.; Guo, X.F. Stability analysis and control technology of mine roadway roof in deep mining. J. China Coal Soc. 2015, 40, 2287–2295. [Google Scholar] [CrossRef]
  20. Zhang, W.; Ma, N.; Ma, J.; Li, C.; Ren, J. Mechanism of rock burst revealed by numerical simulation and energy calculation. Shock. Vib. 2020, 2020, 8862849. [Google Scholar] [CrossRef]
  21. Wang, P.; Zhang, B.; Wang, L.; Lin, X.; Song, X.; Guo, J. Research on roof falling mechanism and support technology of mining roadway in expansive soft rock. J. Min. Strat. Control. Eng. 2020, 2, 57–65. [Google Scholar] [CrossRef]
  22. Guo, X.F.; Li, C.; Huo, T.H. Shapes and formation mechanism of the roadway plastic zone under partial confining pressure. Geomech. Eng. 2021, 25, 509–520. [Google Scholar] [CrossRef]
  23. Kong, P.; Jiang, L.; Shu, J.; Sainoki, A.; Wang, Q. Effect of fracture heterogeneity on rock mass stability in a highly heterogeneous underground roadway. Rock Mech. Rock Eng. 2019, 52, 4547–4564. [Google Scholar] [CrossRef]
  24. Dai, S.; Gao, W.; Wang, C.; Xiao, T. Damage evolution of heterogeneous rocks under uniaxial compression based on distinct element method. Rock Mech. Rock Eng. 2019, 52, 2631–2647. [Google Scholar] [CrossRef]
  25. Wang, J.; Wang, Z.; Yang, S. A coupled macro- and meso-mechanical model for heterogeneous coal. Int. J. Rock. Mech. Min. 2017, 94, 64–81. [Google Scholar] [CrossRef]
  26. Zhang, B.; Chalaturnyk, R.; Boisvert, J. A numerical characterization workflow for assessing the strength and failure modes of heterogeneous oil sands. Can. Geotech. J. 2020, 58, 763–781. [Google Scholar] [CrossRef]
  27. Jozef, J.; Karpiński, R.; Wójcik, A. Influence of the undercut anchor head angle on the propagation of the failure zone of the rock medium. Materials 2021, 14, 2371. [Google Scholar] [CrossRef]
  28. Jozef, J.; Karpiński, R.; Wójcik, A. Numerical analysis of the effect of embedment depth on the geometry of the cone failure. J. Phys. Conf. Ser. 2021, 2130, 012012. [Google Scholar] [CrossRef]
  29. Jozef, J.; Karpiński, R.; Wójcik, A. Influence of the undercut anchor head angle on the propagation of the failure zone of the rock medium-Part II. Materials 2021, 14, 3880. [Google Scholar] [CrossRef]
  30. Chen, H.; Zhu, H.; Zhang, L. Analytical solution for deep circular tunnels in rock with consideration of disturbed zone, 3d strength and large strain. Rock Mech. Rock Eng. 2021, 54, 1391–1410. [Google Scholar] [CrossRef]
  31. Eyvind, A.; Daniela, K.; Václav, V.; Soldal, M.; Oye, V. Experimental investigation of acoustic emissions and their moment tensors in rock during failure. Int. J. Rock. Mech. Min. 2014, 70, 286–295. [Google Scholar] [CrossRef]
  32. Li, C.J.; Li, X.B.; Li, D.Y. Particle flow analysis of fracture characteristics of marble with a single hole. Chin. J. Eng. 2017, 39, 1791–1801. [Google Scholar] [CrossRef]
Figure 1. Mechanical model of heterogeneous surrounding rock in circular roadway.
Sustainability 14 09480 g001
Figure 2. Stress state and strength curve of surrounding rock.
Sustainability 14 09480 g002
Figure 3. Numerical calculation model and mechanical parameter assignment. (a) Numerical calculation model. (b) Random distribution of mechanical parameters.
Sustainability 14 09480 g003
Figure 4. Shape of plastic zone in single-layer heterogeneous surrounding rock of roadway with different lateral pressure coefficients. (a) Coal. (b) Mudstone. (c) Sandy mudstone.
Sustainability 14 09480 g004aSustainability 14 09480 g004b
Figure 5. Calculation model of multi-layer heterogeneous surrounding rock. (a) Analytical calculation. (b) Numerical simulation.
Sustainability 14 09480 g005
Figure 6. Shape of plastic zone in multi-layer heterogeneous surrounding rock of roadway with different lateral pressure coefficients.
Sustainability 14 09480 g006
Figure 7. Direction variation characteristics of plastic zone under different rotation angles of maximum confining pressure. (a) 0°. (b) 30°. (c) 60°. (d) 90°. The blue arrow is the direction of maximum principal stress, and the orange arrow is the direction of minimum principal stress.
Sustainability 14 09480 g007
Figure 8. Evolution process of plastic zone shape.
Sustainability 14 09480 g008
Figure 9. Error analysis model. (a) Analytical calculation. (b) Numerical simulation.
Sustainability 14 09480 g009
Figure 10. Calculation results of heterogeneous circular roadway-surrounding rock plastic zone boundary with lateral pressure coefficient of 1. (a) Coal. (b) Mudstone. (c) Sandy mudstone.
Sustainability 14 09480 g010aSustainability 14 09480 g010b
Figure 11. Calculation results of plastic zone boundary of single-layer heterogeneous surrounding rock under different lateral pressures. (a) Coal. (b) Mudstone. (c) Sandy Mudstone.
Sustainability 14 09480 g011aSustainability 14 09480 g011b
Figure 12. Calculation results of multi-layered heterogeneous circular roadway-surrounding rock plastic zone boundary with lateral pressure coefficient of 1.
Sustainability 14 09480 g012
Figure 13. Calculation results of plastic zone boundary of multi-layer heterogeneous surrounding rock under different lateral pressure coefficients.
Sustainability 14 09480 g013
Table 1. Rock mechanics parameters.
RockTensile Strength/MPaFriction Angle/(°)Cohesion/MPaElastic Modulus/GPaPoisson’s RatioCompressive Strength/MPa
coal0.35[23, 28][2.8, 3.2]22.960.239.42
mudstone1.91[27, 33][5.7, 6.3]10.350.2420.78
sandy mudstone4.39[32, 38][8.7, 9.3]2.690.2234.57
Publisher’s Note: MDPI stays neutral with regard to jurisdictional claims in published maps and institutional affiliations.

