1. Introduction
1.1. Research Background and Contribution
The new round of electricity reform has promoted the opening of the power industry on the distribution side, and has formed a situation in which multiple electricity retailers bid together. In the case of insufficient competition, the market behavior of electricity retailers has a great impact on their development prospects. This paper focuses on the market strategy of electricity retailers and the influencing factors of their strategy selection in the incomplete opening market.
As a theoretical tool to solve the conflict of interests and optimize the decision-making of multiple parties, game theory is a powerful method to study the market strategy of electricity retailers [
1,
2]. Most literatures applying game theory to analyze problems in electricity market assume that the players are completely rational based on the complete opening of market information [
3,
4], but in fact, the game information in the power market is incomplete, and the players are usually in a limited rational state [
5,
6,
7], which shows that using traditional game theory to solve the bidding problem of electricity retailers has certain limitations.
Because evolutionary game theory believes that each subject can reach equilibrium by constantly revising its own actions and strategies in the game process, it has gradually become a key tool to solve bounded rationality problems in the incomplete information environment [
8,
9,
10]. The research objects of most evolutionary games are two groups with limited rationality and limited information, but in fact, each electricity retailer has its own unique attributes, and there is information interaction among some electricity retailers [
11]. In order to describe the interaction between game players in the game process, it is possible to combine evolutionary game with complex network. However, few studies have applied the evolutionary game model on complex network to the retail electricity market.
With the increasingly opening of the retail electricity market, users have gradually participated in the retail market [
12]. Users’ participation in the retail market is mainly manifested in two aspects, one is to adjust the load demand, and the other is to switch to other electricity retailers to purchase electricity [
13]. If an electricity retailer increases the retail price, users who choose the electricity retailer will reduce the electricity demand there, which means users can adjust their electricity purchase needs and switch electricity retailers based on the retail prices. Therefore, the switching behavior of users is closely related to the retail quotation strategy of electricity retailers [
13,
14], and it is necessary to consider the switching behavior of users when analyzing the quotation strategy of electricity retailers. At present, the research on users’ switching behavior mostly focuses on the determinants of switching. In view of this, we use the market share function to describe the user’s switching behavior and analyze the impact of the user’s switching behavior on the price strategy.
Based on the above background, the purpose of this paper is to use the evolutionary game model on complex network to study the influence of network structure, contract transactions, user switching behavior and strategy updating rules on the price strategy of electricity retailers. We use a scale-free network to describe the information interaction relationship of each electricity retailer, and use the market share function to reflect the user’s switching behavior among electricity retailers. Finally, according to the simulation results of the evolutionary game under different scenarios, it is verified that the evolutionary game model on complex network has versatility and accuracy in analyzing the learning mechanism and strategy evolution of electricity retailers. In general, based on theoretical research and dynamic simulation, this paper aims to explore the factors affecting the results of price strategy selection of electricity retailers under the evolutionary game model on complex network, which can be used as a useful guide for electricity retailers to make relevant policy and strategy.
1.2. Literature Review
1.2.1. Evolutionary Game
Game theory is used to solve the problem that two or more interested entities can make the best decision in the face of conflict of interest [
15,
16], and there are many applications in the electricity market in recent years. For example, in order to study the operation strategy of stakeholders in a distribution network, a two-level game model with multi-stakeholder participation has been constructed in [
17]. Because the transaction is completely controlled by a few companies in the market that produce the same or homogeneous product, companies not only have to consider the behavior of consumers, but also the reactions of their competitors; thus, a duopoly Stackelberg game model has been constructed to study the strategic choice of companies as a leader and follower in [
18]. In order to realize the optimal operation of a household microgrid and its distribution network in the retail electricity market, a non-cooperative game structure with microgrid participation has been constructed [
19]. The problem of bilateral contract among generation companies and large consumers has been presented using the game theory in [
20]. Most game models in these applications mentioned above belong to traditional game theory, that is, assuming that the game player is completely rational when the market information is completely open. However, the actual electricity market is a complex system, and market participants cannot obtain complete market information and make trading decisions completely rationally.
Compared with the traditional game theory, the related research of evolutionary game is based on the players with limited rationality and limited information, which is more suitable for solving practical game problems. In recent years, it has been widely used in economic management, engineering technology and other fields [
21,
22,
23,
24,
25]. In the application of electricity market, the asymptotic stability condition of equilibrium point of power generation group in evolutionary game has been discussed in [
26]. A stochastic evolutionary game model for two heterogeneous power generation enterprises when the information is asymmetric has been constructed in [
27]. An evolutionary game model of bidding between two groups of generators considering the degree of market liberalization has been proposed in [
28]. A Bayesian evolutionary game to study the optimal supply strategy for generating units of different energy types to maximize their profits has been presented in [
29]. Although evolutionary game theory is suitable for solving the problems with incomplete information and bounded rationality of players, these studies usually only focus on simple evolutionary games of two groups and ignore the influence of behavioral interaction between game players.
1.2.2. Complex Network
In the development process of the actual retail market, the number of electricity retailers has gradually increased and some electricity retailers have an information interaction relationship. The relevant research on complex networks has found that there is a close relationship between the interaction mechanism of enterprises and the network structure. Therefore, introducing complex networks into evolutionary games can well describe the information interaction behavior between game players in the game process. For example, reference [
30] used the evolutionary game model on complex network to describe the game and learning mechanism between enterprises and their neighbors in the industrial network. Reference [
31] studied the influence of completely random networks and accumulative factors on the traditional evolutionary game model. Reference [
32] discussed the evolutionary game of safety investment of enterprises in three kinds of network structures. Reference [
33] constructed the evolutionary game model on complex network to analyze the potential impact of punitive measures on the clean transition behavior of enterprises under different policy scenarios. Although the complex network can accurately describe the interaction between electricity retailers, no relevant research has been found to discuss the game problem of electricity retailers under a complex network structure.
1.2.3. User’s Switching Behavior
The research on user’s switching behavior mainly focuses on the analysis of the determinants of user switching [
13,
14,
34], and rarely starts from the perspective of the impact of user’s switching behavior on the market. In order to consider the influence of user’s switching behavior in the evolutionary game of electricity retailers, it is necessary to use appropriate tools to model user’s switching behavior. Tools mentioned in past related research include the price–share curve and market share function [
35,
36,
37,
38]. The price–share curve can accurately describe users’ switching behavior, but it is difficult to determine the curve, and it cannot be used to clarify the competitive relationship between electricity retailers [
35,
36]. The market share function is relatively easy to determine, and the competitive relationship between electricity retailers can be clarified by introducing the retail quotation of competitors. Therefore, this paper will use the market share function to describe the user’s switching behavior in the retail market [
37,
38].
1.2.4. Research Hypothesis
In line with the above research and the purpose of this paper, the main hypothesis we test in this study is given below.
Hypothesis 1 (H1). Electricity retailers cannot obtain complete market information and make completely rational trading decisions.
Hypothesis 2 (H2). There are a certain number of electricity retailers in the electricity retail market, and some of them have an information interaction relationship.
Hypothesis 3 (H3). The switching behavior of users will have a certain impact on electricity retailers.
Hypothesis 4 (H4). The contract transaction will have a certain influence on electricity retailers.
2. Analysis of Complex Network Characteristics of Electricity Retailers
The retail electricity market often contains multiple electricity retailers, and different electricity retailers have different attributes. Due to geographical restrictions, information protection, benefit protection and other reasons, all electricity retailers cannot carry out smooth information interaction. In order to characterize the information interaction between electricity retailers, we can introduce complex networks in the complex and changeable environment of the retail electricity market.
Complex networks are considered as topological structures of complex interactions, which can be used to study the statistical characteristics, formation mechanism and dynamic behavior of different topological models. According to the distribution characteristics of the network structure, complex network can be divided into a regular network, random network, small-world network, BA scale-free network, etc. Most nodes in the BA scale-free network have a small degree, but there are also a few nodes with a large degree, it is consistent with the characteristics of information interaction between electricity retailers. Therefore, BA scale-free network can vividly describe the information interaction structure of different electricity retailers. Each node in the scale-free network represents an electricity retailer. The higher the degree, the higher the position of the node in the network, and the greater the impact on other nodes. Because large-scale electricity retailers have the advantages of resources, technology, capital and so on, they occupy a dominant position in the market, and can be represented by nodes with a larger degree, while small-scale electricity retailers usually have less influence in the market, which can be represented by nodes with a small degree. Nodes in the BA network can only interact with their neighbors, which is consistent with the fact that electricity retailers can only interact with some electricity retailers in the market. In addition, the characteristics of scale-free network in the retail electricity market are also reflected in the growth and preferential connection, that is, in the process of market development, new electricity retailers will join the retail market competition, and newly joined electricity retailers are more inclined to interact with existing electricity retailers which have a larger influence.
The basic algorithm of scale-free network is also divided into two steps [
32,
39]. (1) growth. In a network with
initial nodes, a new node with
m edges is added every unit time, and this new node is connected to the existing
nodes in the network. (2) Preferential connection. When a newly added node connects with an existing node in the network, the connection probability is
, where
is the degree owned by the electricity retailer
i, that is, the number of other electricity retailers that have information interaction with retailer
i,
N is the number of nodes in the current market network, after
t time steps, the number of nodes in the network is
and the number of edges is
.
3. Analysis of User Switching Behavior
3.1. Scene Description
This article considers the possibility of user switching electricity retailers during market transaction. There are two types of participants involved in this question, users and electricity retailers. The specific definitions of them are as follows.
Electricity retailer is the provider of retail power and the maker of retail prices. It mainly affects the purchase decision of users by adjusting the retail price and pursues the maximum value of its own revenue under the premise of ensuring the power consumption of users. The retail power that each electricity retailer can provide is limited.
The user who purchases retail power from electricity retailers can switch the electricity retailer that acts as an agent for its power supply business, calculate the revenue according to the retail price and its own load and select the electricity retailer for the transaction based on the principle of maximizing revenue.
3.2. User Revenue Function
When users determine their power purchase needs from electricity retailers, they will seek to maximize their own revenue. The revenue is the difference between the utility of electricity and the cost of electricity purchase in the retail market.
Assuming that there is only one virtual user representing all users in the retail market, the utility that the user obtains from purchasing electricity
at the electricity retailer
is expressed as
. Among them, both
and
are coefficients greater than zero, and
represents the marginal utility when the user’s purchase of electricity from the electricity retailer
i is zero, and
represents the rate of change in the marginal utility. These two parameters not only reflect the nature and efficiency of the power consumption of the representative user, but also reflect the power supply quality and service attitude of electricity retailers to a certain extent. Considering that an electricity retailer cannot meet the electricity demand of all users in a certain area, and for homogeneous electricity, the electricity retailer has a substitute relationship. The actual satisfaction utility of user
is the satisfaction utility that users obtain from all electricity retailers, so the user’s revenue
is shown as follows.
where
represents the retail price set by an electricity retailer
i,
represents a combination of retail electricity supplied by
N electricity retailers,
represents the reduction rate of the marginal utility obtained when the user purchases electricity from electricity retailer
i as the electricity purchases from the electricity retailer
j increase, and
. As the total power purchased by the user remains unchanged, when the user increases the power purchased from the electricity retailer
j, the marginal utility obtained by the user when purchasing from the electricity retailer
i decreases significantly, so
.
3.3. Electricity Retailer Revenue Function
The revenue of the electricity retailer is the difference between the electricity sales revenue in the retail electricity market and the electricity purchase cost.
3.3.1. Sales Revenue in the Retail Electricity Market
For the electricity retailer i, the electricity sales revenue in the retail market includes two parts: (1) Electricity sales revenue from contract . (2) Electricity sales revenue from participating in bidding transactions .
Since the contract transaction between the electricity retailer and the user has been completed before the wholesale market transaction and the retail market bidding transaction, the contract price and the contract electricity are known.
Since the electricity that the electricity retailer participating in the bidding transaction is the difference between the total retail electricity and the contract electricity of the electricity retailer, the electricity sales revenue from bidding transaction is the product of the difference and the retail price .
3.3.2. Electricity Purchase Cost of Electricity Retailer
As an intermediary between the wholesale market and the retail market, electricity retailers sell electricity through bidding transactions on the one hand, and purchase electricity in the wholesale electricity market on the other hand. In the long run, the outcome of competition in the retail market will affect the wholesale market, so it is necessary to consider the impact of the outcome of competition in the retail market on wholesale electricity prices.
Assuming that all electricity retailers purchase their retail electricity from the wholesale market, and considering that the pricing strategy of electricity retailers will affect their retail electricity, thus affecting its purchasing demand and wholesale price in the wholesale market, in this paper, the relationship between wholesale electricity price and retail electricity is expressed by a linear supply function, and the electricity purchase cost of the electricity retailer
is obtained as shown in the following formula.
where
represents the retail electricity sold by all electricity retailers and
A and
are coefficients greater than zero.
3.3.3. Revenue of Electricity Retailer
In summary, the revenue of the electricity retailer is as follows.
3.4. Market Share Function
Electricity retailers have different credibility and pricing strategies, which lead to different electricity demands from users. In order to conveniently describe the user’s switching behavior, the market share function of the electricity retailer can be introduced to express the difference between different electricity retailers. The form of market share function can be calculated by the above revenue function of the user and electricity retailer [
37,
38].
According to the first-order optimal condition of maximizing user’s profit, the relationship between the retail price and the user’s electricity demand can be expressed as a linear inverse demand function as shown below.
Based on this function, the relationship between the retail prices set by
N electricity retailers and the retail power they sell can be expressed as the following matrix.
It can be written as:
where
represents a combination of retail prices set by
N electricity retailers,
b is a symmetric matrix, and since the main diagonal elements of matrix
b are not zero, matrix
b is invertible. Let
, we know that
β is also a symmetric matrix, that is,
, and the diagonal element is denoted as
. Thus, Equation (7) can be written in the following form.
From Equation (9), when the retail price set by the electricity retailer
is
and the retail price set by the opponent is
, the electricity demand of the user who chooses electricity retailer
i is as follows.
Equation (10) is also known as the market share function of the electricity retailer i. Where represents the user’s sensitivity to quotation of electricity retailer i. is the switching parameter, which is the same as the parameter . Considering that the total power purchased by the user remains unchanged, the power purchased by the user at the electricity retailer i and j is a substitution relationship, so . If , the user has no switching behavior between electricity retailers i and j, and if , the user has a switching behavior between electricity retailers i and j, that is, after the price of electricity retailer j increases, the user will switch part of the power demand originally at retailer j to retailer i, and the larger the , the greater the degree of user switching.
4. Evolutionary Game Bidding Model for Electricity Retailers
4.1. Evolutionary Game Theory
Compared with traditional game theory, evolutionary game emphasizes the dynamics of strategic changes, and considers the knowledge reserves, beliefs and risk preferences of game participants to a certain extent. In the trading process of retail market, it is difficult for electricity retailers to obtain the information of all users and retailers, and it is bounded rational to change strategies. Therefore, this paper selects evolutionary game model to study the bidding problem of electricity retailers in electricity retail market.
Applying evolutionary game theory to the bidding of electricity retailers, each player in the game has the following two basic characteristics [
26,
27].
Interactivity. On the one hand, the price strategy selected by the electricity retailer during the game may have a great impact on the opponent’s price strategy. On the other hand, the interests of each participant interact with other participants through the market clearing process, and the electricity retailer may also be affected by the bids of other electricity retailers.
Adaptability. Electricity retailers adapt to their own price strategies and those of other retailers, they learn and adjust their own quotations over time and update their estimates of other retailers’ price strategies based on historical information and newly released information.
4.2. Evolutionary Game Model of Electricity Retailers Based on Complex Network and User Switching Behavior
4.2.1. Model Assumptions
There are N electricity retailers in the retail electricity market, and , that is, the number of electricity retailers is limited, and no electricity retailers exit the market, and there may be new electricity retailers entering the market. There will be a BA scale-free network structure among the electricity retailers.
The strategy of all electricity retailers is a set of retail price strategies , where indicates high price strategy, and indicates low price strategy.
When electricity retailers choose game opponents, due to limited information access, they cannot establish contact with each electricity retailer in the network, but choose neighboring entities to play the game.
Electricity retailers are in a state of bounded rationality during the bidding game, and the probability of selecting a strategy is related to the expected return of the strategy.
In order to facilitate the calculation and make the game system reach a relatively stable state as soon as possible, it is assumed that all electricity retailers use the same rule to update the strategy. When the strategy is updated, the electricity retailer only determines the strategy to be adopted in the next game according to the results of this game.
4.2.2. Model Building
According to the above assumptions, the revenue matrix of the electricity retailer can be obtained as shown in
Table 1, where
and
are the revenue parameters of the electricity retailer
i and
j under different strategy combinations.
As shown in the above table, the price decision behavior in the game will produce four different income scenarios for the electricity retailer i.
Scenario 1: Both players choose the high price strategy. The user will determine the bidding electricity purchased from the electricity retailer i according to the proportion of the retail power that the electricity retailer i can provide. The retail price is the highest controllable quotation, and the revenue of the electricity retailer i is expressed as .
Scenario 2: Electricity retailer i chooses the high price strategy and the other player chooses the low price strategy. The user will give priority to buying electricity from the other player. If the sum of the contracted power of the two electricity retailers and the bidding electricity purchased from the other player cannot meet power demand, the user will purchase the bidding electricity from electricity retailer i. The retail price is the highest controllable quotation, and the revenue of the electricity retailer i is expressed as .
Scenario 3: Electricity retailer i chooses the low price strategy and the other player chooses the high price strategy. The user will give priority to buying electricity from the electricity retailer i. The retail price is the lowest controllable quotation, and the revenue of electricity retailer i is expressed as .
Scenario 4: Both players choose the low price strategy. The user will determine the bidding electricity purchased from the electricity retailer i according to the proportion of the retail power that the electricity retailer i can provide. The retail price is the lowest controllable quotation, and the revenue of the electricity retailer i is expressed as .
The nodes in the scale-free network model represent each type of electricity retailer, and the edges between the networks represent the game relationship between electricity retailers. Let the vector
S denote the strategy of the electricity retailer,
indicates that the electricity retailer adopts a low price strategy,
indicates that the electricity retailer adopts a high price strategy, then the total revenue
of each round of the game of the retailer
i in the network is the sum of the revenue obtained from the game with all neighbors, as shown in the following formula.
where
,
is the neighbor of the electricity retailer
i. 4.2.3. Strategy Update Rule
At each moment, all electricity retailers in the network will play games with neighboring electricity retailers, adopting the rule of pairing and comparison to perform the evolutionary game, that is, node
i will randomly select an adjacent node
j to compare the income. If the income of
i is less than
j, the node will choose to imitate the strategy of
j with the probability shown in the following formula in the next round of the game [
31].
where
represents the level of overconfidence of the electricity retailer
i, a larger
, means that the retailer is more confident and will not easily change its strategy. If
, the retailer is extremely unconfident, it tends to follow the strategy of competitors.
and
are the total revenues of the retailers
i and
j in the previous round of the game respectively.
indicates environmental noise, the larger it is, the stronger the randomness of the retailer’s strategy update.
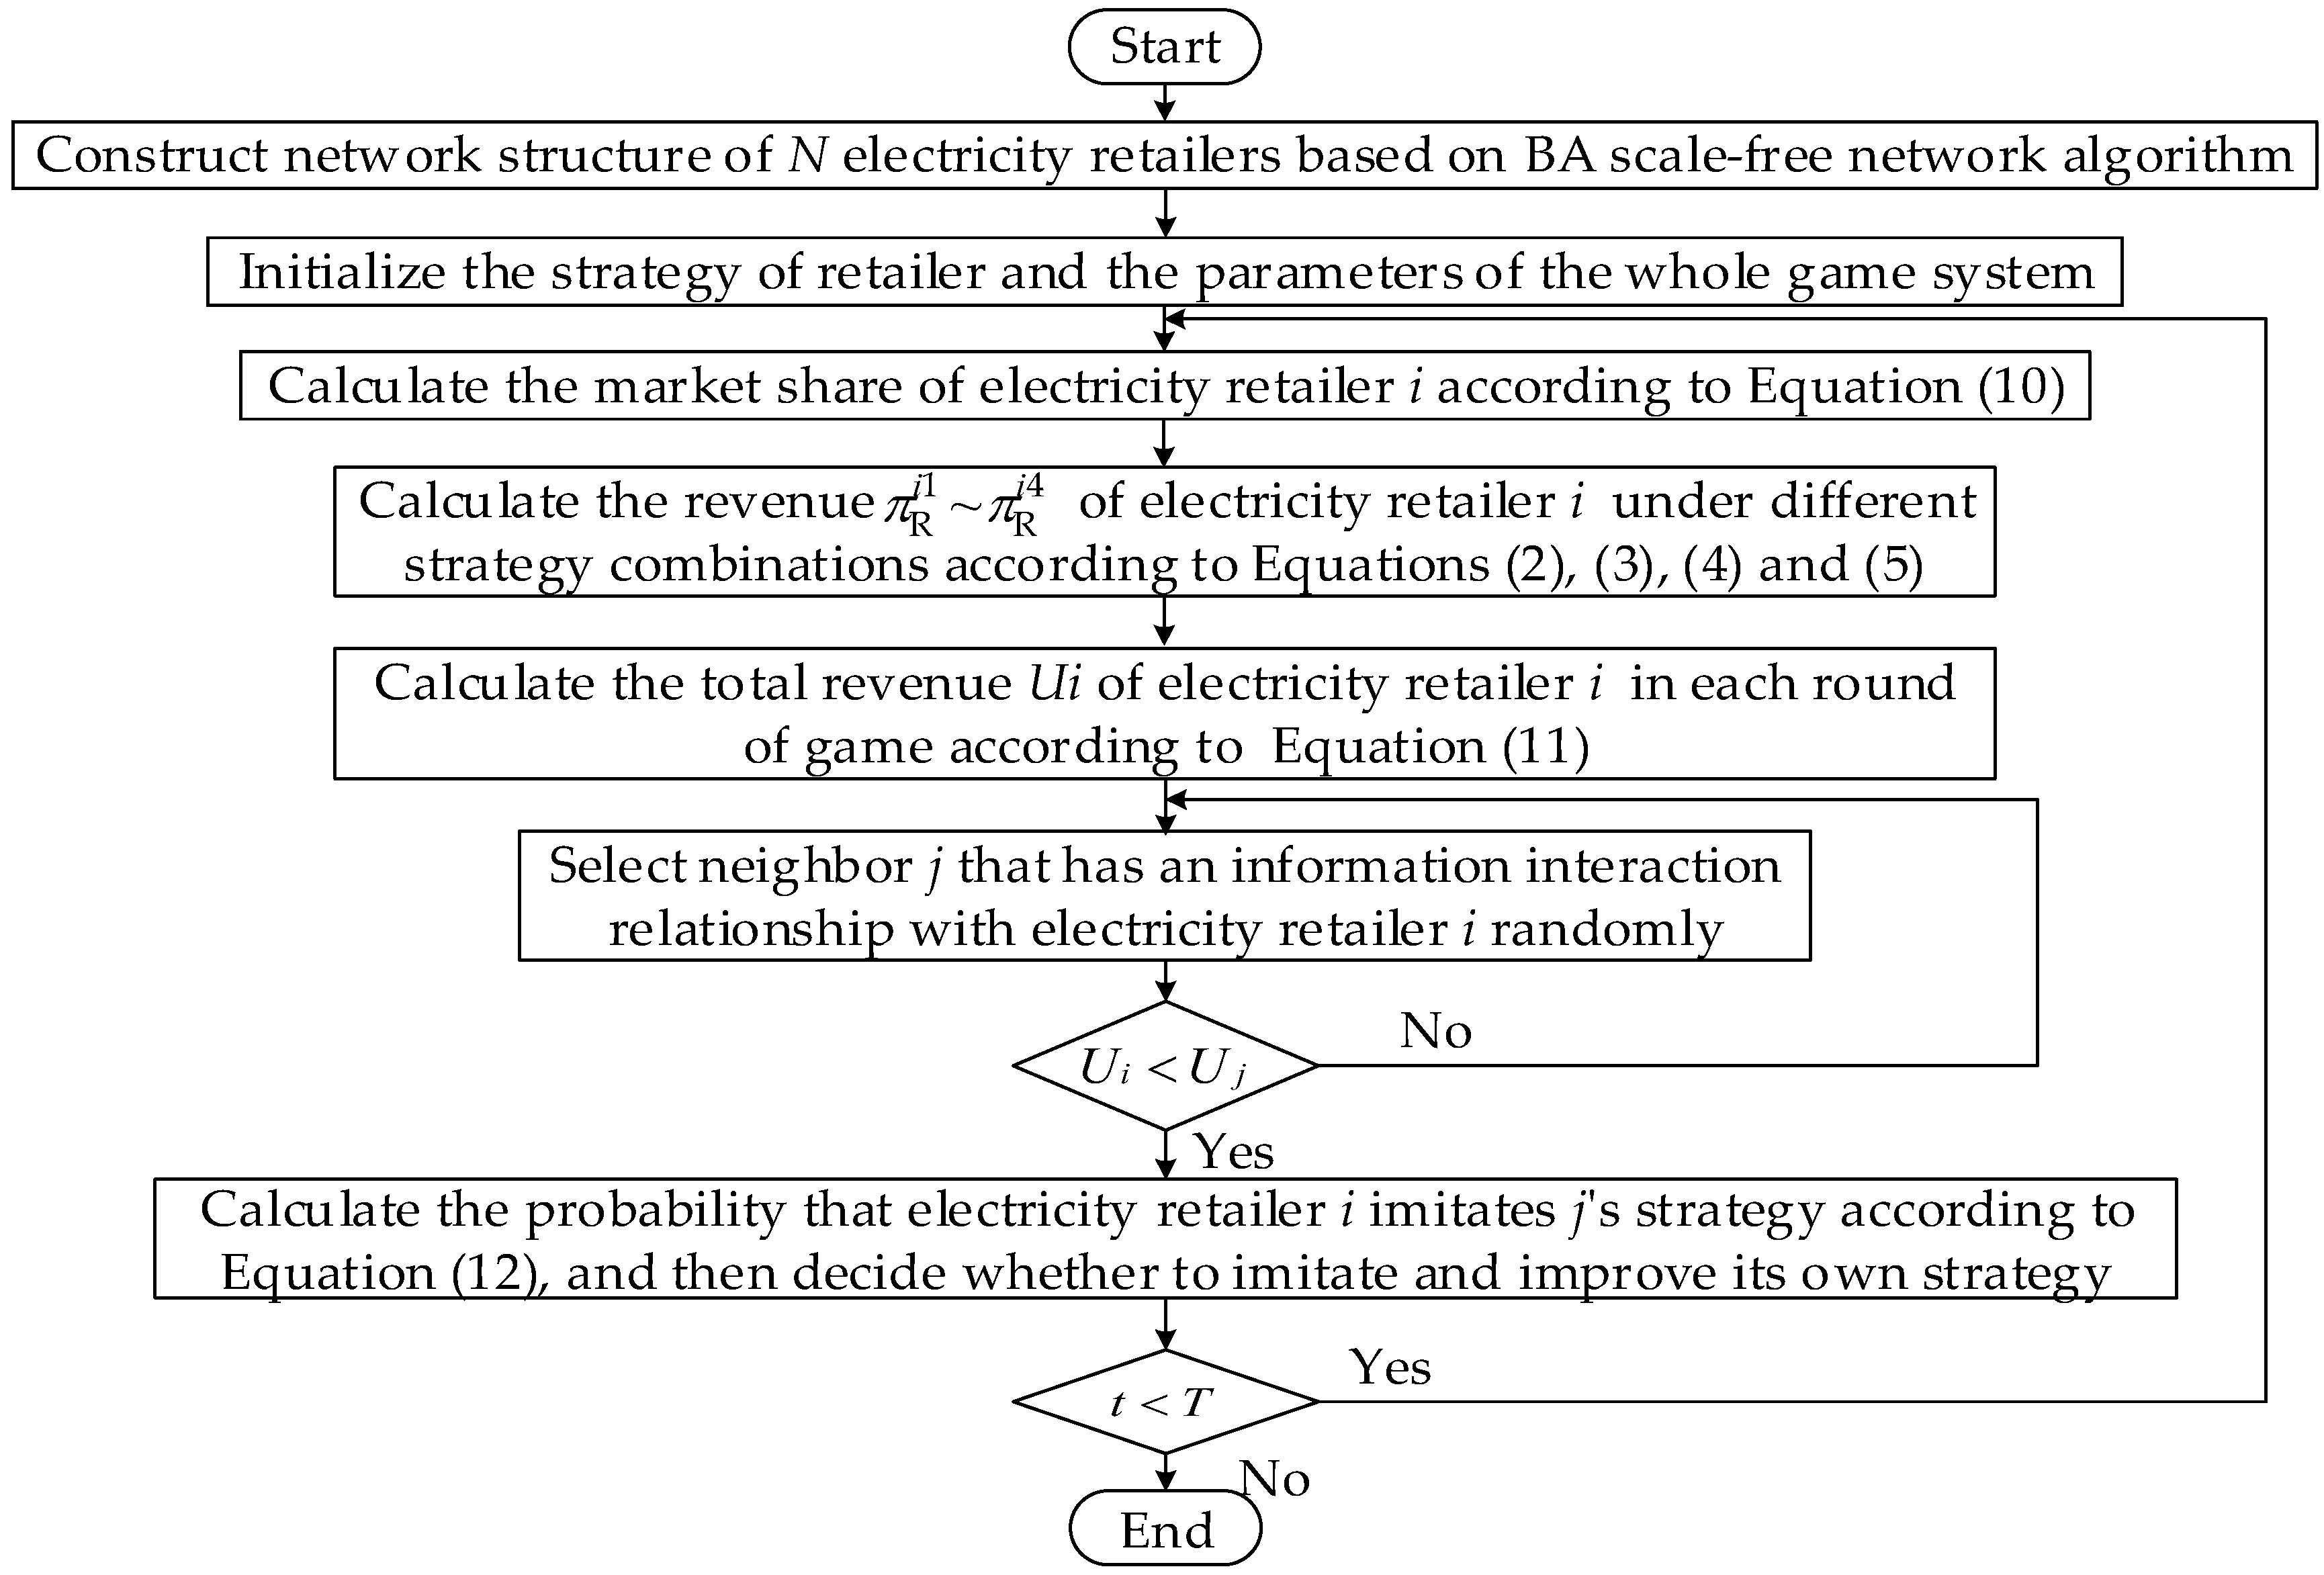
4.2.4. Network Evolutionary Game Algorithm
Based on the BA scale-free network, the flow chart of the evolutionary game algorithm of the electricity retailer constructed in this paper is shown in
Figure 1.
- Step 1:
Construct the BA scale-free network of the electricity retailers and initialize the parameters of the game system at .
- Step 2:
According to Equations (2)–(5), the revenue parameters of the electricity retailer i under different strategy combinations are calculated.
- Step 3:
The calculated revenue and the price strategies of all neighbors of the electricity retailer i are substituted into Equation (11) to obtain the corresponding total revenue.
- Step 4:
Electricity retailer compares revenue with neighboring nodes in a random probability. When the revenue of electricity retailer i is greater than that of neighboring nodes, it does not make any change, when the revenue of the electricity retailer i is less than that of the neighboring nodes, it learns the strategy of neighboring nodes in the network according to the strategy update rules set in Equation (12), and then imitates and improves its strategy.
- Step 5:
Loop steps 2, step 3 and step 4 at , and execute loop until the specified evolution time T.
5. Case Analysis
5.1. Parameter Settings
This example will study the influence of various factors on the results of the evolutionary game. The average network revenue of the electricity retailers is the ratio of the total revenue of all the electricity retailers in the network structure to the network scale. Set the network scale to 30 nodes and 90 nodes, and the scale-free network structure in the two cases is shown in
Figure 2. The number of games
T is 100. When initializing the game strategy, in order to ensure a fair game, the number of electricity retailers who choose the high price strategy and low price strategy is 50%, respectively. The setting of other parameters in the evolutionary game model of electricity retailers is as follows: Assuming that all signed contract price
is 74 USD/MWh, and the contract electricity
is 300 MWh. The highest controllable quotation is 45 USD/MWh, and the lowest controllable quotation is 30 USD/MWh. The user only has power purchase behavior and switching behavior between the two electricity retailers participating in each round of the game, and the total power demand of the user is 1800 MW. The parameter
in the market share function increases with the increase in the node number of the electricity retailer, and the value range is [15, 52] USD/MWh, and
decreases with the increase in the node number of the electricity retailer, and the value range is [5, 10]. The switching coefficients
are set to −2 (MW)
2h/USD. In the wholesale market, the parameter of wholesale electricity price
A = 30 USD/MWh,
ζ = 0.00045 USD/(MW)
2h. The overconfidence level
of the electricity retailer is 10, and the environmental noise
is 10
6.
5.2. Results Analysis
Considering that the purpose of electricity retailer is to make profits, and the actual power purchase behavior of the user also has certain constraints, according to the other parameters set in this paper, each parameter should be maintained within a certain estimated range. Generally, the information expressed by point variables is not as comprehensive as that expressed by interval variables. In order to comprehensively analyze the impact of a parameter on the price strategy, this paper uses interval variables instead of point variables, divides the estimation range of the parameter into several small intervals and analyzes the average game results in different intervals.
5.2.1. The Impact of Retail Contract Transaction on Game Evolution
Assuming that in the process of retail electricity market transactions, the electricity retailers participating in the price game will conduct contract transactions with users, the contract price will remain at 74 USD/MWh, and the estimated value range of contract electricity is divided into three intervals of [0, 300], [300, 600] and [600, 900] MWh. The evolutionary game process and the average network revenues in the final game of the electricity retailers under different contract electricity are shown in
Figure 3 and
Table 2, respectively.
The ordinate value shown in
Figure 3 is the proportion of the electricity retailer that chooses the high price strategy in each game, and each curve represents the average value of changes in the proportion of high price strategy in the corresponding interval. As can be seen from the results in the figure, within the range of low contract electricity, the proportion of the electricity retailer that chooses the high price strategy shows an overall upward trend with the progress of the game. Within the range of middle contract electricity, the result of the strategy selection is in a transitional stage. There are both cases that electricity retailers prefer to choose the high price strategy and low price strategy. Therefore, the average proportion of the high price strategy selection in this range is finally stable between 0 and 1. Within the range of high contract electricity, the proportion of the electricity retailer that chooses the high price strategy shows a downward trend with the progress of the game. This result is consistent with reality, when the contract electricity increases, the retail bidding power that the user needs to buy will decrease, in order to enhance the market competitiveness, electricity retailers will be biased to choose the low price strategy to attract users, which shows that contract transaction is conducive to curbing the market power behavior of electricity retailers.
In addition, the impact of retail contract transaction on game evolution at different network scales is also different. When the network scale is smaller, the proportion of electricity retailers choosing the high price strategy for each game changes more, which indicates that the larger the network scale, the more complex the information interaction relationship between the electricity retailer, resulting in a smaller impact of the each evolutionary game process on the choice of price strategy.
As can be seen from
Table 2, the comparison results of average network revenue under two network scales are as follows: [0, 300] MWh > [300, 600] MWh > [600, 900] MWh. The results show that because the electricity retailers under [0, 300] MWh contract electricity finally choose the high price strategy, while the electricity retailers under [600, 900] MWh contract electricity finally choose the low price strategy, the average network revenue under [600, 900] MWh contract electricity will be lower than that under [0, 300] MWh contract electricity. Under [300, 600] MWh contract electricity, the electricity retailer finally chooses the high price strategy more than the low price strategy, so the average revenue in this range is between the above two. With the increase in the network scale, the average network revenue under each contract electricity is in decline, showing that in the case of a larger network, as the network structure is more complex, it is more difficult for each electricity retailer to change strategy through evolutionary game to improve revenue, and the average network revenue obtained in the final game will be smaller under the same number of games.
5.2.2. The Impact of User Switching on Game Evolution
The other parameters remain unchanged, and the value range of switching parameter
in Equation (10) is divided into three ranges: [−2, 0] (MW)
2h/USD, [−20, −2] (MW)
2h/USD and [−40, −20] (MW)
2h/USD. The evolutionary game process and the average network revenue results of electricity retailers in the final game under different switching parameters are shown in
Figure 4 and
Table 3, respectively.
As can be seen from the results in
Figure 4, the proportion of electricity retailers that choose the high price strategy under the three ranges of user switching degree shows an overall upward trend with the progress of the game, and finally stabilizes at 1. However, with the increase in user switching degree, the number of games required for the proportion of high price strategy to be stable at 1 increases. This result shows that with the increase in the user switching degree, users will have more freedom to choose electricity retailers and more flexibility to purchase electricity. In order to enhance the competitiveness of the market, electricity retailers will not immediately prefer to choose the high price strategy to improve their own revenue, which also reflects that user switching is conducive to inhibiting the market power of electricity retailers. In addition, the number of games reaching equilibrium in each switching degree also increases with the increase in the network scale, indicating that it is more difficult to reach an equilibrium in the larger network scale due to the complex relationship of information interaction.
As can be seen from
Table 3, with the increase in the switching degree, the final average network revenue of different network scales of electricity retailers increases. Although a user’s switching behavior will affect the price strategy of electricity retailer, in the case that electricity retailers finally choose the high price strategy, when the switching degree increases, the retail electricity purchased by the electricity retailers will decrease, resulting in the reduction in the wholesale price. Affected by the parameters of wholesale price, the average network revenue of electricity retailers will increase. In addition, with the increase in the network scale, the average network revenue under each switching degree decreases, which indicates that in the case of a larger network scale, due to the more complex network structure, it is more difficult for each electricity retailer to change strategy through evolutionary game to improve the revenue, and the average network revenue will be smaller under the same number of games.
5.2.3. The Impact of the Level of Overconfidence on Game Evolution
Divide the value range of overconfidence level
in Equation (12) into [5, 10], [10, 30], [30, 50], and the remaining parameters remain unchanged. The evolutionary game process and the average network revenue of electricity retailers in the final game under different overconfidence levels are shown in
Figure 5 and
Table 4, respectively.
As can be seen from the results in
Figure 5, at the low overconfidence level, the proportion of choosing a high price strategy changes greatly, and with the increase in the level of overconfidence, the variation range of the proportion choosing a high price strategy gradually decreases, which indicates that when the overconfidence level is low, the electricity retailers often use the received environmental information to change the price strategy; thus, due to the fact that the environmental information is constantly changing in the game process, the selection strategy of electricity retailers is also constantly changing. At the high overconfidence level, electricity retailers are extremely confident about their own strategies and often choose to ignore external information, resulting in the proportion of price strategies to be close to the initial conditions.
It can be seen from
Table 4 that there is little difference in the final average network revenue between the overconfidence level interval of [5, 10] and the overconfidence level interval of [10, 30], indicating that the change in the overconfidence level has little influence on the revenue of electricity retailers. When the overconfidence level is increased to the range of [30, 50], the average network revenue of electricity retailers has an obvious downward trend, indicating that when the overconfidence level is increased to a certain extent, the revenue of electricity retailers will decrease because they are difficult to change their price strategy. In addition, due to the complexity of information interaction among electricity retailers in large-scale network and the larger number of electricity retailers involved in the calculation of average network revenue, it is more difficult to improve the revenue of all electricity retailers, and the average revenue of large-scale network will be smaller at the same overconfidence level.
6. Discussions
In general, the more contract electricity signed in the electricity market, the less electricity sales need to participate in the bidding, and the source of revenue for the electricity retailer will be mainly contract electricity, so it is meaningless to choose a high price strategy in the bidding process [
38,
40]. This is consistent with the results obtained in this paper, which holds that contract electricity can effectively restrain the market power of the electricity retailer, thus verifying the rationality of Hypothesis 4.
The results also show that user’s switching behavior will have a certain impact on the price strategy of electricity retailers, which supports Hypothesis 3. With the increase in the switching degree, electricity retailers will gradually prefer to choose the low price strategy, which is consistent with the research conclusion of reference [
38], but the difference is that reference [
38] also shows that the increase in the switching degree will reduce the profit of electricity retailers. Because the bidding model of the electricity retailers in this paper considers the influence of the wholesale price and the information interaction between the electricity retailer, the profit of the electricity retailer is not in reverse to the switching degree of users. In contrast, the bidding model designed in this paper is more in line with the actual situation. In addition, most previous studies on users’ switching behavior believe that user switching is related to many factors, price is not the main factor, as well as user switching costs and policymaking [
13,
41]. However, because there are too many factors to be considered, it is impossible to include all factors in the mathematical model, the previous studies have only analyzed the impact of parameters related to user switching on the market generally.
In addition to user’s switching behavior, this paper also focuses on the impact of overconfidence on the price strategy of electricity retailer. According to results of previous research studies, a recognized fact is that the higher the overconfidence level of an individual, the more inclined he is to keep the strategy stable when making strategies [
42,
43], which is consistent with the results of this research. We found that the higher the level of overconfidence of the electricity retailer, the closer the price strategy it chooses is to the initial conditions.
The evolutionary game model on complex network of electricity retailers established by us can also explore the impact of network scale on the price strategy and average profit of electricity retailer. In view of the different speeds of information transmission in different network scales, the more difficult it is for electricity retailers in a large-scale network structure to reach the game equilibrium, the lower the average benefit they can obtain at the same time. References [
30,
44,
45] showed similar results. In these studies, the larger the network scale, the more complex the dissemination of relevant information.
The influence of the overconfidence level and network scale on the price strategy of an electricity retailer verifies Hypothesis 1 and 2 from another perspective. The level of overconfidence is one of the attributes of the electricity retailer, and the different attributes of electricity retailers also lead to different pricing strategies and profits of the electricity retailer, which indicates that in the process of retail market trading, each electricity retailer obtains different information, so it cannot make a completely rational decision. In the complex network designed in this paper, only the interconnected nodes have a game relationship. Based on the above analysis of the rationality of the research results, it shows that only some electricity retailers have an information interaction relationship.
7. Conclusions
In this paper, considering user switching behavior, we propose an evolutionary game model of electricity retailers in the scale-free network context. By studying the evolution law of the network node strategy under different scenarios, we explore the influence of some key parameters in the retail electricity market on the price strategy of electricity retailers. The research results show that: (1) The increase in contract electricity within a certain range can make the electricity retailer tend to choose a low price strategy, and the contract transaction is more beneficial to increase the revenue of the electricity retailer than the bidding transaction. (2) The increase in the degree of user switching can effectively restrain the market power of an electricity retailer. (3) A growing level of overconfidence can lead to a decrease in the response of electricity retailer to external information, and they will not even change their own price strategy in extreme cases. The results of this paper can be expected to help us study the feasibility of the evolutionary game model on complex network in the retail electricity market and provide a reference for future studies which aim to study the development of the retail electricity market by analyzing the influence of different factors on the price strategy of electricity retailers.
However, it should be noted that this paper also has some limitations that need to be further improved and strengthened. On the one hand, the price strategy of the electricity retailer is not only closely related to these factors studied in this paper, but also may be affected by other factors (such as the introduction of spot market); therefore, in future work, other parameters also need to be considered in the bidding process of electricity retailers. On the other hand, the system and methodology of evolutionary game on complex network are still rough, and there are many shortcomings in its application. In actual engineering, electricity retailers may also have a more complex relationship network structure, and simulating the evolution process of price strategy of an electricity retailer in actual engineering is also a great challenge for the next research direction of this paper.
Author Contributions
Formal analysis, X.X.; investigation, L.Y.; methodology, X.X.; project administration, X.C. and L.Y.; resources, X.C. and L.Y.; software, X.X.; supervision, X.C. and L.Y.; validation, X.X.; visualization, X.X.; writing—original draft, X.X.; writing—review and editing, X.C. and L.Y. All authors have read and agreed to the published version of the manuscript.
Funding
This research was funded by National Natural Science Foundation of China, grant number 72174151.
Institutional Review Board Statement
Not applicable.
Informed Consent Statement
Not applicable.
Data Availability Statement
Not applicable.
Conflicts of Interest
The authors declare no conflict of interest.
References
- Pozo, D.; Sauma, E.; Contreras, J. Basic theoretical foundations and insights on bilevel models and their applications to power systems. Ann. Oper. Res. 2017, 254, 303–334. [Google Scholar] [CrossRef]
- Kumar, S.; Dwivedi, B.; Shrivastava, N.A. A game theory strategy-based bidding evaluation for power generation market. IEEE Can. J. Electr. Comput. Eng. 2021, 44, 283–288. [Google Scholar] [CrossRef]
- Jiang, Y.; Zhou, K.; Lu, X.; Yang, S. Electricity trading pricing among prosumers with game theory-based model in energy blockchain environment. Appl. Energy 2020, 271, 115239. [Google Scholar] [CrossRef]
- Zeng, B.; Shi, J.; Wen, J.; Zhang, J. A game-theoretic framework for active distribution network planning to benefit different participants under the electricity market. Turk. J. Electr. Eng. Comput. Sci. 2017, 25, 83–94. [Google Scholar] [CrossRef]
- Rakotoarisoa, M.A. Trade with endogenous market power under asymmetric and incomplete information. J. Ind. Compet. Trade 2016, 16, 423–440. [Google Scholar] [CrossRef]
- Guo, H.; Chen, Q.; Shahidehpour, M.; Xia, Q.; Kang, C. Bidding behaviors of GENCOs under bounded rationality with renewable energy. Energy 2022, 250, 123793. [Google Scholar] [CrossRef]
- Barazza, E.; Strachan, N. The impact of heterogeneous market players with bounded-rationality on the electricity sector low-carbon transition. Energy Policy 2020, 138, 111274. [Google Scholar] [CrossRef]
- Cheng, L.; Yu, T. Nash equilibrium-based asymptotic stability analysis of multi-group asymmetric evolutionary games in typical scenario of electricity market. IEEE Access 2018, 6, 32064–32086. [Google Scholar] [CrossRef]
- Cheng, L.; Yu, T. Game-Theoretic approaches applied to transactions in the open and ever-growing electricity markets from the perspective of power demand response: An overview. IEEE Access 2019, 7, 25727–25762. [Google Scholar] [CrossRef]
- Perera, R.S. An evolutionary game theory strategy for carbon emission reduction in the electricity market. Int. Game Theory Rev. 2018, 20, 1850008. [Google Scholar] [CrossRef]
- Goett, A.A.; Hudson, K.; Train, K.E. Customers’ choice among retail energy suppliers: The Willingness-to-pay for service attributes. Energy J. 2000, 21, 1–28. [Google Scholar] [CrossRef] [Green Version]
- Golmohamadi, H.; Keypour, R.; Bak-Jensen, B.; Radhakrishna Pillai, J. Optimization of household energy consumption towards day-ahead retail electricity price in home energy management systems. Sustain. Cities Soc. 2019, 47, 101468. [Google Scholar] [CrossRef]
- Ndebele, T.; Marsh, D.; Scarpa, R. Consumer switching in retail electricity markets: Is price all that matters? Energy Econ. 2019, 83, 88–103. [Google Scholar] [CrossRef]
- Yang, Y. Understanding household switching behavior in the retail electricity market. Energy Policy 2014, 69, 406–414. [Google Scholar] [CrossRef]
- Barati, A.A.; Azadi, H.; Scheffran, J. Agricultural land fragmentation in iran: Application of game theory. Land Use Policy 2021, 100, 105049. [Google Scholar] [CrossRef]
- Motlaghzadeh, K.; Kerachian, R.; Tavvafi, A. An evidential reasoning-based leader-follower game for hierarchical multi-agent decision making under uncertainty. J. Hydrol. 2020, 591, 125294. [Google Scholar] [CrossRef]
- Deng, W.; Dong, P.; Liu, M.; Huang, X.; He, X.; He, R. Research on game operation of multi-stakeholder in distribution network in electricity market. Front. Energy Res. 2021, 9, 504. [Google Scholar] [CrossRef]
- Peng, Y.; Lu, Q.; Xiao, Y. A Dynamic stackelberg duopoly model with different strategies. Chaos Solitons Fractals 2016, 85, 128–134. [Google Scholar] [CrossRef]
- Marzband, M.; Javadi, M.; Pourmousavi, S.A.; Lightbody, G. An advanced retail electricity market for active distribution systems and home microgrid interoperability based on game theory. Electr. Power Syst. Res. 2018, 157, 187–199. [Google Scholar] [CrossRef]
- Tang, Y.; Ling, J.; Wu, C.; Chen, N.; Liu, X.; Gao, B. Game-theoretic optimization of bilateral contract transaction for generation companies and large consumers with incomplete information. Entropy 2017, 19, 272. [Google Scholar] [CrossRef]
- Li, C.; Zhang, F.; Cao, C.; Liu, Y.; Qu, T. Organizational coordination in sustainable humanitarian supply chain: An evolutionary game approach. J. Clean. Prod. 2019, 219, 291–303. [Google Scholar] [CrossRef] [Green Version]
- Sun, H.; Wan, Y.; Zhang, L.; Zhou, Z. Evolutionary game of the green investment in a two-echelon supply chain under a government subsidy mechanism. J. Clean. Prod. 2019, 235, 1315–1326. [Google Scholar] [CrossRef]
- Fang, Y.; Wei, W.; Liu, F.; Mei, S.; Chen, L.; Li, J. Improving solar power usage with electric vehicles: Analyzing a public-private partnership cooperation scheme based on evolutionary game theory. J. Clean. Prod. 2019, 233, 1284–1297. [Google Scholar] [CrossRef]
- Mahini, H.; Navidi, H.; Babaei, F.; Mousavirad, S.M. EvoBank: An evolutionary game solution for bankruptcy problem. Swarm Evol. Comput. 2021, 67, 100959. [Google Scholar] [CrossRef]
- Cheng, L.; Liu, G.; Huang, H.; Wang, X.; Chen, Y.; Zhang, J.; Meng, A.; Yang, R.; Yu, T. Equilibrium analysis of general n-population multi-strategy games for generation-side long-term bidding: An evolutionary game perspective. J. Clean. Prod. 2020, 276, 124123. [Google Scholar] [CrossRef]
- Yin, L.; Li, S.; Gao, F. Equilibrium stability of asymmetric evolutionary games of multi-agent systems with multiple groups in open electricity market. IEEE Access 2020, 8, 28970–28978. [Google Scholar] [CrossRef]
- Yang, H.; Mo, J. Stochastic evolutionary game of bidding behavior for generation side enterprise groups. Dianwang Jishu Power Syst. Technol. 2021, 45, 3389–3397. [Google Scholar]
- Tang, J.; Liu, X.; He, C.; Li, Y.; Zhang, Z.; Li, J.; Lin, Z.; Li, Y.; Qian, H.; Lin, Z.; et al. Design of market liberalizing degree based on the evolutionary game bidding of generators. Energy Rep. 2021, 7, 396–402. [Google Scholar] [CrossRef]
- Yang, P.; Dong, J.; Lin, J.; Liu, Y.; Fang, D. Analysis of offering behavior of generation-side integrated energy aggregator in electricity market: A bayesian evolutionary approach. Energy 2021, 228, 120510. [Google Scholar] [CrossRef]
- Wang, L.; Zheng, J. Research on low-carbon diffusion considering the game among enterprises in the complex network context. J. Clean. Prod. 2019, 210, 1–11. [Google Scholar] [CrossRef]
- Lin, Z.; Xu, H.; Fan, S. Evolutionary accumulated temptation game on small world networks. Phys. A Stat. Mech. Appl. 2020, 553, 124665. [Google Scholar] [CrossRef]
- Wang, Z.; Li, C.; Jin, X.; Ding, H.; Cui, G.; Yu, L. Evolutionary dynamics of the interdependent security games on complex network. Appl. Math. Comput. 2021, 399, 126051. [Google Scholar] [CrossRef]
- Li, F.; Cao, X.; Sheng, P. Impact of pollution-related punitive measures on the adoption of cleaner production technology: Simulation based on an evolutionary game model. J. Clean. Prod. 2022, 339, 130703. [Google Scholar] [CrossRef]
- Ghazvini, M.A.F.; Ramos, S.; Soares, J.; Castro, R.; Vale, Z. Liberalization and customer behavior in the portuguese residential retail electricity market. Util. Policy 2019, 59, 100919. [Google Scholar] [CrossRef]
- Kharrati, S.; Kazemi, M.; Ehsan, M. Equilibria in the competitive retail electricity market considering uncertainty and risk management. Energy 2016, 106, 315–328. [Google Scholar] [CrossRef]
- Jordehi, A.R.; Tabar, V.S.; Mansouri, S.A.; Nasir, M.; Hakimi, S.M.; Pirouzi, S. A risk-averse two-stage stochastic model for planning retailers including self-generation and storage system. J. Energy Storage 2022, 51, 104380. [Google Scholar] [CrossRef]
- Yang, J.; Zhao, J.; Wen, F.; Dong, Z.Y. A framework of customizing electricity retail prices. IEEE Trans. Power Syst. 2018, 33, 2415–2428. [Google Scholar] [CrossRef]
- Zhao, C.; Zhang, S.; Wang, X.; Li, X.; Wu, L. Game analysis of electricity retail market considering customers’ switching behaviors and retailers’ contract trading. IEEE Access 2018, 6, 75099–75109. [Google Scholar] [CrossRef]
- Kang, K. Analysis of evolutionary process of fog computing system based on BA and ER network hybrid model. Evol. Intell. 2020, 13, 33–38. [Google Scholar] [CrossRef]
- Ma, K.; Wang, C.; Yang, J.; Hua, C.; Guan, X. Pricing mechanism with noncooperative game and revenue sharing contract in electricity market. IEEE Trans. Cybern. 2019, 49, 97–106. [Google Scholar] [CrossRef]
- Hase, R.; Shinomiya, N. An evolutionary game for analyzing switching behavior of consumers in electricity retail markets. IEICE Trans. Fundam. Electron. Commun. Comput. Sci. 2020, E103A, 407–416. [Google Scholar] [CrossRef]
- Li, K.; Szolnoki, A.; Cong, R.; Wang, L. The coevolution of overconfidence and bluffing in the resource competition game. Sci. Rep. 2016, 6, 21104. [Google Scholar] [CrossRef] [Green Version]
- Li, K.; Cong, R.; Wu, T.; Wang, L. Bluffing promotes overconfidence on social networks. Sci. Rep. 2014, 4, 5491. [Google Scholar] [CrossRef] [Green Version]
- Hu, Y.; Wang, Z.; Li, X. Impact of policies on electric vehicle diffusion: An evolutionary game of small world network analysis. J. Clean. Prod. 2020, 265, 121703. [Google Scholar] [CrossRef]
- Fang, Y.; Wei, W.; Mei, S.; Chen, L.; Zhang, X.; Huang, S. Promoting electric vehicle charging infrastructure considering policy incentives and user preferences: An evolutionary game model in a small-world network. J. Clean. Prod. 2020, 258, 120753. [Google Scholar] [CrossRef]
| Publisher’s Note: MDPI stays neutral with regard to jurisdictional claims in published maps and institutional affiliations. |
© 2022 by the authors. Licensee MDPI, Basel, Switzerland. This article is an open access article distributed under the terms and conditions of the Creative Commons Attribution (CC BY) license (https://creativecommons.org/licenses/by/4.0/).


