Abstract
The iron and steelmaking industry faces the dilemma of the need to decrease their greenhouse gas emissions to align with decarbonization goals, while at the same time fulfill the increasing steel demand from the growing population. Replacing fossil coal and coke with biomass-based carbon materials reduces the net carbon dioxide emissions. However, there is currently a shortage of charcoal to fully cover the demand from the iron and steelmaking industry to achieve the emission-reduction goals. Moreover, the transportation and energy sectors can compete for biofuel usage in the next few decades. Simultaneously, our society faces challenges of accumulation of wastes, especially wet organic wastes that are currently not reused and recycled to their full potentials. Here, hydrothermal carbonization is a technology which can convert organic feedstocks with high moisture contents to solid fuels (hydrochar, one type of biochar) as an alternative renewable carbon material. This work studied the differences between a hydrochar, produced from lemon peels (Lemon Hydrochar), and two types of charcoals (with and without densification) and an Anthracite coal. Characterizations such as chemical and ash compositions, thermogravimetric analyses in nitrogen and carbon dioxide atmospheres, scanning electron microscope analyses of carbon surface morphologies, and pyrolysis up to 1200 °C were performed. The main conclusions from this study are the following: (1) hydrochar has a lower thermal stability and a higher reactivity compared to charcoal and Anthracite; (2) densification resulted in a reduction of the moisture pickup and CO2 reactivity of charcoal; (3) pyrolysis of Lemon Hydrochar resulted in the formation of a large amount of tar (17 wt%) and gas (39 wt%), leading to its low fixed carbon content (27 wt%); (4) a pyrolyzed hydrochar (up to 1200 °C) has a comparable higher heating value to those of charcoal and Anthracite, but its phosphorous, ash, and alkalis contents increased significantly; (5) based on the preliminary assessment, hydrochar should be blended with charcoal or Anthracite, or be upgraded through slow pyrolysis to fulfill the basic functions of carbon in the high-temperature metallurgical processes.
1. Introduction
The iron and steelmaking industry is one of the backbones needed to support global economic growth. It is, however, one of the most energy- and carbon-intensive industries, representing 20% of the energy consumed and 26% of the CO2 emitted by the worldwide industrial sector [1]. Today, crude steel could be produced by four different routes: (1) blast furnace/basic oxygen furnace (BF-BOF), (2) secondary steelmaking by melting scrap in the electric arc furnace (EAF), (3) direct reduction/electric arc furnace (DRI/EAF), and (4) smelting reduction/basic oxygen furnace (SR-BOF). These four routes each releases 1.95–2.50, 0.4, 1.32–1.37, and 2.4 t-CO2 per t-crude steel produced, respectively [2]. The iron and steelmaking industry (ISI) of the European Union (EU) generated 4.7% of the EU’s CO2 emissions in 2016 [3]. The Energy Roadmap 2050 of the EU calls for an 80% reduction of CO2 emissions compared to the 1990 level [1]. Today in the EU, approximately 60% of the steel is produced via the BF-BOF route while the remaining 40% is produced via the EAF route [4]. The availability of scrap limits the potential to reduce CO2 emissions by switching from a BF-BOF-based steelmaking to an EAF-based [5]. Some new breakthroughs in the iron and steelmaking processes which are currently investigated by the European ULCOS (Ultra-Low CO2 Steelmaking) project [3] have shown great CO2 reduction potentials when carbon capture storage technologies (CCS) are incorporated. For instance, top gas recycling in a BF, smelting reduction (HIsarna), and production of DRI using natural gas (ULCORED), were projected to bring about 52%, 80%, and 54% of reductions in CO2 emissions per ton of hot metal produced compared to production with a conventional European BF when CCS was coupled with these processes. The production of DRI using hydrogen and iron electrolysis (ULCOlysis) are also low-CO2 emission ironmaking processes, which are under development in the ULCOS project [3]. However, these breakthrough technologies would likely remain a minor portion of worldwide steel production by 2050, due to the large capital investment to retrofit existing BF and DRI production facilities, and the lack of technological readiness of some processes (such as HIsarna and ULCOlysis) [6].
Replacing fossil coal and coke with biomass-based products is one of the short- to medium-term solutions to reduce net CO2 emissions, since biomasses are carbon neutral [1,7]. Charcoal is by far the most studied renewable carbon source due to its high carbon content and calorific value, which makes it thermally interchangeable with coke [8]. Additionally, charcoal has lower ash and sulfur concentrations than most fossil coal and coke [6], which is beneficial for reducing the slag rate and impurities transfer to the melt in the BF. To date, the maximum substitution rates of charcoal for coal and coke in the BF and EAF processes are more or less understood. For example, charcoal can be added to a coal blend up to 5% for cokemaking [8], be blended with coke breeze up to 25% for iron ore sintering [9], be used as a replacement for nut coke in BF up to 100% [6], replace pulverized injection coal up to 100% [10], and replace coal in the form of carbon composite agglomerates that are top-charged into a BF [11] or reduced into DRI [12,13,14]. In the EAF, successful industrial trials of using charcoal as a charged carbon [15] and as a recarburizer [16] to fully replace pet coke and Anthracite have also been proven to be feasible. Norgate et al. [17] reported that the life cycle CO2 emissions of sinter-based BF-BOF and mini-mill EAF steelmaking could be reduced by up to 57% and 11%, respectively, if charcoals are utilized to their maximum technological limits in the respective processes, without accounting for by-product credits.
The barriers for charcoal deployment in the ISI are its high price (up to 377–512 EUR/t in the EU [2]) relative to the fossil-based carbon materials (coke: 350 EUR/t [18], pulverized coal (PC): 150–200 EUR/t [18], Anthracite: 150–200 EUR/t [15]), shortage of its supply, and relatively long renewal period. While studies have shown that some EU countries, such as Sweden [7] and Finland [18], could produce sufficient amounts of charcoal to cover the demand from their own ISIs, this may not be true for other EU members. In 2021, the EU produced only a quarter (0.25 Mt) of the charcoal consumed on an annual basis (1 Mt), while the rest were imported from Ukraine, Cuba, Russia, and other countries [19]. Moreover, the renewal period of charcoal is relatively long, which partially influences its availability. Eucalyptus grandis, a common fast-growing tree specie for industrial wood supply, typically requires 5–7 years to grow before harvest [20]. Therefore, the availability of alternative renewable carbon materials, preferably with lower costs, shorter renewal periods, and that could be produced locally within EU, is expected to lower the barriers for biomass deployment in the ISI to realize its full potential for fossil CO2 emissions reductions.
Hydrothermal carbonization (HTC) is a thermochemical conversion technology of biomasses which takes place in sub-critical water using temperatures of 120–300 °C and pressures of 2–10 MPa [21]. The products generated from HTC include carbon-concentrated solids (hydrochar), liquid (bio-crude), and gases (mostly CO2), with typical yields of 45–70%, 5–25%, 2–5% of the wet biomass weight, respectively [22]. Hydrochar is a porous material rich in oxygenated functional groups, which makes it suitable for applications such as absorbents for wastewater treatment, soil amelioration, catalyst, and production of supercapacitors [23,24]. Hydrochar is also a coal-like material with compositions similar to that of lignite or bituminous coal [25]. Thus, it has the potential to be used as a green coal in the ISI. The bio-crude in the process water of HTC is rich in nutrients (nitrogen, phosphorous, potassium) and other valuable elements, which could be recovered for production of fertilizers and chemicals [26].
Since HTC is based in water, no pre-drying of feedstock is required. This makes HTC especially suitable for handling wet organic wastes (>80 wt% moistures) such as sewage sludge, digestates, organic fraction of municipal solid wastes, and food wastes [27] which are otherwise energy-consuming when treated with slow pyrolysis or torrefaction [28]. The EU generates large amounts of bio-wastes annually, which consist of 76.5–102 Mt food and garden wastes in the mixed municipal solid waste, 37 Mt food and drink industry wastes, and around 700 Mt of agricultural wastes [27]. Currently, only 40% of these wastes are composted or anaerobically digested [29], while the rest are incinerated for energy recovery, landfilled, or in some cases directly burnt in the field [27]. Landfilling of biodegradable wastes, including bio-wastes, resulted in 3% of greenhouse gas emissions of EU28 in 2019 [30], which is almost comparable to the emissions coming from the ISI in the EU. The Waste Framework Directive of the EU set a target to recycle or reuse at least 65% of bio-waste by 2035 [31]. Today, hydrochar is priced as low as EUR 170/t [32], and is produced on a commercial scale in the EU [33]. Therefore, HTC could be a great solution in regards to: (1) facilitating a circular economy by converting bio-wastes, a biomass resource that is renewed on an annual basis by large quantities, into hydrochar and bio-crude which has added values in various industries; (2) mitigating the fossil CO2 emissions from the ISI (by the use of hydrochar as a green carbon) and from bio-waste disposal (landfilling and burning); and (3) complementing charcoal for substitution of fossil coal and coke in the ISI to resolve charcoal’s limited availability and relatively high prices in the EU.
However, at which percentages hydrochar could substitute fossil coal or coke in various processes in the ISI remains in question. Most studies concerning application of hydrochar in the ISI focused on the BF process. Due to the low ignition point, low calorific value, and high explosiveness of hydrochar, it is acknowledged that hydrochar could not completely replace coal (such as PC and Anthracite) for BF tuyere injection [34]. Therefore, many researchers have studied the effect of mixing hydrochar with coal at different ratios [35,36,37,38,39,40,41,42,43]. Some researchers performed thermogravimetric analyses to simulate the combustion process of mixtures of hydrochar and coal during BF tuyere injection [35,37,41,43]. These studies all concluded that the addition of hydrochar to the mixture lowered the activation energies of combustion for both hydrochar and coal in the blend. Three studies [35,37,41] concluded that the optimal amount of hydrochar in the blend with Anthracite for BF injection should be 60%, which corresponded to the lowest overall activation energy for combustion. However, Wang et al. [38] recommended that the amount of hydrochar in the blend with Anthracite should not exceed 30% so that the blend is not explosive. They also pointed out that the high phosphorous concentration of the hydrochar in their study (2.489 wt%) could potentially deteriorate the quality of the hot metal. Hernandez et al. [34] suggested that the good combustion characteristics, low ash, and low sulfur concentrations of hydrochar were its main advantages for BF injection compared to Anthracite. Researchers who performed numerical modeling of co-injection of hydrochar and coal into the tuyere of a BF [36,40] found that the addition of hydrochar to the blend had three main advantages: (1) higher gas acceleration in the tuyere region due to a large amount of volatile matter released by hydrochar, which was beneficial for gas development at the center of a BF, (2) marginal improvement in the burnout of Anthracite or PC in the raceway region (6–8%), and (3) higher mass fraction of CO gas at the center of a BF due to the rapid gasification of hydrochar, which was beneficial for reduction of ferrous burden in the BF. However, due to the lower calorific value of hydrochar, the maximum temperature in the raceway region was reported to decrease by 100 K with every 25% increase in the addition of hydrochar to the coal blend [40].
Apart from BF tuyere injection, Jarnerud et al. [44] studied the feasibility of using hydrochar as a reducing reagent for the BF process. Hydrochar briquettes (2 wt% hydrochar, 12 wt% cement, and 86 wt% in-plant fines) were prepared and top-charged into a BF to substitute 10–40% of the conventional top-charged pellets (8 wt% cement, 92 wt% in-plant fines) for six experimental trials (1 day per trial). Although no significant fuel saving was achieved during the experimental trials, most BF technological parameters such as the hot metal production rate, slag rate, dust rate, and phosphorous concentration of the hot metal during these trials were similar to the results obtained from the four reference trials using 100% conventional pellets. This proved that top-charging of hydrochar into a BF at such rates of addition was feasible without disrupting the normal production. However, the mechanical strengths of the hydrochar briquettes were reported to be below the acceptable level for the specific BF. The briquettes’ strengths should be improved before running long-term BF trials. Additionally, the extent to which hydrochar briquettes impacted the reactivity of the BF burden could not be determined during the short-term trials, which should be investigated further in the future.
Hydrochar was also tested as a recarburizer for the steel melt under the GREENEAF2 project [15]. The carburization efficiency of hydrochar was reported as 40%. However, hydrochar was not used during subsequent industrial EAF trials for safety reasons due to its tendency to ignite at low temperatures.
As far as the authors are aware of, the research regarding the application of hydrochar in the ISI is still in its early stage. It is believed that an overall assessment of hydrochar for different applications in the ISI, and a comparison with other common biocarbon and fossil carbon materials would be beneficial for laying the fundamental knowledge for hydrochar’s future application in any process, especially in the EAF. Carbon serves four fundamental purposes in the ISI: (1) as a solid fuel for providing heating energy, (2) as a reducing reagent for iron oxides or liquid slag, (3) as a carburizer of melt, and (4) as a load-bearing component in the BF to ensure gas permeability in the stack. Therefore, the aim of this study is to investigate and compare the performance of four carbonaceous materials with respect to the four fundamental functions of carbon in the ISI. The materials studied include (1) a hydrochar produced from lemon peel as a representative of a food-waste-derived hydrochar, (2) two charcoals obtained at different pyrolysis temperatures, and (3) Anthracite, a commonly used high-rank coal in European EAFs today. Based on the comparison, future prospects of hydrochar in the ISI is discussed.
2. Materials and Methods
2.1. Materials
The four carbonaceous materials examined in this study were Anthracite, Charcoal 1, Charcoal 2, and Lemon Hydrochar. Anthracite is a high-rank (fossil) coal, commonly used in the Swedish steel industry for EAF steelmaking. It was therefore used as a reference material for comparison with biomass-based carbon materials. Charcoal 1 is a commercial barbeque charcoal sourced from a European manufacturer. The original feedstock was heartwood harvested from European deciduous forest. It was pyrolyzed at approximately 400–500 °C for 24 h in a nitrogen atmosphere. The char from the pyrolysis was then densified using stiff extrusion and subsequently milled into fine powder. Charcoal 2 is pyrolyzed wood chips from a district heating company in southern Sweden. Its pyrolysis condition was 700–750 °C for 5–10 h in a nitrogen atmosphere. Lemon Hydrochar was produced by HTC of lemon peels under a pressure of 20 bar and at a temperature of 210 °C by Ingelia (Valencia, Spain). Photos of the carbonaceous materials are shown in Figure 1. Proximate analyses and ultimate analyses of materials are shown in Table 1. Since steam is not condensed in the off-gases in the BF and EAF processes, the heat to evaporate water generated during combustion of carbon fuel cannot be recovered. Therefore, the lower heating value (LHV) was used as an indicator of the heating energy which could be released by the carbon material, which was calculated using the following equation [45]:
where is the enthalpy difference between gaseous and liquid water at 25 °C, taken as 2441 kJ/kg [45]. The parameters and refer to the hydrogen and moisture concentrations of the material. HHV denotes the higher heating value of the carbon material, and was calculated as follows [45]:
where , , , , and denote the concentration of C, S, N, O, and ash in weight percentages of the carbon material. P concentration of the carbon material was calculated by multiplying the weight fraction of P2O5 in ash by the weight percentage of P in P2O5. Since the moisture concentration of Charcoal 2 is very high, it must be dried before application. It was assumed that it had the same moisture content as Charcoal 1 after drying. Thus, the moisture content of Charcoal 1 was used for calculation of the LHV of Charcoal 2. The densities of Charcoal 1, Charcoal 2, and Lemon Hydrochar had been measured in Part 2 of this work [46]. The density of Anthracite was measured by using the same method as in [46], and the values are shown in Table 1.
HHV (kJ/kg) = 349.1∙(%C) + 1178.3∙(%H) + 100.5∙(%S) − 103.4∙(%O) − 15.1∙(%N) − 21.1∙(%Ash)
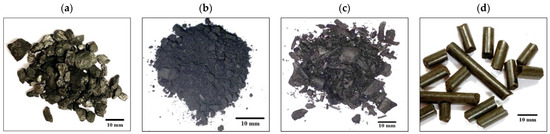
Figure 1.
Photographs of carbonaceous materials; (a) Anthracite; (b) Charcoal 1; (c) Charcoal 2; (d) Lemon Hydrochar.

Table 1.
Proximate and ultimate analyses of carbonaceous materials (in wt%).
The ash analyses of the carbon materials are shown in Table 2. The alkalis concentrations of the carbon materials in Table 1 were calculated by multiplying the sum of the weight fractions of Na2O and K2O in the ashes by the ash weight percentage of the carbon material [1].
Table 2.
Ash analysis of carbonaceous materials (in wt% of ash).
2.2. Characterization of Carbonaceous Materials
For investigations of the surface morphologies of the carbon materials, a scanning electron microscope (SEM) (Hitachi S-3700N) equipped with a Bruker AXS XFlash Detector 4010 (Billerica, MA, USA) was used. Approximately 1 g of carbon powder was dried in an oven at 105 °C for 2 h prior to analysis. The carbon powder was fixed onto a steel sample holder using a copper tape, and its surface was subsequently coated with Au/Pd. An acceleration voltage of 15 kV and working distances of 8–11 mm were used for taking images.
When carbonaceous materials are charged into a high-temperature environment in any iron and steelmaking process, they go through a series of steps of dehydration (to release both the unbound and bound moistures), devolatilization, and finally, a competition of combustion (reaction with O2) and gasification (reaction with CO2) until the carbon is completely exhausted [47]. The volatile matter released by carbon materials contains H2, CH4, and CO, which are reducing gases and combustion fuels. Therefore, it is important to evaluate within which temperature intervals the volatiles are released and in which amount in order to understand the carbon material’s interaction with a specific process. In addition, the reaction rates of carbon materials with CO2 at high temperatures have important implications regarding their suitability as a coke replacement in the BF. Therefore, different characterizations of carbon materials were carried out in inert (N2) and CO2 atmospheres, with the specific experimental conditions summarized in Table 3.
Table 3.
The aims and experimental conditions for characterization of carbonaceous materials.
The following sections provide detailed descriptions of each experiment.
2.2.1. Nonisothermal Thermogravimetric Analysis in Nitrogen Atmosphere (TGA-N2)
Nonisothermal thermogravimetric analyses (TGA-N2) in nitrogen atmosphere were conducted with a Netzsch 449 F1 Jupiter simultaneous thermal analyzer (STA). A total of 10–30 mg of carbon powder was placed in an alumina crucible (85 μL capacity). The furnace chamber was flushed with nitrogen at a constant flow rate of 50 mL/min throughout the experiments. The sample was first heated to 105 °C and kept for 30 min to evaporate moisture. The sample was then heated up to 1000 °C at two different heating rates, at 10 K/min and 50 K/min, respectively, up to 1000 °C. The final temperature was selected as 1000 °C since most biomass materials completely devolatilize below this temperature [15]. Additionally, 10 K/min is a typical heating rate for TGA analysis and it is used as a reference. TGA-N2 at 50 K/min was conducted to investigate if there was any effect of the heating rate on the devolatilization behavior of the carbon materials. It was assumed that the data obtained at 50 K/min would better simulate the devolatilization behavior of iron–carbon briquettes during pilot carburization experiments in Part 2 of this work [46]. From TGA-N2 experiments, the changes in samples’ weight as a function of temperature were obtained.
2.2.2. Pyrolysis in Nitrogen Atmosphere (py-N2)
Since TGA-N2 only measured the weight loss of carbon material and does not reveal the composition of the lost weight, pyrolysis (py-N2) of carbon materials was performed to supplement the TGA-N2 analyses. Carbon materials (10–30 g) were heated in a nitrogen atmosphere from room temperature up to 1200 °C using the same heating rate as in TGA-N2 (50 K/min). The aim was to collect the volatile matter as well as the remaining solid after pyrolysis and measure their chemical compositions. This allows an analysis of the distribution of elements in different pyrolysis products. The carbon concentration in the remaining solid is especially important, since it determines the amount of carbon that is available for high-temperature reactions such as combustion, Boudouard reaction (>700 °C [48]), carburization (>1150 °C [49]), and slag foaming (>1600 °C [50]). Larger amounts of carbon materials were used during the py-N2 experiments than during the TGA-N2 experiments to reduce the error from weight measurements. The final temperature of py-N2 experiments was selected as 1200 °C to compensate for the heat transfer losses in the furnace, and to ensure that a complete devolatilization of the carbon materials had taken place. It was confirmed that all carbon materials reached above 1000 °C during the experiments. The experimental setup for py-N2 is shown in Figure 2.
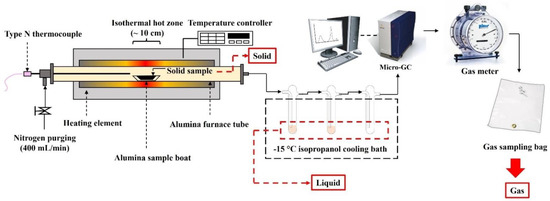
Figure 2.
Schematic illustration of the experimental setup for pyrolysis of carbonaceous materials.
Prior to the experiment, the carbon material was hand-ground to fine powder and sieved to a size smaller than 1 mm. The carbon powder was then dried in a drying oven at 105 °C for 12 h. Thereafter, the dried powder was weighted and placed in an alumina boat. The boat was inserted into the calibrated hot zone of the furnace to ensure temperature uniformity in the sample during the experiments. A thermocouple was placed in close proximity to the alumina boat to monitor the sample’s temperature during the experiment. The furnace gas outlet was connected to three empty gas-washing bottles for collection of condensable volatile matters (“liquid”) generated during pyrolysis. The weights of the three bottles were measured before each experiment, and were immersed in a −15 °C polypropylene bath during the experiment for an effective condensation. The non-condensable volatile matters (“gas”) which left the gas-washing bottles first passed through a micro-gas chromatography (micro-GC, 490 Micro GC System QUAD, Agilent, Santa Clara, CA, USA) for online gas composition analysis, and subsequently through an analogue gas meter for measurement of instantaneous gas flow rate. The gases were finally collected in gas-sampling bags for post-analyses of the gas compositions. The total volume of gases generated during the experiment could also be obtained from the gas meter.
Before the beginning of an experiment, the furnace with the sample was flushed with nitrogen at room temperature for 30 min to expel oxygen. Then, the furnace was heated up to 1200 °C at a heating rate of 50 K/min. The sample was kept at this maximum temperature for an hour. Then, the sample was slowly cooled in the nitrogen atmosphere down to the room temperature to prevent carbon oxidation. A constant nitrogen flow rate of 400 mL/min was maintained throughout the experiment. Afterwards, the alumina boat was taken out of the furnace and weighed. The residual char which remained in the boat was denoted as “solid”. The three gas-washing bottles were weighted after the experiment, and the sum of the weight differences of the bottles was determined as the amount of liquid collected during pyrolysis. Thereafter, the liquid in the bottles was thoroughly removed by rinsing with acetone. The liquid extract was then left in air for 24 h for evaporation of acetone. Typically, two or three 25 L gas-sampling bags were filled during each experiment. To obtain the overall gas compositions, the gases in each gas-sampling bag were analyzed 20 times using the micro-GC. The overall gas composition was subsequently computed from the average of the 40–60 analyses. The total weight of the collected gases was calculated from the sum of the volume of each gas multiplied by its density at 25 °C. The weight of nitrogen carrier gas was excluded. Mass balance was performed for all experiments and the error was between 3% and 10%.
The carbon concentrations of the solid and liquid were analyzed with an element analyzer (elementar vario EL cube). Each material was analyzed 5 times at an amount of 0.5 g each time. Overall composition was computed from the average of 5 analyses. Carbon concentration of the gas phase was calculated from the weight fraction of each gas and the carbon weight fraction in each gas molecule. The error of carbon balance for all experiments was between 2% and 7%. The ash concentration of solid was measured according to the standard ISO 1171, and the ash compositions were determined according to the standard SFS-EN ISO 11885.
2.2.3. Isothermal Reactivity in CO2 (TGA-CO2)
The isothermal reactivities of carbon materials in the CO2 atmosphere were evaluated according to the ISO-18894 standard, used for measurement of coke reactivity index (CRI). A total of 100 g of carbon materials were ground and sieved to particle sizes of 1–4 mm. The sample was first heated up to 1100 °C at a heating rate of 15 K/min using a nitrogen flow rate of 2.5 L/min. After reaching 1100 °C, the gas was switched to CO2 at a flow rate of 2.5 L/min. Thereafter, the sample was kept at this temperature for two hours. The experimental procedure is shown schematically in Figure 3. The parameters for comparison of reactivity of different carbon materials include conversion, gasification reactivity (), and average gasification rate (). The conversion at the end of gasification experiment () was calculated as follows [51]:
where and are the weight of the sample at the beginning and at the end of gasification, respectively. is also denoted as CRI. The R0.5 value was calculated as follows [52]:
where and are the time corresponding to the moment where the sample has lost half of its fixed carbon content, and the time at the beginning of gasification, respectively. The parameter was calculated as:
where denotes the time at the end of gasification.
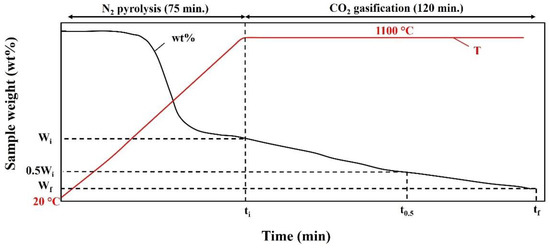
Figure 3.
Schematic illustration of the procedure for measuring isothermal CO2 reactivities of the carbonaceous materials.
3. Results and Discussions
3.1. Characterization of Carbonaceous Materials
3.1.1. Compositions of Carbonaceous Materials
The chemical compositions of the four carbonaceous materials in this study and those from previous publications are plotted in Figure 4.
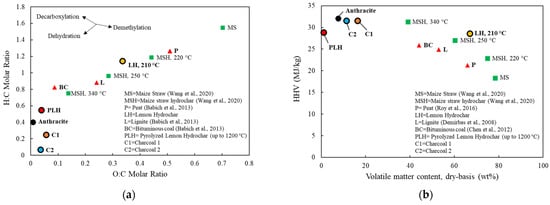
Figure 4.
(a) Van Krevelen diagram of carbon materials in the present study and in [25,53]; (b) volatile matter contents and HHV of carbon materials in this study and in [25,54,55,56].
From Figure 4a, it could be seen that Lemon Hydrochar is a medium carbon-containing (compared to raw biomass and Anthracite) and highly volatile carbonaceous material with a medium HHV. Its coalification degree lies in between lignite (a low rank coal) and peat (a coal precursor). Its low degree of coalification was likely due to the low HTC temperature used. As can be seen from the example with maize straw hydrochar in Figure 4, the H and O concentrations in the hydrochar gradually decreased after a series of dehydration, decarboxylation, and demethylation reactions with increasing HTC temperatures. This, in turn, led to an increase in its degree of coalification and HHV.When maize straw was hydrothermally carbonized at 340 °C, its HHV is comparable to a bituminous coal. Both charcoals had low H and O concentrations and high HHVs, which were more similar to Anthracite. Charcoal 1, which was pyrolyzed at a lower temperature, had slightly higher H and O concentrations compared to Charcoal 2.
3.1.2. SEM Analyses of Surface Morphologies of Carbonaceous Materials
SEM images of the surfaces of the four carbonaceous materials are shown in Figure 5. Anthracite particles exhibited flat surfaces with small unevenness. The surfaces of charcoal particles were very smooth. Lemon Hydrochar particles had highly uneven surfaces, likely due to partial degradation of cell walls in the lemon peels [57]. Previous studies have shown that lemon peels consist of cellulose (23.1 wt%), pectin (13 wt%), hemicellulose (8.1 wt%), lignin (7.6 wt%), protein (7.0 wt%), sugar (6.5 wt%), and other organic compounds such as fat, polyphenolics, and extractives [58,59]. According to the literature, glucose (a monomer sugar) can be decomposed above 170 °C, hemicellulose decomposes between 160–180 °C, protein decomposes above 180 °C, cellulose decompose between 200–280 °C, and lignin starts breaking down above 250 °C during HTC [22,60]. Therefore, given the HTC temperature of 210 °C of Lemon Hydrochar, at least a partial degradation of the lemon peels could be expected. This agrees with the visual observation of its surface morphology. Almost no carbon microspheres were found on the surface of Lemon Hydrochar. Carbon microspheres are the characteristic feature of the hydrochar produced from carbohydrate-containing feedstocks, which form from polymerization of hydrolysis products dissolved in the water, which mostly consist of monosaccharides [60]. These carbon microspheres are also known as the secondary char, which primarily consists of acids, furfurals, and phenols which were found to have a low thermal stability and a high HHV [61]. The lower sugar concentration of lemon peels and the low HTC temperature used likely resulted in a low amount of monosaccharides being formed from the hydrolysis of sugars and cellulose, which led to a low amount of secondary char formation. Nonetheless, the HHV of the Lemon Hydrochar is comparable with the HHVs of hydrochars derived from various types of fruit wastes at a HTC temperature of 225 °C (24–26 MJ/kg) [57]. This indicates that the limited degradation and secondary char formation is typical for fruit wastes hydrothermally carbonized at these temperatures.
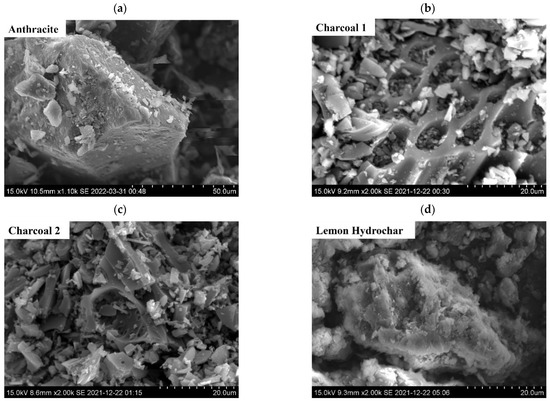
Figure 5.
Scanning electron microscope images of: (a) Anthracite; (b) Charcoal 1; (c) Charcoal 2; (d) Lemon Hydrochar.
3.1.3. TGA-N2 Analyses
The results of the TGA-N2 analyses are shown in Figure 6. Some parameters extracted from Figure 6 are summarized in Table 4 to enable an easier comparison and analysis.

Figure 6.
Weight-loss profiles of carbon materials during thermogravimetric analyses (TGA-N2) at heating rates 10 K/min and 50 K/min: (a) Anthracite; (b) Charcoal 1; (c) Charcoal 2; (d) Lemon Hydrochar.
Table 4.
Volatile matter (VM) released in different temperature intervals during TGA-N2 experiments (in wt% of carbon material).
From Figure 6, it can be seen that the Lemon Hydrochar was the most reactive out of the four tested carbonaceous materials. Its maximum weight-loss rate was 71–95 times higher than that of Anthracite, 7–10 times of that of Charcoal 1, and 7–14 times of that of Charcoal 2. From Table 4, it can be seen that the volatile matter of Lemon Hydrochar was released the most intensively in the temperature range of 300–400 °C, which coincides with the decomposition temperature range of cellulose during slow pyrolysis [22]. This is not surprising following previous discussions that the hemicellulose in the lemon peels was likely completely hydrolyzed during the HTC process. Thus, the characteristic weight loss of hemicellulose during slow pyrolysis, which occurs between 220–315 °C [62], was barely visible from the TGA weight-loss curve of Lemon Hydrochar. Pectin, another major constituent of lemon peels, had been reported to devolatilize the most intensively around 221 °C during slow pyrolysis. However, its weight-loss peak is also missing from the TGA curve of Lemon Hydrochar [63]. This indicates that pectin must had been partly decomposed during HTC. Studies have found that more than 75% of the pectin in the orange peels could be separated to the water at a HTC temperature as low as 120 °C [64]. A commercial pectin was used to produce nanoporous carbon solid at a HTC temperature of 240 °C [65], suggesting that a significant portion of the pectin must have been decomposed at this temperature. Given the HTC temperature of 210 °C for Lemon Hydrochar, there might be some pectin which remained undecomposed. The second highest amount of volatiles evolved from Lemon Hydrochar between 400–700 °C, which was likely due to the degradation of lignin and continued carbonization of pectin. The decomposition of lignin during slow pyrolysis was found to occur gradually over a wide temperature range (150–900 °C), unlike hemicellulose and cellulose that had very sharp and distinct weight-loss peaks [62]. From the literature, pyrolysis of lignin and pectin both generate a weight-loss peak around 650 °C [62,63], which was also observed from the TGA profile of the Lemon Hydrochar. Therefore, the lignin and pectin decomposition may be the cause of devolatilization of Lemon Hydrochar at higher temperatures.
On the other hand, the two charcoals and Anthracite showed very high thermal stabilities and mostly devolatilized above 500 °C. An exception was the low-temperature weight-loss peak observed in Charcoal 1 at around 300 °C, which was likely due to devolatilization of starch that was added as a binder during its densification process [66].
Overall, the use of a higher heating rate caused the devolatilization of carbonaceous materials to shift to higher temperatures due to a thermal lag effect that is commonly encountered during TGA analyses [67]. The magnitudes and the corresponding temperatures of the weight-loss peaks obtained from the two heating rates were still very similar. This indicates that by raising the heating rate by a factor of five from 10 K/min to 50 K/min, the decomposition and devolatilization mechanisms of the carbonaceous materials were not significantly modified.
It is interesting to note that although the moisture content of Charcoal 2 was determined to be 66.8 wt% based on the proximate analysis, Charcoal 2 did not exhibit a significant weight loss below 300 °C during TGA-N2. The reason was that the materials used for the proximate analysis were in bulk pieces, which contained plenty of pores in the wood structure that enabled moisture absorption. After Charcoal 2 was ground to fine particles for TGA analyses, the moisture evaporated rapidly. Therefore, the particle size significantly influenced the moisture concentration of charcoal. Charcoal 1 had a lower moisture content (7.1 wt%) compared to Charcoal 2 determined from the proximate analysis since it had been densified and milled to fine powder, during which part of the wood structures were destroyed.
3.1.4. py-N2 Analyses
The weight fractions of solid, liquid, and gas collected from pyrolysis of carbonaceous materials are shown in Table 5.
Table 5.
Results from pyrolysis of carbonaceous materials (py-N2) at 50 K/min up to 1200 °C (in wt% of material before pyrolysis).
It can be seen that the volatile matter of Anthracite and the charcoals mostly consisted of gases and small amounts of water-soluble liquids (aqueous phase). On the other hand, the volatiles of Lemon Hydrochar consisted of pyrolysis gases, tar, and a small amount of water-soluble liquid. Slow pyrolysis of cellulose mostly generated liquid (60.1–63.1 wt%) and gases (29.6–32.5 wt%), and its solid yield was typically very low (7.22–7.41 wt%) [68]. On the other hand, the solid (35–44 wt%), liquid (14–21 wt%), and gas yield (41–44%) from slow pyrolysis of lignin was very different from that of cellulose [69]. It may be inferred that the residual solid from pyrolysis of Lemon Hydrochar mostly consisted of remaining fragments of lignin after decomposition. Meanwhile, the tar most likely contained products from decomposition of cellulose and other constituents in the lemon peels, such as lignin, pectin, and polyphenolic compounds. The compositions of the solids obtained from py-N2 are shown in Table 6. The LHVs of solids were computed according to Equation (1) assuming zero moisture contents.
Table 6.
Compositions of solid components from pyrolysis of carbon materials up to 1200 °C (in wt% of solid).
By comparing the volatile matter contents of the four carbonaceous materials determined by different methods, i.e., (1) proximate analyses (in Table 1), (2) sum of sample weight losses up to 1000 °C during TGA-N2 (in Table 4), and (3) the sum of liquid and gas fractions during py-N2 (in Table 5), it can be concluded that the results obtained from proximate analyses and py-N2 experiments agreed with one another. The volatile matter contents determined by py-N2 experiments deviated between 6–11% from that by proximate analyses for all carbon materials. However, there were larger disagreements between the volatile matter contents determined by proximate analyses and TGA-N2 experiments. The volatile matter contents measured by TGA-N2 were found to deviate from those determined by proximate analyses by 4–44%, 12–35%, 62–66%, and 5–6%, respectively, for Anthracite, Charcoal 1, Charcoal 2, and Lemon Hydrochar, taking into account the TGA-N2 data from both heating rates. The large deviations could be caused by the higher errors in weight measurements during TGA-N2 experiments due to the small sample size used (10–30 mg) compared to larger amounts of samples used for proximate analyses (1 g) and py-N2 experiments (10–30 g). The variations in volatile matter contents determined by different techniques were the lowest for Lemon Hydrochar. This was likely due to its inherently high volatile content, which reduced the error in weight measurements. It may be inferred that by using a sample size heavier than 1 g, the volatile matter content and char yield could be determined more accurately regardless of the type of carbon material analyzed.
The carbon concentrations of Anthracite and the two charcoals slightly increased from their initial compositions, between 1.3 and 7.6 wt%, which was a result of the removal of O and H during devolatilization. The carbon concentration in Lemon Hydrochar increased dramatically from the initial 59.8 wt% up to 85 wt%. The H and O concentrations of Lemon Hydrochar decreased after pyrolysis, mostly due to decomposition of cellulose, which resulted in an increase in the LHV of the residual solid. However, the impurities in Lemon Hydrochar also became more concentrated after pyrolysis. For example, the S concentration of Lemon Hydrochar increased from 0.074 wt% to 0.23 wt%, and the ash concentration increased from 6.1 wt% to 16.1 wt%. The ash composition of the pyrolyzed Lemon Hydrochar is shown in Table 7.
Table 7.
Ash composition of Lemon Hydrochar after pyrolysis up to 1200 °C (in wt% of ash).
According to the ash composition, the alkalis and P concentrations of the Lemon Hydrochar after pyrolysis was determined as 1.18 wt% and 0.37 wt%, respectively, which were both higher than itsinitial concentrations.
The condensed liquids of Anthracite and the two charcoals were of too small amounts for analysis. Therefore, their chemical compositions were not analyzed. The chemical compositions of aqueous and tarry liquid phases of Lemon Hydrochar and their calculated LHVs are shown in Table 8.
Table 8.
Compositions of aqueous and tarry phase of liquid obtained from pyrolysis of Lemon Hydrochar up to 1200 °C (in wt% of each phase).
From Table 8, it can be seen that the composition of aqueous liquid of Lemon Hydrochar was very close to that of water (11.11 wt% H, 88.89 wt% O), and its carbon concentration was very low (3.77 wt%). The tarry phase of the liquid is rich in carbon and oxygen. The high oxygen concentration of tar might be caused by a low degree of tar cracking, due to its short residence time in the furnace. The tar exited the furnace in the form in which it was generated, known as the primary tar. Primary tar generated from the pyrolysis of lignocellulosic biomasses typically consists of oxygenated compounds such as acids, sugars, alcohols, ketones, aldehydes, phenols, catechols, guaiacols, syringols, and furans [70]. This explains the high oxygen concentration of the tar released by Lemon Hydrochar.
The compositions of pyrolysis gases analyzed from the gas-sampling bags are shown in Table 9. The LHVs of the gases were calculated assuming zero N and S contents.
Table 9.
Total volume of gas and gas composition collected from pyrolysis of carbon materials up to 1200 °C.
It can be seen that Lemon Hydrochar released the highest volume of pyrolysis gases. The gases contained combustibles such as H2, CH4, CO, and other hydrocarbons, which implied a high risk of igniting at low temperatures. The pyrolysis gases of both charcoals mostly consisted of CO and CO2, with additional small fractions of H2, CH4, and other hydrocarbon gases. On the contrary, the pyrolysis gases of Anthracite predominantly consisted of H2, CH4, CO, and some C2H2. The amounts of CO and CO2 evolved from Anthracite were very low compared to the biomass-based carbon materials, which was caused by the low oxygen content in Anthracite. The presence of hydrocarbons in the pyrolysis gases was evidence of decomposition of the liquid phase [70]. Above 500 °C, primary tar cracks into smaller molecules, including the non-condensable light gases (CO2, CO, H2O) and a series of heavier molecules called the secondary tar, which mostly consisted of phenols and olefins [70]. The pyrolysis gases of Lemon Hydrochar especially contained a higher amount of hydrocarbons (7.5 wt%) compared to the other three materials, due to a large amount of liquid formation. However, the cracking occurred for only a small portion of the tar, as a large amount of tar was still condensed and collected.
To understand the distribution of carbon and LHV in different phases obtained from pyrolysis up to 1200 °C, the normalized carbon concentrations and LHVs were calculated as follows:
where denotes the un-normalized quantity and denotes the normalized quantity. The parameter can be the carbon concentration or LHV. is the value of as-received material shown in Table 1. denotes the phase that is either solid, liquid (includes both aqueous and tarry phase), or gas. is the weight fraction of the phase. Since the carbon concentration of the pyrolysis liquids generated by Anthracite and both charcoals were not measured, their normalized values were obtained by subtracting the sum of normalized values in solid and gas from 100%. The normalized carbon concentrations and LHVs of carbon materials are shown in Table 10.
Table 10.
Carbon and LHV distributions of different phases obtained from pyrolysis of carbon materials up to 1200 °C (in %).
From Table 10, it can be seen that the pyrolysis resulted in a carbon redistribution in different phases of the carbon materials. More than 90% of the initial carbon content in Anthracite and both charcoals remained in the solids after pyrolysis, while the remaining 10% of the carbon were present as CH4, CO, CO2, and hydrocarbon gases. On the contrary, only 54% of carbon in the initial Lemon Hydrochar remained in the solid up to 1200 °C. 17% of carbon was present in liquid (mostly in the carbon-rich tar), and 29% was in gas. The LHV distribution mostly followed the carbon distribution since carbon was the main element in each phase. The slight deviations between carbon and LHV distributions were due to the redistributions of H and O in different phases. Detailed normalized carbon percentages of different pyrolysis products of the four carbonaceous materials are shown in Figure 7.
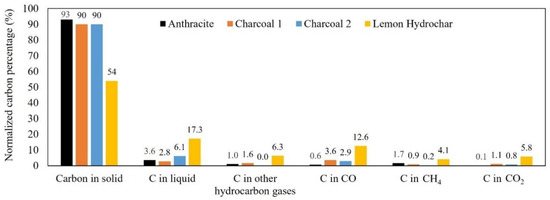
Figure 7.
Normalized carbon percentages of different phases obtained from pyrolysis of carbonaceous materials up to 1200 °C at 50 K/min.
The amount of potential reducing gases that could be released by the four carbonaceous materials based on the results from py-N2 experiments are summarized in Table 11. The reducing gases are either contained in its volatile matter or generated by the reaction of CO2 with the solid carbon. The maximum amount of CO gas (per 100 g of initial carbon material) which could be generated by reaction of CO2 with the carbon in the residual char () is calculated as follows:
where denotes the grams of carbon in residual solid per 100 g carbon material after pyrolysis (up to 1200 °C), and and denote the molecular weight of CO and C, respectively. denotes the conversion factor, which is the actual amount of CO obtained divided by the maximum amount of CO that could be generated. The calculated values, assuming that = 1, are as shown in Table 11 under case (a). The total amount of reducing gases released by each carbon material in Table 11 was calculated by summing the amount of H2, CH4, CO, hydrocarbon gases in the volatile matter, and value shown in the same table. Hydrocarbon gases were included as reducing gases since they could form additional carbon, H2, and CO gases either by cracking or partial oxidation at elevated temperatures. For example, up to 90% of CH4 could be converted into H2 and CO gases by partial oxidation at 800 °C. CH4 can also form pyrolytic carbon and H2 above 1200 °C by thermal cracking without a catalyst [71]. Although tar can form additional reducing gases at temperatures above 500 °C, its conversion depends on the heating rate of the carbon material and the residence of the tar vapor in the process. The kinetics and products of tar reforming were not studied in this work. Therefore, tar is excluded from the present discussion as a useful reducing reagent.
Table 11.
Comparison of the potential amount of reducing reagents released by the four carbonaceous materials (units in g per 100 g carbon material).
Based on Table 11, approximately 3–6 wt% of reducing gases released by both charcoals and Anthracite are contained in its volatile matter, while the rest are generated from gasification of carbon to produce CO. On the other hand, 26 wt% of reducing gases released by Lemon Hydrochar is contained in its volatile matter, while the remaining 74 wt% comes from carbon gasification (if = 1 was assumed). Overall, Charcoal 2 could release the highest total amount of reducing gases, followed by Charcoal 1, Anthracite, and lastly Lemon Hydrochar.
The utilization efficiency of the reducing gases in the volatile matter depends on the temperature, heating rate, and the residence time of the gases in the process. For example, when carbon materials top-charged into a BF or added in a rotary hearth furnace (RHF) for reduction of iron ores, the volatile matters have a relatively short residence time in the reactor. Thus, they would escape the reactor before the temperature is high enough for iron ore reduction. The residence time of gases in the top 5 m of BF was modeled as 3.5 s [69], which severely limits the reaction time of the volatile matter with the iron ores. Sohn and Freuhan [72] conducted reduction experiments using three layers of pellets to simulate a multi-layer pellet bed in a RHF. The volatile matters released by the bottom coal-ore pellets resulted in the reduction degree of the top-layer pellets by, at most, 15% at 1000 °C. When a carbon material is injected into the EAF for slag foaming, the gases are trapped in the liquid slag for a short period of time (0.82–1.85 s [73]). The immediate contact of the volatile matter with the high-temperature liquid slag (1600–1760 °C [50]) may become effective due to the high reduction rates of FeO by reducing gases at this temperature [74]. Kongkarat et al. [75] studied slag foaming with different blends of plastic and coke as carbon materials and observed the foaming process using the sessile drop technique. They reported that the H2 and CH4 gases released by the coke and the plastics participated in slag foaming reactions. Marcos et al. [15] reported that the hydrocarbons released by charcoal did not contribute to slag foaming. They suspected that the volatiles were released before the charcoal particles entered the slag. This shows that the utilization efficiency of the volatile matter is highly sensitive to the method of addition of the carbon materials in a process. However, no studies to date have quantified the amount of the volatile matter which reacts with the slag. A large fraction of the reducing gases released by Lemon Hydrochar is in its volatile matter. Therefore, the utilization efficiency of volatile matter of Lemon Hydrochar for slag foaming is an interesting topic for future studies.
3.1.5. TGA-CO2 Analyses
The weight-loss profiles during TGA-CO2 experiments are shown in Figure 8. The values of CRI, , and of carbon materials are summarized in Table 12.
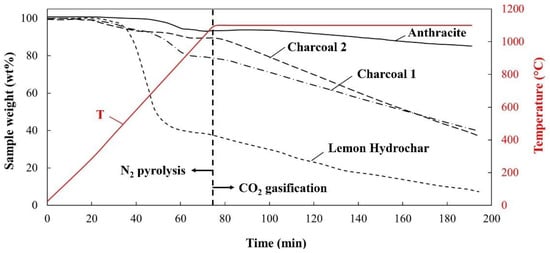
Figure 8.
The weight-loss profiles of carbon materials during isothermal CO2 reactivity measurements (TGA-CO2).
Table 12.
Results from isothermal gasification of carbon materials in CO2 at 1100 °C.
From Table 12, it can be seen that Lemon Hydrochar has the highest CRI value, followed by Charcoal 2, Charcoal 1, and Anthracite. The European BF requires the CRI of top-charged coke to be below 23% to ensure sufficient strength of coke under the attack of CO2 at elevated temperatures [1]. Based on this requirement, the two charcoals and Lemon Hydrochar could not be directly top-charged into a BF on its own. The value of Lemon Hydrochar is two times that of Charcoal 2. The values of Anthracite and Charcoal 1 could not be computed since their conversions were lower than 50% by the end of the experiments. The average CO2 reactivities () of the four carbon materials are, in a decreasing order, as follows: Charcoal 2 > Charcoal 1 > Lemon Hydrochar > Anthracite. The values of of Lemon Hydrochar and Anthracite measured in this study were comparable to values reported in the literature. The CO2 reactivity of herb tea waste hydrochar was reported to be in the range between 0.155–0.188 wt%/min, and Anthracite as 0.03 wt%/min in the work by Zhuang et al. [21]. Densification seemed to have slightly reduced the CO2 reactivity of charcoal by comparing the CRI of Charcoal 1 (49.28%) to that of Charcoal 2 (58.16%), and this effect was also found in [76].
Charcoals and Lemon Hydrochar could be charged into a BF in the form of carbon composite agglomerates (CCA) to overcome their weaknesses of insufficient mechanical strengths. The high values of the three biocarbons imply faster generation of CO gas than Anthracite, which is beneficial for accelerating the reduction of wüstite in the thermal reserve zone (TRZ) in a BF. In addition, the higher CRI values of the three biocarbons could save larger amount of coke in a BF compared to Anthracite. The reason is that they produce larger amounts of CO which could contribute to iron ore reduction given its limited reaction time (2 h in TGA-CO2) with CO2 in the BF. For example, if in Equation (7) is taken as the CRI value measured by the TGA-CO2 experiment, the of Anthracite is significantly reduced, as shown in Table 11 under case (b). This means that when kinetics is taken into consideration, the total amount of reducing gases which could be released by Anthracite could be the lowest among the four carbonaceous materials given the limited carbon gasification time in a BF. However, it should be noted that the experimental parameters used for TGA-CO2 were according to the standard for the measurement of CRI, and do not correspond to the actual conditions in a BF. This may affect the amount of carbon that reacts, and thus, the amount of CO gas that could be generated. The residence time of coke in the BF before it reaches the cohesive zone is typically 4–6 h [77] (compared to 2 h in TGA-CO2), and the CO2 concentration of BF gas in the TRZ is approximately 30% [78] (compared to 100% in the present study). More in-depth investigations are required to compare the reduction performance of the four carbonaceous materials under conditions relevant for a BF operation.
3.1.6. Ash and Impurity Characteristics
Although fulfillment of the basic functions (heating, reduction, carburization, load-bearing) is the most important consideration when selecting and comparing different carbonaceous materials, their ash and impurity contents can in some cases lead to rejection of the material and should considered.
Some ash properties of the carbonaceous materials are shown in Table 13, which were computed with their ash compositions that are listed in Table 2 and Table 7. The fractions of solid and liquid phases of ash at 1600 °C were calculated with FactSage 8.0 [79] to understand the ash melting behavior during carbon dissolution in steel melt. The alkalinity indices of ashes were calculated as follows to understand their catalytic effects on the carbon gasification reaction according to [2]:
where the percentage of each oxide in the ash was taken from Table 2 and Table 7. denotes the weight percentage of ash in the carbonaceous material according to proximate analysis in Table 1 and Table 6.
Table 13.
Computed ash parameters according to ash composition of different carbon materials.
The ash of Anthracite was notably more acidic than the biomass-based carbon materials, due to a high concentration of SiO2. Since SiO2 lowers the melting point of compound oxides [80], Anthracite’s ash completely melted at 1600 °C. The unmolten fractions of the ashes of the other carbon materials at 1600 °C consisted of CaO- and MgO-rich phases which were higher in melting temperatures, according to FactSage equilibrium calculations. These unmolten ashes can block carbon’s contact with the steel melt and slow down the carbon dissolution rate [81], which is not desirable for carburization. The ashes of Charcoal 2, Lemon Hydrochar, and pyrolyzed Lemon Hydrochar had very high alkalinity indices. This was caused by the high concentrations of CaO and K2O in Charcoal 2, and high concentrations of CaO and Fe2O3 in Lemon Hydrochar and pyrolyzed Lemon Hydrochar, respectively. These alkaline oxides catalyze the Boudouard reaction [82]. On one hand, this implies that if charcoal and hydrochar were added as blend components during cokemaking, the alkaline ashes could lead to issues such as higher CRI and lower coke strengths after reaction (CSR) of the bio-cokes produced [2]. The premature weakening of coke in a BF can lead to generation of fines and clogging of gas pores in the bed, which can reduce the gas permeability of the stack. The catalytic effect of alkaline ashes on carbon gasification reaction also leads to a reduction in secondary combustion of the char (after devolatilization) with O2, which lowers the combustion efficiency and the total heating energy released by the carbon material [2]. On the other hand, such catalytic effect enables a larger amount of CO to be generated at lower temperatures compared to a fossil coke. This enables the development of a higher CO partial pressures in the upper part of TRZ, which favors earlier onwüstite reduction at a lower temperature in a BF. The TRZ temperature of a BF could thus be lowered, and the amount of coke charged could be reduced [83]. Therefore, the catalytic effect of alkaline ashes on carbon gasification is harmful when the carbonaceous material is seen as a solid fuel, but beneficial when it is considered as a reducing reagent.
The ash, alkalis, S, and P concentrations of the carbonaceous materials, including pyrolyzed Lemon Hydrochar, were compared against impurity requirements of European BF, EAF, and DRI productions, and are summarized in Table 14. Currently, no impurity standards are available for the EAFs. In this work, the maximum limits of impurities for the EAF process were taken from the highest of DRI, hot-briquetted iron (HBI), and pig iron since these are carbon-containing materials regularly charged into the EAF. When biomasses are added in large amounts in the self-reducing pellets for DRI production, their impurity concentrations become important. Since currently no impurity regulation standard is available for biomass addition to self-reducing pellets, the impurity requirements shown in Table 14 are those for iron ores for DRI production.
Table 14.
Comparison of impurities in carbonaceous materials according to BF and EAF requirements (in wt%).
It can be seen from Table 14 that Anthracite complied very well to the impurity requirements in BF but not in EAF. Charcoal 1 generally complied very well to the impurity requirements for both BF and EAF, except that its alkalis content was slightly above the BF limit. This is because Charcoal 1 was produced from stem wood, which contained fewer ash-forming elements than bark [86]. Charcoal 2 was produced from a mixture of different fractions of wood, and thus, it contained higher amounts of impurities. The P and alkalis content of Lemon Hydrochar should be further reduced to meet the requirements of BF and EAF processes. Pyrolysis up to 1200 °C resulted in significant increase of the ash, alkalis, S, and P concentrations of Lemon Hydrochar. An additional leaching may be required to reduce these impurities. The impurity requirements for DRI were much stricter than the EAFs, and all carbon materials failed to satisfy the S and P requirements. However, biomasses are typically added in small amounts, up to a maximum of 46% of the weight of the green pellets [2]. This means that the impurity restrictions for biomass materials could be relaxed by more than two times than the values shown in Table 14. Thus, the impurity concentrations of the three biomass-based carbon materials may become acceptable for the DRI process, depending on the amount added in the green pellets.
3.2. Future Prospects
Following previous discussions, charcoals are comparable to Anthracite in terms of their heating value and the amount of reducing gases which could be generated. Charcoal can therefore be used interchangeably with Anthracite as a solid fuel and reducing reagent in applications where its low density and high CO2 reactivity does not create a problem, such as CCA, tuyere injection in BF, and all carbon usages in the EAF process. Lemon Hydrochar has a slightly lower LHV and generates a lesser amount of CO by carbon gasification than both charcoals. Lemon Hydrochar also has a high CO2 reactivity which is in the same order of magnitude as both charcoals. Lemon Hydrochar might be able to fully substitute coal and coke in applications where its addition amount could be increased to compensate for its lower heating value and fixed carbon content. For example, this could be for CCA (either top-charged into a BF or for production of DRI) and as charged carbon or injected carbon in the EAF process—although this may not be the most efficient way to use hydrochar. For tuyere injection in the BF, hydrochar needs to be blended with PC, Anthracite, or charcoals with higher LHVs. This is because Wang et al. [5] discovered that the oxygen enrichment of the hot blast in the BF has its practical limitations, and could not fully compensate for the lower LHV of a biomass-based tuyere injectant to maintain a constant raceway adiabatic flame temperature. For iron ore sintering, the relatively lower LHV and the high CO2 reactivity of Lemon Hydrochar can lead to a reduction in the maximum temperature in the sintering zone, increase in flame front speed, and shortening of sintering time [87,88]. Therefore, Lemon Hydrochar should be blended with coke breeze or Anthracite, and may be added up to 10 wt% in the mix, similar to the case of a raw biomass (sunflower seed husk) [89]. The large amount of volatiles released by Lemon Hydrochar between 300 °C and 400 °C, near the onset temperature of coal fluidity development, can negatively impact the maximum fluidity of the coal blend [2,90]. Thus, Lemon Hydrochar may only be added to the coal blend for cokemaking in a small amount, likely below 3 wt% of the mix, similar to a torrefied wood [8].
To enhance the utilization efficiency of Lemon Hydrochar, its volatile matter should be removed by slow pyrolysis. This increases the carbon concentration and heating value of the residual solid, which makes it a comparable fuel to charcoal, as illustrated in Figure 4b. However, the increased ash, alkalis, S, and P concentrations in the pyrolyzed hydrochar (Table 14) may require additional treatments so that its impurity concentrations are within the acceptable limits of BF, EAF, and DRI processes. The tar and gases generated during the pyrolysis process could be used as heating fuels to replace natural gas in an integrated steel plant [7] or in an EAF [91]. Alternatively, hydrochar could be used to produce syngas by gasification. The syngas could replace natural gas for the reduction of iron ores, which further lowers the fossil CO2 emissions of gas-based DRI production. Tar could be effectively eliminated by selecting the suitable gasification medium, operation temperature, pressure, and with the use of catalysts to convert it into valuable reducing gases [70]. This route also enhances the overall utilization of hydrochar without the need for pyrolysis. Techno-economic and life cycle analyses are required to assess which of the valorization route of hydrochar is the most economic and sustainable.
In this study, the carburization performance of the carbonaceous materials has not been discussed. It is expected that the heating rate and the method of addition of the carbon material during a specific process would affect the utilization efficiency of carbon in solid, liquid, and gas phase for carburization. Carburization of steel melt with the two charcoals and Lemon Hydrochar were investigated in Part 2 of this work [46]. Carburization is especially important when the future steelmaking shifts from the BF-BOF route to DRI-EAF. DRI and HBI have significantly lower carbon concentrations (1.3–2.6 wt%) than pig iron (4.9 wt%) [84]. Additional carbon may need to be added to the melt during EAF steelmaking, depending on the production conditions and the steel grade to be produced. Having the flexibility to control the carbon concentration of the melt in EAF is important for many reasons: (1) carbon is an alloying element of steel; (2) carbon which is dissolved in the melt reacts with slag and facilitates slag foaming; (3) carbon protects the steel melt from oxidation, especially during tapping; and (4) oxidation of dissolved carbon in the melt is an important source of heating energy during subsequent steel-refining processes (for instance, in the argon oxygen decarburization (AOD) process).
4. Conclusions
Hydrothermal carbonization is a promising biomass conversion technology which can convert wet organic wastes into solid fuels, called hydrochar, to complement charcoal for supply of renewable carbon in the iron and steelmaking industry. This work systematically compared a hydrochar produced from lemon peels (Lemon Hydrochar) with two different types of charcoal (Charcoal 1—pyrolyzed up to 500 °C, densified, and Charcoal 2—pyrolyzed up to 750 °C, not densified), and a high-rank fossil coal, Anthracite, that is commonly used in the electric arc furnace (EAF) process today. Characterizations of these materials in terms of their chemical and ash compositions, devolatilization behavior (TGA-N2, 20–1000 °C, 10 K/min and 50 K/min), pyrolysis (20–1200 °C, 50 K/min) product distributions and their chemical compositions, isothermal CO2 reactivities (1100 °C, 2 h), and surface morphologies (examined using a scanning electron microscope), were performed. The following specific conclusions can be made based on the results of this study:
- Lemon Hydrochar is a medium carbon-containingmaterial (59.8 wt%) with a medium density (1.23 kg/m3), a medium lower heating value (23 MJ/kg), a high volatile matter content (67 wt%), a low moisture (2.6 wt%), a low ash, low impurity (S, P) concentrations, and a medium CO2 reactivity (0.25%/min) relative to charcoals and Anthracite.
- Charcoals are high carbon-containing materials (>86 wt%) with high heating energies and low volatile matter contents, and are more similar to Anthracite. Charcoals’ weaknesses include their lower densities (0.76–1.07 kg/m3), higher moisture contents, higher alkalis and P concentrations, and higher CO2 reactivities (0.33–0.44%/min). Densification resulted in an increased density, a reduced amount of moisture pickup, and a lowered CO2 reactivity of charcoal. The advantages of Lemon Hydrochar and charcoals compared to Anthracite are their lower ash and S concentrations and renewability.
- Pyrolysis of Anthracite and both charcoals up to 1200 °C indicated that their volatile matter mostly consisted of gases such as CO, CO2, H2, and CH4. Due to the high fixed carbon content and the low carbon concentrations of their volatile matter, more than 90% of carbon in the initial carbon material was retained in the residual char after a devolatilization up to 1200 °C. On the contrary, Lemon Hydrochar loses a significant portion of its total carbon to the volatile matter which includes liquid (17%) and pyrolysis gases (29%). The pyrolysis gas consisted of 17.6 wt% CO, 12.8 wt% CO2, 3.3 wt% CH4, 1.8 wt% H2, and other hydrocarbon gases which sums up to 4.3 wt%. Only 54% of carbon in Lemon Hydrochar remained in the solid up to 1200 °C. As a result, the amount of carbon available for high-temperature reactions such as combustion, generation of reducing gases, carburization, and slag foaming is significantly reduced. This makes Lemon Hydrochar a less-efficient material compared to charcoal and Anthracite. The extent to which tar could be utilized as a reducing agent requires further investigation.
- Based on the experimental findings from this work, it is speculated that charcoal could be used interchangeably with Anthracite in applications where its low density and CO2 reactivity do not create a problem, such as for carbon composite agglomerates, BF tuyere injection, and in EAFs. For hydrochar, it is recommended that two strategies should be investigated in the future to overcome its shortcomings in high-temperature metallurgical applications: (1) blending with either charcoal or Anthracite, or (2) removal of of its volatile matter by slow pyrolysis such that it becomes a comparable solid fuel to charcoal. Alternatively, hydrochar may be used for production of green syngas by gasification technology, which could be used for the production of direct-reduced iron. All three valorization routes of hydrochar should be investigated and assessed in future studies to identify the most efficient way to utilize hydrochar in the iron and steelmaking processes.
Author Contributions
Conceptualization, Y.L. and A.V.K.; methodology, Y.L. and H.Y.; validation, Y.L., A.V.K. and C.W.; formal analysis, Y.L. and A.V.K.; investigation, Y.L. and H.Y.; writing—original draft preparation, Y.L.; writing—review and editing, A.V.K., C.W. and P.G.J.; supervision, A.V.K. and P.G.J.; project administration, C.W. All authors have read and agreed to the published version of the manuscript.
Funding
This research was funded by VINNOVA (Swedish Governmental Agency for Innovation Systems) and some of the participating companies in OSMET 3.0 project (dnr: 2020-04140).
Acknowledgments
A special thanks is given to Ryan Robinson at Höganäs AB and Liviu Brabie at Swerim AB for carrying out the isothermal CO2 reactivity experiments of the carbonaceous materials. We would like to thank Ingelia for providing us Lemon Hydrochar for various experiments.
Conflicts of Interest
The authors declare no conflict of interest.
Abbreviations
| BF | Blast furnace |
| BOF | Basic oxygen furnace |
| DRI | Direct-reduced iron |
| EAF | Electric arc furnace |
| SR | Smelting reduction |
| ISI | Iron and steelmaking industry |
| EU | European Union |
| ULCOS | Ultra-Low CO2 Steelmaking |
| CCS | Carbon capture storage |
| PC | Pulverized coal |
| HTC | Hydrothermal carbonization |
| LHV | Lower heating value |
| HHV | Higher heating value |
| SEM | Scanning electron microscope |
| TGA | Thermogravimetric analysis |
| Micro-GC | Micro-gas chromatography |
| CRI | Coke reactivity index |
| RHF | Rotary hearth furnace |
| CCA | Carbon composite agglomerate |
| TRZ | Thermal reserve zone |
| CSR | Coke strength after reaction |
| HBI | Hot-briquetted iron |
| AOD | Argon oxygen decarburization |
References
- Mousa, E.; Wang, C.; Riesbeck, J.; Larsson, M. Biomass applications in iron and steel industry: An overview of challenges and opportunities. Renew. Sustain. Energy Rev. 2016, 65, 1247–1266. [Google Scholar] [CrossRef]
- Suopajärvi, H.; Kemppainen, A.; Haapakangas, J.; Fabritius, T. Extensive review of the opportunities to use biomass-based fuels in iron and steelmaking processes. J. Clean. Prod. 2017, 148, 709–734. [Google Scholar] [CrossRef]
- Abdul Quader, M.; Ahmed, S.; Dawal, S.Z.; Nukman, Y. Present needs, recent progress and future trends of energy-efficient Ultra-Low Carbon Dioxide (CO2) Steelmaking (ULCOS) program. Renew. Sustain. Energy Rev. 2016, 55, 537–549. [Google Scholar] [CrossRef]
- European Commission. Towards Competitive and Clean European Steel Accompanying the Communication from the Commission to the European Parliament, the Council, the European Economic and Social Committee and the Committee of the Regions Updating the 2020 New Industrial Strategy: Building a Stronger Single Market for Europe’s Recovery; European Commission: Brussels, Belgium, 2021. [Google Scholar]
- Wang, C.; Mellin, P.; Lövgren, J.; Nilsson, L.; Yang, W.; Salman, H.; Hultgren, A.; Larsson, M. Biomass as blast furnace injectant—Considering availability, pretreatment and deployment in the Swedish steel industry. Energy Convers. Manag. 2015, 102, 217–226. [Google Scholar] [CrossRef] [Green Version]
- Mathieson, J.G.; Somerville, M.A.; Deev, A.; Jahanshahi, S. 19-Utilization of biomass as an alternative fuel in ironmaking. In Iron Ore; Lu, L., Ed.; Woodhead Publishing: Cambridge, UK, 2015; pp. 581–613. [Google Scholar]
- Nwachukwu, C.M.; Wang, C.; Wetterlund, E. Exploring the role of forest biomass in abating fossil CO2 emissions in the iron and steel industry—The case of Sweden. Appl. Energy 2021, 288, 116558. [Google Scholar] [CrossRef]
- Sundqvist Ökvist, L.; Lundgren, M. Experiences of Bio-Coal Applications in the Blast Furnace Process—Opportunities and Limitations. Minerals 2021, 11, 863. [Google Scholar] [CrossRef]
- Mousa, E.; Babich, A.; Senk, D. Iron Ore Sintering Process with Biomass Utilization. In Proceedings of the METEC & 2nd ESTAD, Düsseldorf, Germany, 15–19 June 2015. [Google Scholar]
- Mathieson, J.G.; Rogers, H.; Somerville, M.A.; Jahanshahi, S. Reducing Net CO2 Emissions Using Charcoal as a Blast Furnace Tuyere Injectant. ISIJ Int. 2012, 52, 1489–1496. [Google Scholar] [CrossRef] [Green Version]
- Kowitwarangkul, P.; Babich, A.; Senk, D. Reduction Behavior of Self-Reducing Pellet (SRP) for Low Height Blast Furnace. Steel Res. Int. 2014, 85, 1501–1509. [Google Scholar] [CrossRef]
- Ueda, S.; Watanabe, K.; Yanagiya, K.; Ariyama, T. Improvement of Reactivity of Carbon Iron Ore Composite with Biomass Char for Blast Furnace. ISIJ Int. 2009, 49, 1505–1512. [Google Scholar] [CrossRef] [Green Version]
- Konishi, H.; Ichikawa, K.; Usui, T. Effect of Residual Volatile Matter on Reduction of Iron Oxide in Semi-charcoal Composite Pellets. ISIJ Int. 2010, 50, 386–389. [Google Scholar] [CrossRef] [Green Version]
- Ueki, Y.; Yoshiie, R.; Naruse, I.; Ohno, K.-I.; Maeda, T.; Nishioka, K.; Shimizu, M. Reaction behavior during heating biomass materials and iron oxide composites. Fuel 2013, 104, 58–61. [Google Scholar] [CrossRef]
- Marcos, M.; Bianco, L.; Cirilli, F.; Reichel, T.; Baracchini, G.; Echterhof, T.; Rekersdrees, T.; Mirabile, D.; Griessacher, T.; Sommerauer, H. Biochar for a Sustainable EAF Steel Production (GREENEAF2); Final Report; Publications Office: Luxembourg, 2019. [Google Scholar]
- Somerville, M.; Jahanshahi, S.; Ridgeway, P.; Davies, M.; Mathieson, J. Sustainable carbon in steelmaking—Plant trials at the Sydney Steel Mill, Sustainable. In Proceedings of the Sustainable Mining 2010—The Business Case, Kalgoorlie, WA, Australia, 17–19 August 2010; AusIMM: Melbourne, Australia, 2010; pp. 38–52. [Google Scholar]
- Norgate, T.; Haque, N.; Somerville, M.; Jahanshahi, S. Biomass as a Source of Renewable Carbon for Iron and Steelmaking. ISIJ Int. 2012, 52, 1472–1481. [Google Scholar] [CrossRef] [Green Version]
- Suopajärvi, H.; Fabritius, T. Towards More Sustainable Ironmaking—An Analysis of Energy Wood Availability in Finland and the Economics of Charcoal Production. Sustainability 2013, 5, 1188–1207. [Google Scholar] [CrossRef] [Green Version]
- Zahnen, J.; Haag, V.; Lewandrowski, T.; Hirschberger, P. 2020 Analysis of the EU Charcoal Market; WWF Germany: Berlin, Germany, 2020. [Google Scholar]
- Ferraz Filho, A.; Scolforo, J.; Mola-Yudego, B. The coppice-with-standards silvicultural system as applied to Eucalyptus plantations—A review. J. For. Res. 2014, 25, 237–248. [Google Scholar] [CrossRef]
- Zhuang, X.; Zhan, H.; Song, Y.; Yin, X.; Wu, C. Structure-reactivity relationships of biowaste-derived hydrochar on subsequent pyrolysis and gasification performance. Energy Convers. Manag. 2019, 199, 112014. [Google Scholar] [CrossRef]
- Kambo, H.S.; Dutta, A. A comparative review of biochar and hydrochar in terms of production, physico-chemical properties and applications. Renew. Sustain. Energy Rev. 2015, 45, 359–378. [Google Scholar] [CrossRef]
- Zhang, S.; Zhu, X.; Zhou, S.; Shang, H.; Luo, J.; Tsang, D.C.W. Chapter 15—Hydrothermal Carbonization for Hydrochar Production and Its Application. In Biochar from Biomass and Waste; Ok, Y.S., Tsang, D.C.W., Bolan, N., Novak, J.M., Eds.; Elsevier: Cambridge, UK, 2019; pp. 275–294. [Google Scholar]
- Zhang, Z.; Zhu, Z.; Shen, B.; Liu, L. Insights into biochar and hydrochar production and applications: A review. Energy 2019, 171, 581–598. [Google Scholar] [CrossRef]
- Wang, G.; Zhang, J.; Lee, J.-Y.; Mao, X.; Ye, L.; Xu, W.; Ning, X.; Zhang, N.; Teng, H.; Wang, C. Hydrothermal carbonization of maize straw for hydrochar production and its injection for blast furnace. Appl. Energy 2020, 266, 114818. [Google Scholar] [CrossRef]
- Langone, M.; Basso, D. Process Waters from Hydrothermal Carbonization of Sludge: Characteristics and Possible Valorization Pathways. Int. J. Environ. Res. Public Health 2020, 17, 6618. [Google Scholar] [CrossRef] [PubMed]
- European Commission. Final Report Summary—NEWAPP (New Technological Applications for Wet Biomass Waste Stream Products). Available online: https://cordis.europa.eu/project/id/605178/reporting (accessed on 18 April 2022).
- Bach, Q.-V.; Skreiberg, Ø. Upgrading biomass fuels via wet torrefaction: A review and comparison with dry torrefaction. Renew. Sustain. Energy Rev. 2016, 54, 665–677. [Google Scholar] [CrossRef]
- European Compost Network. Treatment of Bio-Waste in Europe. Available online: https://www.compostnetwork.info/policy/biowaste-in-europe/treatment-bio-waste-europe/ (accessed on 28 May 2022).
- European Environment Agency. Bio-Waste in Europe—Turning Challenges into Opportunities. Available online: https://www.eea.europa.eu/publications/bio-waste-in-europe (accessed on 28 May 2022).
- European Commission. Waste Framework Directive. Available online: https://ec.europa.eu/environment/topics/waste-and-recycling/waste-framework-directive_en (accessed on 28 May 2022).
- Ingelia. Ingelia Model. Available online: https://ingelia.com/index.php/negocio-sostenible/modelo-ingelia/?lang=en (accessed on 15 March 2022).
- Bevan, E.; Fu, J.; Zheng, Y. Retracted Article: Challenges and opportunities of hydrothermal carbonisation in the UK; case study in Chirnside. RSC Adv. 2020, 10, 31586–31610. [Google Scholar] [CrossRef] [PubMed]
- Hernandez, M.; Salimbeni, A.; Hitzl, M.; Zhang, J.; Wang, G.-W.; Wang, K.; Wang, C. Evaluation of Utilising Ingelia Hydrochar Produced from Organic Residues for Blast Furnaces Injection Comparison with Anthracite and Bituminous Coal. In Proceedings of the 26th European Biomass Conference and Exhibition, Copenhagen, Denmark, 14–17 May 2018. [Google Scholar]
- Li, J.; Xu, R.; Wang, G.; Zhang, J.; Song, B.; Liang, W.; Wang, C. Study on the feasibility and co-combustion mechanism of mixed injection of biomass hydrochar and anthracite in blast furnace. Fuel 2021, 304, 121465. [Google Scholar] [CrossRef]
- Li, T.; Wang, G.; Zhou, H.; Ning, X.; Zhang, C. Numerical Simulation Study on the Effects of Co-Injection of Pulverized Coal and Hydrochar into the Blast Furnace. Sustainability 2022, 14, 4407. [Google Scholar] [CrossRef]
- Liang, W.; Jiang, C.; Wang, G.; Ning, X.; Zhang, J.; Guo, X.; Xu, R.; Wang, P.; Ye, L.; Li, J.; et al. Research on the co-combustion characteristics and kinetics of agricultural waste hydrochar and anthracite. Renew. Energy 2022, 194, 1119–1130. [Google Scholar] [CrossRef]
- Liang, W.; Nanou, P.; Wray, H.; Zhang, J.; Lundstrom, I.; Lundqvist, S.; Wang, C. Feasibility Study of Bio-Sludge Hydrochar as Blast Furnace Injectant. Sustainability 2022, 14, 5510. [Google Scholar] [CrossRef]
- Sun, M.; Zhang, J.; Li, K.; Barati, M.; Liu, Z. Co-gasification characteristics of coke blended with hydro-char and pyro-char from bamboo. Energy 2022, 241, 122890. [Google Scholar] [CrossRef]
- Wang, Q.; Wang, E.; Chionoso, O.P. Numerical simulation of the synergistic effect of combustion for the hydrochar/coal blends in a blast furnace. Energy 2022, 238, 121722. [Google Scholar] [CrossRef]
- Ye, L.; Zhang, J.; Xu, R.; Ning, X.; Zhang, N.; Wang, C.; Mao, X.; Li, J.; Wang, G.; Wang, C. Co-combustion kinetic analysis of biomass hydrochar and anthracite in blast furnace injection. Fuel 2022, 316, 123299. [Google Scholar] [CrossRef]
- Zhang, C.; Wang, G.; Ning, X.; Zhang, J.; Wang, C. Numerical simulation of combustion behaviors of hydrochar derived from low-rank coal in the raceway of blast furnace. Fuel 2020, 278, 118267. [Google Scholar] [CrossRef]
- Zhang, N.; Wang, G.; Zhang, J.; Ning, X.; Li, Y.; Liang, W.; Wang, C. Study on co-combustion characteristics of hydrochar and anthracite coal. J. Energy Inst. 2020, 93, 1125–1137. [Google Scholar] [CrossRef]
- Jarnerud, T.; Karasev, A.V.; Wang, C.; Bäck, F.; Jönsson, P.G. Utilization of Organic Mixed Biosludge from Pulp and Paper Industries and Green Waste as Carbon Sources in Blast Furnace Hot Metal Production. Sustainability 2021, 13, 7706. [Google Scholar] [CrossRef]
- Basu, P. Chapter 3—Biomass Characteristics. In Biomass Gasification, Pyrolysis and Torrefaction, 2nd ed.; Basu, P., Ed.; Academic Press: Boston, MA, USA, 2013; pp. 47–86. [Google Scholar]
- Lu, Y.-C.; Brabie, L.; Karasev, A.V.; Wang, C. Applications of Hydrochar and Charcoal in the Iron and Steelmaking Industry—Part 2: Carburization of Liquid Iron by Addition of Iron-Carbon Briquettes. Sustainability 2022, 14, 5383. [Google Scholar] [CrossRef]
- Basu, P. Chapter 7—Gasification Theory. In Biomass Gasification, Pyrolysis and Torrefaction, 2nd ed.; Basu, P., Ed.; Academic Press: Boston, MA, USA, 2013; pp. 199–248. [Google Scholar]
- Speight, J.G. Chapter 13—Upgrading by Gasification. In Heavy Oil Recovery and Upgrading; Speight, J.G., Ed.; Gulf Professional Publishing: Houston, TX, USA, 2019; pp. 559–614. [Google Scholar]
- Murakami, T.; Nagata, K. New Ironmaking Process From The Viewpoint Of Carburization and Iron Melting at Low Temperature. Miner. Process. Extr. Metall. Rev. 2003, 24, 253–267. [Google Scholar] [CrossRef]
- Blažič, A.; Škrjanc, I.; Logar, V. Soft sensor of bath temperature in an electric arc furnace based on a data-driven Takagi–Sugeno fuzzy model. Appl. Soft Comput. 2021, 113, 107949. [Google Scholar] [CrossRef]
- Jing, X.; Wang, Z.; Zhang, Q.; Yu, Z.; Li, C.; Huang, J.; Fang, Y. Evaluation of CO2 Gasification Reactivity of Different Coal Rank Chars by Physicochemical Properties. Energy Fuels 2013, 27, 7287–7293. [Google Scholar] [CrossRef]
- Takarada, T.; Tamai, Y.; Tomita, A. Reactivities of 34 coals under steam gasification. Fuel 1985, 64, 1438–1442. [Google Scholar] [CrossRef]
- Babich, A.; Senk, D. Biomass use in the steel industry: Back to the future? Stahl Und Eisen 2013, 133, 57–67. [Google Scholar]
- Demirbas, A. Relationships Proximate Analysis Results and Higher Heating Values of Lignites. Energy Sources Part A Recovery Util. Environ. Eff. 2008, 30, 1876–1883. [Google Scholar] [CrossRef]
- Chen, W.-H.; Du, S.-W.; Tsai, C.-H.; Wang, Z.-Y. Torrefied biomasses in a drop tube furnace to evaluate their utility in blast furnaces. Bioresour. Technol. 2012, 111, 433–438. [Google Scholar] [CrossRef]
- Roy, P.; Dutta, A.; Gallant, J. Hydrothermal Carbonization of Peat Moss and Herbaceous Biomass (Miscanthus): A Potential Route for Bioenergy. Energies 2018, 11, 2794. [Google Scholar] [CrossRef] [Green Version]
- Zhang, B.; Heidari, M.; Regmi, B.; Salaudeen, S.; Arku, P.; Thimmannagari, M.; Dutta, A. Hydrothermal Carbonization of Fruit Wastes: A Promising Technique for Generating Hydrochar. Energies 2018, 11, 2022. [Google Scholar] [CrossRef] [Green Version]
- Mamma, D.; Christakopoulos, P. Biotransformation of Citrus By-Products into Value Added Products. Waste Biomass Valorization 2014, 5, 529–549. [Google Scholar] [CrossRef]
- Pathak, P.D.; Mandavgane, S.A.; Kulkarni, B.D. Fruit peel waste: Characterization and its potential uses. Curr. Sci. 2017, 113, 444–454. [Google Scholar] [CrossRef]
- Wang, T.; Zhai, Y.; Zhu, Y.; Li, C.; Zeng, G. A review of the hydrothermal carbonization of biomass waste for hydrochar formation: Process conditions, fundamentals, and physicochemical properties. Renew. Sustain. Energy Rev. 2018, 90, 223–247. [Google Scholar] [CrossRef]
- Lucian, M.; Volpe, M.; Gao, L.; Piro, G.; Goldfarb, J.L.; Fiori, L. Impact of hydrothermal carbonization conditions on the formation of hydrochars and secondary chars from the organic fraction of municipal solid waste. Fuel 2018, 233, 257–268. [Google Scholar] [CrossRef]
- Yang, H.; Yan, R.; Chen, H.; Lee, D.H.; Zheng, C. Characteristics of hemicellulose, cellulose and lignin pyrolysis. Fuel 2007, 86, 1781–1788. [Google Scholar] [CrossRef]
- Aburto, J.; Moran, M.; Galano, A.; Torres-García, E. Non-isothermal pyrolysis of pectin: A thermochemical and kinetic approach. J. Anal. Appl. Pyrolysis 2015, 112, 94–104. [Google Scholar] [CrossRef]
- Ueno, H.; Tanaka, M.; Terada, A.; Sasaki, M.; Goto, M.; Hoshino, M. Separation of Pectin from Citrus junos Flavedo using a Hot- Compressed Water-Flow Reactor Separation of Pectin from Citrus junos Flavedo using a Hot-Compressed Water-Flow Reactor. In Proceedings of the SUPERGREEN, Seoul, Korea, 28–30 November 2007. [Google Scholar]
- Lagazzo, A.; Finocchio, E.; Petrini, P.; Ruggiero, C.; Pastorino, L. Hydrothermal synthesis of pectin derived nanoporous carbon material. Mater. Lett. 2016, 171, 212–215. [Google Scholar] [CrossRef]
- Zong, P.; Jiang, Y.; Tian, Y.; Li, J.; Yuan, M.; Ji, Y.; Chen, M.; Li, D.; Qiao, Y. Pyrolysis behavior and product distributions of biomass six group components: Starch, cellulose, hemicellulose, lignin, protein and oil. Energy Convers. Manag. 2020, 216, 112777. [Google Scholar] [CrossRef]
- Czajka, K.M. The impact of the thermal lag on the interpretation of cellulose pyrolysis. Energy 2021, 236, 121497. [Google Scholar] [CrossRef]
- Shen, D.K.; Gu, S. The mechanism for thermal decomposition of cellulose and its main products. Bioresour. Technol. 2009, 100, 6496–6504. [Google Scholar] [CrossRef]
- Mu, W.; Ben, H.; Ragauskas, A.; Deng, Y. Lignin Pyrolysis Components and Upgrading—Technology Review. BioEnergy Res. 2013, 6, 1183–1204. [Google Scholar] [CrossRef]
- Valderrama Rios, M.L.; González, A.M.; Lora, E.E.S.; Almazán del Olmo, O.A. Reduction of tar generated during biomass gasification: A review. Biomass Bioenergy 2018, 108, 345–370. [Google Scholar] [CrossRef]
- York, A.; Xiao, T.; Green, M. Brief Overview of the Partial Oxidation of Methane to Synthesis Gas. Top. Catal. 2003, 22, 345–358. [Google Scholar] [CrossRef]
- Sohn, I.; Fruehan, R. The reduction of iron oxides by volatiles in a rotary hearth furnace process: Part III. The simulation of volatile reduction in a multi-layer rotary hearth furnace process. Metall. Mater. Trans. B 2006, 37, 231–238. [Google Scholar] [CrossRef]
- Davydenko, A.; Karasev, A.; Lindstrand, G.; Jönsson, P. Investigation of Slag Foaming by Additions of Briquettes in the EAF during Stainless Steel Production. Steel Res. Int. 2015, 86, 146–153. [Google Scholar] [CrossRef]
- Hayes, P.C. The kinetics of formation of H2O and CO2 during iron oxide reduction. Metall. Trans. B 1979, 10, 211–217. [Google Scholar] [CrossRef]
- Kongkarat, S.; Khanna, R.; Koshy, P.; O’Kane, P.; Sahajwalla, V. Recycling Waste Polymers in EAF Steelmaking: Influence of Polymer Composition on Carbon/Slag Interactions. ISIJ Int. 2012, 52, 385–393. [Google Scholar] [CrossRef] [Green Version]
- Kaffash, H.; Surup, G.R.; Tangstad, M. Densification of Biocarbon and Its Effect on CO2 Reactivity. Processes 2021, 9, 193. [Google Scholar] [CrossRef]
- Semberg, P. Hearth Coke Bed Buoyancy in the Blast Furnace: Experimental Study with a 3-Dimensional Cold Model. Master’s Thesis, Luleå University of Technology, Luleå, Sweden, March 2006. [Google Scholar]
- Yang, Y.; Raipala, K.; Holappa, L. Chapter 1.1—Ironmaking. In Treatise on Process Metallurgy; Seetharaman, S., Ed.; Elsevier: Boston, MA, USA, 2014; pp. 2–88. [Google Scholar]
- Bale, C.W.; Bélisle, E.; Chartrand, P.; Decterov, S.A.; Eriksson, G.; Gheribi, A.E.; Hack, K.; Jung, I.H.; Kang, Y.B.; Melançon, J.; et al. FactSage thermochemical software and databases, 2010–2016. Calphad 2016, 54, 35–53. [Google Scholar] [CrossRef] [Green Version]
- Yasipourtehrani, S.; Strezov, V.; Bliznyukov, S.; Evans, T. Investigation of thermal properties of blast furnace slag to improve process energy efficiency. J. Clean. Prod. 2017, 149, 137–145. [Google Scholar] [CrossRef]
- Cham, S.T.; Sahajwalla, V.; Sakurovs, R.; Sun, H.; Dubikova, M. Factors Influencing Carbon Dissolution from Cokes into Liquid Iron. ISIJ Int. 2004, 44, 1835–1841. [Google Scholar] [CrossRef]
- Lahijani, P.; Zainal, Z.A.; Mohammadi, M.; Mohamed, A.R. Conversion of the greenhouse gas CO2 to the fuel gas CO via the Boudouard reaction: A review. Renew. Sustain. Energy Rev. 2015, 41, 615–632. [Google Scholar] [CrossRef]
- Kasai, A.; Matsui, Y. Lowering of Thermal Reserve Zone Temperature in Blast Furnace by Adjoining Carbonaceous Material and Iron Ore. ISIJ Int. 2004, 44, 2073–2078. [Google Scholar] [CrossRef]
- Elkader, M.; Fathy, A.; Megahed, G.; Eissa, M.; Shama, S.; El-Sharkawy, A. Influence of Direct-Reduced Iron in Charge Mix on EAF Operation Performance. In Proceedings of the 12th International Conference on Petroleum Engineering, Suez, Egypt, 20–22 October 2014. [Google Scholar]
- Anameric, B.; Kawatra, S.K. Properties and Features of Direct Reduced Iron. Miner. Process. Extr. Metall. Rev. 2007, 28, 59–116. [Google Scholar] [CrossRef]
- Surup, G.R.; Nielsen, H.K.; Heidelmann, M.; Anna, T. Characterization and reactivity of charcoal from high temperature pyrolysis (800–1600 °C). Fuel 2019, 235, 1544–1554. [Google Scholar] [CrossRef]
- Fan, X.; Ji, Z.; Gan, M.; Chen, X.; Jiang, T. Integrated assessment on the characteristics of straw-based fuels and their effects on iron ore sintering performance. Fuel Process. Technol. 2016, 150, 1–9. [Google Scholar] [CrossRef]
- Lovel, R.R.; Vining, K.R.; Dell’amico, M. The Influence of Fuel Reactivity on Iron Ore Sintering. ISIJ Int. 2009, 49, 195–202. [Google Scholar] [CrossRef] [Green Version]
- Ooi, T.C.; Aries, E.; Ewan, B.C.R.; Thompson, D.; Anderson, D.R.; Fisher, R.; Fray, T.; Tognarelli, D. The study of sunflower seed husks as a fuel in the iron ore sintering process. Miner. Eng. 2008, 21, 167–177. [Google Scholar] [CrossRef]
- Diez, M.A.; Alvarez, R.; Fernández, M. Biomass derived products as modifiers of the rheological properties of coking coals. Fuel 2012, 96, 306–313. [Google Scholar] [CrossRef] [Green Version]
- Echterhof, T. Review on the Use of Alternative Carbon Sources in EAF Steelmaking. Metals 2021, 11, 222. [Google Scholar] [CrossRef]
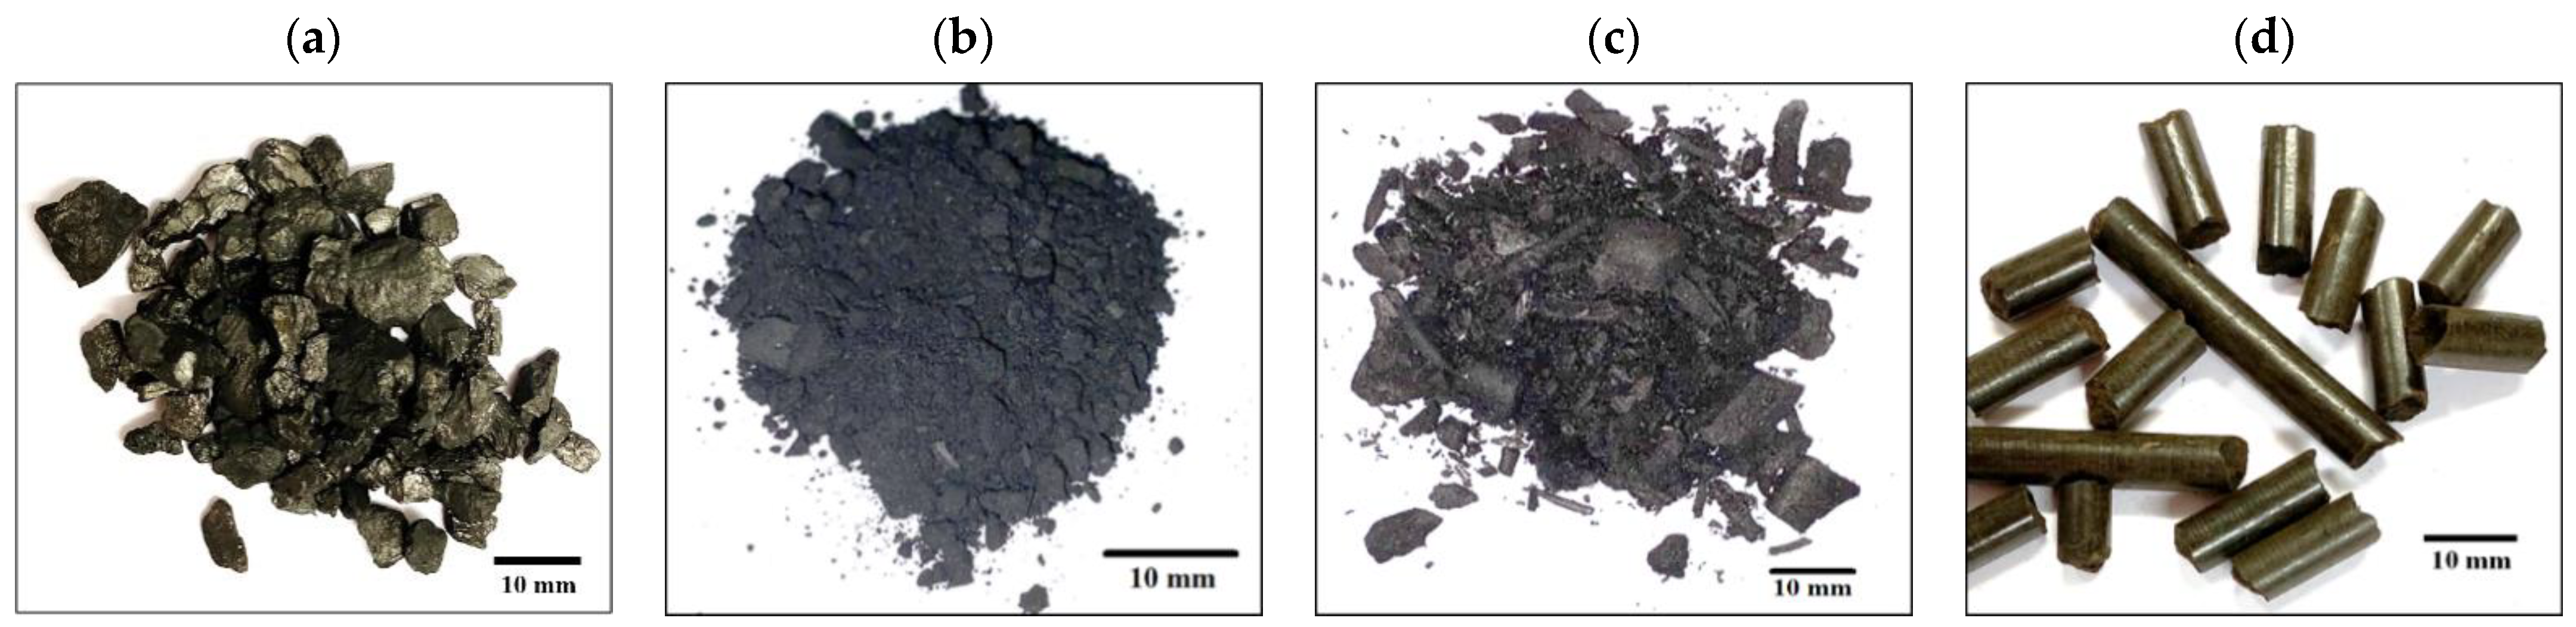
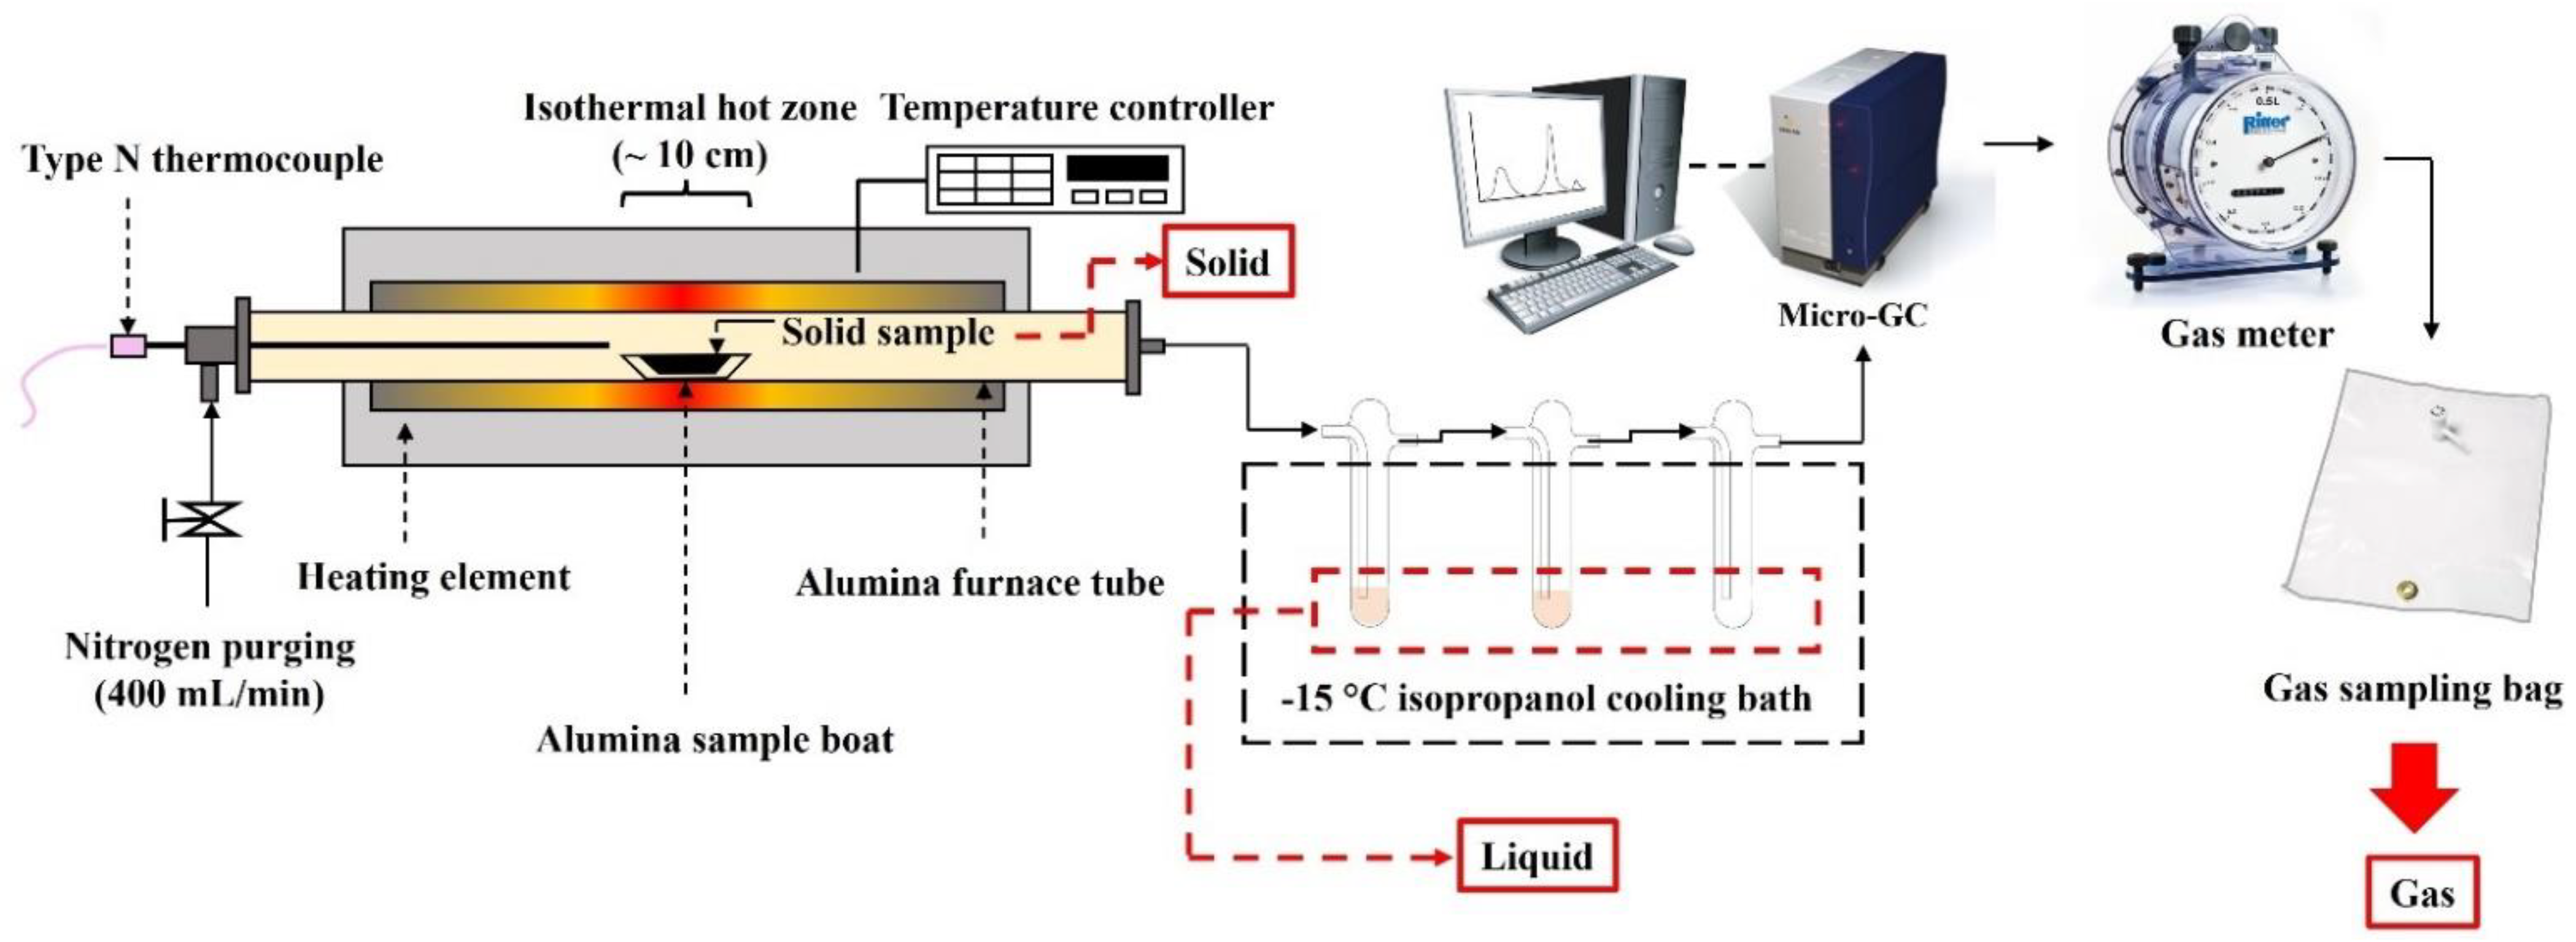
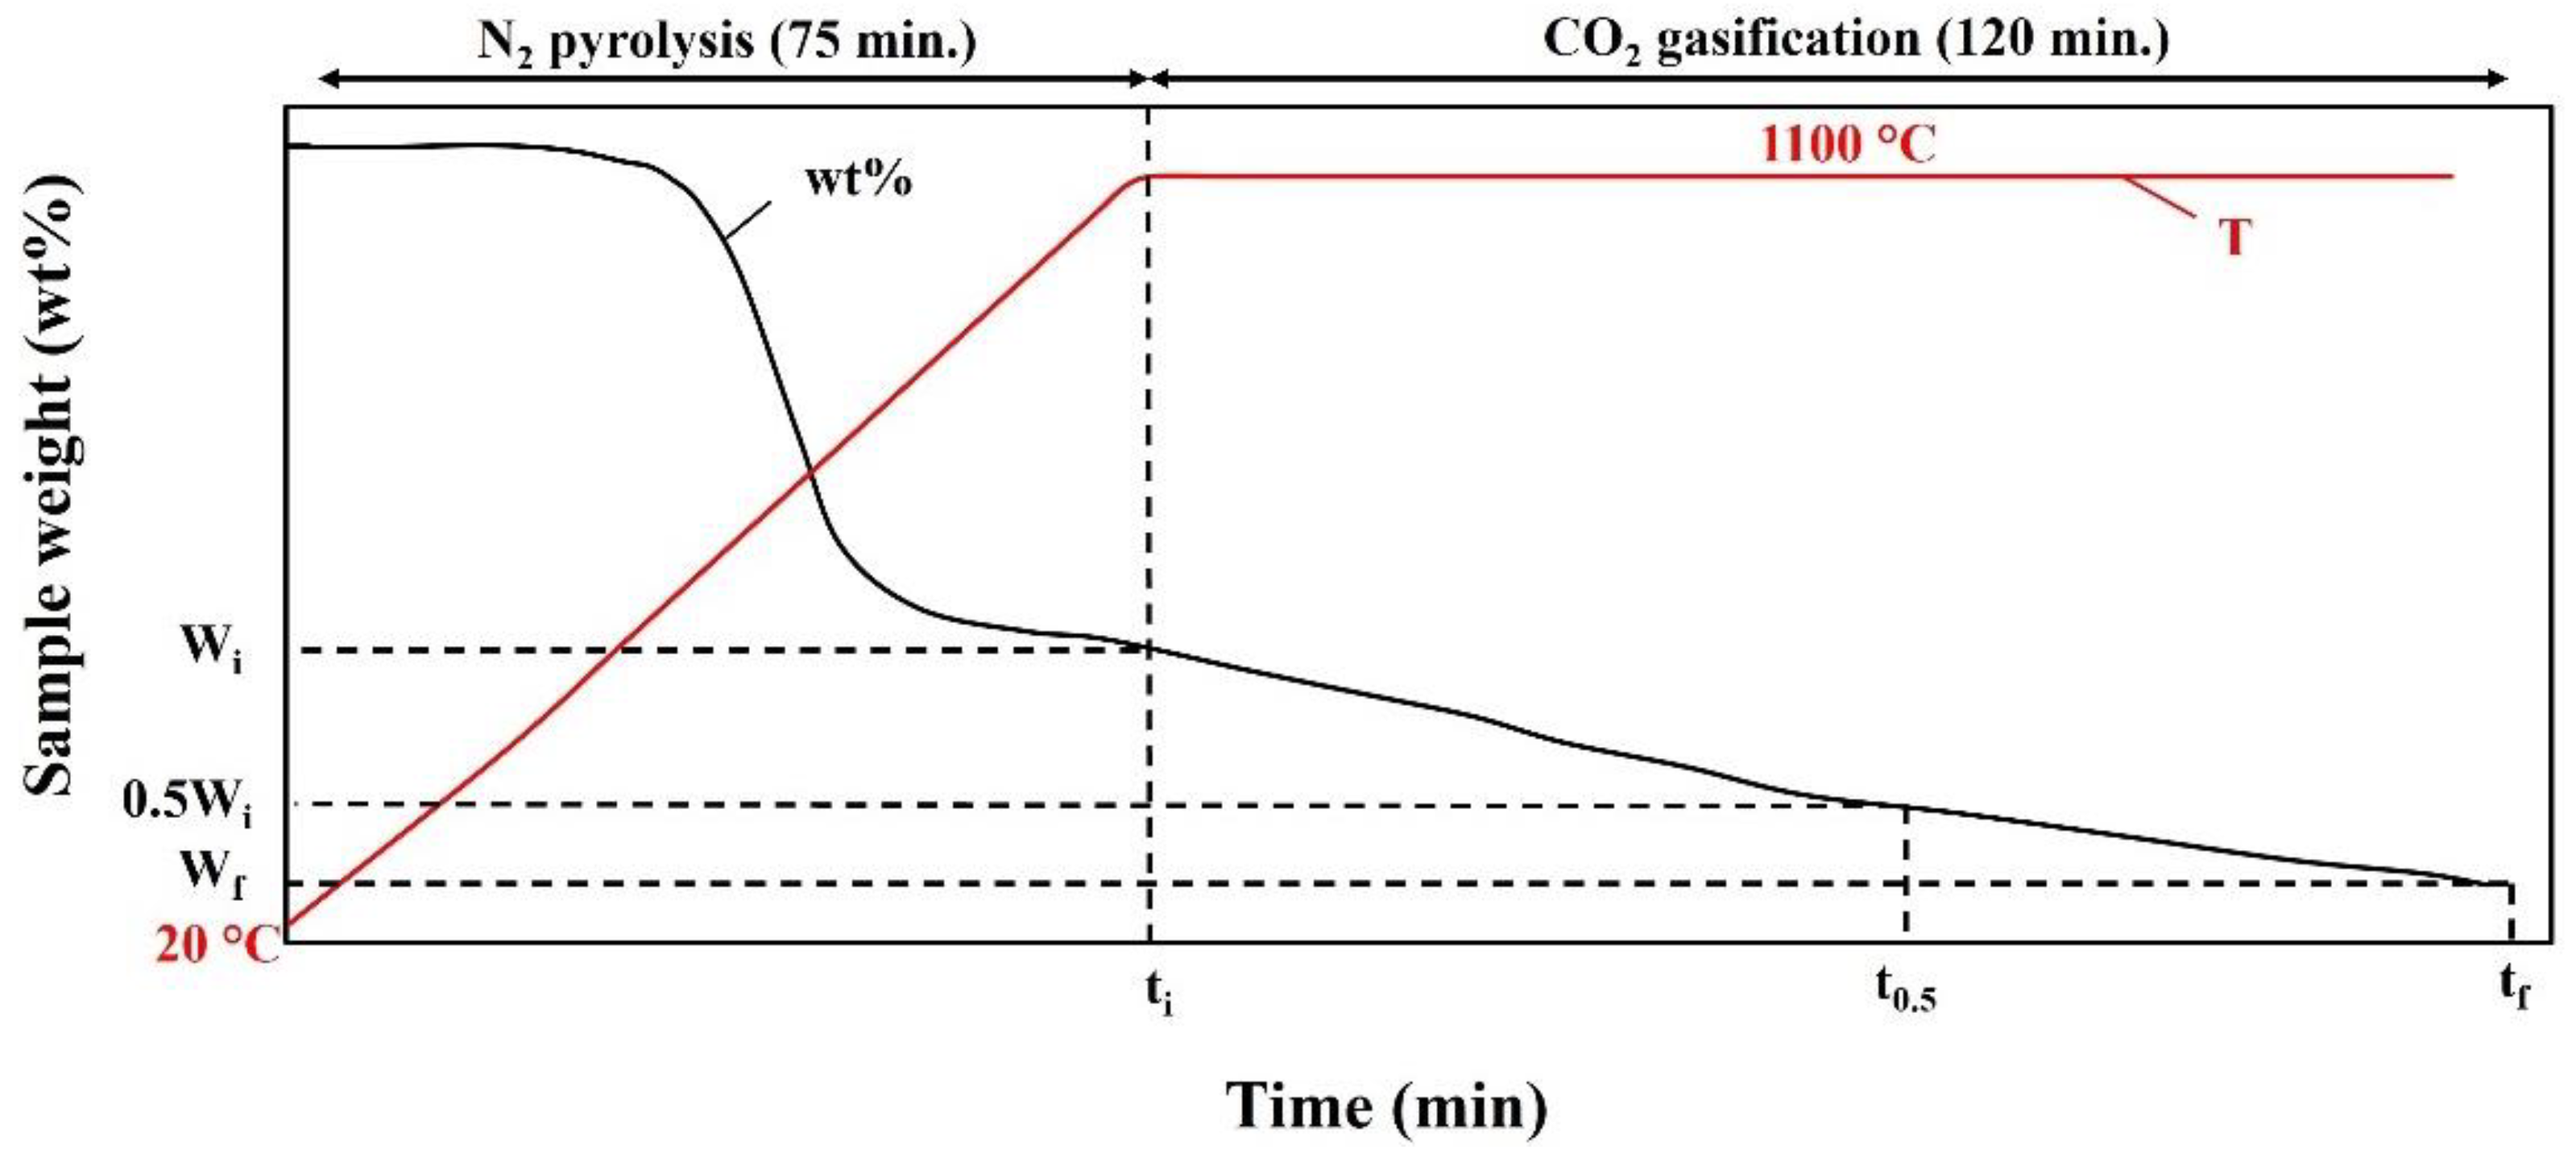
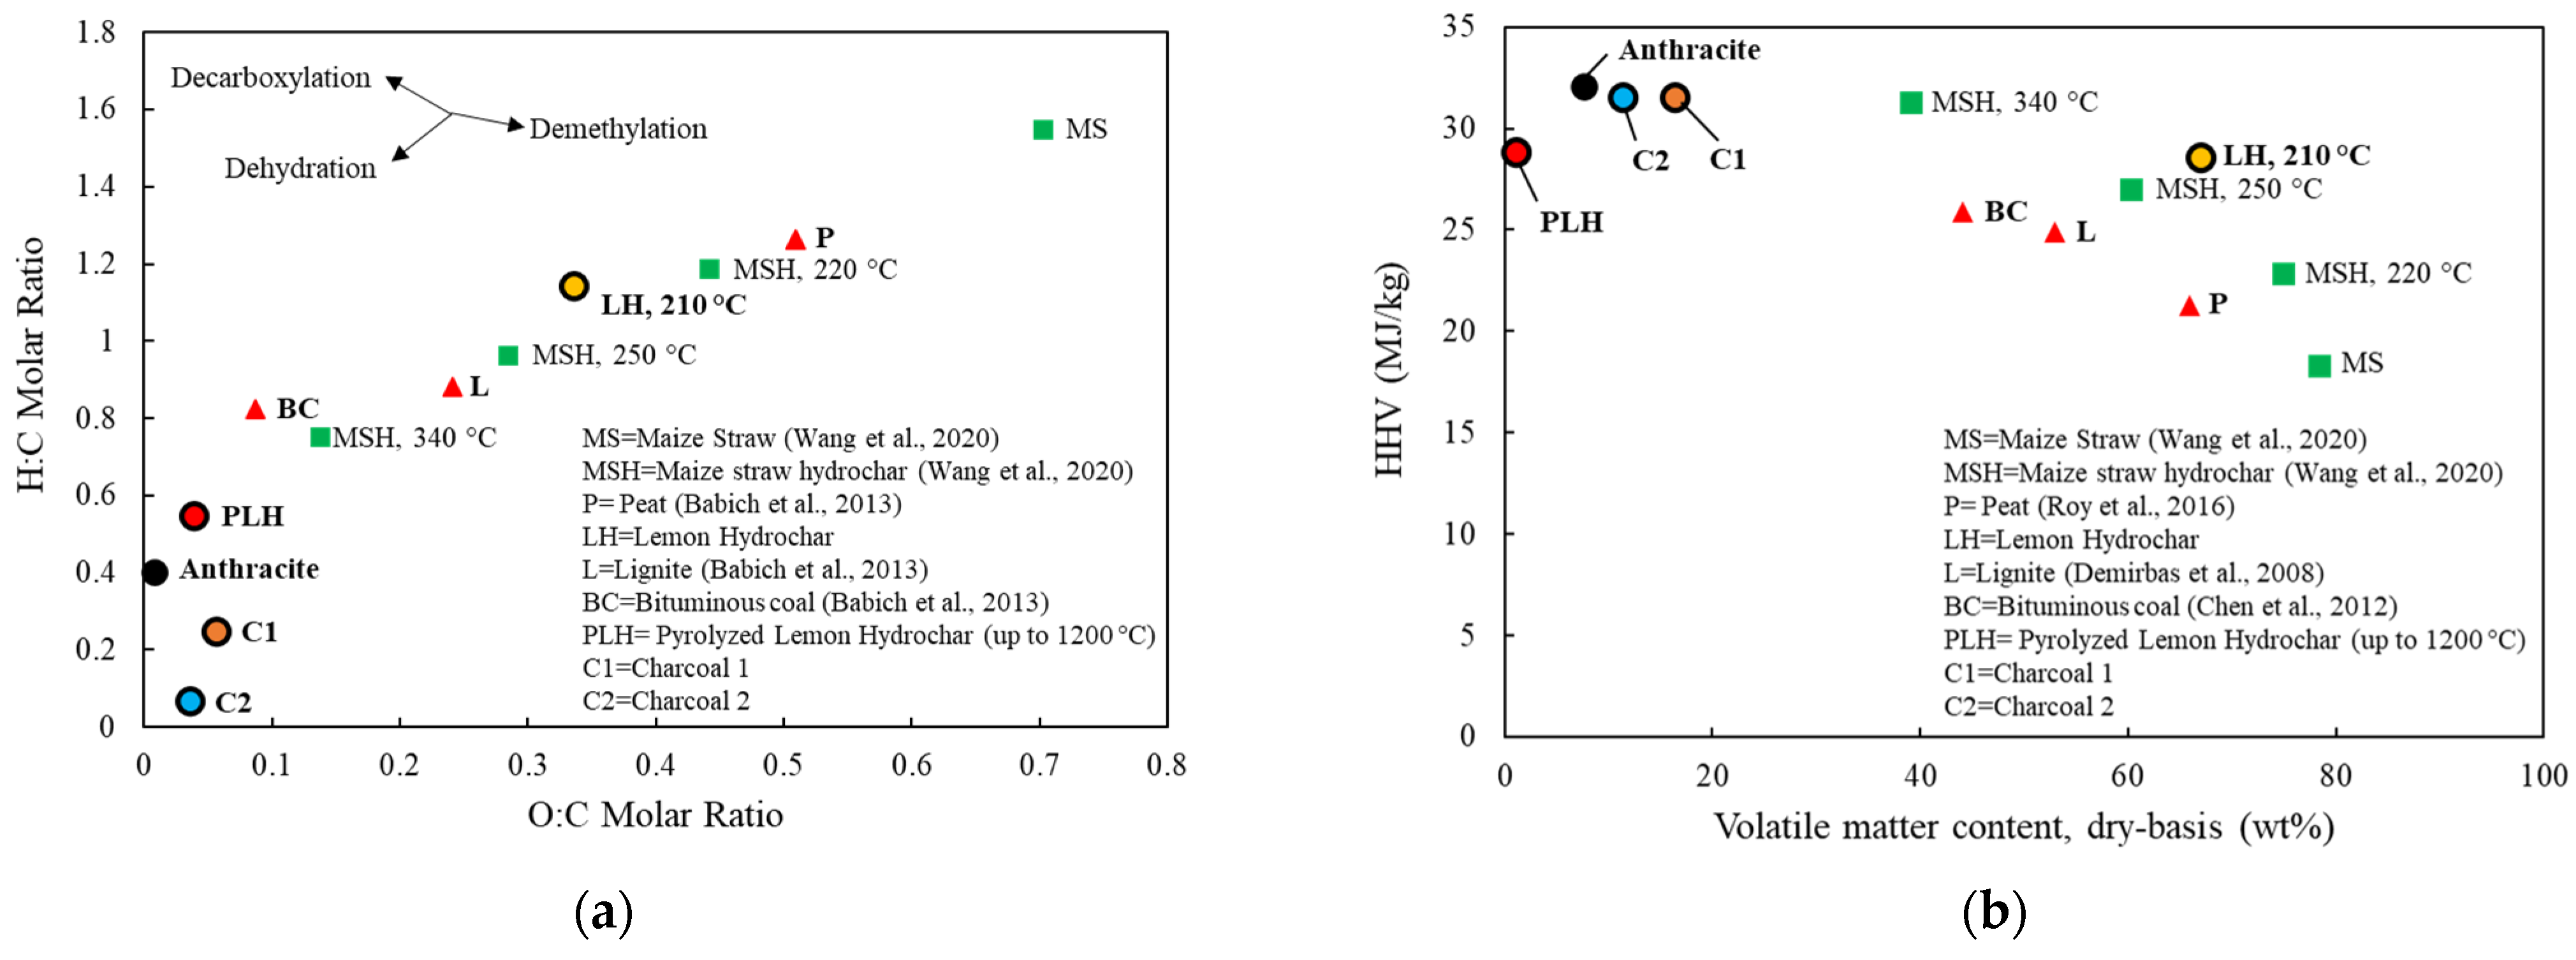

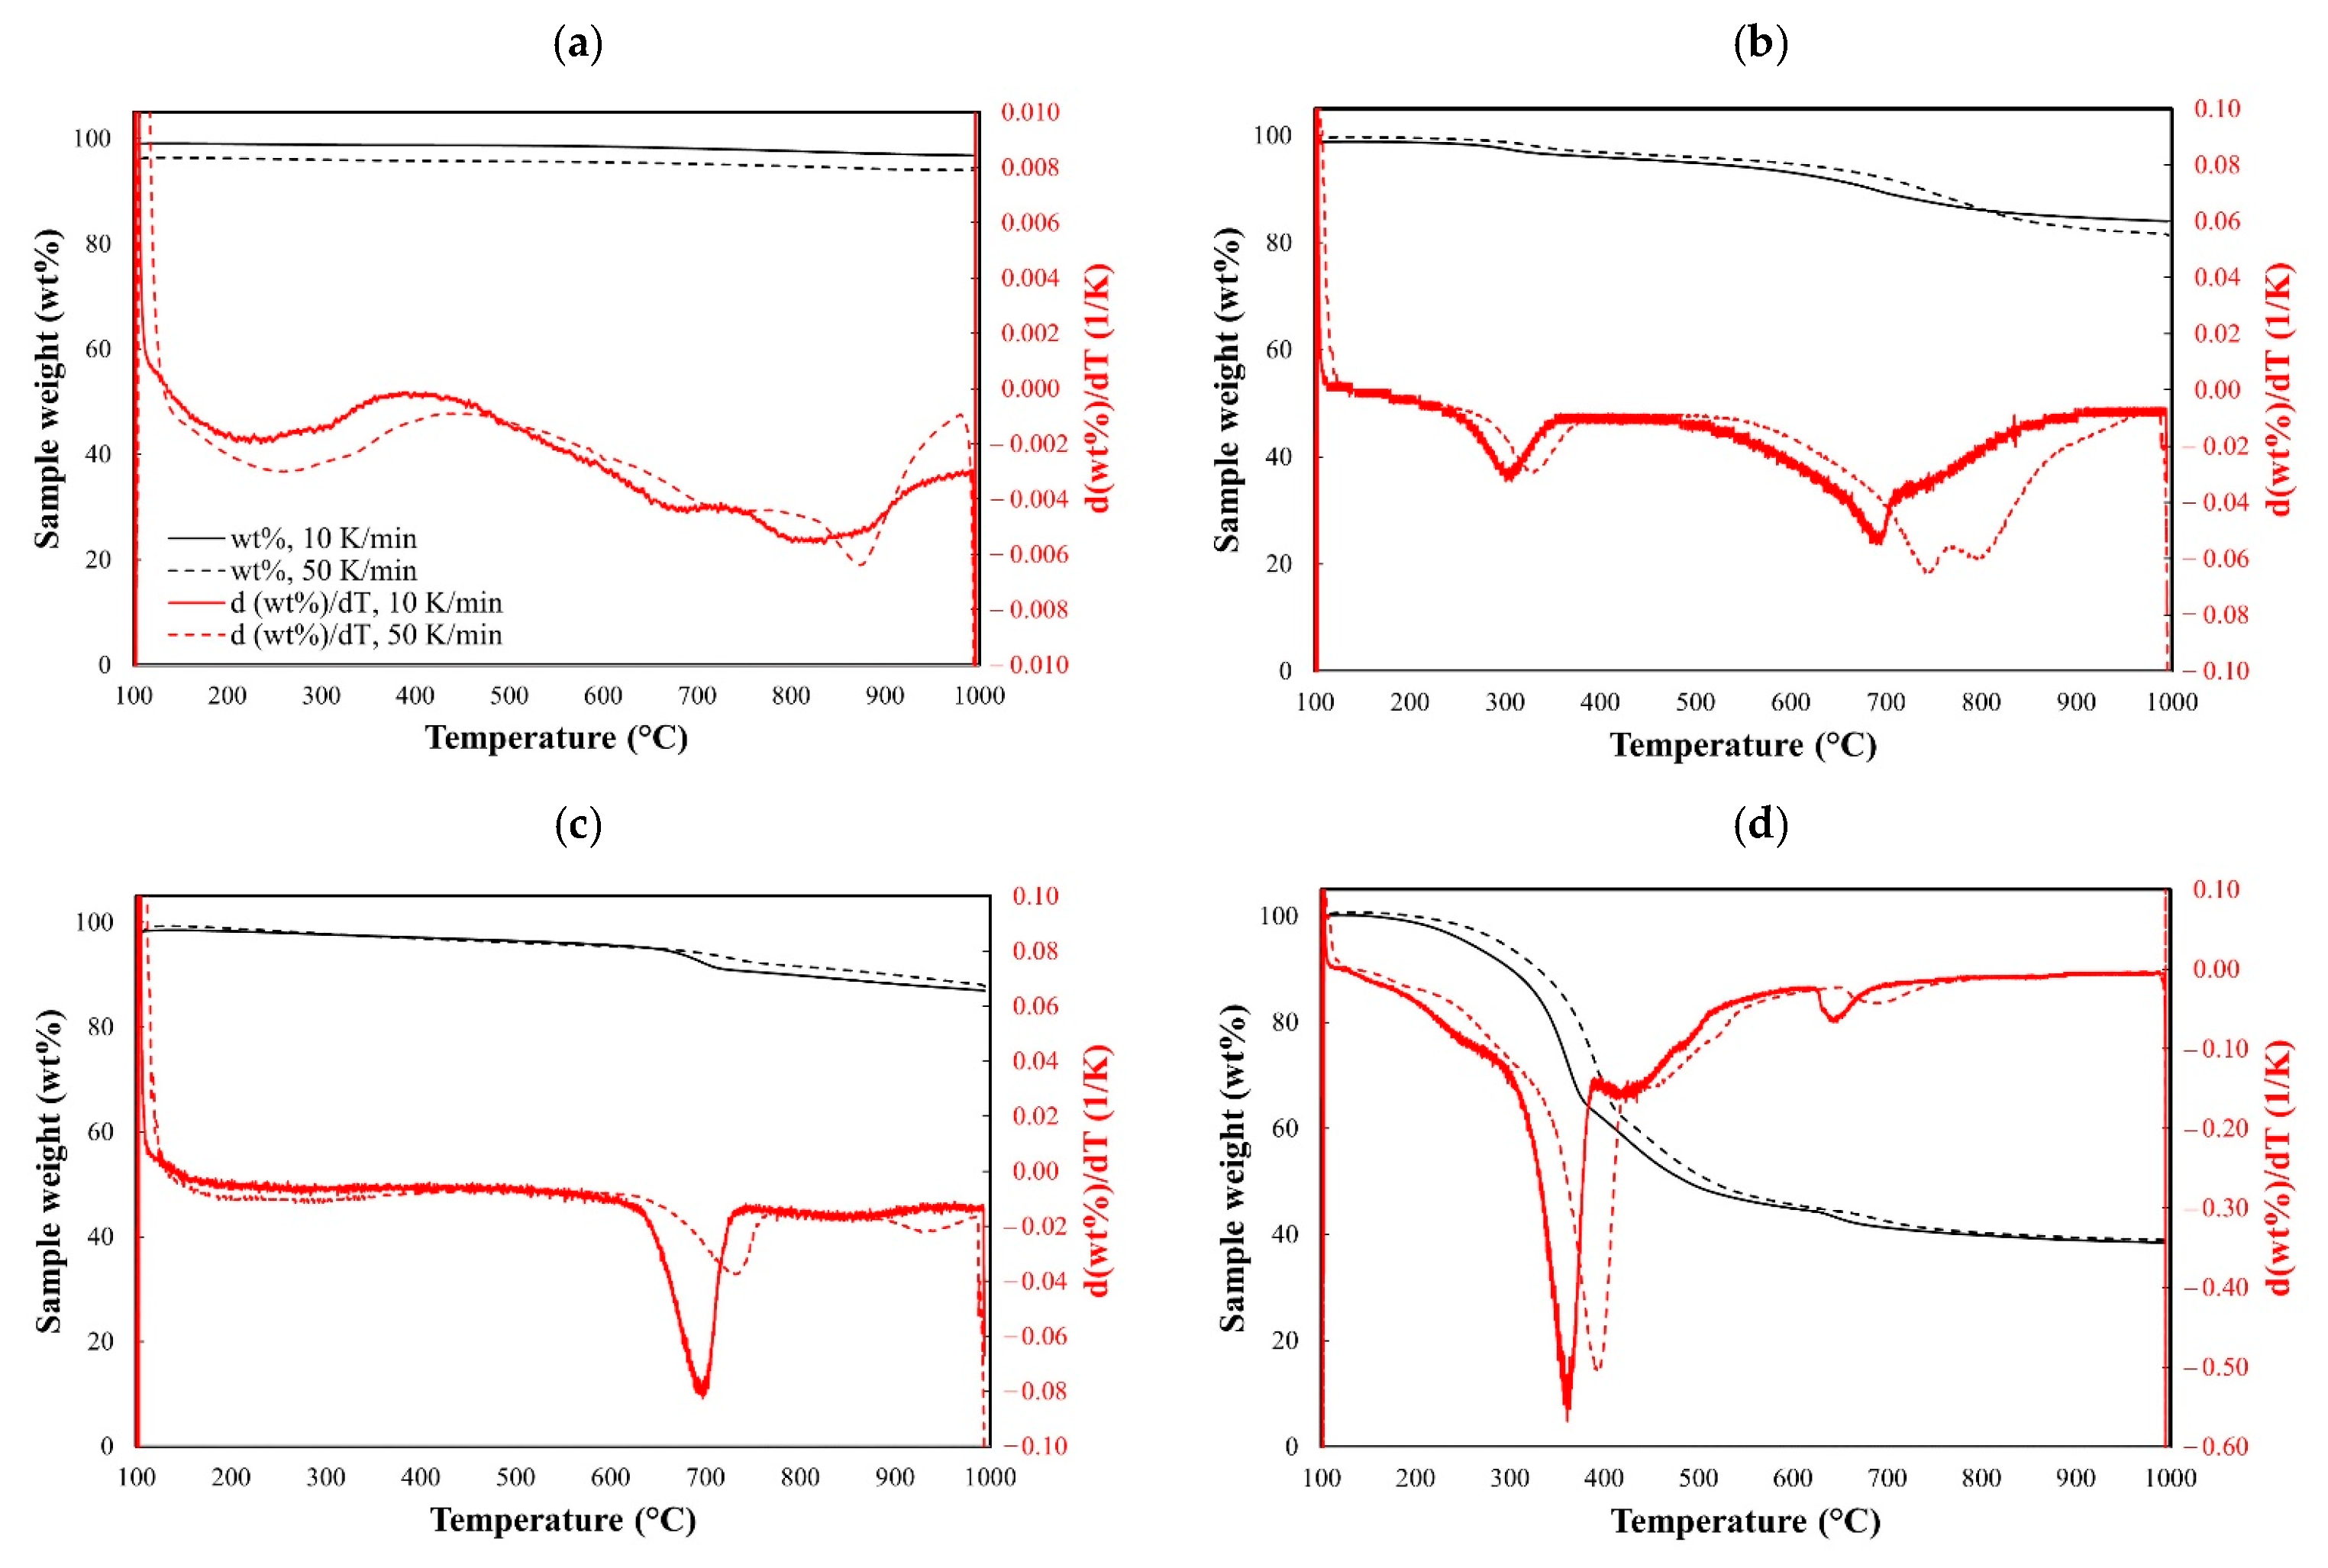

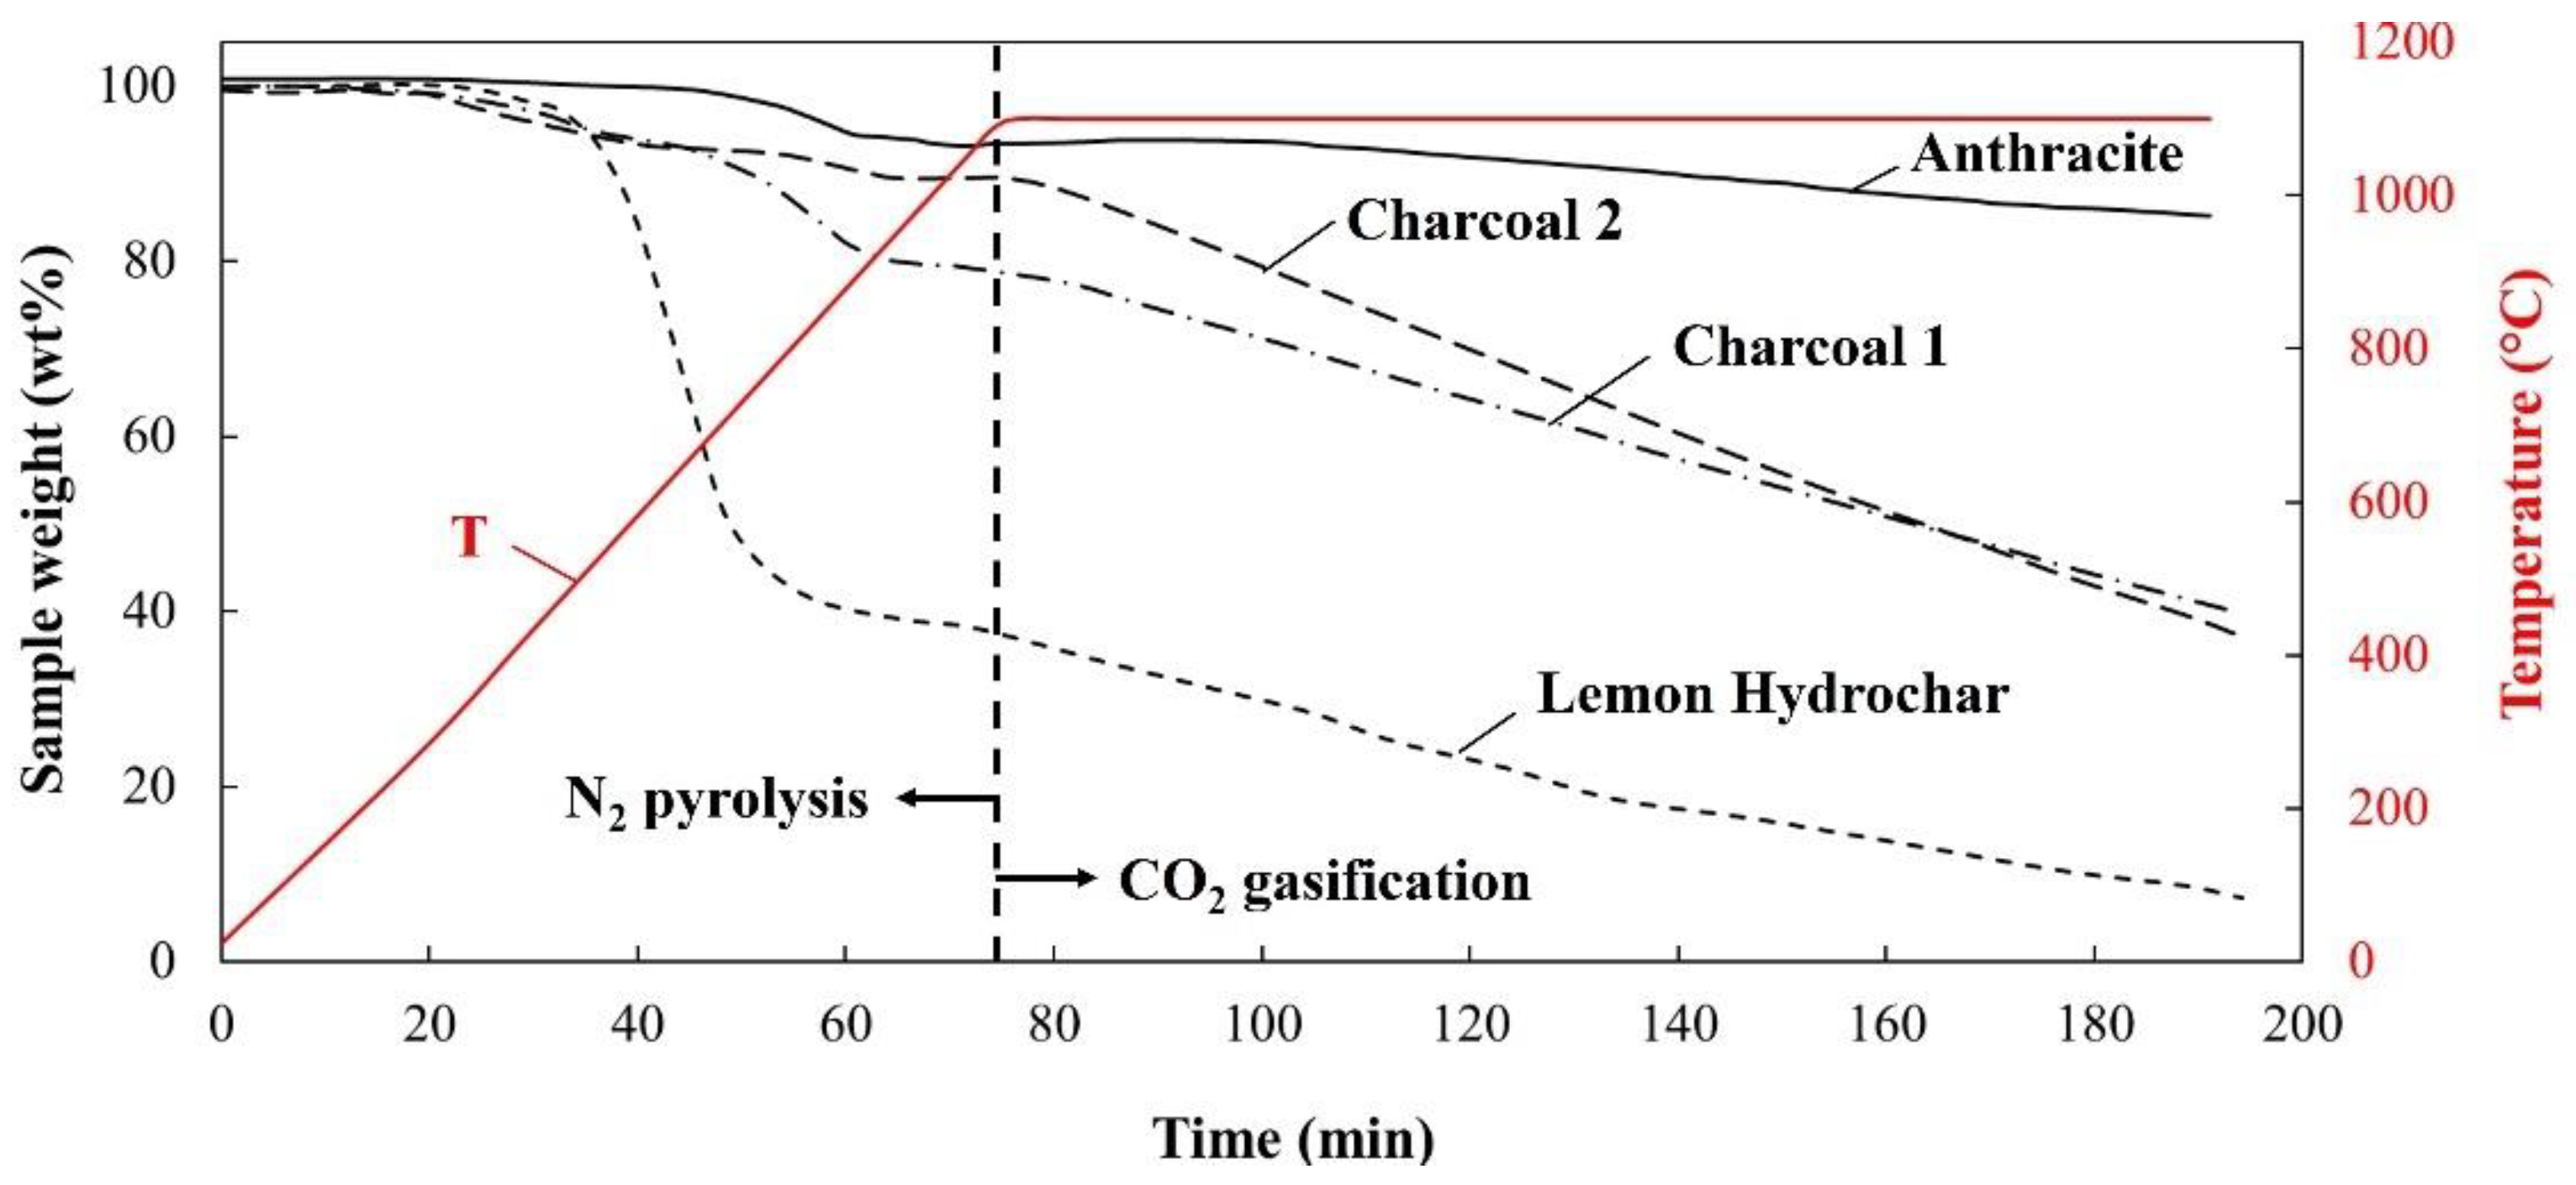
Publisher’s Note: MDPI stays neutral with regard to jurisdictional claims in published maps and institutional affiliations. |
© 2022 by the authors. Licensee MDPI, Basel, Switzerland. This article is an open access article distributed under the terms and conditions of the Creative Commons Attribution (CC BY) license (https://creativecommons.org/licenses/by/4.0/).