Article

Co-Combustion of Food Solid Wastes and Pulverized Coal for Blast Furnace Injection: Characteristics, Kinetics, and Superiority

1
School of Metallurgical Engineering, Anhui University of Technology, Ma’anshan 243002, China
2
Key Laboratory of Metallurgical Emission Reduction & Resources Recycling (Anhui University of Technology), Ministry of Education, Ma’anshan 243002, China
3
Department of Chemical and Biochemical Engineering, Institute for Chemicals and Fuels from Alternative Resources (ICFAR), Western University, London, ON N6GA5B9, Canada
*
Author to whom correspondence should be addressed.
Sustainability 2022, 14(12), 7156; https://doi.org/10.3390/su14127156
Submission received: 11 April 2022 / Revised: 4 June 2022 / Accepted: 5 June 2022 / Published: 10 June 2022

Abstract

:
The combustion characteristics and kinetics of food solid wastes (FSW), pulverized coal (PC), and their mixtures were studied by a non-isothermal thermogravimetric method. In the co-combustion of FSW and PC, with the increase in FSW content in the mixture, the initial decomposition temperature, burnout temperature, and ignition temperature of the mixture decreased, and the flammability index and comprehensive combustion characteristic index gradually increased. The co-combustion of FSW and PC showed an inhibitory effect in the devolatilization stage but exhibited a combustion-promoting effect in the fixed carbon combustion stage. The interaction between FSW and PC while co-combusting them appeared to be dominated by thermal effects. On one hand, FSW combusted first and released heat that was partially absorbed by the PC, which hence suppressed the devolatilization stage of the co-combustion process. On the other hand, the PC absorbed the heat released by the combustion of the FSW, which increased the combustion rate of the PC in the fixed carbon combustion stage of the co-combustion process. The activation energy of the devolatilization stage and the fixed carbon combustion stage of the co-combustion process was calculated to be 34.16–74.52 kJ/mol and 15.04–36.15 kJ/mol, respectively. In general, the combustion performance of FSW is better than that of PC. The mixed injection of FSW and PC can improve the overall combustion efficiency and reduce CO2 emissions in the iron-making process.

1. Introduction

With the rapid development of the global economy and the continuous increase in the population, the consumption of fossil fuels (coal, oil, and natural gas) is increasing. A large amount of greenhouse gases (CO2) produced in the combustion process promote global warming, and sea level rise, and the survival of glacial organisms and terrestrial plants and animals are facing a serious threat. Therefore, it is urgent to find and develop new green energy to replace fossil energy and solve the energy and natural life crisis. At present, researchers all over the world have replaced some fossil energies by developing and utilizing a variety of new energy sources such as wind energy, solar energy, tidal energy, and biomass [1,2]. Biomass energy is recognized as the fourth largest energy after coal, oil, and natural gas, and has a great development potential. Since biomass energy is the energy provided by plants, and the energy in plants is solar energy stored through photosynthesis, it will not cause carbon emissions [3]. As one of the main by-products in human daily life, food solid wastes (FSW) is rich in organic substances such as protein, starch, fat, and cellulose [4]. It is a kind of biomass energy with high additional utilization value.
The average annual output of food waste in China is more than 180 million tons, the water content of food waste is about 80%, and the dry weight of food waste is about 36 million tons per year [5,6]. Therefore, how to reasonably deal with and utilize FSW is a major challenge for mankind. At present, the treatment technologies of FSW mainly include incineration, landfill, feed treatment, aerobic composting, and anaerobic digestion. The incineration method is to concentrate the FSW in the incinerator and use the high-temperature environment to oxidize and decompose the organic substances in the FSW [7]. The heat generated in the combustion process can be used for power generation or heating [8]. However, in the incineration process, the lipid substances in FSW will form dioxins under the catalysis of heavy metals, causing serious secondary pollution to the environment. The landfill method is a traditional treatment method of FSW [9]. It is applied because of its simplicity, convenience, and low treatment cost. However, its disadvantages are also quite obvious. It occupies a lot of land, has a limited treatment capacity, and pollutes the surrounding air, soil, and groundwater. Especially now, land resources are tight, and green sustainable development is advocated. In Japan and South Korea, 35.9% and 42.5% of FSWs are recycled for feed treatment, respectively [10]. However, feed processing is difficult to avoid the problem of protein homology, and animal-derived feed will enrich the toxins produced by pathogenic microorganisms in livestock and enter the human body through the food chain compost that can be divided into anaerobic compost and aerobic compost [11,12]. Song et al. studied new heat-resistant compound bacteria to improve the efficiency and quality of composting in the treatment of FSW under high temperature conditions [13], However, FSW is complex, the harmful substances and heavy metals cannot be effectively solved, and too long a composting time will cause soil salinization. Anaerobic digestion is a technology that uses microorganisms to decompose complex high molecular organic matter into small molecular organic matter and inorganic matter under anaerobic conditions. The addition of biochar and zero-valent iron alone can promote the anaerobic digestion of FSW to produce methane [14,15]. Yuan et al. used both biochar and zero-valent iron for the anaerobic digestion of FSW and found that the advantages of both could be used to complement the methane produced by anaerobic digestion [16]. However, the disadvantage of this technology is that microorganisms have high pH requirements, and excess ammonia and volatile fatty acids will seriously affect the pH value of the reaction environment and inhibit the reaction process [17].
As the main reactor for ironmaking [18], the blast furnace is provided with a reducing agent and heat by pulverized coal (PC) and coke and emits a large amount of CO2 while producing molten iron. Due to the limited coke resources and the high cost, PC injection is usually used to replace some coke in order to reduce the coke ratio [19]. In recent years, considering low-carbon emission reduction and the comprehensive utilization of resources, researchers have adopted injecting combustible solid waste instead of part of PC into blast furnaces. It has played a beneficial role in reducing the cost, increasing the efficiency, and the low-carbon emission reduction of blast furnaces, and realized harmless treatment and resource utilization of combustible solid waste. However, there are few studies on the injection of FSW into blast furnaces, and the combustion characteristics and reaction mechanism of FSW mixed with PC are not clear. The injection of FSW into blast furnaces is a relatively new way of solid waste treatment. On the one hand, compared with traditional combustion, the theoretical combustion temperature of blast furnaces is usually above 2000 °C, and no polluting gas will be produced in the combustion process [20]. On the other hand, at the blast furnace tuyere, the products of fuel combustion are usually CO and H2. The H/C of FSW is higher than that of PC, so it produces more hydrogen than PC, which is conducive to the reduction of iron ore in blast furnaces. In addition, the ash content and sulfur content of FSW are low, so the injection of FSW into blast furnaces has a broad prospect. Zhou et al. studied the combustion performance of single component FSW and their mixtures. It was found that the order of ignition temperature is waste vegetable < waste meat < waste rice < waste steamed bread < coal, and the order of burnout temperature is waste vegetable < waste steamed bread < waste rice < waste meat < coal [21]. Therefore, the combustion performance of solid waste from different kitchens is different, but it is better than that of PC. Moreover, there is a promoting effect between the mixed FSW, so the mixed FSW is very suitable for blast furnace injection.
However, the demand for injection fuel in blast furnace ironmaking is huge. The annual consumption of blast furnace injection coal in China is about 133 million tons [22], while the annual dry weight of food waste is about 36 million tons. Therefore, FSW is only a supplement to blast furnace injection fuel. The mixed injection of FSW and PC is an inevitable choice for blast furnaces to treat FSW. Therefore, it is very important to study the co-combustion characteristics of FSW and blast furnace injection coal. However, most of the previous studies focused on the combustion characteristics of the FSW mixture, while the research on the combustion characteristics of FSW mixed with blast furnace coal injection is rarely mentioned. In previous studies on the mixture of biomass and PC as blast furnace injection fuel, thermogravimetric analysis was often used to study the thermal conversion performance and combustion kinetics of biomass and PC [23,24]. Thermogravimetric analysis is also recommended by the Kinetics Committee of the International Confederation for Thermal Analysis and Calorimetry (ICTAC) to study the combustion properties of biomass and PC [25]. In this paper, the co-combustion characteristics of FSW and PC are studied by a non-isothermal thermodynamic method, and the combustion kinetics of the FSW and PC mixture are analyzed by the Coats–Redfern calculation. It is expected to provide theoretical support for the mixed injection of PC and FSW in blast furnaces.

2. Materials and Methods

2.1. Materials

The experimental FSW samples were taken from the campus restaurant of Anhui University of technology, China. It is mainly composed of waste meat (WM), waste steamed bread (WSB), waste rice (WR), and waste vegetables (WV). WV is composed of waste cabbage (WC), waste cauliflower (WCF), and waste banana peel (WBP). The material distribution proportion of WV and mixed samples is shown in Table 1. The type of PC used in the experiment is mixed coal for blast furnace injection, which comes from Baosteel. Before the test, the sample is dried in an oven with a temperature of 378 K for 24 h, and then crushed and screened with a micro pulverizer to obtain a dry basis sample with more than 120 mesh, which is then sealed in a self-sealing bag for test. The industrial analysis standard of FSW is the National Standard of the People’s Republic of China GB/T 28731-2012 ‘Proximate analysis of solid biofuels’ [26], and the analysis standard of coal powder is the National Standard of the People’s Republic of China GB/T 212-2008 ‘Proximate analysis of solid biofuels’ and GB/T 31391-2015 ‘Ultimate analysis of coal’ [27,28]. The industrial analysis and elemental analysis of the above experimental samples are shown in Table 2. The particle size of FSW was detected by a laser particle size analyzer (Bettersize 2600). The results are shown in Figure 1. It can be seen from Figure 1 that the particle size of 90% of the FSW is less than 327.9 μm.

2.2. Method

2.2.1. Experimental Setup

The micro surface morphology of FSW and PC was observed by scanning electron microscope (SEM) (JSW-6510LV, Jeol Ltd., Akishima, Japan). The molecular structure was identified by infrared spectrum analyzer (Nicolet 6700 FT-IR, Thermo Electron, Waltham, MA, USA). The thermogravimetric characteristics of FSW, PC, and their mixtures at different heating rates were studied by non-isothermal thermogravimetric analysis (TG) and high temperature thermogravimetric analyzer (Setsys 2400, °C SETARAM instrumentation, Caluire-et-Cuire, France). In previous experiments using thermogravimetric analysis to study the combustion characteristics of biomass, the gas flow rate was generally 30–60 mL/min [21,29,30]. In this experiment, the gas flow rate of 30 mL/min was selected. Before the experiment, 30 mL/min of air was introduced for 30 min, and then the thermogravimetric experiment was carried out. During the experiment, on the basis of the blank experiment, put approximately 9 mg of sample in a crucible with a height of 7 mm and a diameter of 3 mm, and the heating rates are 2.5 K/min, 5 K/min, 10 K/min and 20 K/min, respectively. The program automatically records the mass change of the sample from 323 K to 1050 K. The weight loss rate of the sample is expressed as follows:
x = m 0 m t m 0 m
where m 0 represents the initial mass of the sample; m t is the instantaneous mass of the sample at that time; m is the final mass of the sample. The reaction rate is calculated according to the decomposition degree of the sample and the change with time, which is recorded as d x / d t .

2.2.2. Determination of Combustion Characteristic Parameters

Determine the initial decomposition temperature ( T i n ), peak temperature ( T m a x ), burnout temperature ( T p ) and ignition temperature ( T i ) of the sample according to the thermal weight loss TG and DTG curves. After the initial moisture evaporation peak on the DTG curve, the temperature corresponding to the weight loss rate of the sample reaching 1%/min is T i n , and the temperature corresponding to the maximum weight loss rate on the DTG curve is T m a x . When the sample is completely oxidized and the weight loss rate decreases to 1 %/min, it is T p . Ignition temperature T i is calculated and determined according to TG-DTG tangent method [31,32].
Flammability Index C b :
C b = ( d x / d t ) m a x T i n 2
C b mainly reflects the reaction ability of the sample in the early stage of combustion. The larger the ratio, the better the flammability.
Integrated combustion characteristic index S N :
S N = ( d x / d t ) m a x ( d x / d t ) a v e T i 2 T p
where: ( d x / d t ) a v e is the average burning speed of the sample. The larger the S N ratio, the better the combustion characteristics of the sample [33].

2.2.3. Kinetics Model

Assuming that the combustion process of the sample is a gas–solid non catalytic heterogeneous reaction, the combustion rate can be expressed as [33,34]:
d x d t = k f ( x )
where: k is the apparent gasification reaction rate constant, which depends on the temperature T, and the relationship between k and reaction temperature T (thermodynamic temperature) can be expressed by the famous Arrhenius equation:
k = A e x p ( E R T )
Since the heating rate β = d T d t is constant, the above formula is changed to:
d x d T = A β e x p ( E R T ) f ( x )
Take f ( x ) = ( 1 x ) n , so according to the law of conservation of mass in chemical reaction and the derivative method, combined with the above Arrhenius, it can be simplified by the Coats–Redfern method [35,36]:
When n = 1,
l n [ l n ( 1 x ) T 2 ] = l n [ A R β E ( 1 2 R T E ) ] E R T
When n ≠ 1,
l n [ 1 ( 1 x ) n T 2 ( 1 n ) ] = l n [ A R β E ( 1 2 R T E ) ] E R T
Since for most E/RT     1, 1 2 R T E 1 , the first term on the right end is almost constant. Let Y be the left end, the first term on the right end is b, and the first term on the right end is −E/R is a, 1/T is X, make a straight-line Y = b + aX, and obtain the E and A of the burning sample through the slope and intercept of the straight line.

3. Results and Discussion

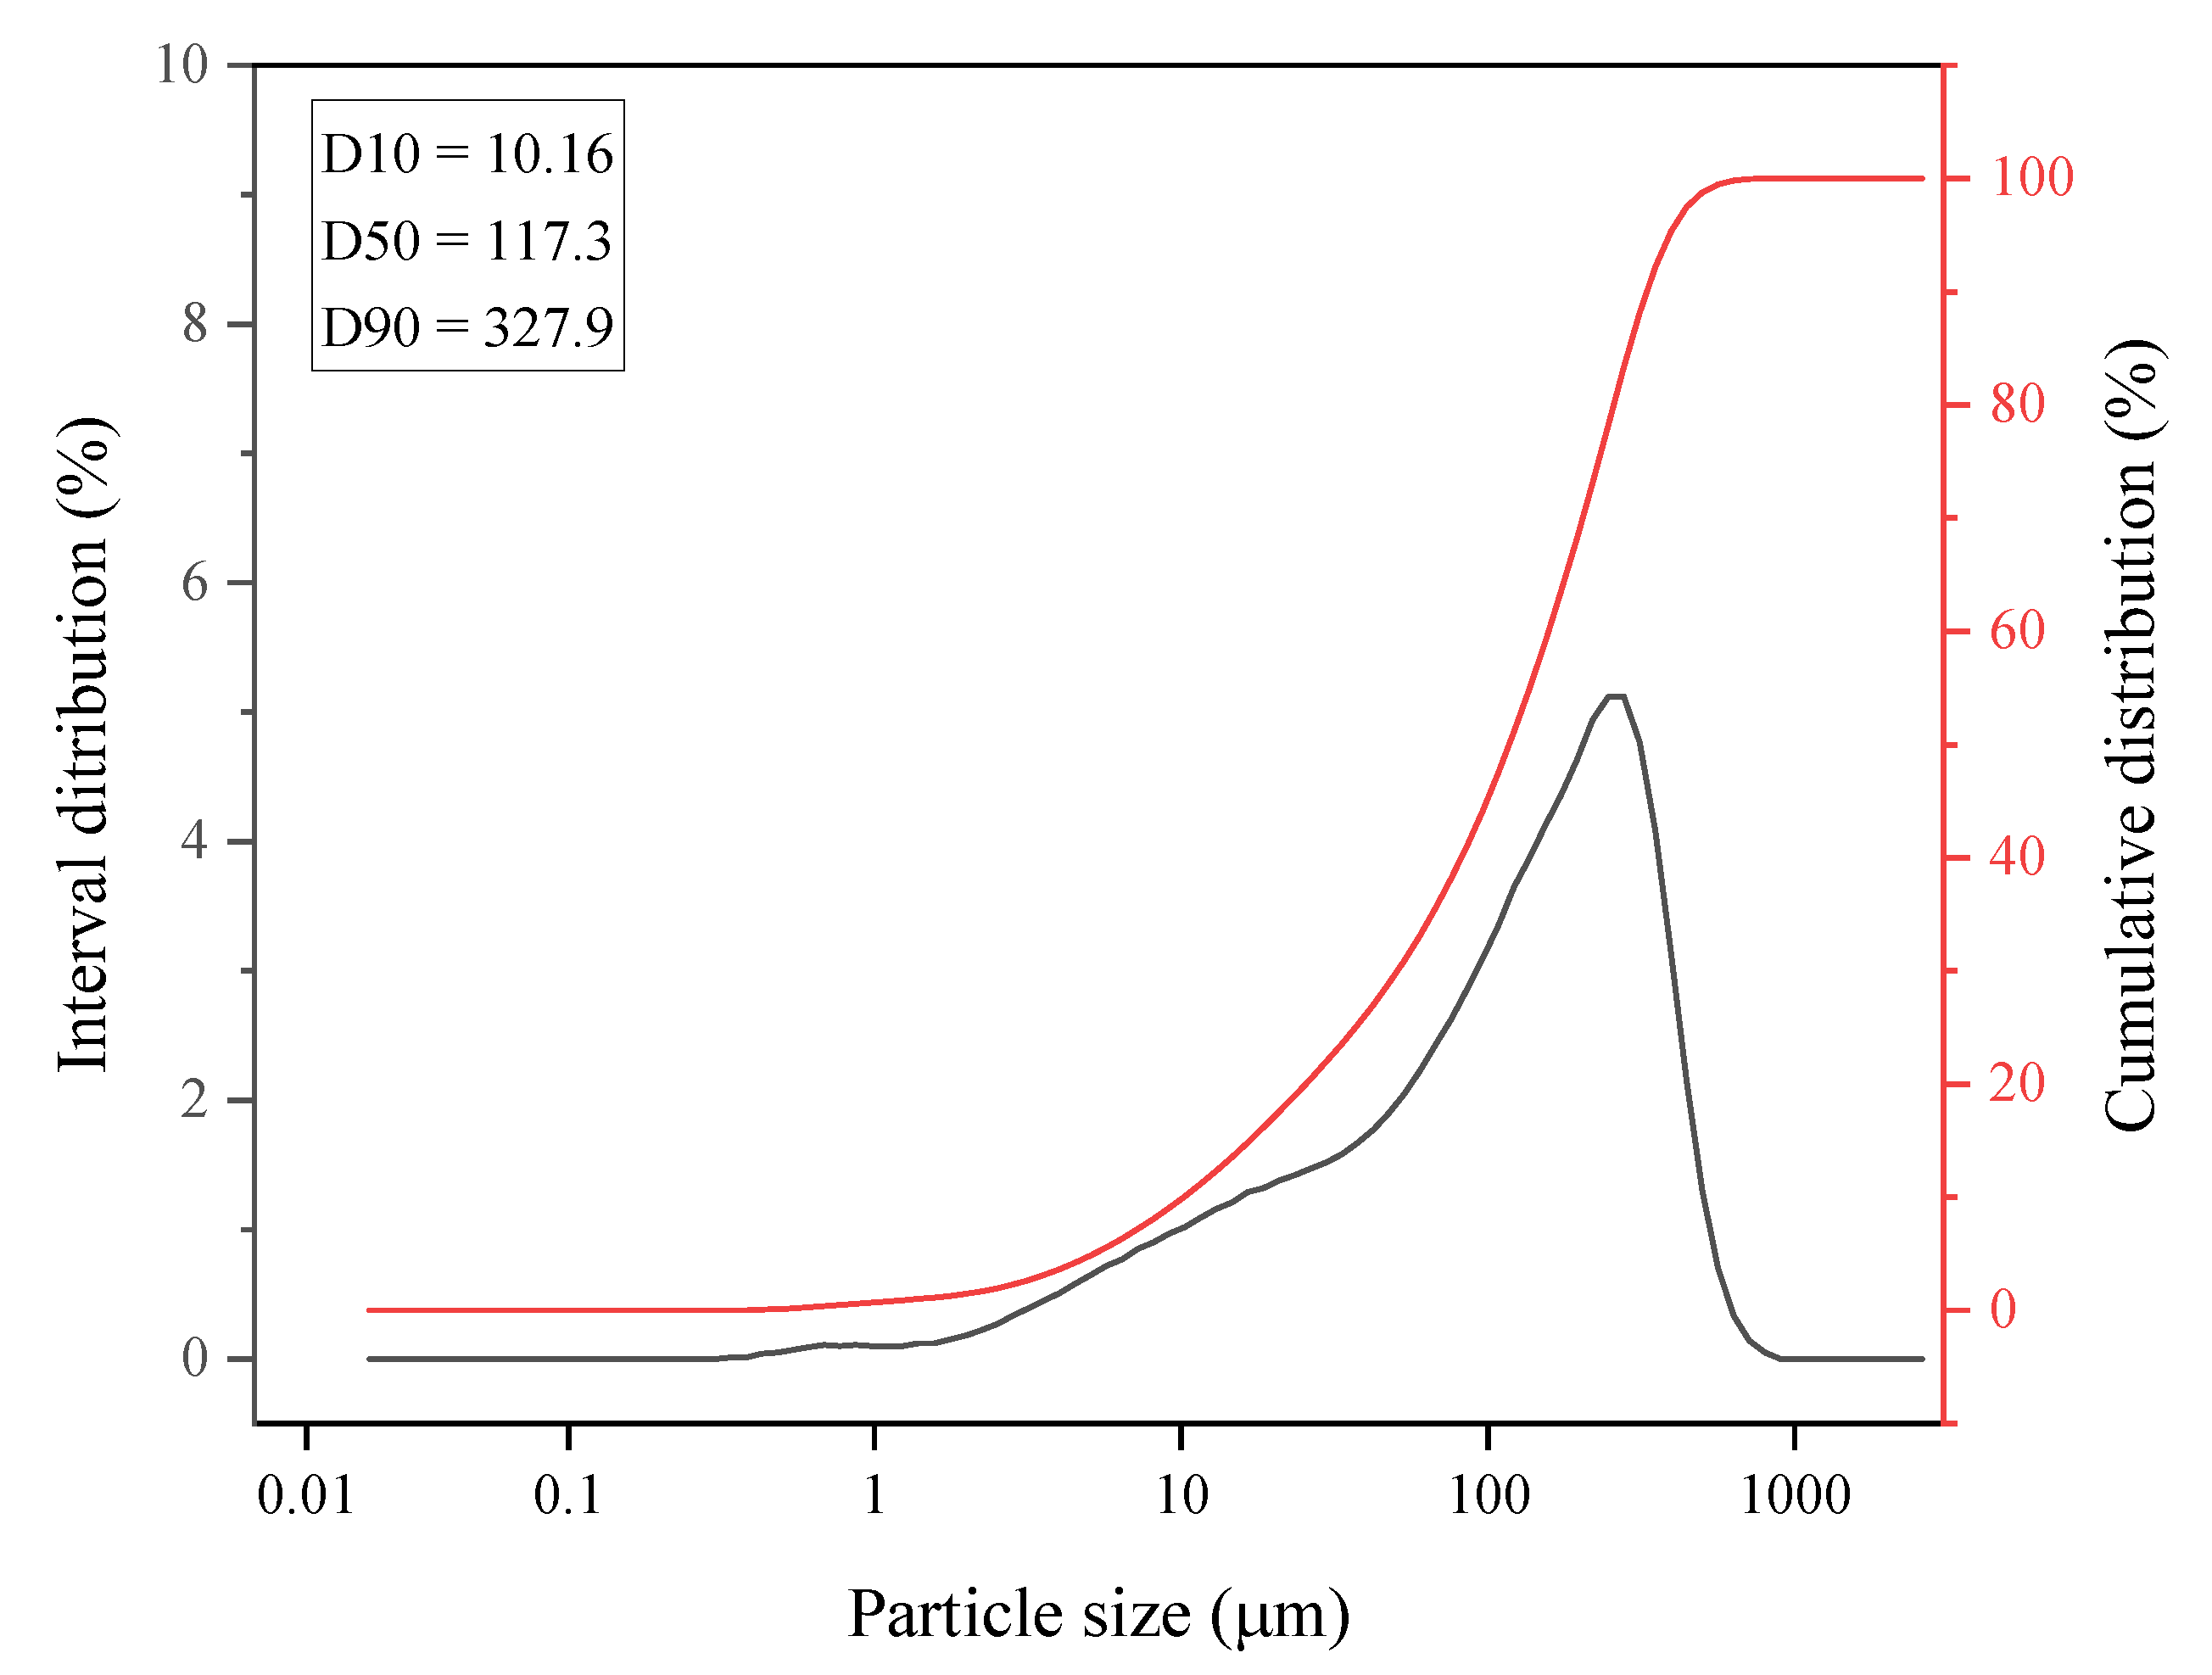
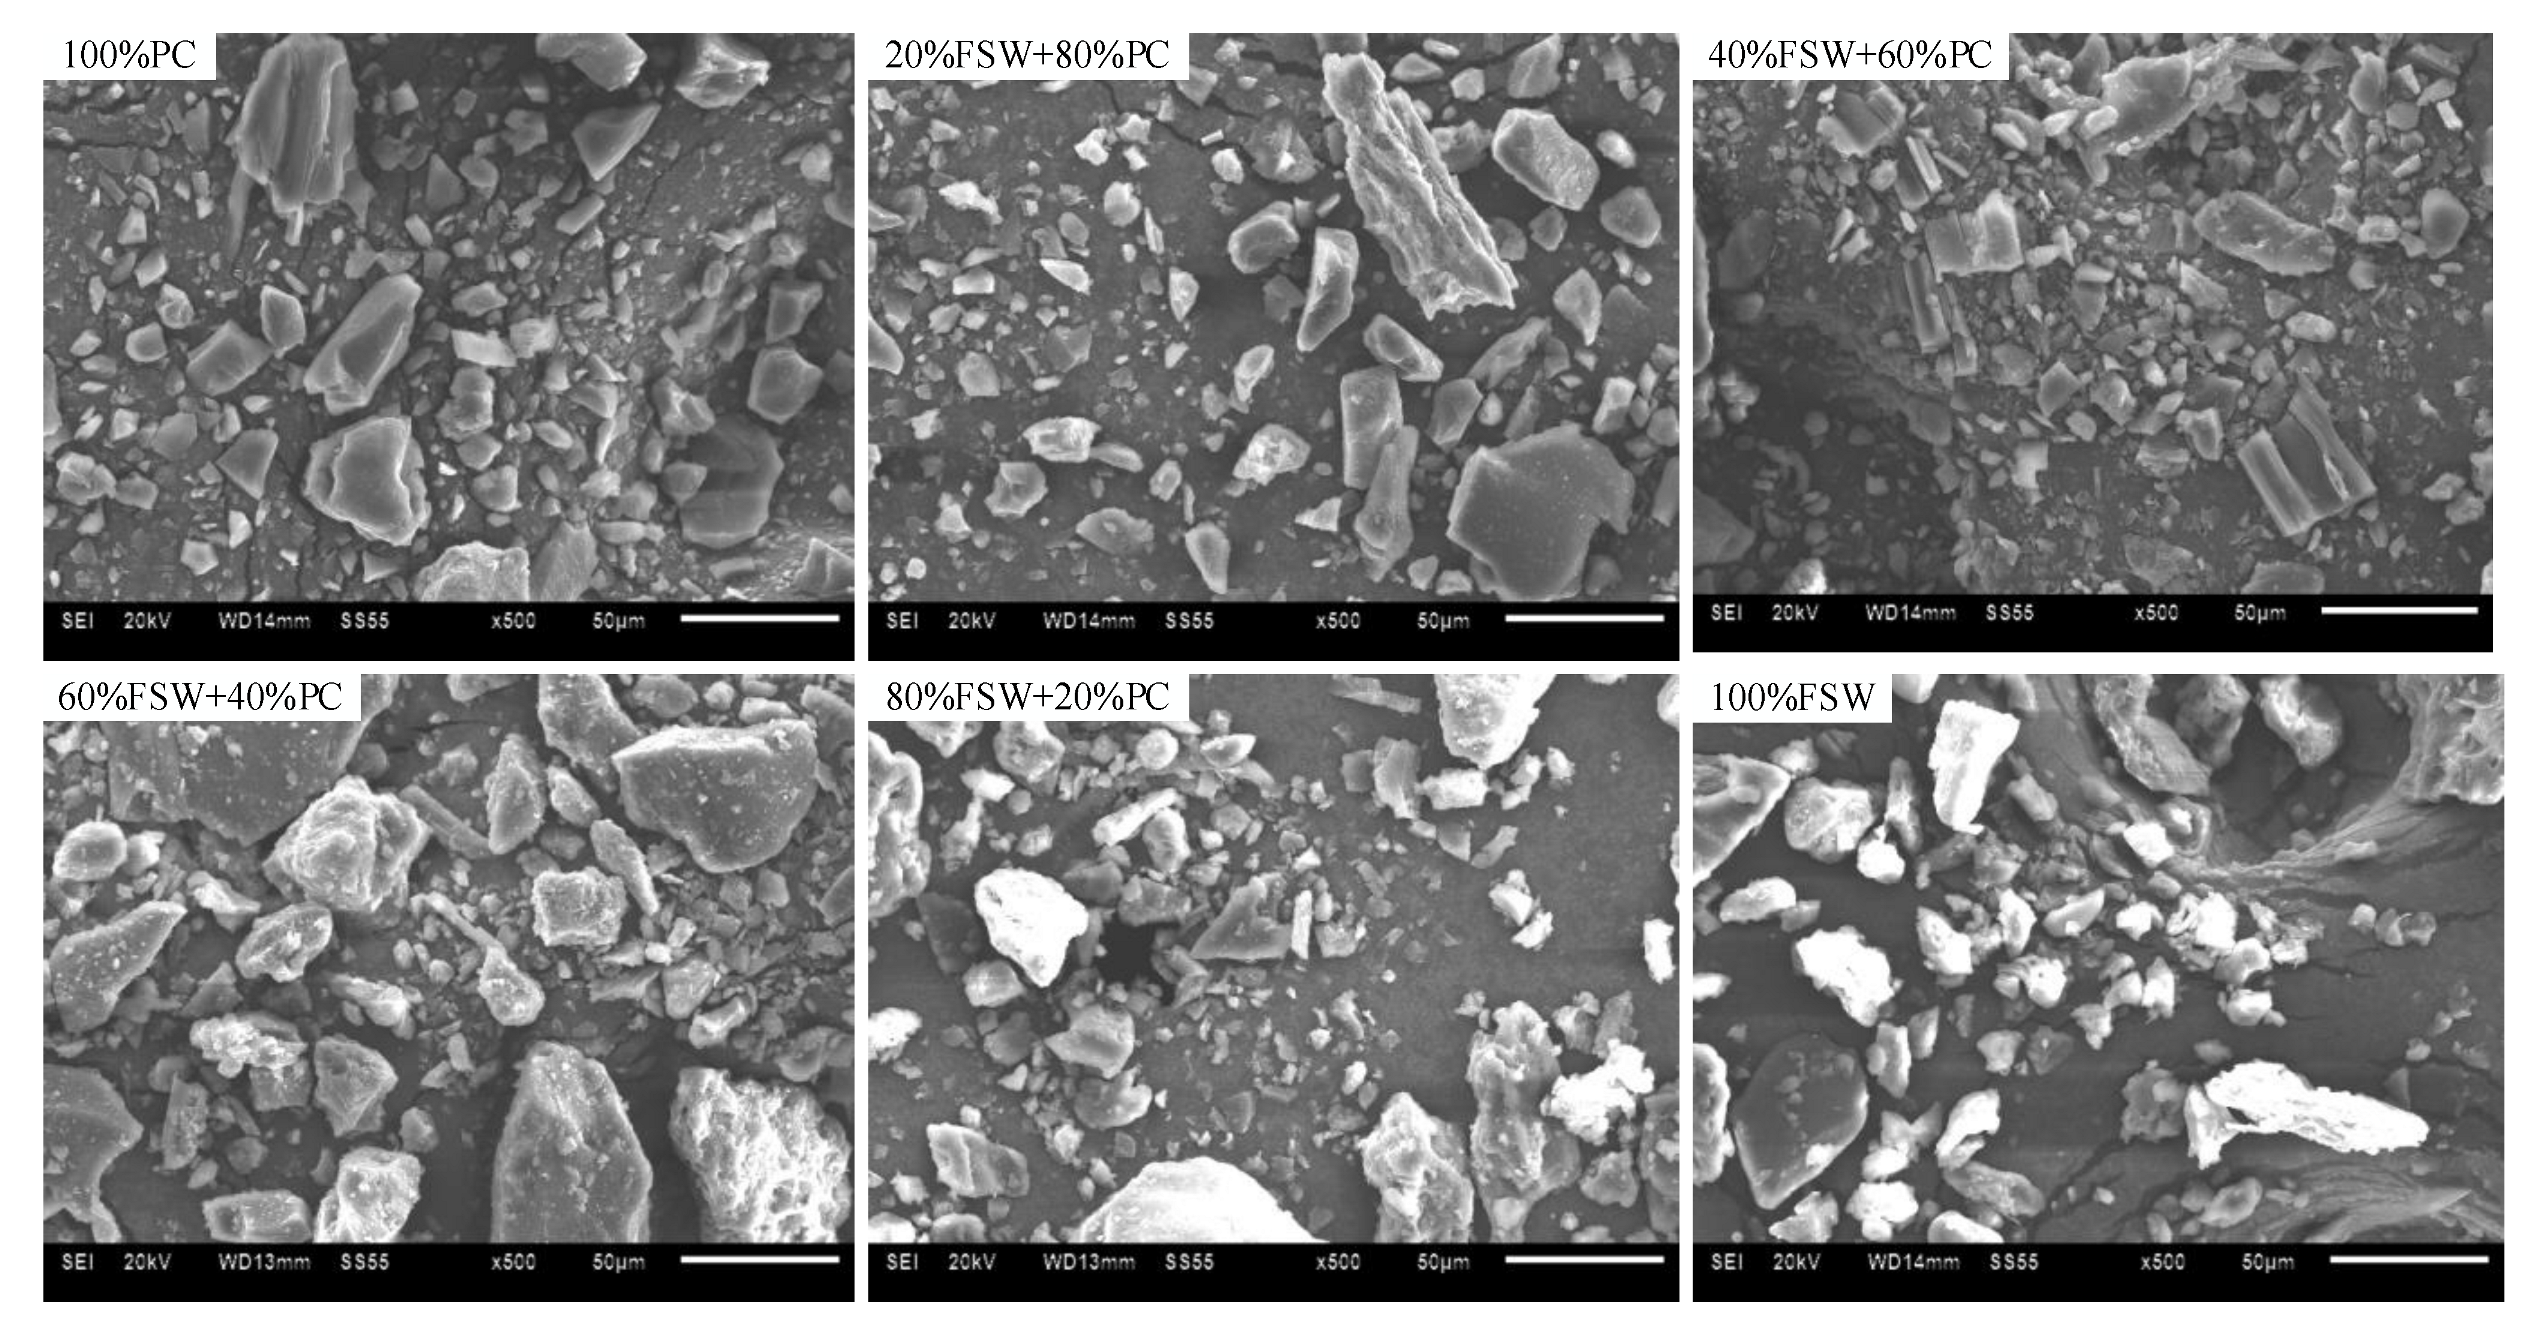
3.1. Analysis of Physical and Chemical Characteristics

The elemental analysis and industrial analysis results of FSW and PC are shown in Table 2. The fixed carbon and ash content of FSW are lower than that of PC, and the ash content of FSW is only 10.36% of that of PC. The volatile content of FSW is 2.55 times that of PC, the hydrogen content is 4.32 times that of PC, and its LHV is slightly higher than that of PC. The sulfur contents of FSW are similar to those of PC. Through the FTIR analysis of the original sample in Figure 2 and the comparison with the corresponding functional group parameters in Table 3, it can be seen that FSW is mainly composed of different functional groups such as benzene stretching ring, alkyl, aliphatic, aromatic, and amine groups, while PC is mainly composed of aromatic hydrogen, alkyl, aliphatic, aromatic, and different functional groups. The infrared characteristic peaks of FSW and PC have a large difference in peak shape between 900–700 cm−1, and the peak intensity of PC is higher and the content of C-H bonds is higher. The characteristic peaks of FSW and PC are between 1700–900 cm−1, indicating that the content of C-O, C=C and C-O-C is high in both. The peak shapes of FSW and PC between 2970–2860 cm−1 are basically similar, but the peak intensities are different, and the peak intensity of FSW is larger, indicating that the C-Hn bond content of FSW is high. The position deviation of the infrared spectral characteristic peaks of the coal powder and FSW mixture from that of the coal powder and FSW mixture was not large, and no characteristic peak combining the two was found, indicating that the two belonged to the physical mixing state. Figure 3 shows the SEM images of FSW, PC, and their mixtures. Zhou et al. found that the surface of PC is smooth, and the surface of FSW has wrinkles and a large number of holes [21]. With the increase in FSW content in the mixture, it can be seen that the number of particles with wrinkles and holes is increasing and the number of particles with a smooth surface is decreasing.

3.2. Combustion Analysis

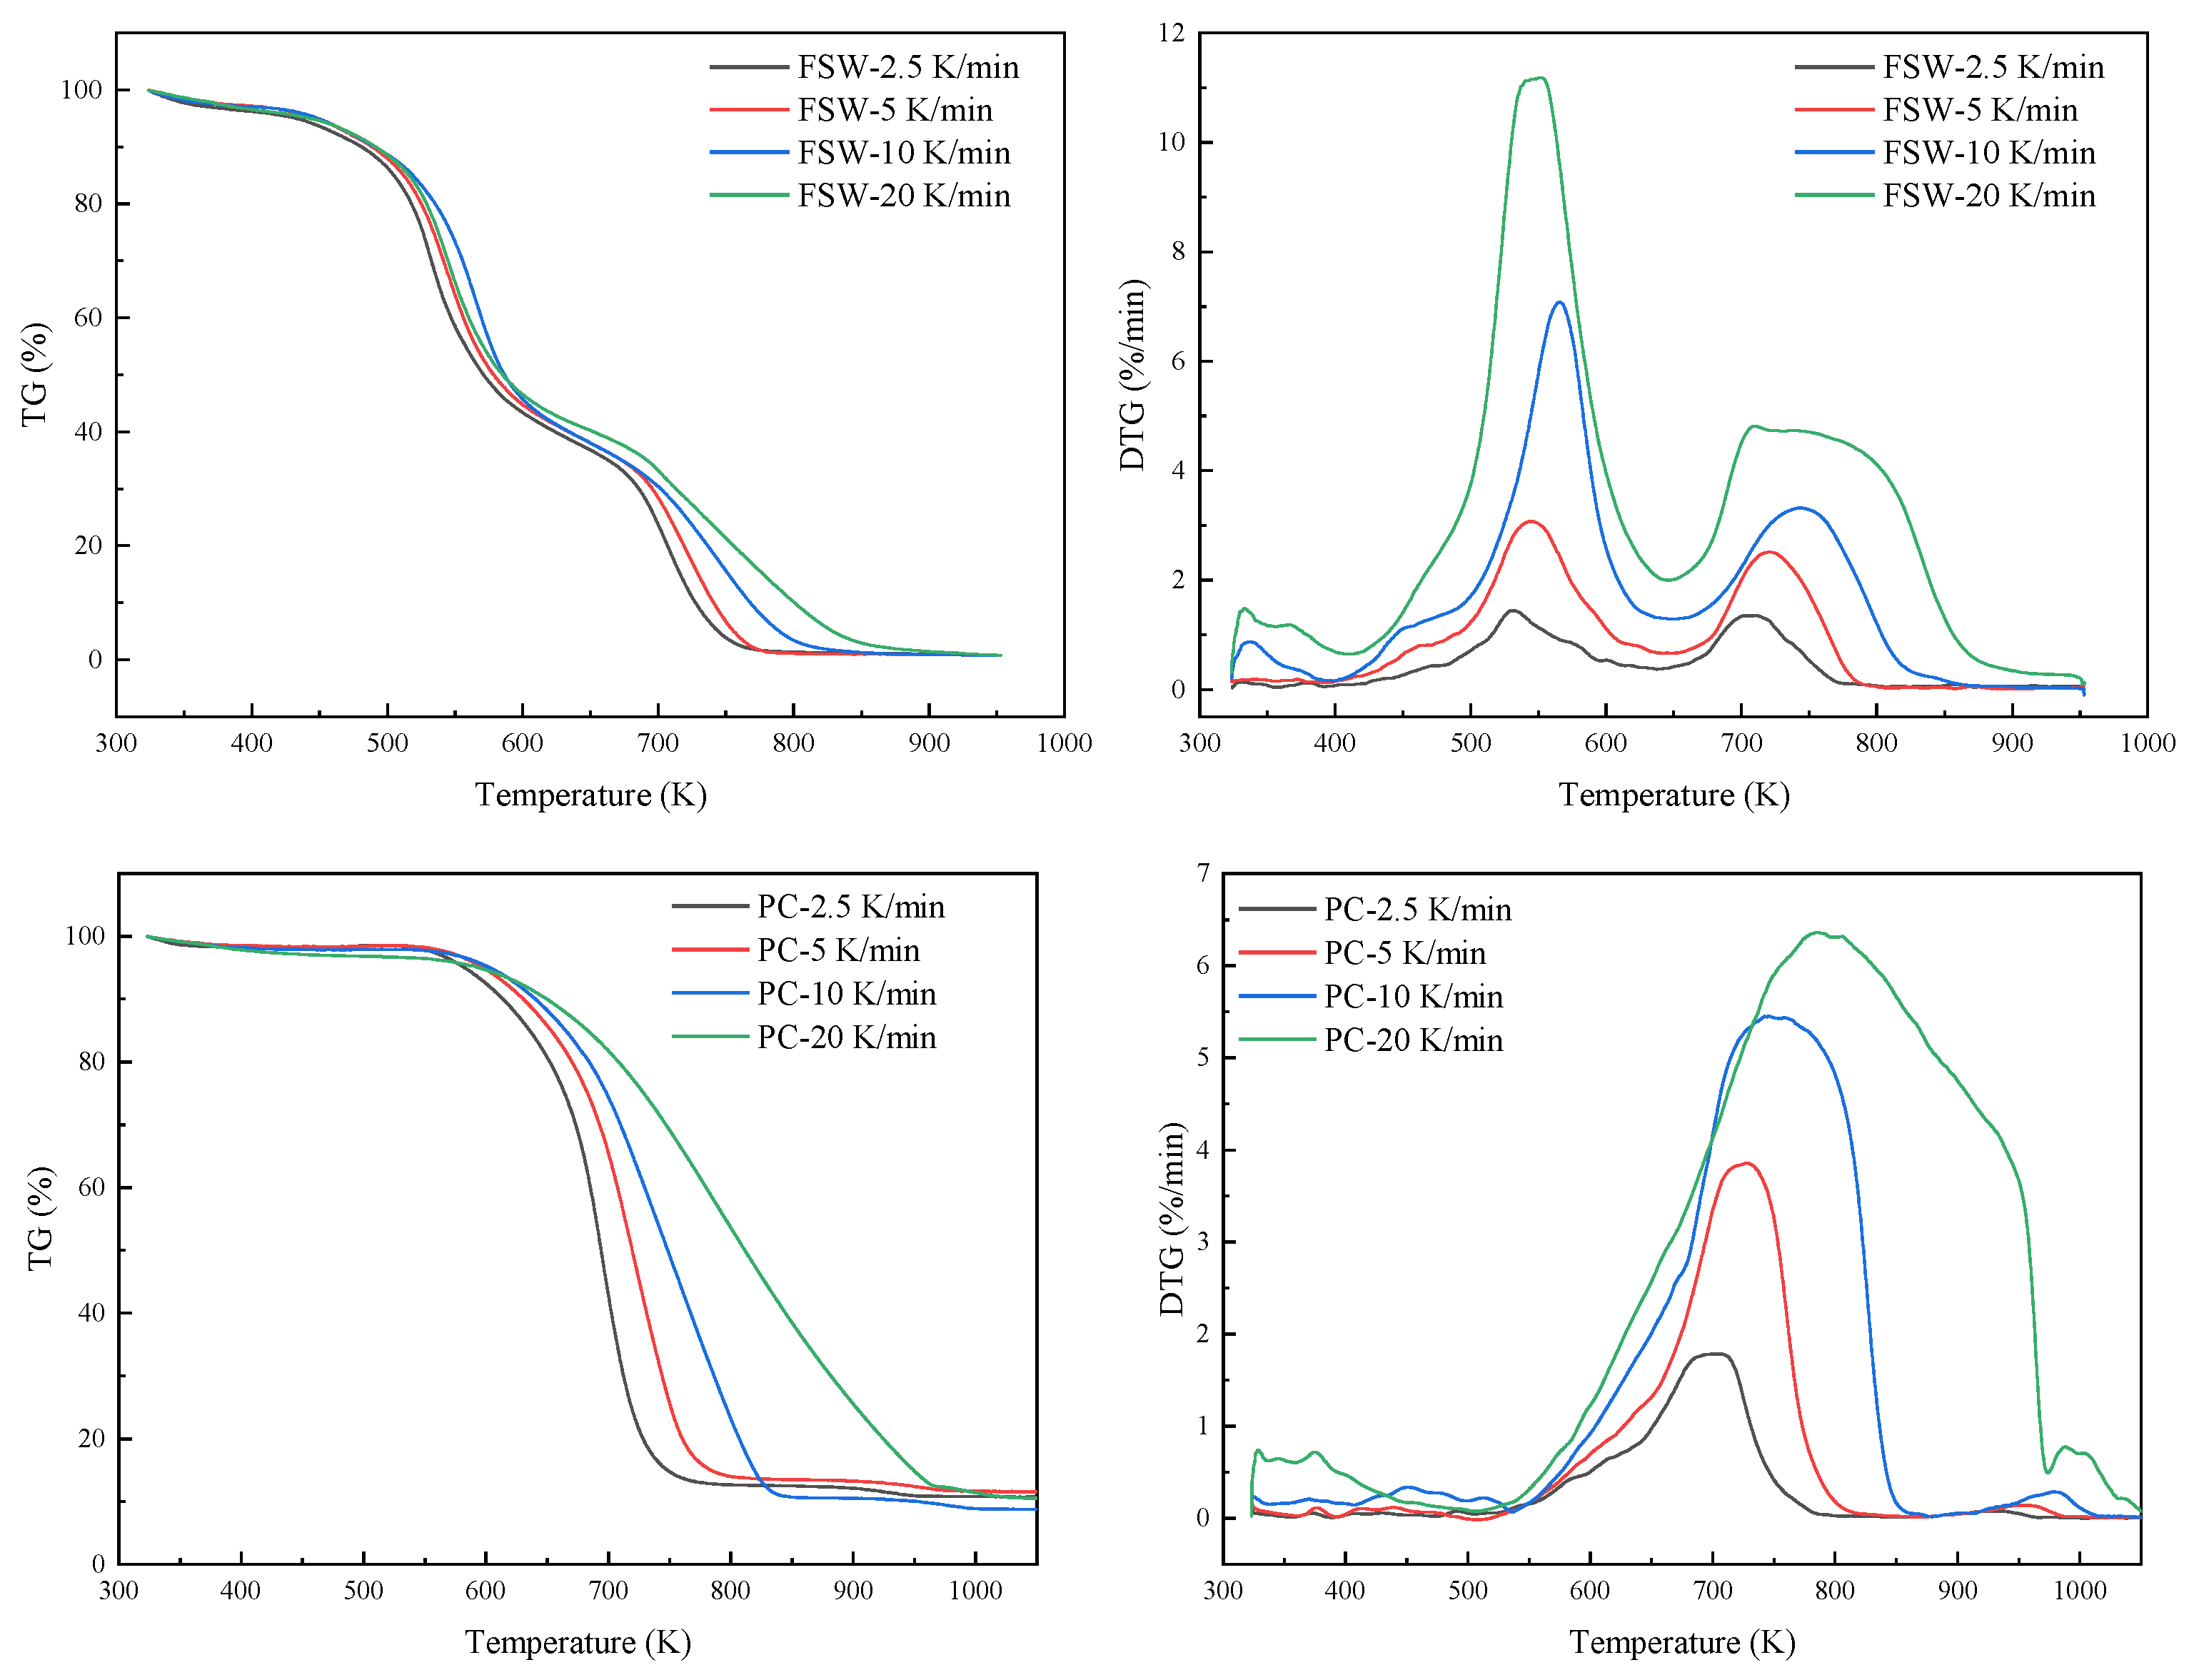
3.2.1. Effect of Heating Rate on PC and FSW Combustion

The TG curve records the quality change of the sample during combustion in real time, and the DTG curve of the sample can be obtained by differentiating it. Figure 4 shows the thermogravimetric (TG) and differential thermogravimetric (DTG) curves of FSW and PC combustion at the heating rates of 2.5 K/min, 5 K/min, 10 K/min, and 20 K/min, respectively. From the curves of FSW and PC in Figure 4, it can be seen that under the constant heating rate of 2.5 K/min, 5 K/min, 10 K/min, and 20 K/min, the heating rate will affect the weight loss process of FSW and PC. Due to thermal hysteresis, the TG and DTG curves of FSW and PC shifted to a high temperature with an increasing heating rate. However, the changing trends of the respective curves of PC and FSW are basically the same. The weight loss process of PC can be divided into two stages. The temperature range of the first stage is in the range of room temperature to 550 K, and the weight loss rate in this stage is low. When the temperature exceeds 550 K, until the end of the sample combustion, this is the second stage. Due to the combustion of volatile substances in PC, a large amount of heat is released, resulting in the combustion of fixed carbon. When the weight of the PC is not changing, the combustion process ends. The weight loss rate of PC at this stage is relatively large (84%). There is a small peak at 872–1027 K, which is due to the decomposition reaction caused by inorganic substances in PC at high temperatures. The combustion process of FSW is divided into three stages. The first stage is water evaporation. The second stage is the volatile analysis stage, in which the weight loss is the largest (about 60%). At this stage, the protein peptide bond breaks, releasing gas CO and CO2. Lipid compounds and starch will volatilize and decompose, and cellulose, hemicellulose and lignin will undergo oxidative decomposition [37]. The combustion rate of FSW increased significantly. The third stage is fixed carbon combustion. In this stage, small molecules formed by protein peptide bond breaking are further decomposed, cellulose and hemicellulose are almost completely decomposed, and the remaining lignin continues oxidative decomposition and fixed carbon combustion [38].
Table 4 shows the characteristic parameters of FSW and PC combustion at different heating rates. It can be seen that at the same heating rate, the ignition temperature, the initial decomposition temperature, the burnout temperature, and the second peak temperature of FSW are lower than PC. This is because FSW has a high volatile content, while PC has a high fixed carbon content. When the heating rate increases, the initial decomposition temperature of FSW and PC shifts to low temperature, and the burnout temperature shifts to a high temperature. There is no obvious change in the law of ignition temperature. It can be seen from Table 2 that the ash proportion in PC is greater than FSW. From the TG curve of combustion, it can be seen that the residual specific gravity of PC after burnout is 10%, while the specific gravity of FSW after burnout is 0.7–0.8%. The co-combustion of PC and FSW can reduce the ash-specific gravity after combustion.

3.2.2. Effect of Different Proportions of FSW and PC on Combustion

It can be seen from the TG curve in Figure 5 that the combustion process of different proportions of FSW and PC has the same change trend. With the increase in FSW content in the mixture, the residual mass ratio of the mixture after combustion decreases gradually. Compared with the single TG curve, the DTG curve can more accurately analyze the combustion characteristics of FSW and PC mixture. With the increase in FSW content in the mixture, the peak rate in the first stage of the DTG curve gradually increases and the peak rate in the second stage gradually decreases. This is because the volatile content in FSW is relatively high, and the fixed carbon content is relatively small. The volatile content in PC is opposite to the fixed carbon content and FSW. When the FSW content in the mixture increases, the volatile content of the mixture increases and the fixed carbon content decreases, resulting in the increase in the volatile combustion peak rate and the decrease in fixed carbon combustion peak rate. It can be seen from Table 5 that with the increase of FSW content in the mixture, the peak temperatures of the first stage and the second stage move towards low temperature. This is because the ignition temperature of FSW in the mixture is low, and the heat generated by volatile combustion will promote the combustion of fixed carbon in the mixture, so that the DTG curve of the mixture shifts towards a low temperature. With the increase in FSW content, the ignition temperature, the initial decomposition temperature, and the burnout temperature of the mixture decrease, while the flammability index and comprehensive combustion characteristic index gradually increase, which shows that co-combustion can effectively improve the combustion characteristics of mixed fuel.

3.2.3. Synergy of Different Proportions of Mixing

In order to study the synergy of the FSW and PC combustion process under different proportions, the separate weight loss rates of FSW and PC combustion is used to calculate and simulate according to the experimental mixing proportion, and the calculated curve is compared with the experimental measured curve. The obtained curve is shown in Figure 6.
It can be seen from Figure 6 that the DTG curve of different mixture ratios, that the volatile matter release combustion phase of the experimental curve shifts to the high temperature direction relative to the calculated fitting curve, and the fixed carbon phase of the experimental curve moves to the low temperature direction relative to the calculated fitting curve. This shows that the co-combustion of FSW and PC has an inhibitory effect in the volatilization phase and has a combustion-promoting effect in the fixed carbon combustion phase. Since the experimental curve of the DTG curve is similar to the calculated fitting curve, the interaction between FSW and PC is dominated by thermal effects. In the process of the co-combustion of FSW and PC, FSW burns first and releases heat. Part of the heat released by the combustion of FSW is absorbed by PC, which reduces the reaction rate of FSW in the volatilization phase, resulting in the suppression of the volatilization phase of the co-combustion process. Since PC absorbs the heat released by the combustion of FSW and increases the reaction rate of PC, FSW promotes the combustion of PC in the fixed carbon stage of the co-combustion process [39,40]. This synergy due to the thermal effect is easily affected by the oxygen concentration and the heating rate. The lower oxygen concentration will reduce the combustion reaction rate of FSW, and then the heat release rate will also decrease, while the lower heating rate will make the temperature difference between FSW and PC smaller. Both of these conditions will slow down the heat transfer rate between the FSW and the PC, weakening the thermal effect [29].

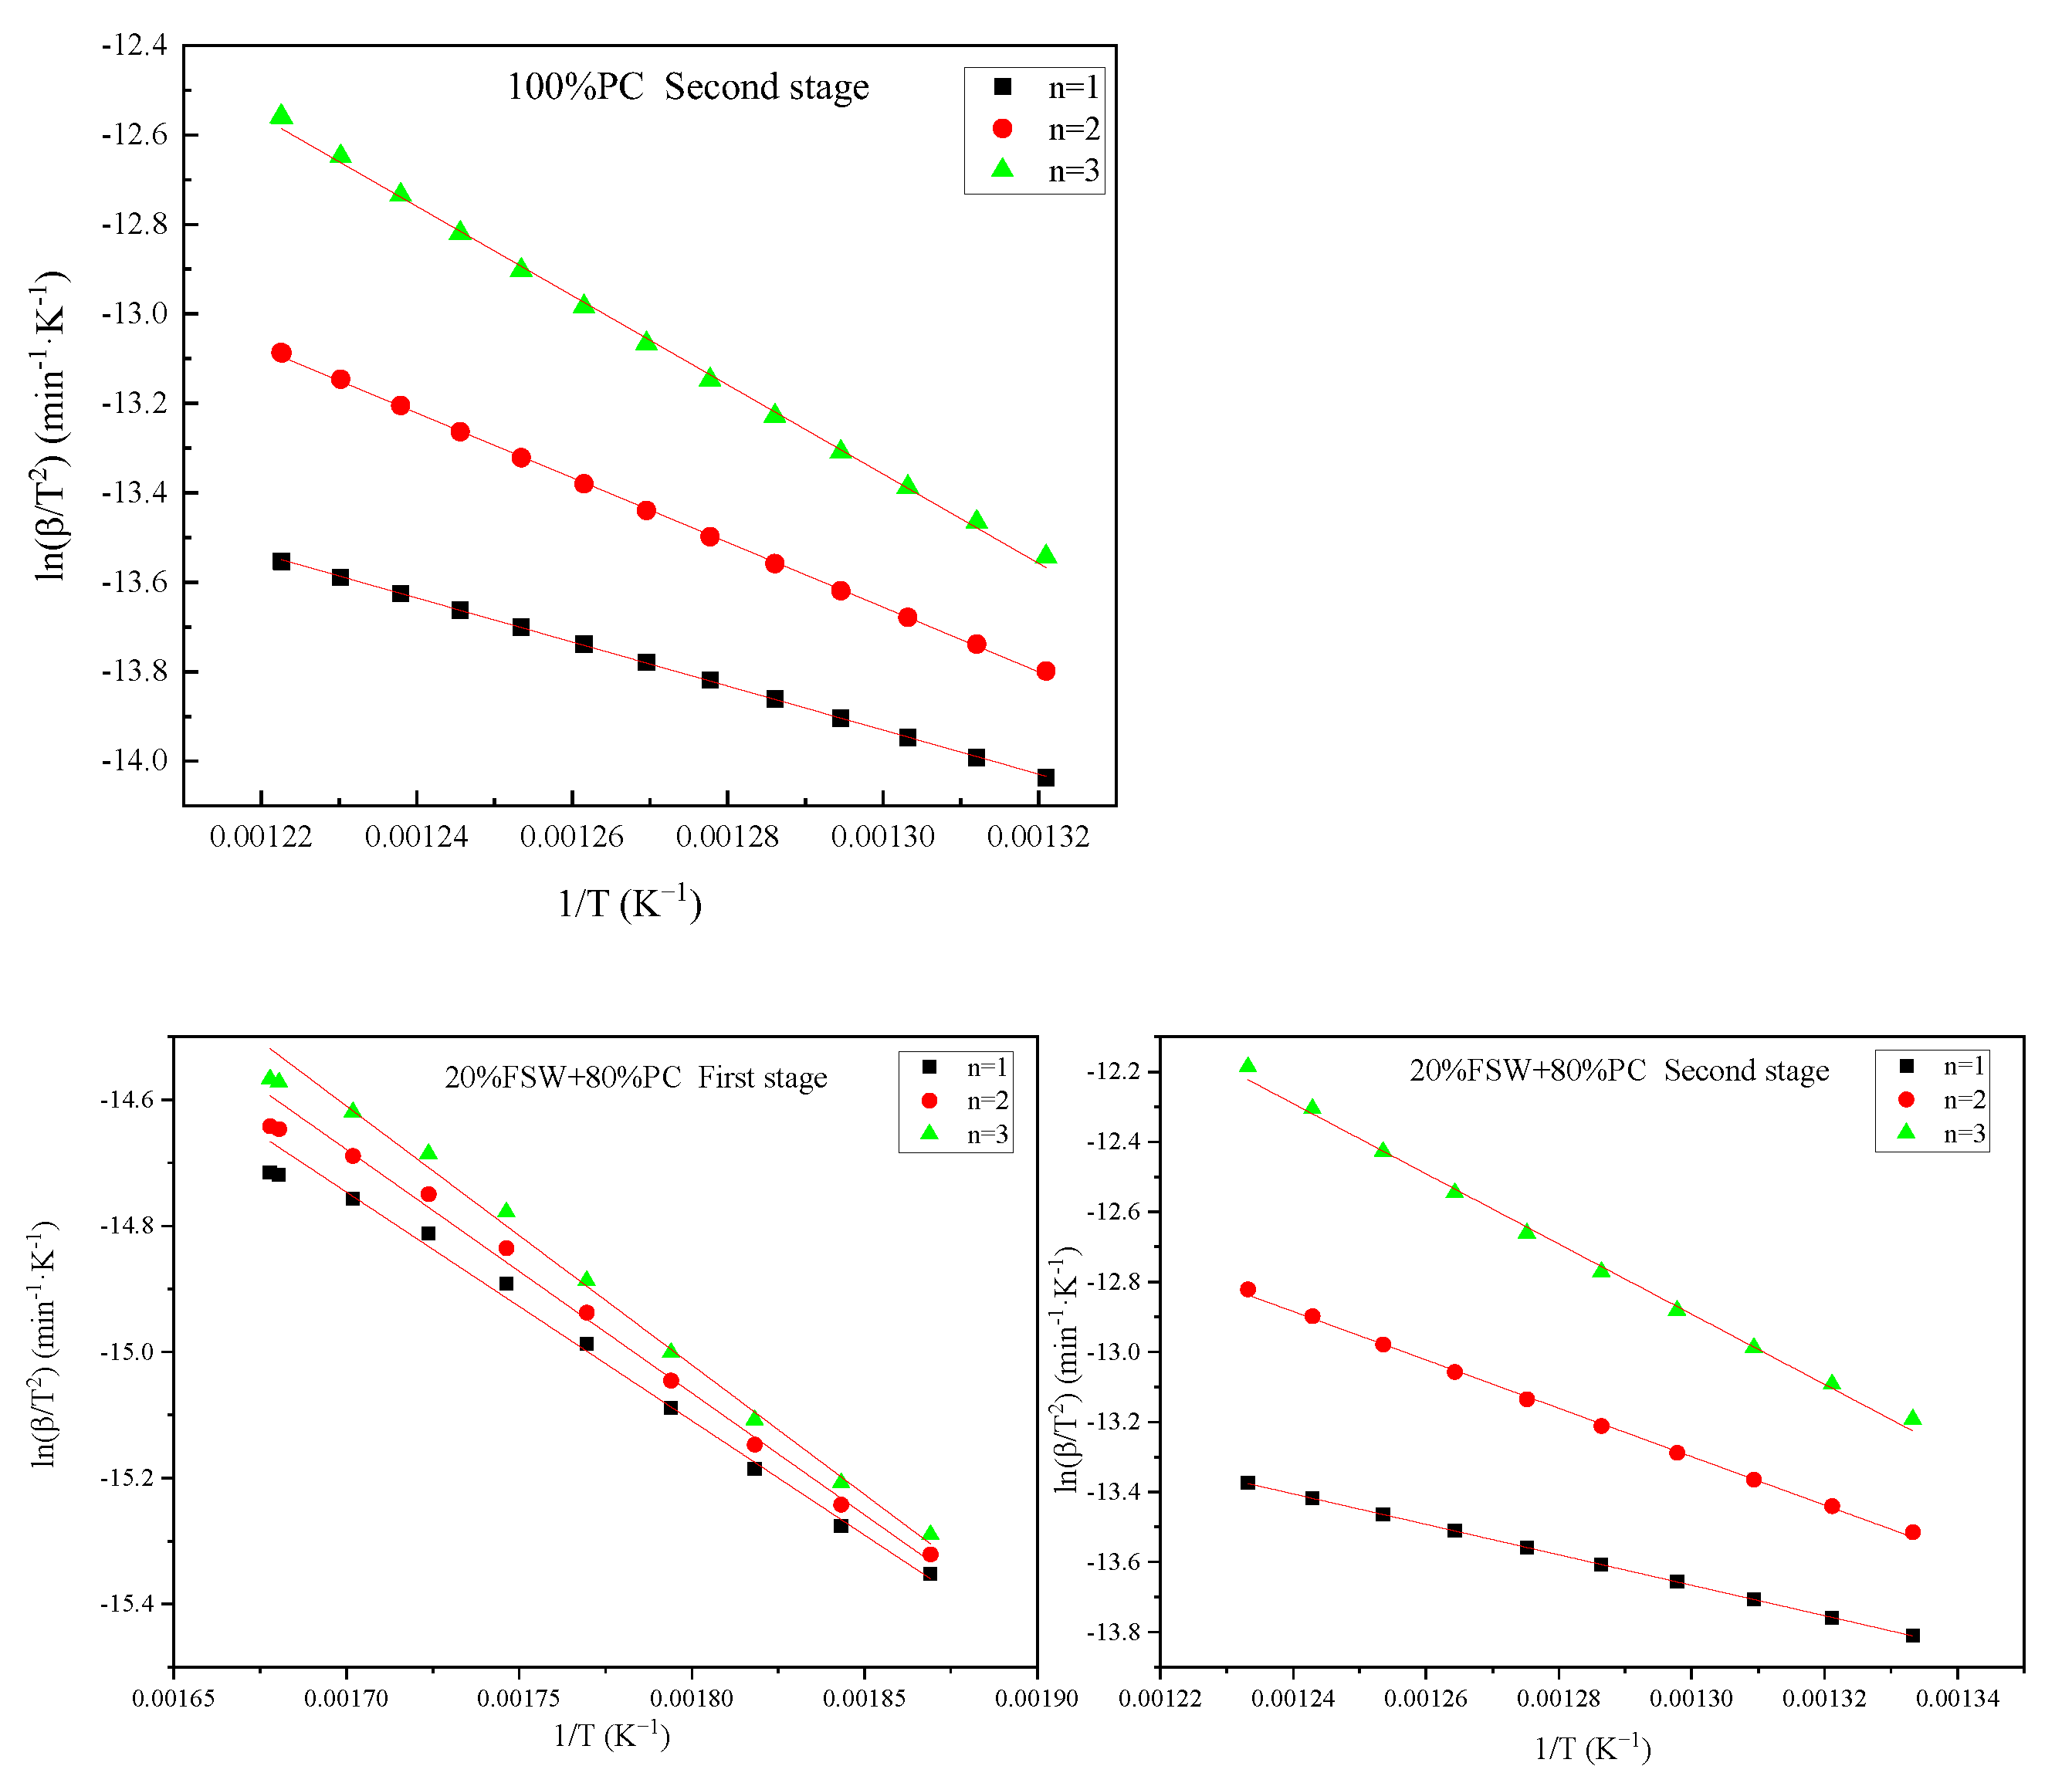
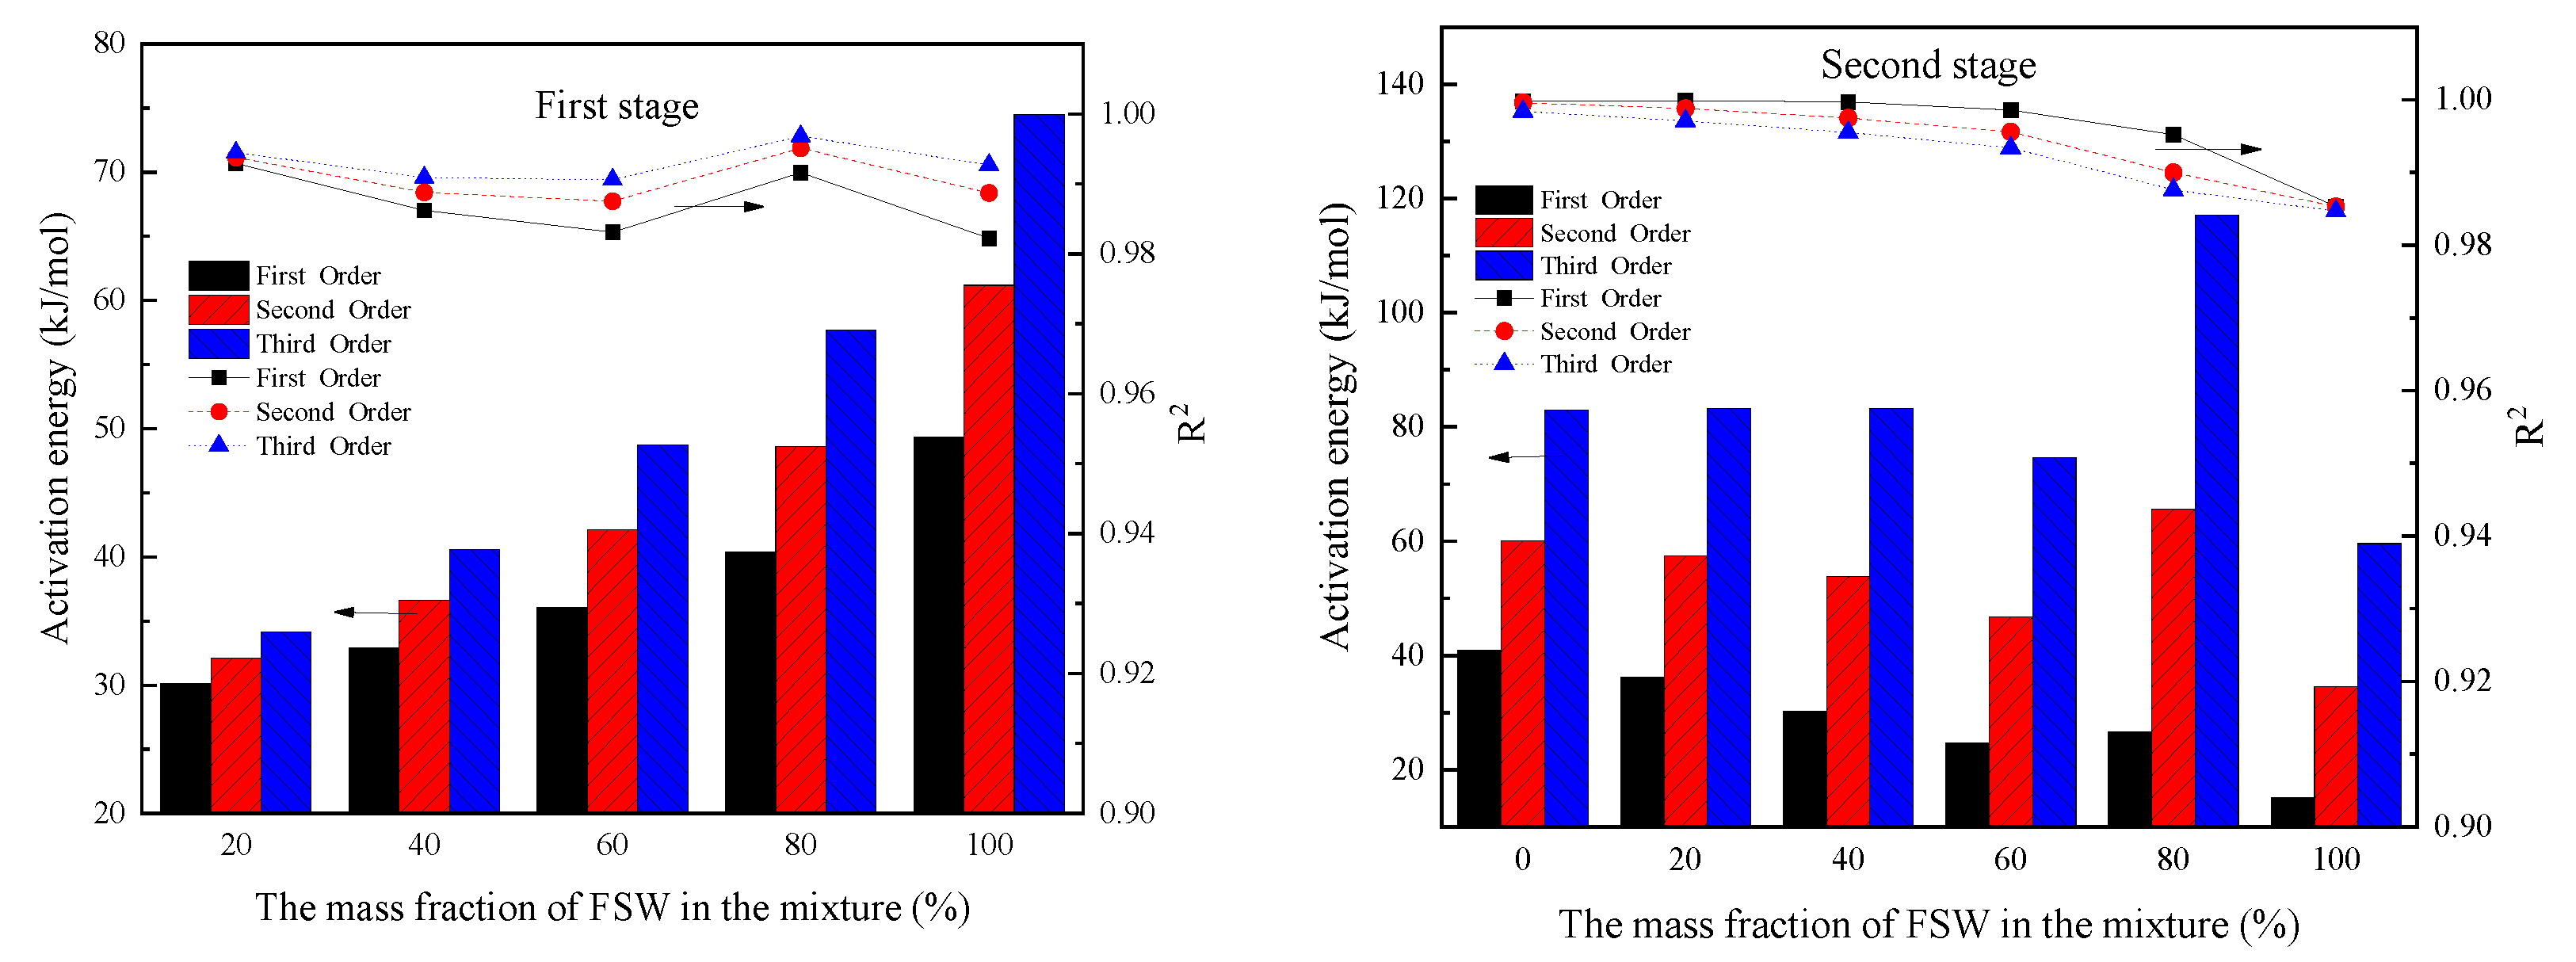
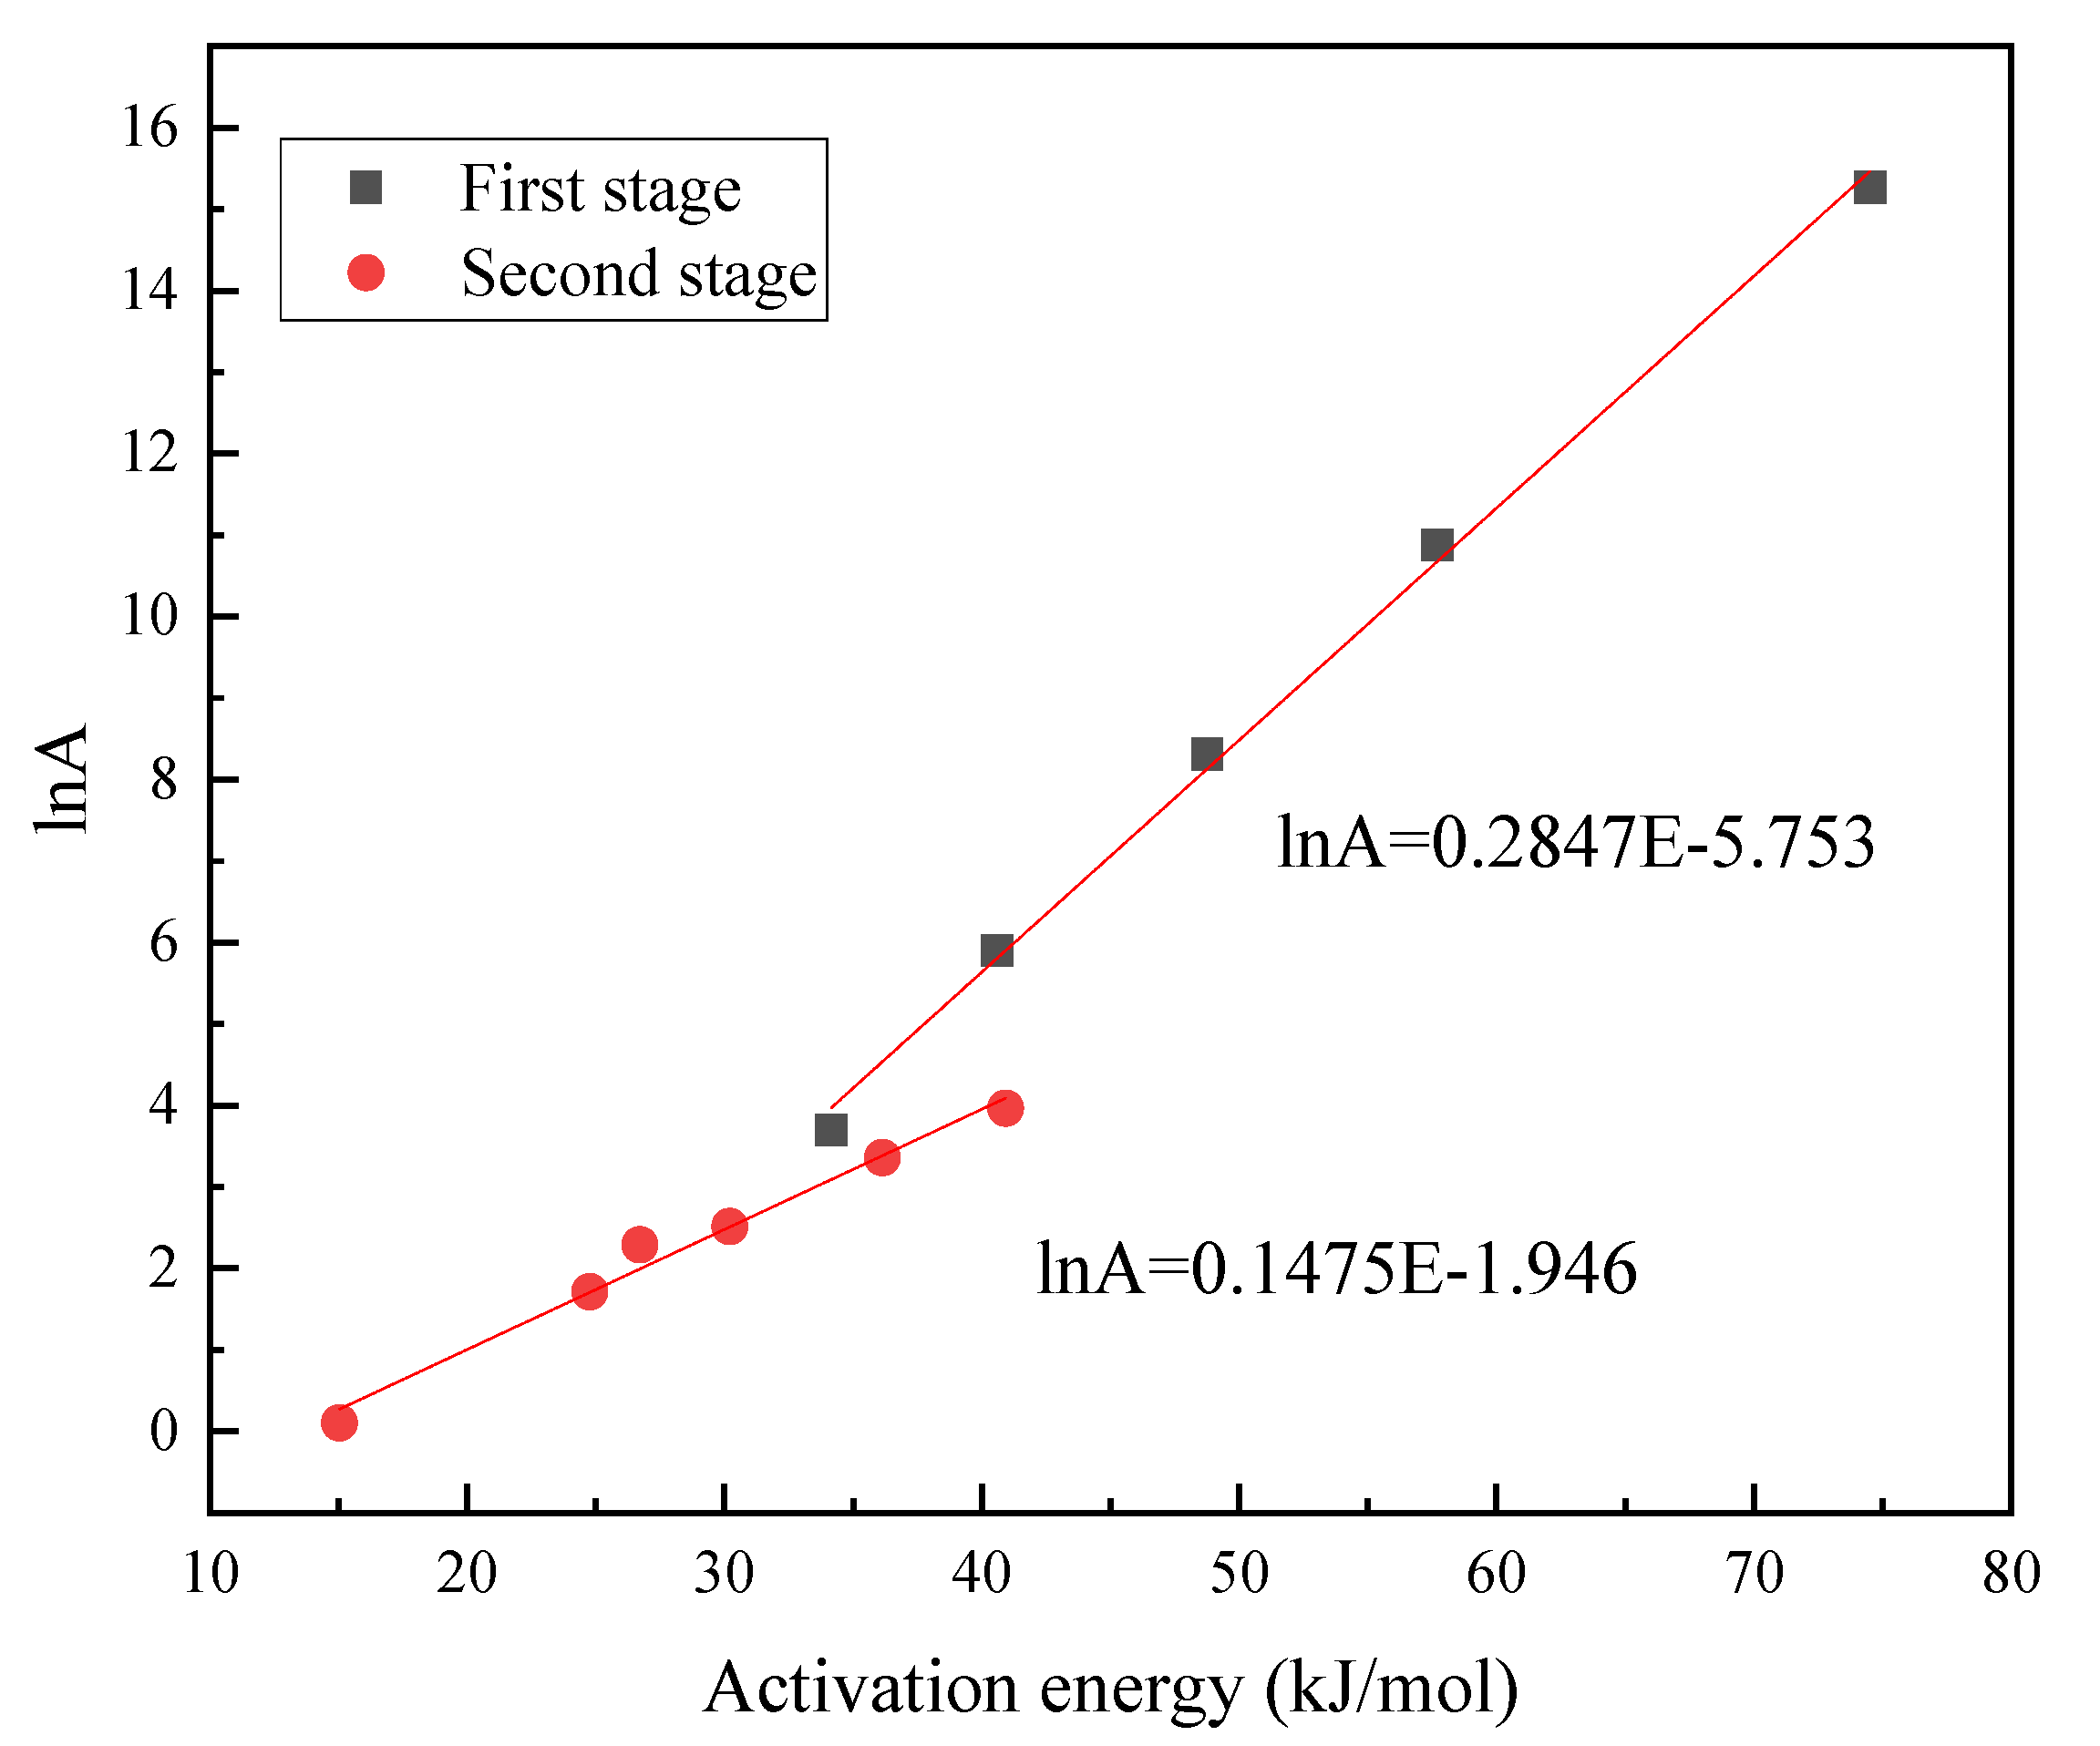
3.3. Kinetics Analysis

Generally, the first-order reaction model and the second-order reaction model are used to describe the combustion process of PC particles [41,42], and the third-order reaction model is used to describe the combustion process of FSW [21]. Therefore, the first-order, second-order, and third-order reaction models are used to analyze PC, FSW, and their mixtures. The analysis results are shown in Figure 7 and Figure 8. Different models have different linear fitting relationships for the kinetic equations of different substances. The greater the R2 value, the better the linear fitting relationship. According to R2, the third-order reaction model is suitable for the first-stage combustion of the mixture, and the first-order reaction model is suitable for the second-stage combustion of the mixture. The first stage is mainly the precipitation and combustion of volatile content, and the second stage is mainly the combustion of fixed carbon. Therefore, the first-order reaction is more suitable to describe the samples with a high fixed carbon content, and the third-order reaction is more suitable to describe the samples with a high volatile content. The above two stage models are selected for calculation, and the calculation results are shown in Table 6.
It can be seen from Table 6 that when PC is mixed with FSW, the activation energy of the first stage is 34.16–74.52 kJ/mol. With the increase in FSW content, the volatile content in the mixture increases. Therefore, the release of volatile content in the first stage requires more external energy and the activation energy increases. In the second stage, as the content of FSW increases, the content of fixed carbon in the mixture decreases, and the combustion of volatile content will provide part of the energy required for the combustion of fixed carbon, so the required activation energy gradually decreases. According to the analysis in Section 3.2.3, the co-combustion of FSW and PC has a synergistic promoting effect in the second stage, so the activation energy required for combustion in the second stage is less.
Fitting the lnA and E of mixtures with different proportions shows that there is a linear relationship between lnA and E, as shown in Figure 9. According to the fitting results, the first stage relationship is l n A = 0.2847 E 5.753 , the correlation coefficient is R2 = 0.9975, and the second stage relationship is l n A = 0.1475 E 1.946 , and the correlation coefficient R2 = 0.9855. From the above two relations, it can be seen that there is a dynamic compensation effect between lnA and E. This shows that the two kinetic models have obvious kinetic compensation effects in their respective co-combustion stages, which proves the effectiveness of the two kinetic models in describing the complex co-combustion process [30].

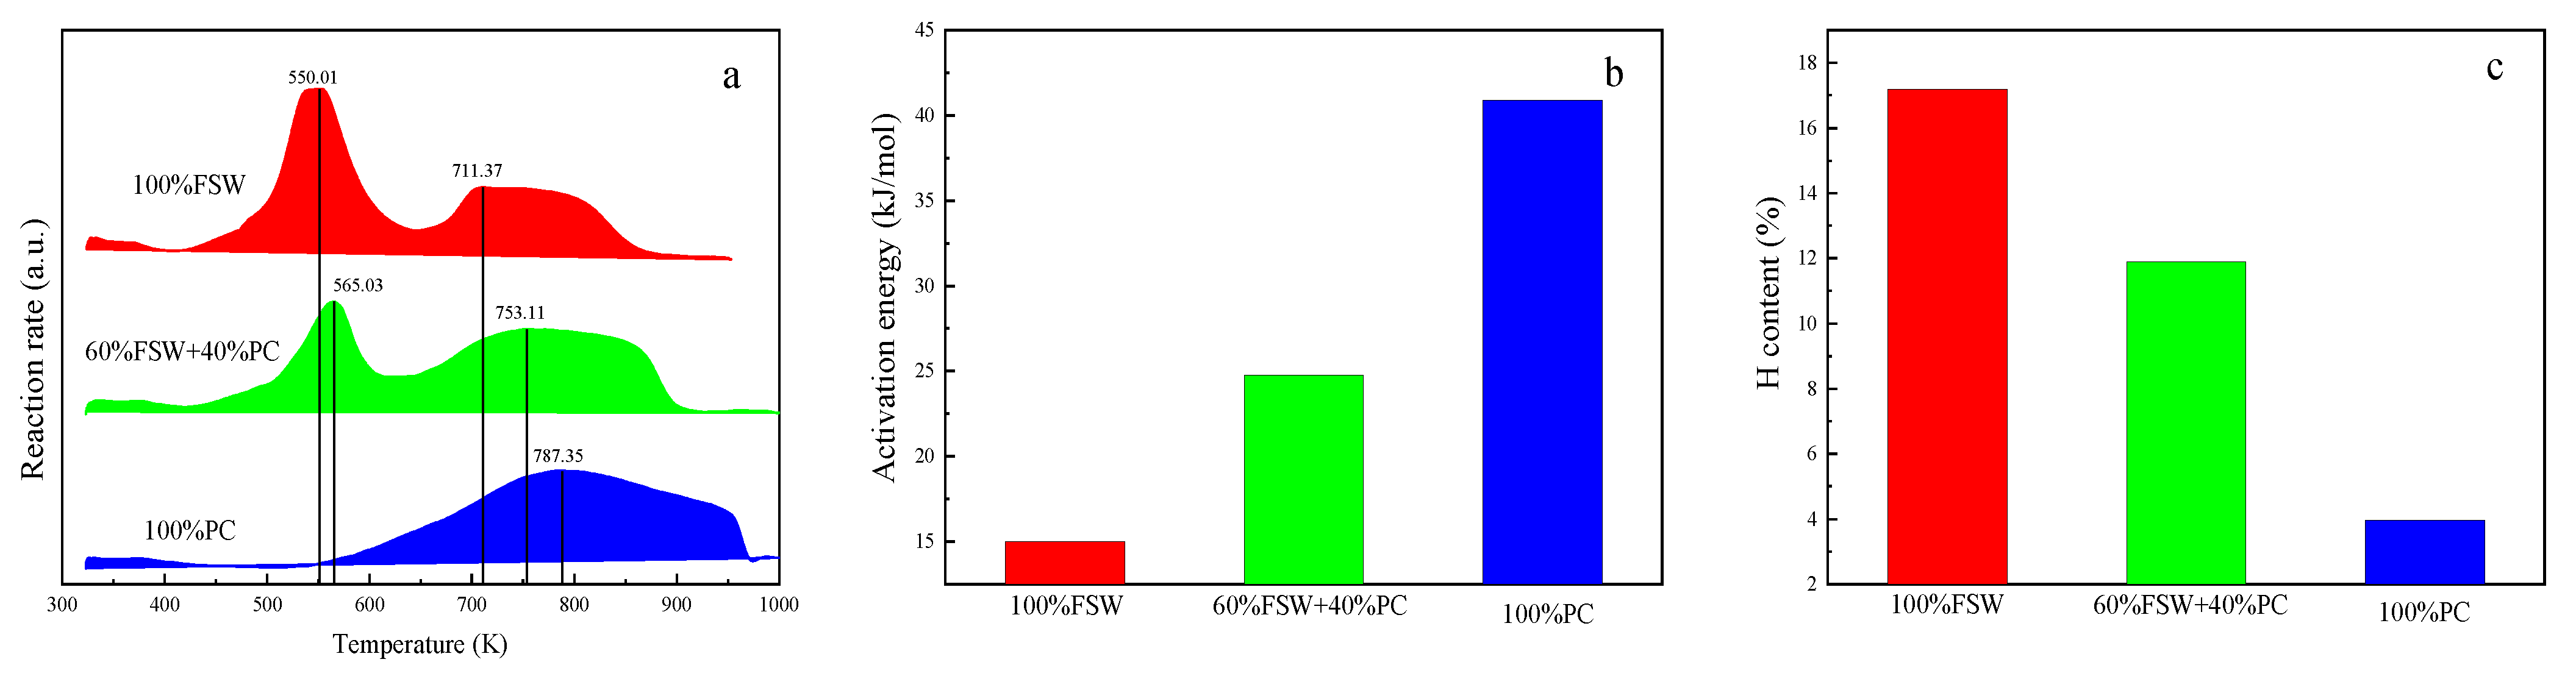
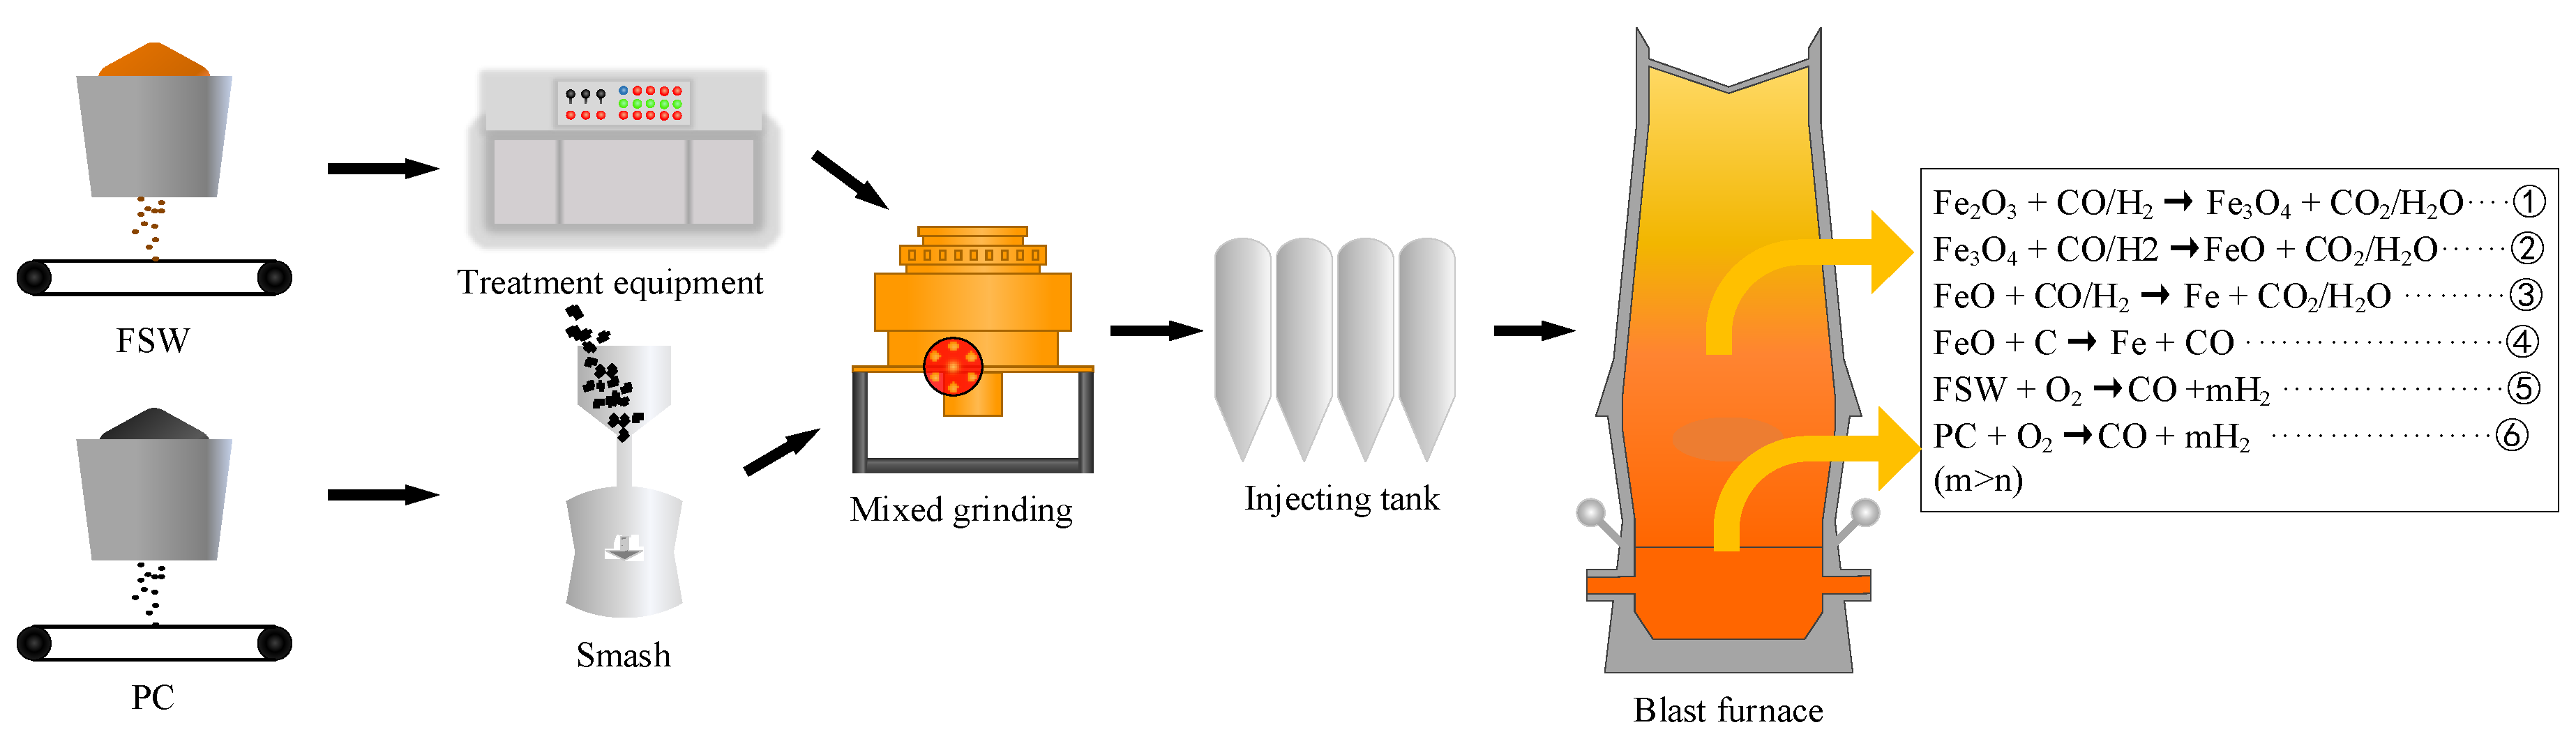
3.4. Superiority of FSW Injection into Blast Furnace

The combustion performance of FSW is better than that of PC. It can be seen from Table 5 that the ignition temperature, initial decomposition temperature, and burnout temperature of FSW are 157.98 K, 152.96 K, and 111.23 K lower than those of PC, respectively. As can be seen from Figure 10a,b, that the order of the rate peak temperature in the first stage from low to high is FSW (550.01 K) < 60% FSW + 40% PC (565.03 K). The order of activation energy in the second stage is FSW (15.04 kJ/mol) < FSW−60% (24.76 kJ/mol) < PC (40.92 kJ/mol). Therefore, FSW burns faster than PC and requires less activation energy. Mixing FSW and PC to inject, while reducing the ignition temperature, the two will also promote combustion and improve the overall combustion efficiency, so that the PC will pass through the high temperature area of the tuyere for a longer time and avoid potential clogging of the tuyere.
In fact, there is excess carbon in the tuyere of the blast furnace, and its combustion temperature is very high. The theoretical combustion temperature of the tuyere generally exceeds 2000 ℃, so the fuel combustion produces CO and H2 [43]. According to Figure 10c, the H element content of FSW is 17.2%, while that of PC is 3.98%, and the H element content of FSW is more than four times that of PC. CO and H2 produced by the co-combustion of PC and FSW at the blast furnace tuyere reach the upper part of the blast furnace for an indirect reduction reaction as shown in ①②③ in Figure 11. The excess carbon in the tuyere and the lower part of the blast furnace is subjected to ④ a direct reduction reaction. Generally, the reduction capacity of H2 in the upper part of the blast furnace is greater than that of CO. When the FSW in the injection mixture increases, the H2 in the combustion gas increases and the reaction ①②③ increases, which is more conducive to the indirect reduction reaction of iron ore, but the reaction ④ is reduced, the direct reduction degree is reduced, the coke ratio is reduced, and the carbon dioxide emission is reduced [44].
FSW is a kind of biomass energy. Its initial source is the photosynthesis of plants, and its net CO2 emissions from combustion are zero, which is a renewable clean energy [45]. Its use in blast furnaces can reduce the CO2 emissions of blast furnace ironmaking, which is of great significance to the development of low-carbon ironmaking technology. In addition, FSW is solid waste produced in daily life, with wide sources and low a treatment cost, which can reduce the fuel cost of blast furnace ironmaking.
In addition, the industrial application of FSW injection into blast furnaces still needs a lot of work to be carried out in the future, such as its transportation, storage, drying costs, fluidity, and industrial operation. The composition of FSW will be different according to the eating habits of various regions, so it needs to be classified.

4. Conclusions

The combustion characteristics and kinetics of FSW, PC, and their mixtures were studied by thermogravimetric analysis, and the following conclusions were obtained:
(1) The co-combustion of FSW and PC has an inhibitory effect in the volatilization stage and has a combustion-promoting effect in the fixed carbon combustion stage. The interaction between FSW and PC is dominated by thermal effects.
(2) The average activation energy in the volatile phase of PC and FSW combustion is 54.34 kJ/mol, and the average activation energy in the fixed carbon combustion phase is 27.98 kJ/mol, which is lower than the activation energy of PC in the fixed carbon combustion phase.
(3) Compared with direct coal injection, the mixed injection of FSW and PC will reduce the ignition temperature of PC and improve the overall combustion efficiency. Injecting FSW into a blast furnace can promote the indirect reduction of iron ore, reduce the coke ratio, reduce the ironmaking process, and reduce CO2 emissions.

Author Contributions

Data curation, Z.L. and D.Z.; Formal analysis, J.Y.; Funding acquisition, J.L. and C.X.; Investigation, R.W.; Software, D.Z.; Supervision, R.W., H.L., J.L. and C.X.; Writing—original draft, J.Y. and Z.L.; Writing—review and editing, R.W., H.L. and C.X. All authors have read and agreed to the published version of the manuscript.

Funding

This work was supported by the Natural Science Foundation of China (No. U1860113) and the Natural Science and Engineering Research Council of Canada (RGPIN-2019-05159).

Institutional Review Board Statement

Not applicable.

Informed Consent Statement

Not applicable.

Data Availability Statement

Not applicable.

Conflicts of Interest

The authors declare no conflict of interest.

References

  1. Vassilev, S.V.; Baxter, D.; Vassileva, C.G. An overview of the behaviour of biomass during combustion: Part I. Phase-mineral transformations of organic and inorganic matter. Fuel 2013, 112, 391–449. [Google Scholar] [CrossRef]
  2. Mishra, N.K.; Bhardwaj, N. Biofuels: A Renewable and Sustainable Way to Conserve the Fossil Fuels in India. Invertis J. Renew. Energy 2018, 8, 151–156. [Google Scholar]
  3. Demirbas, A. Combustion characteristics of different biomass fuels. Prog. Energy Combust. Sci. 2004, 30, 219–230. [Google Scholar] [CrossRef]
  4. Xue, M.; Xu, F.F.; Yuan, J.; Zong, P.J.; Wang, B.; Li, J.; Qiao, Y.Y.; Tian, Y.Y. Thermal degradation of food waste by TG-FTIR and Py-GC/MS: Pyrolysis behaviors, products, kinetic and thermodynamic analysis. J. Clean. Prod. 2020, 244, 118713. [Google Scholar]
  5. Cheng, Y.L.; Bi, G.C.; Wo, D.F.; Xie, J. Status Quo of Kitchen Waste and Its Treatment Measures at Home and Abroad. Adv. New Renew. Energy 2017, 5, 266–271. [Google Scholar]
  6. Zhang, X.X.; Jiao, P.B.; Yang, H.Y.; Wu, R.M.; Li, Y.M.; Ma, L.P. Recent advances in anaerobic co-digestion of excess sludge and food waste. China Environ. Sci. 2022, 42, 2179–2194. [Google Scholar] [CrossRef]
  7. Melikoglu, M. Reutilisation of food wastes for generating fuels and value added products: A global review. Environ. Technol. Innov. 2020, 19, 101040. [Google Scholar] [CrossRef]
  8. Pham, T.; Kaushik, R.; Parshetti, G.K.; Mahmood, R.; Balasubramanian, R. Food wasteto-energy conversion technologies: Current status and future directions. Waste Manag. 2015, 38, 399–408. [Google Scholar] [CrossRef]
  9. Jin, C.X.; Sun, S.Q.; Yang, D.H.; Sheng, W.J.; Ma, Y.D.; He, W.Z.; Li, G.M. Anaerobic Digestion: An Alternative Resource Treatment Option for Food Waste in China. Sci. Total Environ. 2021, 779, 146397. [Google Scholar] [CrossRef]
  10. Salemdeeb, R.; Zu Ermgassen, E.K.H.J.; Kim, M.H.; Balmford, A.; Al-Tabbaa, A. Environmental and health impacts of using food waste as animal feed: A comparative analysis of food waste management options. J. Clean. Prod. 2017, 140, 871–880. [Google Scholar] [CrossRef] [Green Version]
  11. Ilbery, B. Geographical aspects of the 2001 outbreak of foot and mouth disease in the UK. Geography 2002, 87, 142–147. [Google Scholar]
  12. zu Ermgassen, E.K.H.J.; Phalan, B.; Green, R.E.; Balmford, A. Reducing the land use of EU pork production: Where there’s swill, there’s a way. Food Policy 2016, 58, 35–48. [Google Scholar] [CrossRef] [PubMed] [Green Version]
  13. Song, C.; Qi, H.; Wei, Z.; Xia, X. High-speed treatment of feed waste by continuous high-temperature composting enhanced by thermophilic microbial consortium. Environ. Eng. 2021, 39, 111–117. [Google Scholar]
  14. Yuan, T.G.; Bian, S.W.; Ko, J.H.; Liu, J.G.; Shi, X.Y.; Xu, Q.Y. Exploring the roles of zero-valent iron in two-stage food waste anaerobic digestion. Waste Manag. 2020, 107, 91–100. [Google Scholar] [CrossRef] [PubMed]
  15. Lim, E.Y.; Tian, H.L.; Chen, Y.Y.; Ni, K.W.; Zhang, J.X.; Tong, Y.W. Methanogenic pathway and microbial succession during start-up and stabilization of thermophilic food waste anaerobic digestion with biochar. Bioresour. Technol. 2020, 314, 123751. [Google Scholar] [CrossRef]
  16. Yuan, T.G.; Shi, X.Y.; Sun, R.; Ko, J.H.; Xu, Q.Y. Simultaneous addition of biochar and zero-valent iron to improve food waste anaerobic digestion. J. Clean. Prod. 2021, 278, 123627. [Google Scholar] [CrossRef]
  17. Zheng, X.; Xu, H.P.; Fan, Q.M.; Long, S.L.; Hua, D.L. Research progress on anaerobic digestion treatment technology for kitchen waste. Mod. Chem. Ind. 2022, 42, 10–14. [Google Scholar]
  18. Zhang, F.M. Research and design on low-carbon and high-efficiency blast furnace. China Metall. 2021, 31, 1–8. [Google Scholar]
  19. Raygan, S.; Abdizadeh, H.; Rizi, A.E. Evaluation of four coals for blast furnace pulverized coal injection. J. Iron Steel Res. Int. 2010, 17, 8–20. [Google Scholar] [CrossRef]
  20. Long, H.M.; Wei, R.F.; Li, N.; Zhou, D.; Meng, Q.M.; Li, J.X. Disposal of city combustible solid waste by blast furnace. Iron Steel. 2018, 53, 1–9. [Google Scholar]
  21. Zhou, D.; Wei, R.F.; Long, H.M.; Li, J.X.; Qi, L.Y.; Xu, C.B. Combustion characteristics and kinetics of different food solid wastes treatment by blast furnace. Renew. Energy 2020, 145, 530–541. [Google Scholar] [CrossRef]
  22. Zhang, C.L.; Wang, G.W.; Ning, X.J.; Zhang, J.L.; Wang, C. Numerical simulation of combustion behaviors of hydrochar derived from low-rank coal in the raceway of blast furnace. Fuel 2020, 278, 118267. [Google Scholar] [CrossRef]
  23. Li, J.H.; Xu, R.S.; Wang, G.W.; Zhang, J.L.; Song, B.; Liang, W.; Wang, C. Study on the feasibility and co-combustion mechanism of mixed injection of biomass hydrochar and anthracite in blast furnace. Fuel 2021, 304, 121465. [Google Scholar] [CrossRef]
  24. Wang, P.; Wang, G.W.; Zhang, J.L.; Lee, J.-Y.; Li, Y.J.; Wang, C. Co-combustion characteristics and kinetic study of anthracite coal and palm kernel shell char. Appl. Therm. Eng. 2018, 143, 736–745. [Google Scholar] [CrossRef]
  25. Vyazovkin, S.; Burnham, A.K.; Criado, J.M.; Pérez-Maqueda, L.A.; Popescu, C.; Sbirrazzuoli, N. ICTAC Kinetics Committee recommendations for performing kinetic computations on thermal analysis data. Thermochim. Acta 2011, 520, 1–19. [Google Scholar] [CrossRef]
  26. GB/T 28731-2012; Proximate Analysis of Solid Biofuels. General Administration of Quality Supervision, Inspection and Quarantine of the People’s Republic of China, China Coal Industry Press: Beijing, China, 2012.
  27. GB/T 212-2008; Proximate Analysis of Coal. General Administration of Quality Supervision, Inspection and Quarantine of the People’s Republic of China, China Coal Industry Press: Beijing, China, 2008.
  28. GB/T 31391-2015; Ultimate Analysis of Coal. General Administration of Quality Supervision, Inspection and Quarantine of the People’s Republic of China, China Coal Industry Press: Beijing, China, 2008.
  29. Yuzbasi, N.S.; Selçuk, N. Air and oxy-fuel combustion characteristics of biomass/lignite blends in TGA-FTIR. Fuel Process. Technol. 2011, 92, 1101–1108. [Google Scholar] [CrossRef]
  30. Wang, G.W.; Zhang, J.L.; Shao, J.G.; Ren, S. Characterisation and model fitting kinetic analysis of coal/biomass co-combustion. Thermochim. Acta 2014, 591, 68–74. [Google Scholar] [CrossRef]
  31. Fraga, L.; Silva, J.; Teixeira, S.; Soares, D.; Ferreira, M.; Teixeira, J. Influence of operating conditions on the thermal behavior and kinetics of pine wood particles using thermogravimetric analysis. Energies 2020, 13, 2756. [Google Scholar] [CrossRef]
  32. Toptas, A.; Yildirim, Y.; Duman, G.; Yanik, J. Combustion behavior of different kinds of torrefied biomass and their blends with lignite. Bioresour. Technol. 2015, 177, 328–336. [Google Scholar] [CrossRef]
  33. Xing, D.D.; Wang, S.; Zhang, Q.L.; Mo, C.; Chen, Y.F. Mixed combustion and kinetics of waste plastics injected into blast furnace and anthracite. J. Iron Steel Res. 2019, 31, 258–264. [Google Scholar]
  34. Ding, J.; Liu, Q.C.; Jiang, L.J.; Liu, G.Q.; Ren, S.; Yang, J.; Meng, F. Thermal behavior and kinetics of raw/pyrolytic wood and coal blends during co-combustion process. J. Iron Steel Res. Int. 2016, 23, 917–923. [Google Scholar] [CrossRef]
  35. Wu, H.X.; Li, H.B.; Zhao, Z.L. Thermogravimetric analysis and pyrolytic kinetic study on coal/biomass blends. J. Fuel Chem. Technol. 2009, 37, 538–545. [Google Scholar]
  36. Wang, G.W.; Zhang, J.L.; Shao, J.G.; Zuo, H.B. Thermogravimetric analysis of coal char combustion kinetics. J. Iron Steel Res. Int. 2014, 21, 897–904. [Google Scholar] [CrossRef]
  37. Huang, Y.L.; Guo, Q.J.; Tian, H.J.; Hou, L.Y. Study on pyrolysis of kitchen waste (KW) by Using thermogravimetric analyzer (TGA) and tube furnace. J. Chem. Eng. Chin. Univ. 2012, 26, 721–728. [Google Scholar]
  38. Chen, D.Y.; Gao, A.J.; Cen, K.H.; Zhang, J.; Cao, X.B.; Ma, Z.Q. Investigation of biomass torrefaction based on three major components: Hemicellulose, cellulose, and lignin. Energ. Convers. Manag. 2018, 169, 228–237. [Google Scholar] [CrossRef]
  39. Zhang, Y.Y.; Zhang, Z.Z.; Zhu, M.M.; Cheng, F.Q.; Zhang, D.K. Interactions of coal gangue and pine sawdust during combustion of their blends studied using differential thermogravimetric analysis. Bioresour. Technol. 2016, 214, 396–403. [Google Scholar] [CrossRef]
  40. Zhou, L.M.; Zhang, G.J.; Reinmöller, M.; Meyer, B. Effect of inherent mineral matter on the co-pyrolysis of highly reactive brown coal and wheat straw. Fuel 2019, 239, 1194–1203. [Google Scholar] [CrossRef]
  41. Jiang, G.D.; Wei, L.P.; Teng, H.P.; Hao, H.D. A kinetic model based on TGA data for pyrolysis of Zhundong coal. CIESC J. 2017, 68, 1415–1422. [Google Scholar]
  42. Magalhaes, D.; Kazanc, F.; Riaza, J.; Erensoy, S.; Kabaklı, O.; Chalmers, H. Combustion of Turkish lignites and olive residue: Experiments and kinetic modelling. Fuel 2017, 203, 868–876. [Google Scholar] [CrossRef]
  43. Abdel Halim, K.S. Effective utilization of using natural gas injection in the production of pig iron. Mater. Lett. 2007, 61, 3281–3286. [Google Scholar] [CrossRef]
  44. Wei, R.F.; Xiang, D.W.; Long, H.M.; Xu, C.B.; Li, J.X. Reduction of iron oxide by lignin: Characteristics, kinetics and superiority. Energy 2020, 197, 117203. [Google Scholar] [CrossRef]
  45. Verma, M.; Loha, C.; Chatterjee, P.K. Drying of biomass for utilising in co-firing with coal and its impact on environment–A review. Renew. Sustain. Energy Rev. 2016, 71, 732–741. [Google Scholar] [CrossRef]
Figure 1. Particle size distributions of FSW.
Sustainability 14 07156 g001
Figure 2. Fourier infrared spectra of FSW and PC and their different mixtures.
Sustainability 14 07156 g002
Figure 3. SEM of PC, FSW, and their different mixtures.
Sustainability 14 07156 g003
Figure 4. TG-DTG curves of FSW and PC at different heating rates.
Sustainability 14 07156 g004
Figure 5. TG and DTG curves of different mixtures of FSW and PC.
Sustainability 14 07156 g005
Figure 6. Calculated and experimental values of mixtures with different proportion.
Sustainability 14 07156 g006
Figure 7. Linear fitting results of PC, FSW, and their different mixtures.
Sustainability 14 07156 g007aSustainability 14 07156 g007b
Figure 8. Activation energy and correlation coefficient obtained by three mechanism functions.
Sustainability 14 07156 g008
Figure 9. Linear fitting results of activation energy and LnA.
Sustainability 14 07156 g009
Figure 10. Reaction rate peak temperature (a), activation energy (b), and H element content (c) of FSW, PC, and mixture (60% FSW + 40% PC).
Sustainability 14 07156 g010
Figure 11. Process of mixed injection of FSW and PC into blast furnace and its main reactions.
Sustainability 14 07156 g011
Table 1. The mixing ratio of different food solid wastes (wt.%).
SampleWVMixture
WCWCFWBPWMWSBWRWV
Content53.611.834.615151555
Table 2. Proximate and ultimate analysis and low heating value of data food solid wastes (wt.%).
SamplesProximate AnalysisUltimate AnalysisLHV(MJ/kg)
FCdAdVdCdHdOdNdSdQd
FSW10.190.7779.0646.0217.233.572.810.4029.39
PC61.557.4331.0275.333.9813.821.020.4228.06
Note: FC—fixed carbon; A—ash; V—volatile matter; d—dried basis; LHV—lower heating value.
Table 3. The main functional groups.
Wave Number (cm−1)Functional GropsCompounds
3600–3000OH stretchingAcid, methanol
2860–2970C-Hn stretchingAlkyl, aliphatic, aromatic
1700–1730C=O stretchingKetone and carbonyl
1632C=CBenzene stretching ring
1613,1450C=C stretchingAromatic skeletal mode
1470–1430O-CH3Methoxyl-O-CH3
1440–1400OH bendingAcid
1402CH bending-
1232C-O-C stretchingAryl–alkyl ether linkage
1215C-O stretchingPhenol
1170,1082C-O-C stretching vibrationPyranose ring skeletal
1108OH associationC-OH
1060C-O stretching and C-O deformationC-OH (ethanol)
700–900C-HAromatic hydrogen
700–400C-C stretching-
Table 4. Combustion characteristic parameters of FSW and PC.
Sampleβ (K/min)Tin (K)Tp (K)Ti (K)T1max (K)DTG1max (%/min)T2max (K)DTG2max (%/min)
FSW2.5515.69729.44497.35531.91.43707.121.35
5487.66764.2503.12545.353.05720.412.5
10444.76803.58513.87566.447743.053.2
20437.31856.38501.48545.7711754.694.6
PC2.5651.12731.14653.02--704.851.81
5627.14763.1667.63--728.953.88
10604.14836.16641.66--738.625.5
20590.27967.61657.24--787.356.4
Note: β, heating rate; Tin, Initial decomposition temperature; Tp, Burnout temperature; Ti, Ignition temperature; Tmax, Peak temperature; DTGmax, Peak rate.
Table 5. Co-combustion characteristic parameters of FSW and PC.
FSW Content (%)Tin (K)Tp (K)Ti (K)Cb∗10−5Sn∗10−9First StageSecond Stage
TR (K) Tpeak
(K)
Rate
(%/min)
TR (K) Tpeak
(K)
Rate
(%/min)
0590.27967.61657.241.486.26---757–817787.46.4
20516.56942.83502.222.6910.64539–599569.732.93750–810780.86.79
40482.58923.7504.582.439.89535–595565.685.1746–806776.16.19
60457.11893.69503.192.912.48535–595565.037.34723–783753.15.58
80447.08877.34509.13.5415.64526–586556.69.17748–808778.74.84
100437.31856.38499.264.4916.63520–580550.0111.18681–741711.44.81
Note: Tin, Initial decomposition temperature; Tp, Burnout temperature; Ti, Ignition temperature; TR, Temperature range; Cb, Flammability index; Sn, Integrated combustion characteristic index; Tpeak, the temperature of the peak reaction rate; Rate, the burning rate at the peak.
Table 6. Kinetic energy parameters obtained by Coats–Redfern.
FSW Content (%)The First StageThe Second Stage
E (kJ/mol) A   ( m i n 1 ) R2E (kJ/mol) A   ( m i n 1 ) R2
0---40.9252.730.9998
2034.164.01 × 100.994436.1528.760.9999
4040.613.46 × 1020.990930.2111.690.9997
6048.764.05 × 1030.990624.765.520.9986
8057.705.27 × 1040.996826.719.790.9952
10074.524.27 × 1050.992715.041.110.9853
Publisher’s Note: MDPI stays neutral with regard to jurisdictional claims in published maps and institutional affiliations.

