Article

Citizen Science as an Innovative Approach to Analyze Spatial and Temporal Influences on Nitrate Pollution of Water Bodies: Results of a Participatory Research Project in Germany

1
Department of Biology/Chemistry, University of Osnabrück, 49076 Osnabrück, Germany
2
Institute of Chemistry, University of Oldenburg, 26111 Oldenburg, Germany
3
Institute of Environmental Systems Research, University of Osnabrück, 49076 Osnabrück, Germany
4
University of Vechta, 49377 Vechta, Germany
*
Authors to whom correspondence should be addressed.
Sustainability 2022, 14(15), 9516; https://doi.org/10.3390/su14159516
Submission received: 30 June 2022 / Revised: 22 July 2022 / Accepted: 28 July 2022 / Published: 3 August 2022

Abstract

:
Anthropogenic influences and the excessive input of reactive nitrogen compounds into the environment have already severely destabilized the natural nitrogen cycle. Especially in northwestern Germany, many water bodies are polluted by nitrate, inducing negative effects on the ecosystem and drinking water as well as possible risks to human health. In cooperation with almost 600 citizens and 200 students, this issue was addressed in a citizen science project carried out by the Universities of Osnabrück and Oldenburg, gathering 8754 nitrate measurements at 545 monitoring sites from September 2019 to March 2021. The data were used to evaluate the potential of citizen science for research on nitrogen pollution of water bodies. In a pre-investigation, we proved that nitrate test strips are suitable as a measurement method for the citizen science approach to provide an overview of nitrate pollution. We then analyzed whether the citizen science approach can be used to establish an area-wide representative measurement network, to what extent the data can be used for spatial and temporal analyses, and whether the data are consistent with the results of other monitoring initiatives. For this purpose, geoprocessing tools, such as spatial joins and heatmaps, were combined with descriptive statistics and nonparametric statistical tests. Although it was not possible to establish a representative monitoring network due to the uneven spatial distribution of monitoring sites, a large part of the intended area was covered by monitoring sites. Thus, the data provide a good overview of the nitrate pollution in the region and shed light on influencing factors. Spatial impacts, such as land cover and use and hydrogeological conditions, as well as seasonal impacts were statistically evidenced with the citizen science data. Furthermore, the consistency of the data with the measurement results of established measurement initiatives confirm the quality of the citizen science dataset. Accordingly, citizen science can be used to investigate spatial and temporal factors influencing nitrogen pollution, and thus contributes to water conservation research as an innovative approach.

1. Introduction

1.1. Nitrate—Between Necessity and Excess

Nitrogen is an essential element for survival, for example as a constituent of amino acids and proteins [1]. Furthermore, nitrogen compounds are necessary as a fertilizer for plants to meet the nutritional needs of the increasing world population and achieve the UN’s Sustainable Development Goal 2, no hunger [2,3,4,5]. However, the nitrogen cycle has been considerably destabilized by anthropogenic influences, resulting in high risks of significant consequences for the earth system [6]. The excess of reactive nitrogen compounds negatively affects life on land and under water, for example, through eutrophication and acidification of water bodies and soils, resulting in extensive and expensive drinking water treatment [7,8]. In particular, the massive use of fertilizers in some intensively farmed regions, including Germany, contributes to the exceedance of the planetary boundary for the nitrogen cycle [6]. In the reporting period 2016–2018, 26.7% of groundwater monitoring sites from the EU nitrate monitoring network in Germany exceeded the chemical limit value of 50 mg/L nitrate (arithmetic mean of the three annual mean values of multiple measurements), and 82% of flowing water monitoring sites exceeded the ecological target value of 2.5 mg/L nitrate-nitrogen in 2018 (90th percentile of multiple measurements in 2018) [9].

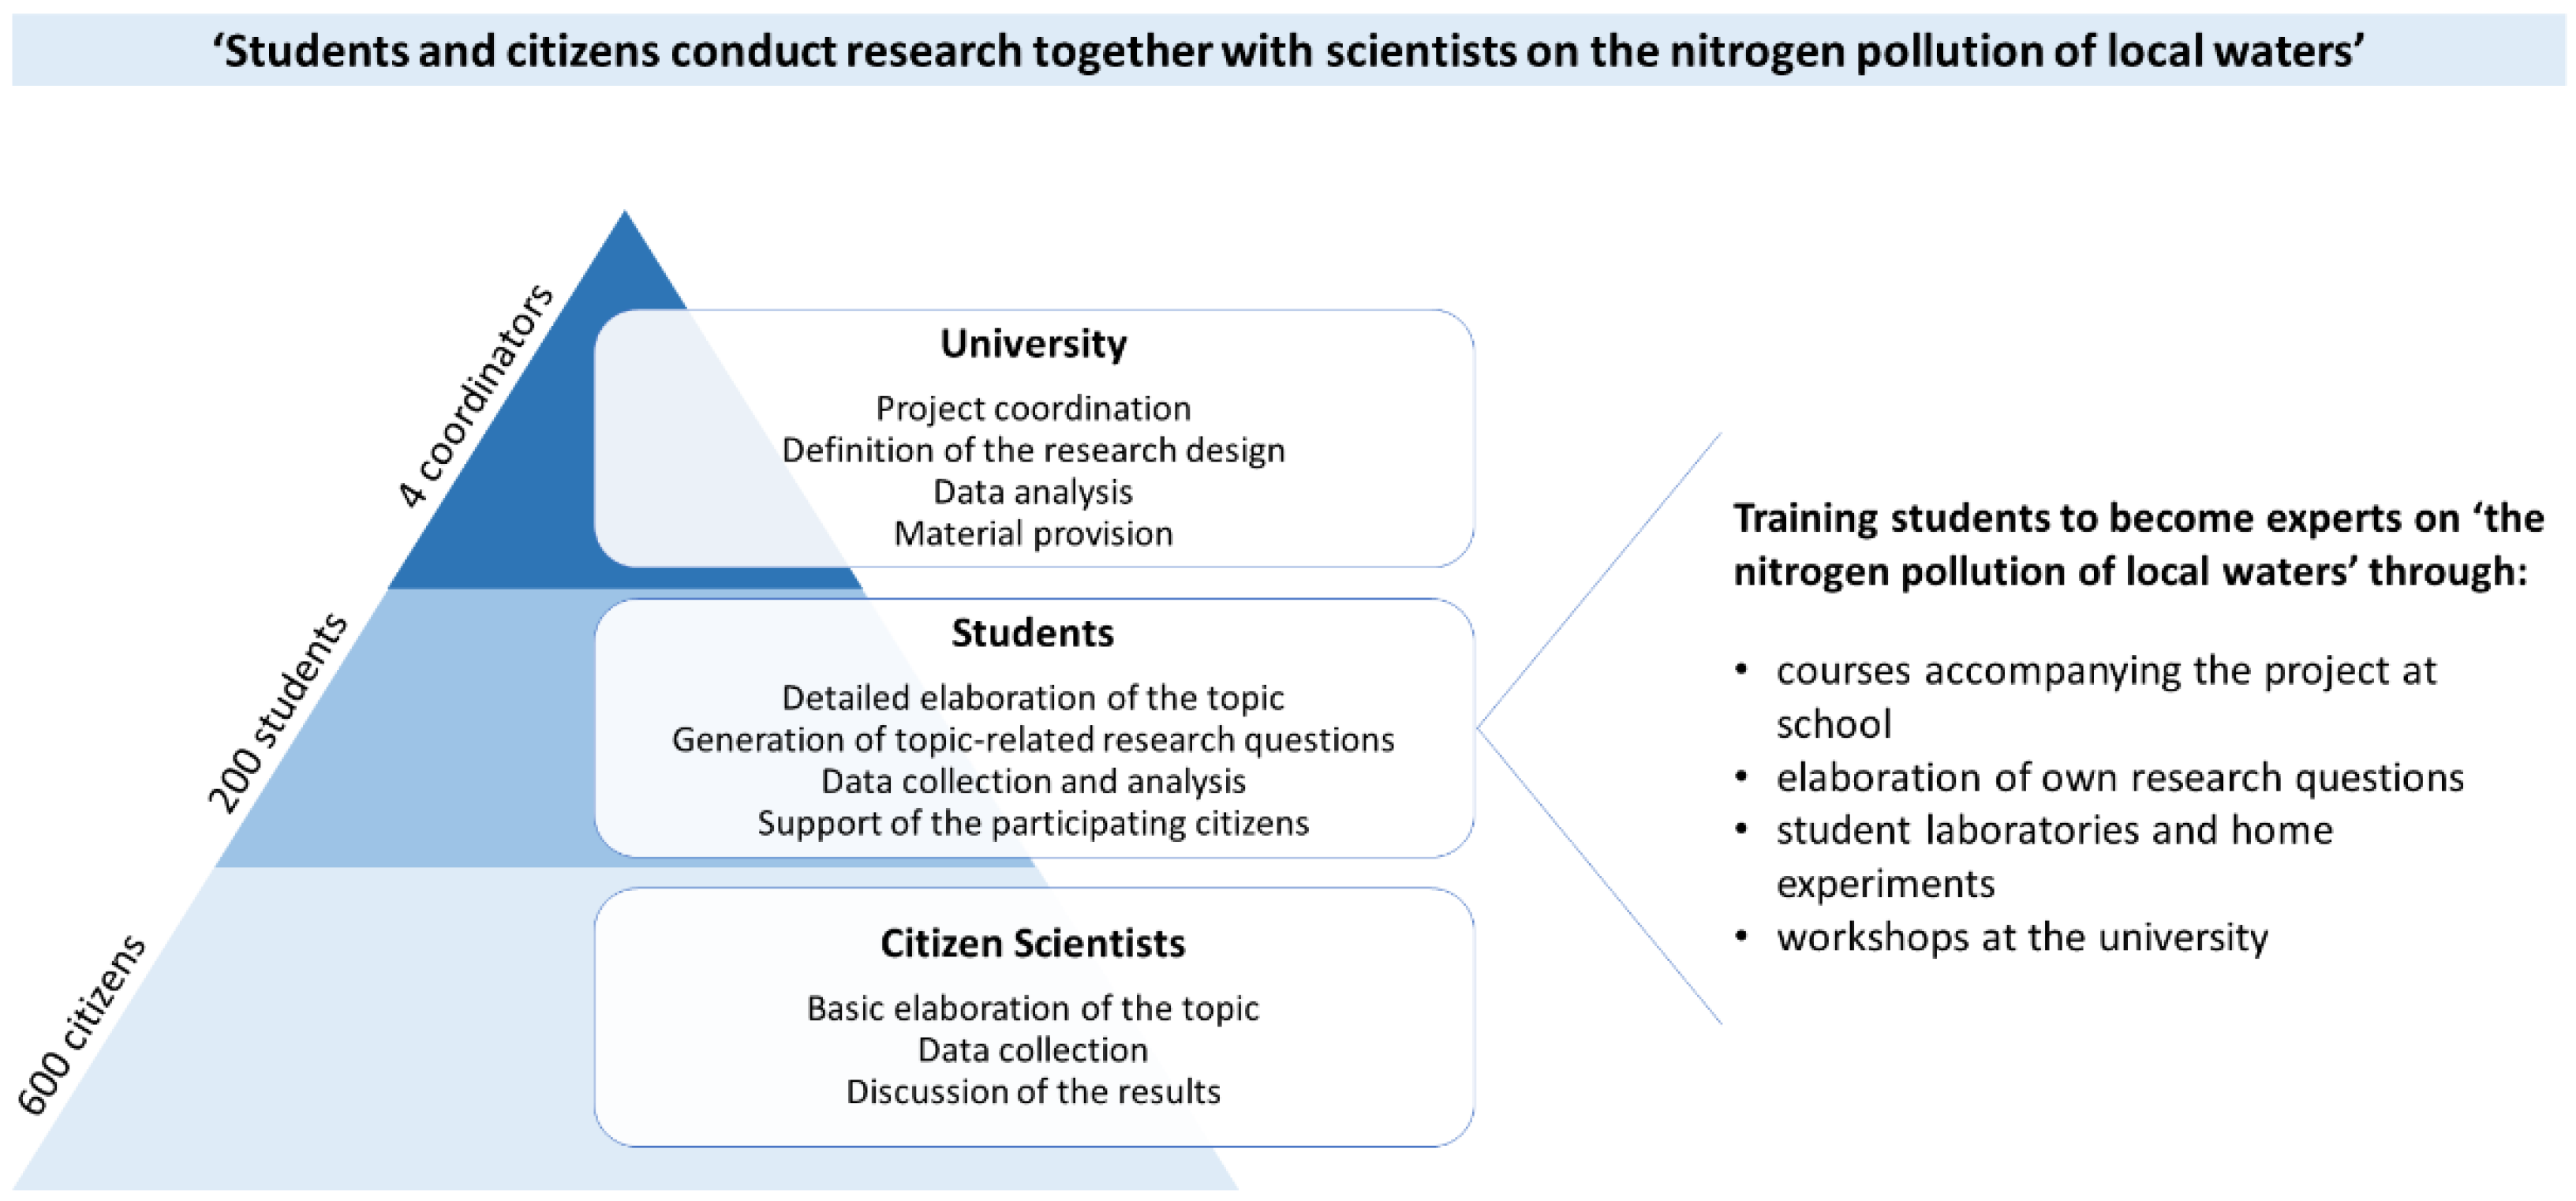
1.2. A Citizen Science Project to Investigate the Nitrate Pollution of Water Bodies

To close data gaps in regions where groundwater is not or insufficiently monitored, the World Water Quality Alliance (WWQA) proposes the citizen science approach [10]. Citizen science describes a concept in which citizens participate in scientific research with different degrees of participation, for example, in collecting and analyzing data, formulating research questions or generating hypotheses [11,12]. In this way, citizen science can contribute to creating learning opportunities, enabling civic participation and generating scientific outcome [13]. Several research studies have highlighted the potential of citizen science for sustainable development and for integration into formal SDG reporting mechanisms [14,15,16,17]. This potential was used in a citizen science project of the Universities of Osnabrück and Oldenburg to conduct a participatory citizen science study of nitrate pollution of water bodies in northwestern Germany [18]. In contrast to other regions, Germany has an established groundwater and surface water monitoring network [19,20,21]. The region is, therefore, appropriate for validating the WWQA proposal and the potential and validity of citizen science for water protection research before implementing the approach in poorly monitored areas.
Project objectives: The objectives of the project are divided into two aspects:
(1) Contribution to environmental education: participating citizens are sensitized to the nitrogen pollution of water bodies in order to actively contribute to water protection.
(2) Contribution to scientific research: Monitoring of the nitrate pollution of groundwater, surface waters and rainwater in Germany in the river basins of the Weser and Ems is conducted. Thereby, the citizen science approach is evaluated as a measurement method for the analysis of water pollution. This paper focuses on the second aspect.
Project design (Figure 1): Over a period of 1.5 years (September 2019–March 2021), almost 600 citizens and 200 schoolchildren (16–19 years old) and their teachers investigated the nitrogen pollution of water bodies in northwestern Germany, collaborating with four scientists from the Universities of Osnabrück and Oldenburg. Following the so-called research sponsor approach, the teachers and schoolchildren were trained by the scientists in school laboratories and workshops to become experts on the topic of nitrogen pollution of water bodies. They were also instructed in various test methods, including the nitrate test strips used in the citizen science project. Afterwards, the students acted as so called research sponsors and supported the citizens during the measurements [18,22]. The participants also received supporting booklets explaining the basics of sampling and collection [23]. In addition, two brochures and a digital, interactive exhibition provided information about the nitrogen pollution of water bodies and the results of the project [24,25]. The complete accompanying material of the citizen science project can be found at www.nitrat.uos.de, last updated on 23 March 2022.
Research questions: With this approach, the following research questions are addressed: (1) To what extent can an area-wide nitrate monitoring of different water body types be realized with the citizen science approach within a defined area? (2) Which measurement methods are suitable for the citizen science approach to analyze nitrate concentration in different water body types? (3a) To what extent is it possible to perform spatial and temporal analyses of nitrate pollution using the citizen science data, and (3b) to what extent do they agree with given hypotheses? (4) To what extent are the results of the citizen science project consistent with other measurement initiatives or complementary to other existing data sets? Using the results of these sub-questions, we evaluate the suitability of the citizen science approach for water protection research.

1.3. Theoretical Background and Hypotheses

Land cover and use impacts: 67% of emissions of reactive nitrogen compounds in Germany are caused by agriculture, followed by emissions from industry and energy conversion (16%), transport (11%) and wastewater management, households and urban areas (6%) [26]. Reactive nitrogen enters surface waters and groundwater via various pathways. In Lower Saxony (Germany), the pathways of nitrogen to surface waters were identified in a statewide nutrient modeling project. About 70% of nitrogen inputs enter surface waters via agricultural drainage and interflow, and 7% via urban sources and point sources, such as wastewater treatment plants [27]. Inputs via urban systems are particularly high in cities but also in some regions in the west of Lower Saxony with low population densities, where a high proportion of domestic wastewater is treated by small wastewater treatment plants with low treatment efficiencies [28]. Therefore, we hypothesize: “Nitrate pollution of surface waters in agricultural areas and urban areas is higher than in natural areas and forests”. The nitrate contamination of groundwater is also affected by land use in the inflow area [29]. As a result, the nitrate concentrations of agriculturally affected groundwater (monitoring) wells are higher than the overall situation of groundwater in Germany [9]. Wastewater can also cause increased nitrate concentrations in groundwater, for example via permeable constructed sewage tanks or small wastewater treatment plants with soil–groundwater passage [28,30]. Accordingly, the aforementioned hypothesis can be transferred to groundwater considering the drainage area. The deposition of oxidized nitrogen leads to an excess of nitrogen in rainwater [31]. Thus, we suspect higher nitrate concentrations in rainwater, especially in urban areas, as well as in industrial and traffic areas [32].
Hydrogeological impacts: Another impact affecting nitrate contamination of groundwater is the denitrification potential, which depends mainly on the soil composition. Since anaerobic conditions are necessary for denitrification, i.e., natural nitrate reduction, oxygen-rich soils, which are predominantly present in the sandy geest areas of Lower Saxony, inhibit denitrification [33,34]. The most important nitrogen conversion reaction is the reduction of nitrate to molecular nitrogen. One of the reducing agents is organic carbon, for example in the form of turf. These reducing compounds constitute a limited reservoir that is exhausted by denitrification. In marsh and lowland areas with mainly near-surface groundwater, denitrification can be maintained by organic soil substances dissolved in the leachate [34]. Thus, we investigate the hypothesis: “The nitrate concentrations of the sampled wells in geest areas are higher than the nitrate concentrations of wells in lowland areas”.
Temporal impacts: In surface waters, seasonal fluctuations have been observed in many rivers flowing into the North Sea in other studies [35,36]. The decreasing nitrate concentrations in summer are assigned “to bacterial or phytoplankton nitrate assimilation, which is the dominant nitrate removal process in the rivers during biologically active seasons that coincide with smaller discharges” [35] (p. 1687). In winter, by contrast, the nitrate concentration increases due to reduced assimilation. Since oxidation of nitrate from ammonium (nitrification) is slowed down at temperatures below 12 °C, the highest nitrate concentrations are expected in warm winters [36]. Using the data collected through the citizen science project, we tested the following hypothesis: “The nitrate concentrations of surface waters are higher in the winter months than in the summer months.” Usually, depending on various environmental factors, it takes months to years for nitrate to leach from the surface into the groundwater [37]. Nevertheless, soils and groundwater bodies are also influenced seasonally, for example by warming up and cooling down or by rainfall. This can affect various processes, such as denitrification or leaching [38,39]. Overall, we assume that these effects have such a small impact on the nitrate contamination of groundwater that no differences can be measured in different seasons with the test strips.

2. Materials and Methods
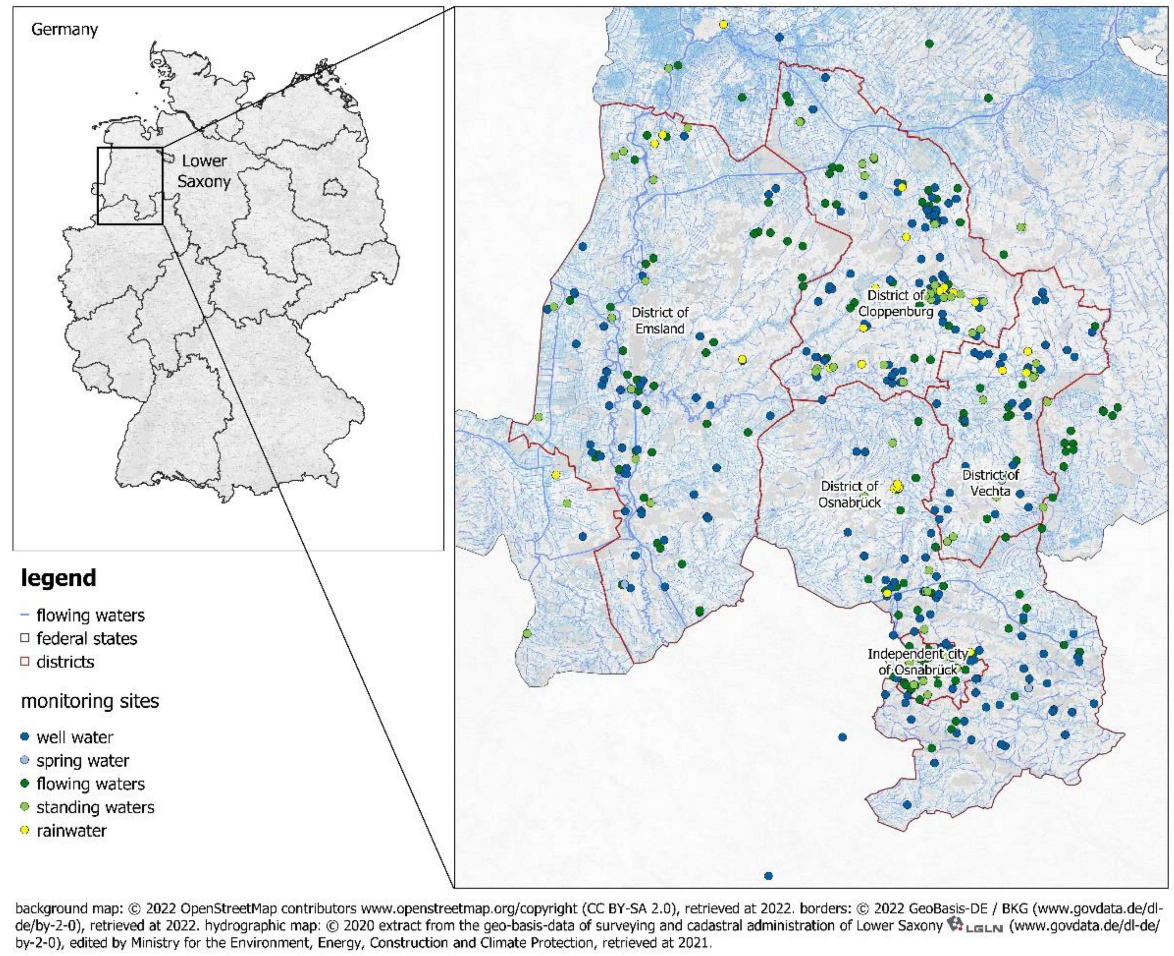
2.1. Sampling Area

The sampling area includes four districts (district of Osnabrück, Vechta, Emsland, Cloppenburg) and one independent city (Osnabrück) in Lower Saxony, a federal state in northwestern Germany (Figure 2). This region is characterized by intensive agriculture and fertilizer use, which contributes to the high nitrate contamination of groundwater and surface waters [27,40,41]. In addition, there are different land cover and land use classes (agricultural areas, artificial surfaces and forest and seminatural areas), as well as hydrogeological conditions (geest, lowland and upland) [42,43]. For the implementation of the Water Framework Directive, the Lower Saxony Water Management, Coastal Protection and Nature Conservation Agency (NLWKN) has an extensive monitoring network with area-wide and long-term measurement series [19,20]. The boundary conditions of the sampling area result in three benefits for nitrate monitoring: First, the results of the citizen science project can be compared with measurement results from the NLWKN, among other monitoring initiatives, to evaluate the quality of the data and the contribution of citizen science for water protection research. Second, due to the high public interest of the topic, a high number of participants can be achieved for the nitrate monitoring. In addition, there is generally a high level of interest in Germany in participating in current research projects [44]. Thirdly, environmental conditions are variable in space, which enables spatially differentiated analysis of the nitrate concentration so that hypotheses 3(a) and (b) can be examined.

2.2. Sampling Design and Measurement Method

The participants were instructed to measure the nitrate concentration of a self-selected water body (flowing or standing waters, rainwater, well water or spring water) in their region biweekly from September 2019 to March 2021 using nitrate test strips (JBL PROAQUATEST EASY 7in1). The self-selection of sampling sites for the specified types of water bodies by the participants was intended to motivate as many citizens as possible to participate and take frequent measurements by giving them the opportunity to examine nearby water bodies. However, this affects the quality of the monitoring network, especially with respect to representativeness, which is discussed in 3.1. The measurement data, including the location name, measurement time and coordinates of the sampling sites, were transmitted to the scientists via a website and logged with a sampling protocol and a photo of the test strip.
With the test strips, a semi-quantitative measurement of the nitrate concentration is possible by comparing the color of a test field with a color scale (0, 10, 25, 50, 100, 250, 500 mg/L nitrate). Due to measurement and color matching difficulties, the participants were also allowed to indicate intermediate categories, such as 10–25 mg/L. The test strips offer two key benefits as a method for citizen science projects: they are inexpensive and easy to use. In contrast to laboratory methods, such as photometric analysis, the data obtained with the test strips are only semi-quantitative. Nevertheless, the test strips were selected to provide an overview of nitrate pollution using the citizen science approach. To ensure valid results, we examined the test strips in an accompanying study, in particular with regard to their accuracy due to the limited precision of subjective color perception by the human eye. For that, 19 participants measured the nitrate concentrations of 20 nitrate standard solutions from 0 to 500 mg/L with the nitrate test strips [45]. After excluding the two lowest and highest measured values as outliers, intervals were calculated that cover the actual nitrate concentrations for the values measured with the test strips. Using this analysis, the measurements of the participants were classified semi-quantitatively according to chemical limits and ecological target values for groundwater and surface waters [46,47].

2.3. Quantity and Distribution of Monitoring Sites

In total, 545 monitoring sites were investigated by the participants, including 248 at wells (filter depth varies from 2.5 to 38 m), 3 springs, 186 sites in flowing waters, 73 in standing waters and 35 sites where rainwater was sampled with rainwater catchers (Figure 2). At these monitoring sites, 8754 nitrate measurements were conducted using the test strip method described above. A total of 12 of the online registered monitoring sites were excluded from the analysis because measurements from several locations were probably stored under the same name due to imprecise naming (e.g., location name “well” instead of “well_name_of_the_city”).
The spatial distribution of the monitoring sites was analyzed with heatmaps. In order to identify monitoring sites that were too dense, a maximum of 5 monitoring sites per 250 km2 was defined, adapted and modified from recommendations of the NLWKN for groundwater monitoring [48]. Therefore, a radius of 8.92 km was used for the heatmap (Kernal shape: bi-quadratic).

2.4. Analysis of the Monitoring Data

Based on the measurement design and method, spatially and temporally resolved ordinal-scaled measurement data were collected. Therefore, methods for ordinal data and non-parametric, statistical test methods were used as described below. A distinction has to be made between independent samples, e.g., for the spatial comparison of different monitoring sites, and dependent samples, e.g., for the analysis of seasonal differences within a monitoring site.
Classification of the nitrate concentration of the monitoring sites: Due to the ordinal-scaled data, percentiles were used for the general classification of the nitrate concentration of each water monitoring site over the entire study period. According to the guidelines for groundwater monitoring in the German Groundwater Ordinance, the 50th percentile (as ordinal counterpart to the arithmetic mean) of all nitrate measurements over the entire study period was determined for each groundwater monitoring site (well and spring water measurements in this case) [46]. For surface waters, a previous recommendation of the LAWA (German Working Group on water issues of the Federal States and the Federal Government represented by the Federal Environment Ministry) was used, as it considers nitrate separately (in contrast to the current ecological target value for total nitrogen in surface waters in Germany) [47,52]. According to this, the 90th percentile of all measured values for each monitoring site in surface water was used to classify the general nitrate concentration.
Subsequently, the nitrate concentrations of all monitoring sites were descriptively compared among the different types of water bodies. Differences between the nitrate pollution of different water body types (separated into surface water and groundwater) were statistically analyzed using a Mann–Whitney U-test [53,54].
Spatial analyses: Only monitoring sites with an acceptable location accuracy (coordinates less than 250 m away from the nearest/sampled water body [49]) were considered in the spatial analysis. Spatial joins were made between monitoring sites and external geodata to analyze land cover and use or hydrogeologic influences on nitrate pollution:
  • Land cover and use: CORINE Land Cover 5 ha, Status 2018 [43]
  • Hydrogeology: Hydrogeological spatial structure of Germany (HYRAUM) [55]
For the water body types flowing waters, rainwater and well water, at least 5 monitoring sites were located in each of the Corine classes or hydrogeological areas after spatial join (Table 1). Therefore, these are considered in the spatial analysis.
Based on these, Kruskal–Wallis and Dunn–Bonferroni post hoc tests were performed to check for significant differences of nitrate concentrations (using the classification of the nitrate concentration described above) for the different spatially classified areas [56,57].
Temporal analyses: The Friedman test for dependent samples, Dunn–Bonferroni post hoc tests, and descriptive statistics were used to analyze seasonal fluctuations of surface water and groundwater nitrate contamination [57,58]. For the analysis with the Friedman test and Dunn–Bonferroni post hoc tests, only monitoring sites were considered, which were investigated at least once in each of the six meteorological seasons during the study period (Table 2, last column). In addition, the descriptive statistics for any single season include all monitoring sites that were sampled at least once during the respective season (Table 2, column 3–8). Within each season, the 50th percentile of multiple measurements was calculated for each monitoring site and used for the Friedman test and descriptive statistics.
Consistency with other measurement initiatives: For comparison with other monitoring initiatives, the water body types, well water and flowing water, were used as examples, since for these types, other data were available for comparison:
  • German non-profit environmental protection organization VSR-Gewässerschutz e. V.: Interactive nitrate map—overview of the concentration in the districts [59]
  • Lower Saxony Water Management, Coastal Protection and Nature Conservation Agency (NLWKN): Nitrate values at various monitoring sites, 2019 up to and including 2021 (only project-internal data use approved)
First, the citizen science and the VSR-Gewässerschutz data were descriptively compared, calculating the percentage of well water monitoring sites exceeding the chemical limit of 50 mg/L nitrate for all participating districts for both monitoring initiatives. A “nearest neighbor analysis” was then performed to spatially compare well water and flowing waters results with the NLWKN and the citizen science project. To consider vertical differences in groundwater, the monitoring wells were classified according to their mean filter depth in 10 m steps. The nearest neighbor analysis was performed within each of these categories. Subsequently, the nitrate concentrations of the assigned well and flowing water monitoring sites, calculated with the 50th and 90th percentile for the citizen science data and the mean and 90th percentile for the NLWKN data, were compared.

3. Results

3.1. Monitoring Coverage of the Area of Investigation and Distribution of Monitoring Sites

The coverage of the area of investigation and the spatial distribution of monitoring sites is discussed below using a heatmap of the sampled wells as an example (Figure 3). Although many parts of the districts were well covered (including districts marked in red), in some areas, particularly in rural areas, no samples were taken at all. The heatmap also shows that the density of monitoring sites in urban areas is higher than in rural areas, where in some cases there is a lack of sites for area-wide coverage. Due to this inhomogeneous (biased) distribution of the monitoring sites, it is not a representative monitoring network. The same observation can be made for flowing waters.
Standing waters, rainwater and spring water measurements were conducted in much smaller numbers and, therefore, do not build an area-wide or representative monitoring network. Although a representative assessment of their contribution to the nitrate contamination of water in the area of investigation is, therefore, not possible, temporal and spatial analyses can be performed. In addition, the results provide an overview of areas with high nitrate pollution so countermeasures can be discussed. Furthermore, the results can be used as a basis for establishing a representative monitoring network or for adding monitoring sites to an existing monitoring network.

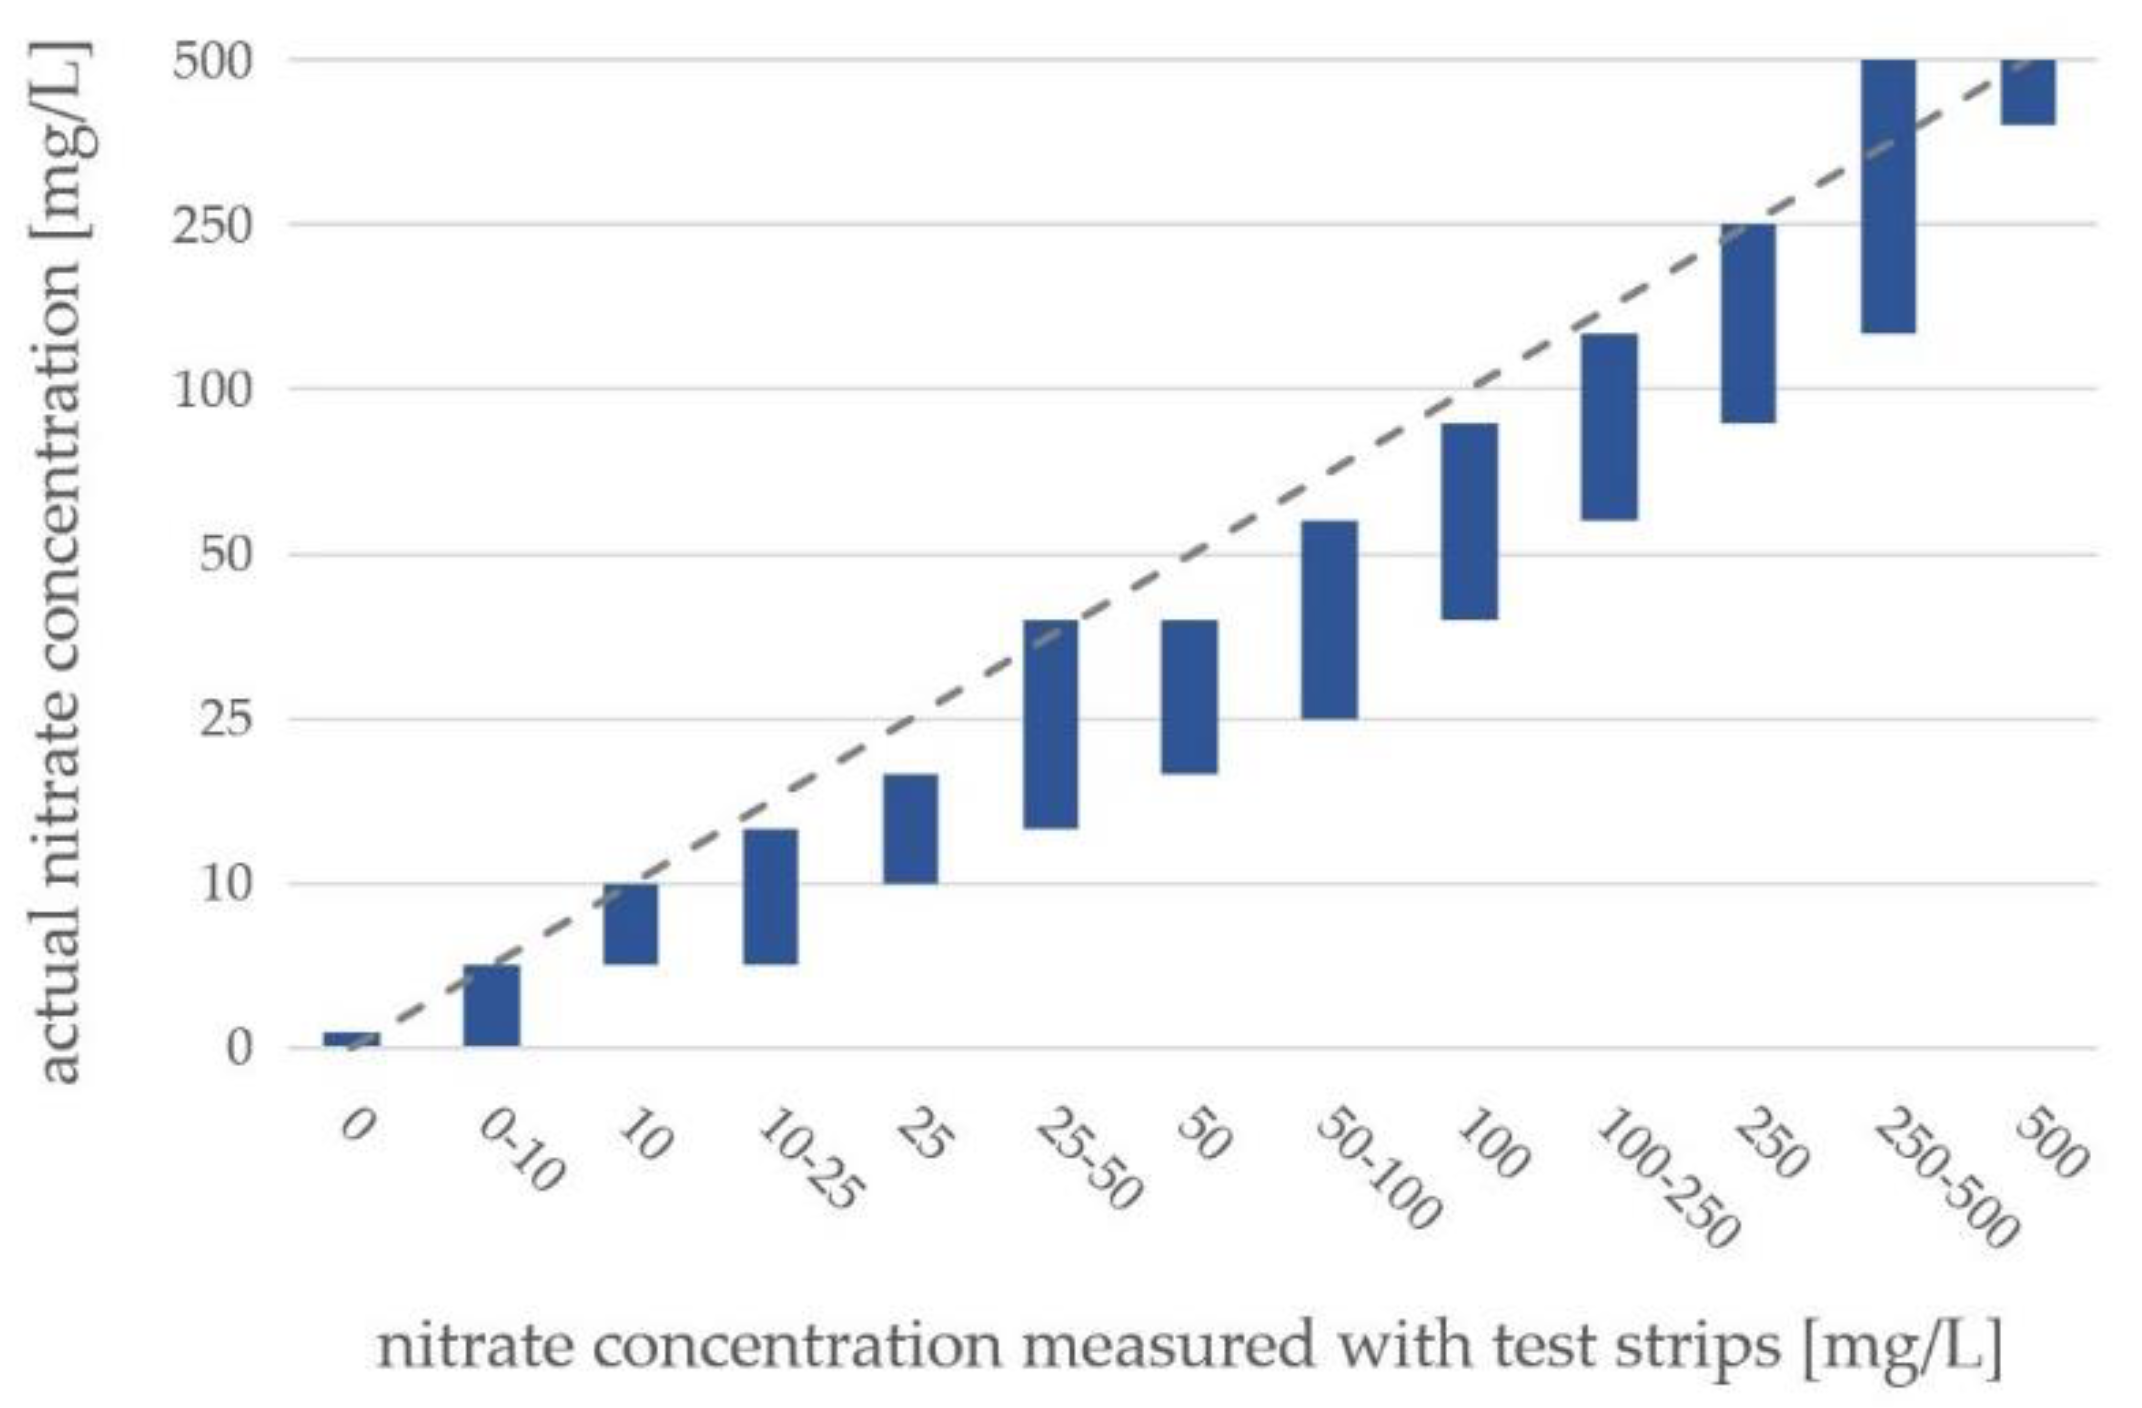
3.2. Measurement Accuracy of Test Strips as a Measurement Method for Citizen Science Projects

Another pre-consideration for the analysis of the data is the suitability and accuracy of the measurement method, which is described below. Figure 4 shows the actual nitrate concentrations to the values that the citizens have measured with the test strips as blue intervals [45]. The analysis reveals that the nitrate concentrations are overestimated over the entire measurement range. Using the test strips, the real concentrations are in each case lower or equal to the measured concentrations. This overestimation is consistent so that an adjustment of the measured values is possible. The results also indicate that color perception of the human eye is not precise enough to unambiguously assign the coloration of the test strip to the color scale, since the blue intervals overlap for neighbored concentration classes (Figure 4). Nevertheless, with the test strips, it is possible to classify the nitrate concentrations of water samples semi-quantitatively according to chemical limits and ecological target values [46,47]. Due to the uncertainty of the results, intermediate categories had to be added, for which a definite assignment to the limits and targets is not possible. However, these intermediate categories provide an approximate assessment of nitrate pollution. The suggested categorization can be found in Table 3, differentiated by surface waters and groundwater. The test strips are, therefore, suitable for combining simple and inexpensive, but also sufficiently accurate measurements for the citizen science approach, providing a large-scale overview of nitrate pollution.

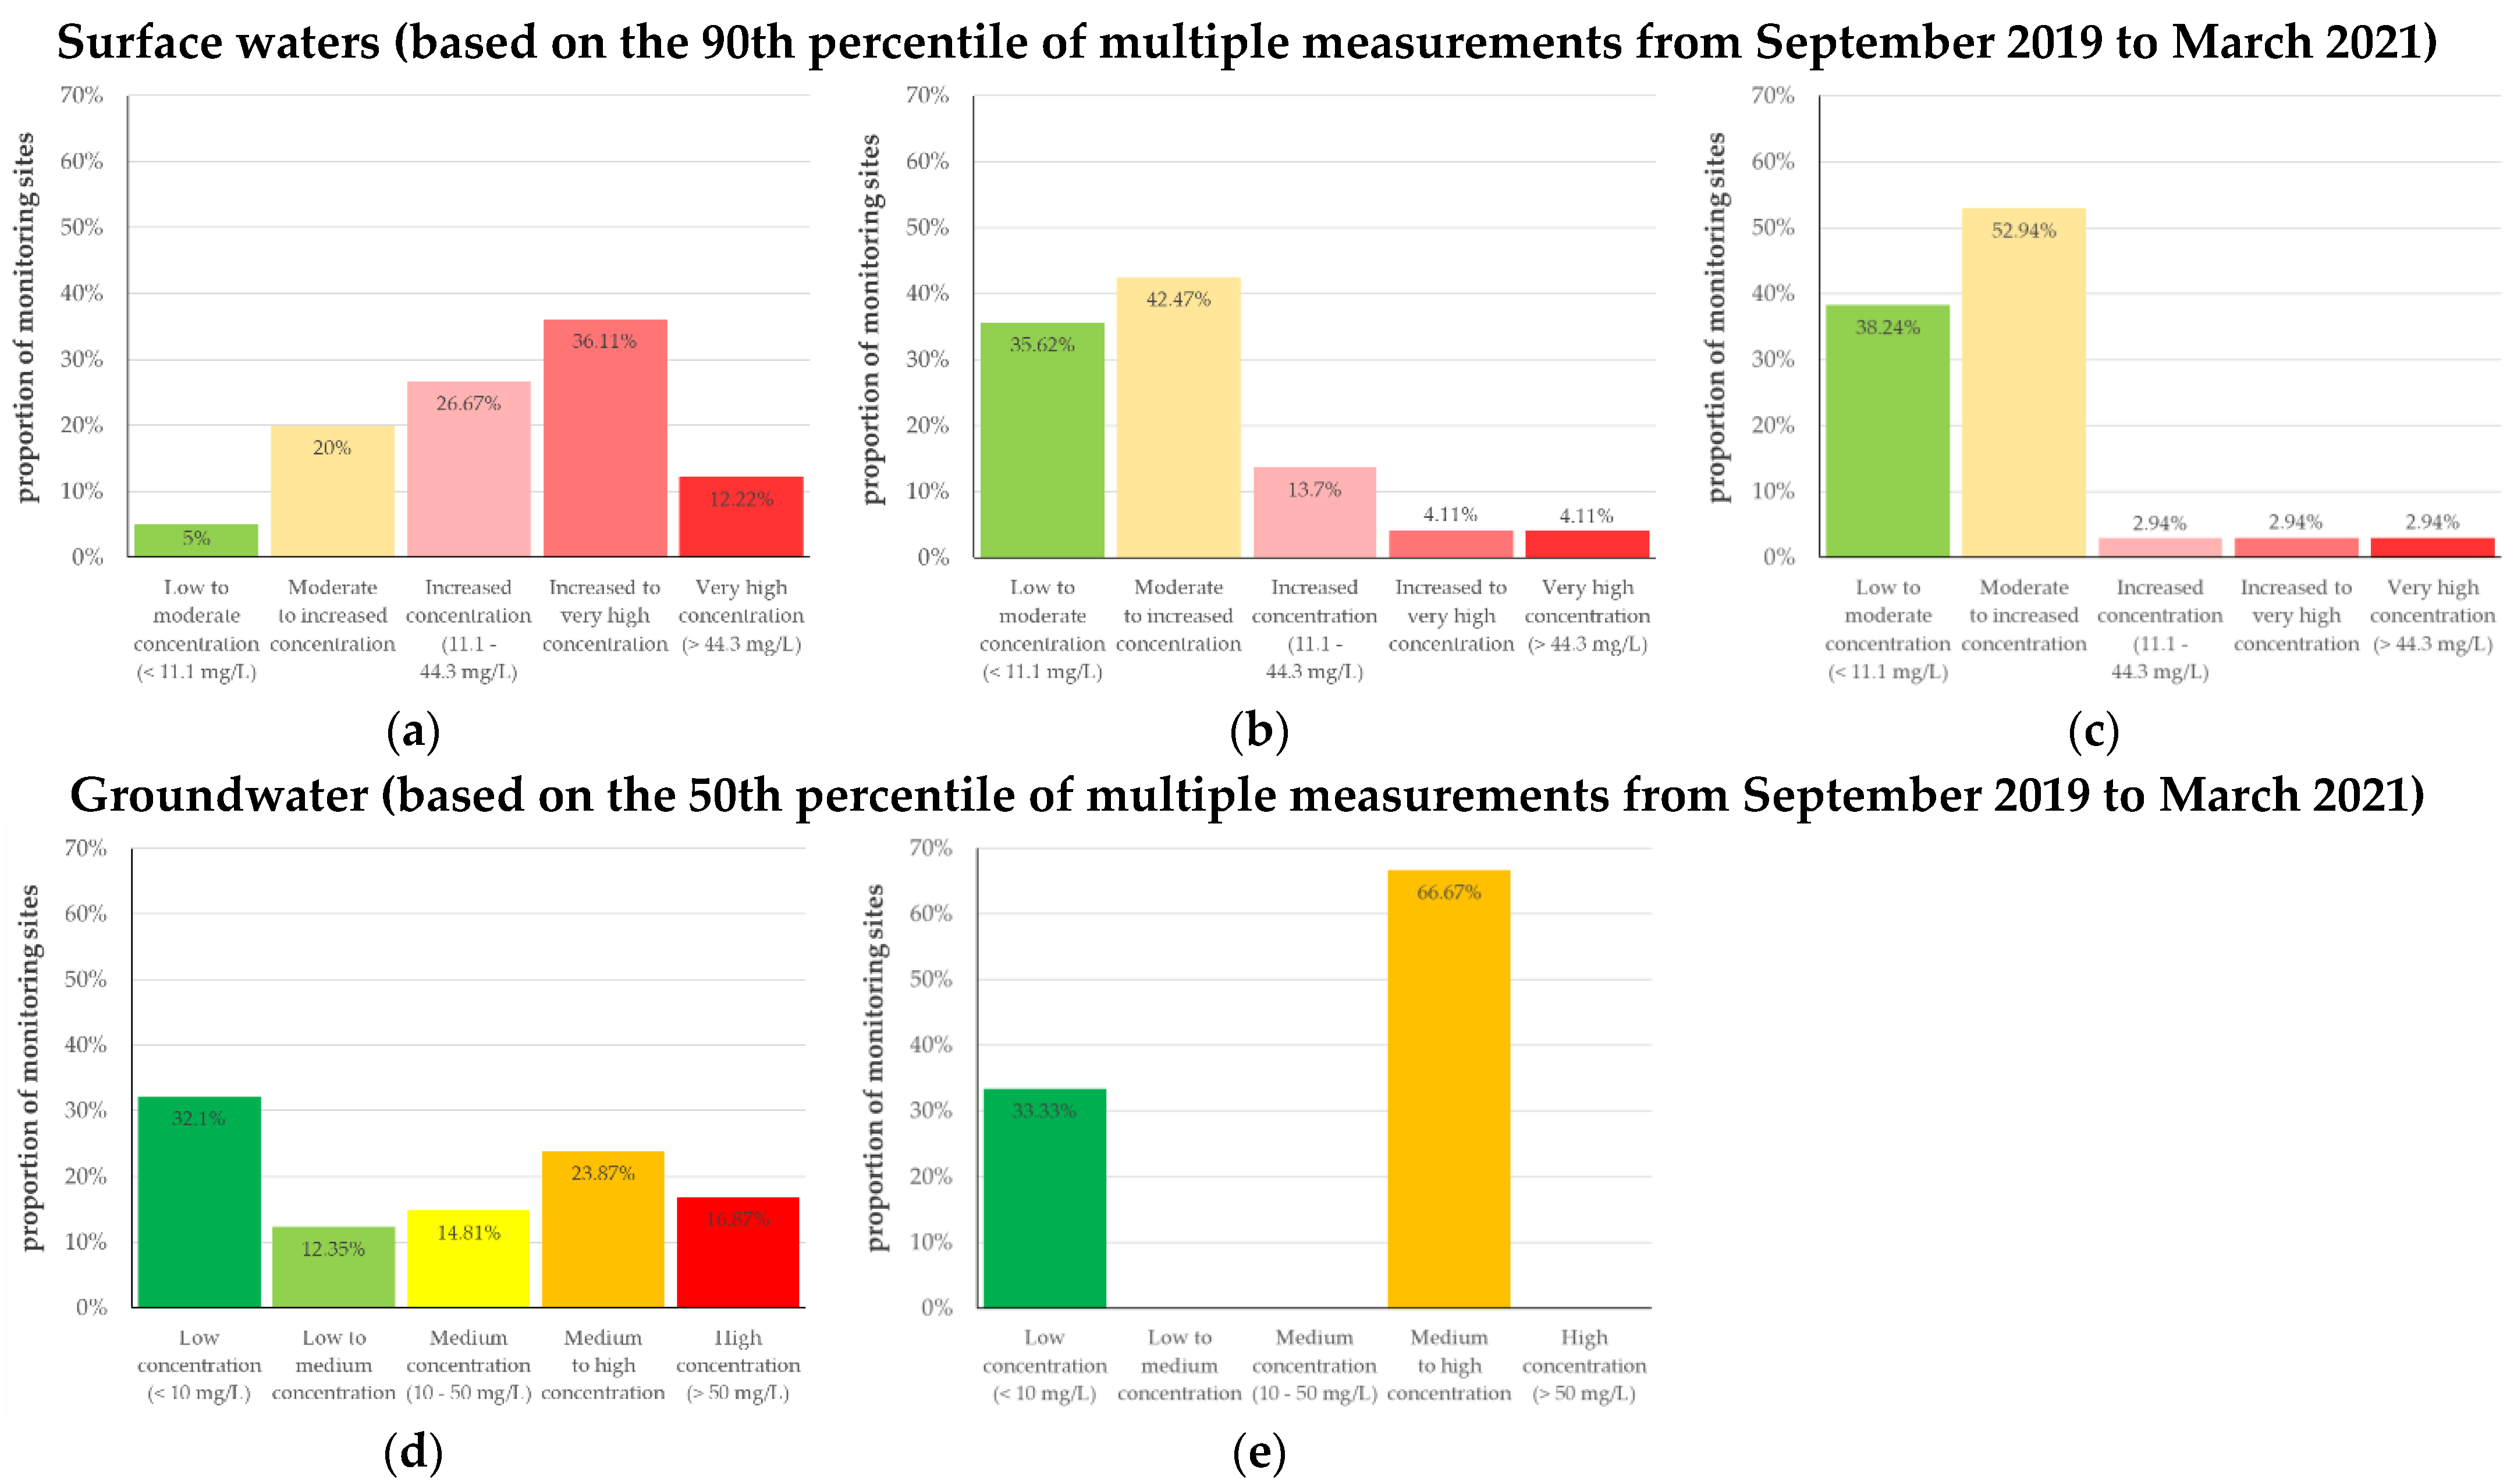
3.3. Overview of Nitrate Pollution

Using the 50th or 90th percentile, depending on the water body type and the categorization presented above, the nitrate pollution of the sampled water bodies was assessed. Figure 5 gives an overview of the nitrate concentrations of the sampled water bodies, classified by the water body type. The results confirm that the nitrate pollution of different water bodies in the sampled area exceeds chemical limit and ecological target values in many places. A total of 16.9% of the sampled wells definitely exceed the chemical limit for nitrate (based on the 50th percentile of multiple measurements). In the case of surface waters, increased to very high nitrate concentrations are observed, particularly in flowing waters (based on the 90th percentile of multiple measurements). Only 5% of the river sites are clearly below the ecological target value for nitrate. Mann–Whitney U-Tests show that the nitrate concentrations of the sampled flowing waters are significantly higher than that of the sampled standing waters (U = 2527.500, Z = −7.879, p < 0.001). This can be explained by smaller basins of standing waters without inflow and outflow of rivers and thus lower anthropogenic influences. The nitrate concentrations of the river sites are also significantly higher than the nitrate concentrations of the sampled rainwater (U = 908.000, Z = −6.702, p < 0.001). Since rainwater is only polluted by the deposition of nitrogen compounds from the atmosphere, the impacts of human activities are likewise less extensive for rain than for surface waters.

3.4. Spatial Impacts

Land cover and land use impacts: A Kruskal–Wallis test shows that the nitrate pollution of flowing waters differs significantly between level 1 Corine classes (H = 11.048, p = 0.004, df = 2), with a mean rank of 31.39 for forests and seminatural areas, 63.20 for artificial surfaces and 73.29 for agricultural areas [43]. Thus, the hypothesis concerning the influence of land cover and use on flowing waters is confirmed. In addition, a Kruskal–Wallis test was performed with the rainwater data to analyze differences in nitrate input for monitoring sites in industrial, commercial and transportation units or continuous urban fabric areas compared to the other level 2 Corine classes [43]. No significant differences were found (H = 3.435, p = 0.180, df = 2), yet descriptive statistics show that the three most polluted rainwater monitoring sites are located in industrial, commercial and transport units and continuous urban fabric areas, as suspected.
Although land cover and use probably affect nitrate groundwater pollution, this influence cannot be analyzed with the citizen science data. Identifying land use in the drainage area of the investigated wells requires knowledge of more parameters (e.g., groundwater flow direction) that cannot be determined using the citizen science approach with simple methods [9,29]. The spatial assignment of data based only on GPS coordinates would lead to a bias in the outcome of the data because vertical and horizontal flows within groundwater bodies were not considered.
Hydrogeological impacts: Citizen science data from the well water monitoring sites were used to analyze the impacts of hydrogeologic conditions on nitrate pollution. For this, after a spatial join of the monitoring sites with the hydrogeological areas [55], a Kruskal–Wallis test was performed. Significant differences (H = 20.056, p < 0.001, df = 2) were found between the three categories of hydrogeological areas geest, lowland and upland. A post-hoc test with Bonferroni correction shows that nitrate pollution is significantly higher in geest areas than in lowland areas (z = −44.841, p < 0.001), confirming the hypothesis.

3.5. Temporal Impacts

As hypothesized, nitrate concentrations of surface waters differ significantly among different seasons (Friedman test flowing waters: Chi-square = 107.639, p < 0.001, df = 5, Friedman test standing waters: Chi-square = 16.216, p = 0.006, df = 5). Subsequent Dunn–Bonferroni post-hoc tests show that nitrate concentrations of samples from flowing waters were significantly lower in summer 2020 than in winter 2019/2020 and winter 2020/2021 (summer 2020 and winter 2019/2020: z = 1.777, p < 0.001, r = 0.672, summer 2020 and winter 2020/2021: z = −0.994, p = 0.009, r = 0.376). For standing waters, no significant differences remain after Bonferroni correction, yet it can be clearly observed in the descriptive statistics that the nitrate concentrations are also lower in the summer than in the winter months (Figure 6a,b). In contrast, no seasonal differences in the nitrate concentrations of the well water monitoring sites can be observed over the measurement period (Chi-square = 8.850, p = 0.115, df = 5) (Figure 6c). Based on the citizen science data, all hypotheses concerning seasonal variations can be verified.

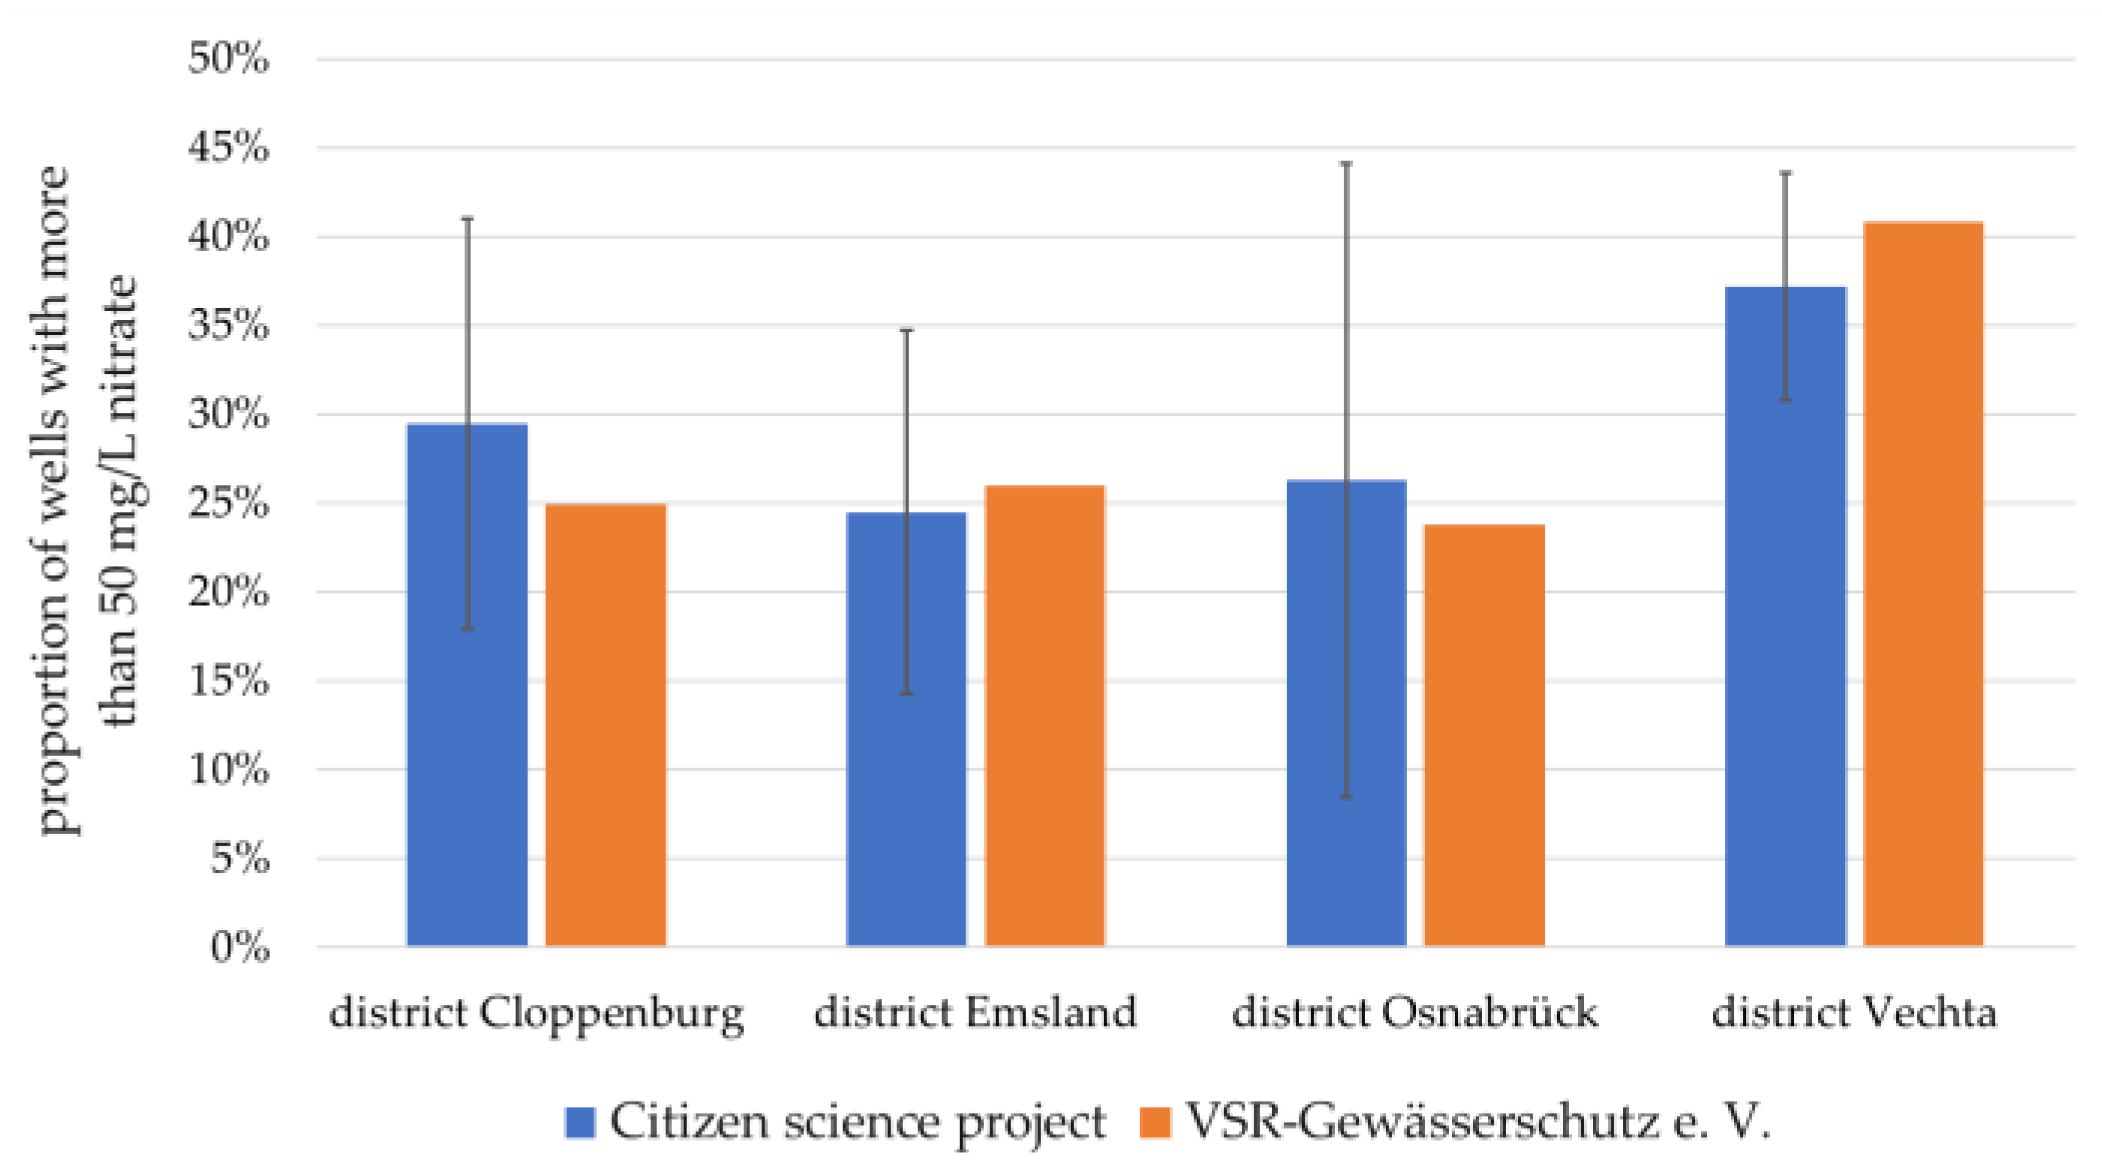
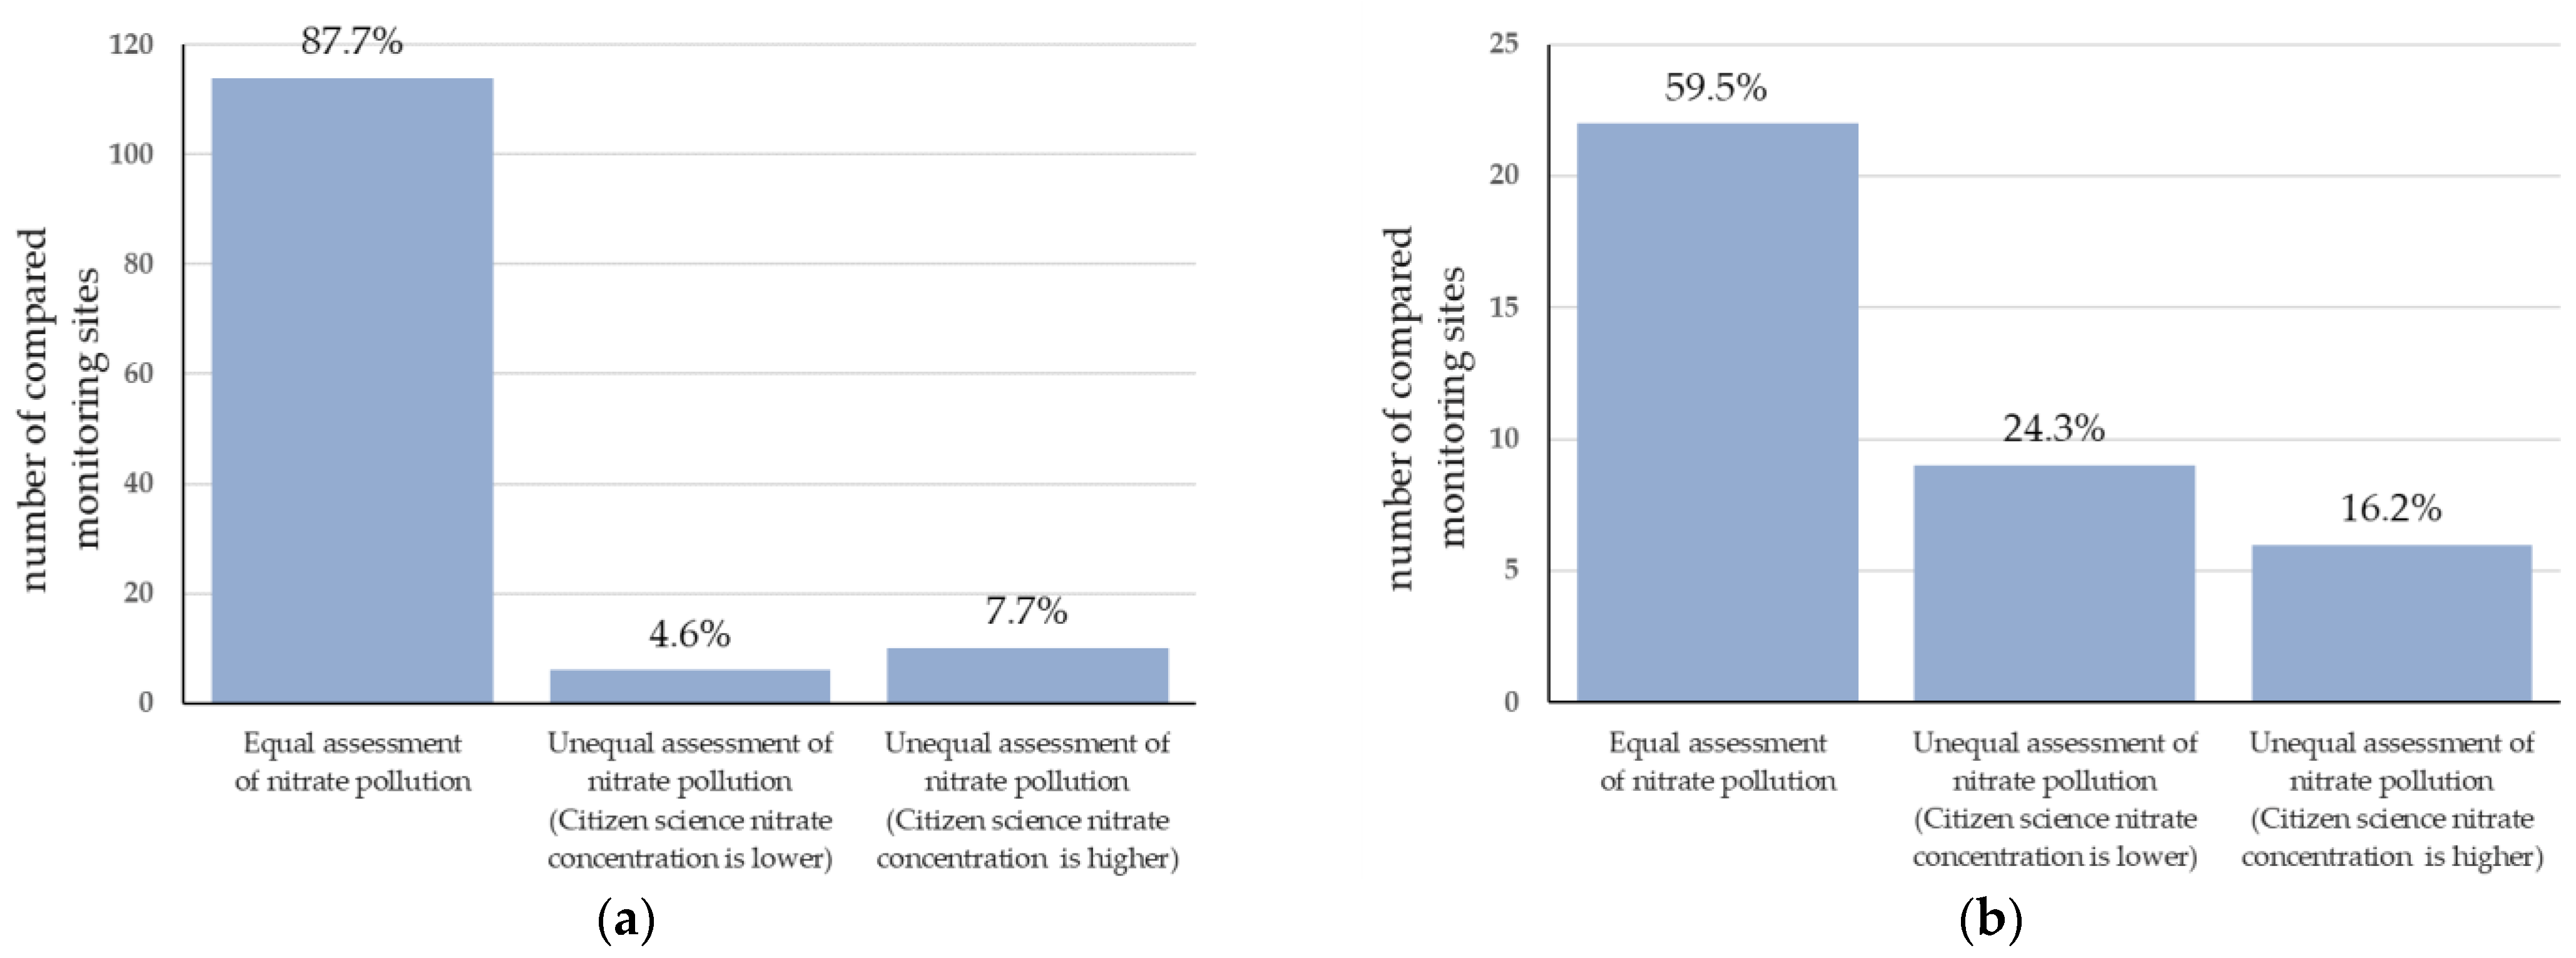
3.6. Consistency with Other Measurement Initiatives

Comparison with the VSR-Gewässerschutz (German non-profit environmental protection organization) data: Considering the uncertainty of the test strips detection (Table 3) and the resulting error margins, the comparison between the citizen science project and the VSR data show that the proportions of wells exceeding the chemical limit are comparable in the different districts (Figure 7) [59].
Comparison with the NLWKN data: As described, a nearest neighbor analysis was performed using the NLWKN and citizen science project monitoring sites. The comparison of the nitrate concentrations of the assigned monitoring sites results in 87.7% match for flowing water sites and 59.5% match for sampled wells (Figure 8).
The assigned monitoring sites with differing results were summarized into a total of 17 focus regions, so that causes for the discrepancies (for example, large distances between assigned monitoring sites, regional strongly fluctuating nitrate concentrations or possibly measuring mistakes) can be discussed with the NLWKN. The data from the citizen science project can, therefore, for example, indicate gaps in the NLWKN’s monitoring network. To exclude measuring errors, follow-up projects are planned in which water samples from the wells with results deviating from the NLWKN will be examined by photometric analysis.
In summary, except for the comparison of groundwater monitoring sites with the NLWKN data, the results are highly consistent with other monitoring initiatives, underlining the suitability of the citizen science approach to water protection research. Deviating results are not necessarily caused by measuring mistakes but result from the mentioned reasons and can thus supplement existing measuring networks.

4. Discussion

Based on these results, we evaluate the potential of citizen science to contribute to water protection research, including suitable measurement methods, the distribution of monitoring sites, the suitability of data for spatial and temporal analyses and the consistency with other monitoring initiatives.
As a result of the high level of commitment and participation of the citizens, it was possible to establish an area-wide monitoring network in the area of investigation for wells and flowing waters, which includes a large part of the included districts. However, because the density of monitoring sites was higher in areas with high population density, this monitoring network is not representative for the entire area. Due to a smaller number of monitoring sites for standing waters, rainwater, and spring water, it was also not possible to establish a representative monitoring network for these water body types. Nevertheless, the citizen science data provide an overview of the nitrate pollution in the region and can indicate sources and sinks of nitrate pollution, as shown. In further citizen science projects, it should be attempted to achieve a more representative monitoring network by promoting the project in less densely populated regions or by allocating predefined monitoring sites. If necessary, underrepresented areas could be monitored by additional sampling through scientists or students. Therefore, it remains to be tested in further projects whether representative monitoring networks can be established with the citizen science approach.
The semi-quantitative monitoring data from the citizen science project can be used to conduct spatial and temporal analyses. Seasonal variations, as well as the influence of hydrogeological conditions or land cover and land use, were observed and confirmed using statistical methods. The results were plausible and consistent with the hypotheses, which underlines the scientific potential of the citizen science approach. However, this citizen science approach also has limitations in terms of spatial analysis capabilities. For example, our citizen science approach cannot easily include further information about environmental parameters, such as basin and drainage areas of water bodies, and thus the influence of land use on groundwater contamination.
A comparison with other measurement initiatives confirms the data quality as it mostly shows a high degree of consistency. Discrepancies between results can mainly be attributed to different measuring conditions (e.g., filter depths), large distances between the monitoring sites assigned by the nearest neighbor analysis, or strong local nitrate fluctuations. Citizen science can, therefore, complement established monitoring networks, e.g., by providing information for the inclusion of additional monitoring sites. Furthermore, the citizen science approach is useful for acquiring an overview of nitrate pollution of areas that have not yet been covered by regular monitoring.
The consistency of the data with other measurement initiatives depends not only on spatial conditions, but also on the measurement methods. For citizen science projects, only simple and affordable on-site methods can be used. With test strips, only semi-quantitative data can be collected. By using a low-cost color sensor in combination with test strips in a 3D-printed measurement device, we expect to achieve more precise and yet simple, inexpensive measurements. It remains to be verified whether the measurement data will be consistent with the measurements of other measurement initiatives, even with better measurement accuracy.
In addition, the citizen science approach has the potential to contribute to water protection by sensitizing participants. The scientific gain and the potential sensitization legitimize the citizen science approach for further research projects. The effectiveness of our citizen science project on aspects of the participants’ environmental education will be examined separately. The possible ways of supporting learning will also be considered in our future research [22,60,61].

5. Conclusions

With the presented citizen science approach, it was possible to verify spatial and temporal influences on nitrate pollution of water bodies in northwestern Germany. Based on the results, we demonstrated that citizen science is an innovative approach that can contribute to monitoring and research of nitrate pollution of water bodies. Therefore, we endorse the recommendation of the WWQA (World Water Quality Alliance) to use the citizen science approach for water monitoring, especially for regions that are insufficiently or not monitored. The presented recommendations promise to increase the contribution to research by improving the accuracy of measurements and the distribution of monitoring sites. This will allow performing quantitative analyses and derive representative results.

Author Contributions

Conceptualization, M.B., V.P., F.B. and M.L.; methodology, F.B., J.K. and M.B.; validation, M.B.; formal analysis, F.B.; investigation, F.B. and all participants of the citizen science project; resources, F.B. and M.L.; data curation, F.B.; writing—original draft preparation, F.B.; writing—review and editing, F.B., M.L., J.K., V.P. and M.B.; visualization, F.B.; supervision, M.B., J.K. and V.P.; project administration, M.B. and V.P.; funding acquisition, M.B. and V.P. All authors have read and agreed to the published version of the manuscript.

Funding

This work was funded by ‘German Federal Environmental Foundation’, funding number: 34540.

Data Availability Statement

The data presented in this study are available on request from the corresponding author. The data are not completely publicly available due to data protection of the participating citizens (e.g., it could be inferred to plots of the participants). The data that can be published can be found in the online map: https://vm619.rz.uni-osnabrueck.de:1337/map.html, accessed on 23 March 2022. Due to data protection, exact measurement locations are only shown rounded.

Acknowledgments

We acknowledge the NLWKN for the access to their measurement data. Furthermore, we acknowledge support by Deutsche Forschungsgemeinschaft (DFG) and Open Access Publishing Fund of Osnabrück University.

Conflicts of Interest

The authors declare no conflict of interest. The funders had no role in the design of the study; in the collection, analyses, or interpretation of data; in the writing of the manuscript, or in the decision to publish the results.

References

  1. Kishorekumar, R.; Bulle, M.; Wany, A.; Gupta, K.J. An Overview of Important Enzymes Involved in Nitrogen Assimilation of Plants. Methods Mol. Biol. 2020, 2057, 1–13. [Google Scholar] [CrossRef]
  2. Transforming Our World: The 2030 Agenda for Sustainable Development: A/RES/70/1. 2015. Available online: https://www.un.org/ga/search/view_doc.asp?symbol=A/RES/70/1&Lang=E (accessed on 27 July 2022).
  3. de Vries, W.; Kros, J.; Kroeze, C.; Seitzinger, S.P. Assessing planetary and regional nitrogen boundaries related to food security and adverse environmental impacts. Curr. Opin. Environ. Sustain. 2013, 5, 392–402. [Google Scholar] [CrossRef]
  4. Bodirsky, B.L.; Popp, A.; Lotze-Campen, H.; Dietrich, J.P.; Rolinski, S.; Weindl, I.; Schmitz, C.; Müller, C.; Bonsch, M.; Humpenöder, F.; et al. Reactive nitrogen requirements to feed the world in 2050 and potential to mitigate nitrogen pollution. Nat. Commun. 2014, 5, 3858. [Google Scholar] [CrossRef] [Green Version]
  5. Chang, J.; Havlík, P.; Leclère, D.; de Vries, W.; Valin, H.; Deppermann, A.; Hasegawa, T.; Obersteiner, M. Reconciling regional nitrogen boundaries with global food security. Nat. Food 2021, 2, 700–711. [Google Scholar] [CrossRef]
  6. Steffen, W.; Richardson, K.; Rockström, J.; Cornell, S.E.; Fetzer, I.; Bennett, E.M.; Biggs, R.; Carpenter, S.R.; de Vries, W.; de Wit, C.A.; et al. Planetary boundaries: Guiding human development on a changing planet. Science 2015, 347, 1259855. [Google Scholar] [CrossRef] [PubMed] [Green Version]
  7. Erisman, J.W.; Galloway, J.N.; Seitzinger, S.; Bleeker, A.; Dise, N.B.; Petrescu, A.M.R.; Leach, A.M.; de Vries, W. Consequences of human modification of the global nitrogen cycle. Philos. Trans. R. Soc. Lond. B Biol. Sci. 2013, 368, 20130116. [Google Scholar] [CrossRef] [Green Version]
  8. Folkens, L.; Wiedemer, V.; Schneider, P. Monetary Valuation and Internalization of Externalities in German Agriculture Using the Example of Nitrate Pollution: A Case-Study. Sustainability 2020, 12, 6681. [Google Scholar] [CrossRef]
  9. Jacobs, I.; Grimm, F.; Keppner, L.; Hilliges, F. Nitratbericht 2020 (Engl. Trans.: Nitrate Report 2020); Federal Ministry of Food Agriculture (BMEL), Federal Ministry for the Environment, Nature Conservation and Nuclear Safety (BMUV): Bonn, Germany, 2020. [Google Scholar]
  10. World Water Quality Alliance (WWQA). Assessing Groundwater Quality: A Global Perspective: Importance, Methods and Potential Data Sources; World Water Quality Alliance (WWQA): Nairobi, Kenya, 2021. [Google Scholar]
  11. Haklay, M. Citizen Science and Volunteered Geographic Information: Overview and Typology of Participation. In Crowdsourcing Geographic Knowledge; Sui, D., Elwood, S., Goodchild, M., Eds.; Springer: Dordrecht, The Netherlands, 2013; pp. 105–122. [Google Scholar]
  12. Shirk, J.L.; Ballard, H.L.; Wilderman, C.C.; Phillips, T.; Wiggins, A.; Jordan, R.; McCallie, E.; Minarchek, M.; Lewenstein, B.V.; Krasny, M.E.; et al. Public Participation in Scientific Research: A Framework for Deliberate Design. E&S 2012, 17, 29. [Google Scholar] [CrossRef] [Green Version]
  13. Turrini, T.; Dörler, D.; Richter, A.; Heigl, F.; Bonn, A. The threefold potential of environmental citizen science—Generating knowledge, creating learning opportunities and enabling civic participation. Biol. Conserv. 2018, 225, 176–186. [Google Scholar] [CrossRef]
  14. Fritz, S.; See, L.; Carlson, T.; Haklay, M.; Oliver, J.L.; Fraisl, D.; Mondardini, R.; Brocklehurst, M.; Shanley, L.A.; Schade, S.; et al. Citizen science and the United Nations Sustainable Development Goals. Nat. Sustain. 2019, 2, 922–930. [Google Scholar] [CrossRef]
  15. Liu, H.Y.; Kobernus, M. Citizen Science and Its Role in Sustainable Development: Status, Trends, Issues, and Opportunities. In Analyzing the Role of Citizen Science in Modern Research; Ceccaroni, L., Piera, J., Eds.; IGI Global: Hershey, PA, USA, 2017; pp. 147–167. [Google Scholar]
  16. Rigler, G.; Dokou, Z.; Khadim, F.K.; Sinshaw, B.G.; Eshete, D.G.; Aseres, M.; Amera, W.; Zhou, W.; Wang, X.; Moges, M.; et al. Citizen Science and the Sustainable Development Goals: Building Social and Technical Capacity through Data Collection in the Upper Blue Nile Basin, Ethiopia. Sustainability 2022, 14, 3647. [Google Scholar] [CrossRef]
  17. Fraisl, D.; Campbell, J.; See, L.; Wehn, U.; Wardlaw, J.; Gold, M.; Moorthy, I.; Arias, R.; Piera, J.; Oliver, J.L.; et al. Mapping citizen science contributions to the UN sustainable development goals. Sustain. Sci. 2020, 15, 1735–1751. [Google Scholar] [CrossRef]
  18. Brockhage, F.; Lüsse, M.; Pietzner, V.; Beeken, M. Citizen Science & Schule: Wie Schülerprojekte die Forschung zu Themen der Nachhaltigkeit vorantreiben können (Engl. Trans.: Science & School: How school projects can promote research on sustainability). NiU-Chem. 2021, 32, 8–15. [Google Scholar]
  19. Jankowski, A.; Karfusehr, C.; te Gempt, R.; Heinbockel, E.; Federolf, C.; Klöver, T.; Hoff, S.; de Vries, D. Grundwasser Band 18 Gewässerüberwachungssystem Niedersachsen (GÜN): Güte- und Standsmessnetz Grundwasser (Engl. Trans.: Groundwater Volume 18 Water Monitoring System Lower Saxony (GÜN): Groundwater Quality and Level Monitoring Network); Lower Saxony Water Management, Coastal Protection and Nature Conservation Agency (NLWKN): Norden, Germany, 2014. [Google Scholar]
  20. Abée, E.; Altenhofen, D.; Dinnbier, U.; Neumann, P.; Pinz, K.; Steffen, D. Oberirdische Gewässer Band 31 Gewässerüberwachungssystem Niedersachsen (GÜN): Gütemessnetz Fließgewässer und stehende Gewässer 2017 (Engl. Trans.: Surface Waters Volume 31 Water Monitoring System Lower Saxony (GÜN): Quality Measurement Network for Flowing Waters and Standing Waters 2017); Lower Saxony Water Management, Coastal Protection and Nature Conservation Agency (NLWKN): Norden, Germany, 2017. [Google Scholar]
  21. Arle, J.; Blondzik, K.; Claussen, U.; Duffek, A.; Grimm, S.; Hilliges, F.; Kirschbaum, B.; Kirst, I.; Koch, D.; Koschorreck, J.; et al. Gewässer in Deutschland: Zustand und Bewertung (Engl. Trans.: Water Bodies in Germany: Status and Evaluation); Federal Environment Agency (UBA): Dessau-Roßlau, Germany, 2017. [Google Scholar]
  22. Lüsse, M.; Brockhage, F.; Beeken, M.; Pietzner, V. Citizen science and its potential for science education. Int. J. Sci. Educ. 2022, 44, 1120–1142. [Google Scholar] [CrossRef]
  23. Brockhage, F.; Lüsse, M.; Pietzner, V.; Beeken, M. Partizipative Forschung zur Nitratbelastung: Mit Citizen Science die Nitratbelastung von Gewässern Erforschen (Themenheft 1) (Engl. Trans.: Participatory Research on Nitrate Pollution: Using Citizen Science to Investigate Nitrate Pollution of Water Bodies (Issue 1)); University of Osnabrück: Osnabrück, Germany, 2022. [Google Scholar] [CrossRef]
  24. Brockhage, F.; Lüsse, M.; Pietzner, V.; Beeken, M. Partizipative Forschung zur Nitratbelastung: Die Stickstoffproblematik (Themenheft 2) (Engl. Trans.: Participatory Research on Nitrate Pollution: The Nitrogen Problem (Issue 2)); University of Osnabrück: Osnabrück, Germany, 2022. [Google Scholar] [CrossRef]
  25. Brockhage, F.; Lüsse, M.; Pietzner, V.; Beeken, M. Partizipative Forschung zur Nitratbelastung: Ergebnisse des Nitrat-Monitorings (Themenheft 3) (Engl. Trans.: Participatory Research on Nitrate Pollution: Results of the nitrate monitoring (Issue 3)); University of Osnabrück: Osnabrück, Germany, 2022. [Google Scholar] [CrossRef]
  26. Bach, M.; Häußermann, U.; Klement, L.; Knoll, L.; Breuer, L. Reactive Nitrogen Flows in Germany 2010-2014 (DESTINO Report 2); Federal Environment Agency (UBA): Dessau-Roßlau, Germany, 2020. [Google Scholar]
  27. Gudat, S.; Melzer, O.; Schmid, R.; Brunotte, N. Oberirdische Gewässer Band 44 Gewässerüberwachungssystem Niedersachsen (GÜN) Nährstoffsituation der Binnengewässer in Niedersachsen (Engl. Trans.: Surface Waters Volume 44 Water Monitoring System Lower Saxony (GÜN) Nutrient Situation of Inland Waters in Lower Saxony); Lower Saxony Water Management, Coastal Protection and Nature Conservation Agency (NLWKN): Norden, Germany, 2020. [Google Scholar]
  28. Ackermann, A.; Heidecke, C.; Hirt, U.; Kreins, P.; Kuhr, P.; Kunkel, R.; Mahnkopf, J.; Schott, M.; Tetzlaff, B.; Venohr, M.; et al. Der Modellverbund AGRUM als Instrument zum Landesweiten Nährstoffmanagement in Niedersachsen (Engl. Trans.: The AGRUM Model Network as an Instrument for State-Wide Nutrient Management in Lower Saxony); Johann Heinrich von Thünen-Institut: Braunschweig, Germany, 2015. [Google Scholar]
  29. Cremer, N. Nitrat im Grundwasser—Eintrag, Verhalten und Entwicklungstrends (Engl. Trans.: Nitrate in groundwater—input, reaction and trends). Energ. Wasser-Prax. 2015, 9, 119–130. [Google Scholar]
  30. Mester, T.; Balla, D.; Karancsi, G.; Bessenyei, É.; Szabó, G. Effects of nitrogen loading from domestic wastewater on groundwater quality. WSA 2019, 45, 1816–7950. [Google Scholar] [CrossRef] [Green Version]
  31. Schaap, M.; Hendriks, C.; Kranenburg, R.; Kuenen, J.; Segers, A.; Schlutow, A.; Nagel, H.-D.; Ritter, A.; Banzhaf, S. PINETI-3: Modellierung Atmosphärischer Stoffeinträge von 2000 bis 2015 zur Bewertung der Ökosystem-Spezifischen Gefährdung von Biodiversität Durch Luftschadstoffe in Deutschland (Engl. Trans.: PINETI-3: Modelling af Atmospheric Depositions from 2000 to 2015 for the Assessment of the Ecosystem-Specific Threats to Biodiversity from Air Pollutants in Germany); Federal Environment Agency (UBA): Dessau-Roßlau, Germany, 2018. [Google Scholar]
  32. Kessinger, S.; Minkos, A.; Dauert, U.; Feigenspan, S. Luftqualität 2020: Vorläufige Auswertung (Engl. Trans.: Air quality 2020: Preliminary analysis); Federal Environment Agency: Dessau-Roßlau, Germany, 2021. [Google Scholar]
  33. Soares, M.I.M. Biological Denitrification of Groundwater. Water Air Soil Pollut. 2000, 123, 183–193. [Google Scholar] [CrossRef]
  34. Wriedt, G.; de Vries, D.; Eden, T.; Federolf, C. Regionalisierte Darstellung der Nitratbelastung im Grundwasser Niedersachsens (Engl. Trans.: Regionalized presentation of nitrate pollution in the groundwater of Lower Saxony). Grundwasser 2019, 24, 27–41. [Google Scholar] [CrossRef]
  35. Johannsen, A.; Dähnke, K.; Emeis, K. Isotopic composition of nitrate in five German rivers discharging into the North Sea. Org. Geochem. 2008, 39, 1678–1689. [Google Scholar] [CrossRef]
  36. Huisinga, W. Oberirdische Gewässer Band 28 Gütedaten Ostfriesischer Oberflächengewässer (Engl. Trans.: Surface Waters Volume 28 Quality Data of East Frisian Surface Waters); Lower Saxony Water Management, Coastal Protection and Nature Conservation Agency (NLWKN): Norden, Germany, 2007. [Google Scholar]
  37. Renger, M. Sicker- und Fließzeiten von Nitrat aus dem Wurzelraum ins Grundwasser in Abhängigkeit von den Standortbedingungen, Insbesondere Boden und Gestein (Engl. Trans.: Leaching and Flow Times of Nitrate from the Root Zone into the Groundwater Depending on Site Conditions, Especially Soil and Rock); Akad. für Technikfolgenabschätzung in Baden-Württemberg: Stuttgart, Germany, 2002. [Google Scholar]
  38. Nakagawa, K.; Amano, H.; Persson, M.; Berndtsson, R. Spatiotemporal variation of nitrate concentrations in soil and groundwater of an intensely polluted agricultural area. Sci. Rep. 2021, 11, 2598. [Google Scholar] [CrossRef]
  39. Bechtel, A. Abschätzung regionaler Nitrateinträge in das Grundwasser unter Verwendung von Nmin-Daten (Engl. Trans.: Estimating Regional Nitrate Inputs to Groundwater Using Nmin Data.). Ph.D. Thesis, University Fridericiana zu Karlsruhe, Karlsruhe, Germany, 2008. [Google Scholar]
  40. Lower Saxony Chamber of Agriculture. Nährstoffbericht für Niedersachsen 2020/2021 (Engl. Trans.: Nutrient Report for Lower Saxony 2020/2021); Lower Saxony Chamber of Agriculture: Oldenburg, Germany, 2022. [Google Scholar]
  41. Kayser, A. Grundwasser Band 45 Grundwasserbericht Niedersachsen: Kurzbericht 2020 (Engl. Trans.: Groundwater Volume 45 Groundwater Report Lower Saxony: Summary Report 2020; Lower Saxony Water Management, Coastal Protection and Nature Conservation Agency (NLWKN): Norden, Germany, 2020. [Google Scholar]
  42. Elbracht, J.; Meyer, E.; Reutter, E. GeoBerichte 3: Hydrogeologische Räume und Teilräume in Niedersachsen (Engl. Trans.: GeoReports 3: Hydrogeological Areas and Subareas in Lower Saxony); State Office for Mining, Energy and Geology (LBEG): Hannover, Germany, 2010. [Google Scholar]
  43. Federal Agency for Cartography and Geodesy (BKG). CORINE Land Cover 5 ha, Stand 2018 (CLC5-2018): Clc5-2018-001; Federal Agency for Cartography and Geodesy (BKG): Frankfurt, Germany, 2018; Available online: https://gdz.bkg.bund.de/index.php/default/corine-land-cover-5-ha-stand-2018-clc5-2018.html (accessed on 15 October 2021).
  44. Wissenschaft im Dialog gGmbH/Kantar Emnid. Wissenschaftsbaromter 2019 (Engl. Trans.: Science Barometer 2019); Wissenschaft im Dialog gGmbH/Kantar Emnid: Berlin, Germany, 2019; Available online: https://www.wissenschaft-im-dialog.de/fileadmin/user_upload/Projekte/Wissenschaftsbarometer/Dokumente_19/Broschuere_Wissenschaftsbarometer2019.pdf (accessed on 5 May 2022).
  45. Rolf, A.K. Analyse der Messgenauigkeit handelsüblicher Nitrat-Teststäbchen unter Berücksichtigung Verschiedener Einflussfaktoren (Engl. Trans.: Analysis of the Measurement Accuracy of Commercially Available Nitrate Test Strips, Considering Various Influencing Factors). Master’s Thesis, University of Osnabrück, Osnabrück, Germany, 2021. [Google Scholar]
  46. Verordnung zum Schutz des Grundwassers (Grundwasserverordnung) (Engl. Trans.: Groundwater ordinance): GrwV. 2010. Available online: https://www.gesetze-im-internet.de/grwv_2010/GrwV.pdf (accessed on 5 May 2022).
  47. Beurteilung der Wasserbeschaffenheit von Fließgewässern in der Bundesrepublik Deutschland—Chemische Gewässergüteklassifikation (Engl. Trans.: Assessment of the Water Quality of Flowing Waters in the Federal Republic of Germany—Chemical Water Quality Classification); Working Group on Water Issues of the Federal States and the Federal Government (LAWA), Kulturbuchverlag: Berlin, Germany, 1998.
  48. Leitfaden für die Auswahl von geeigneten Grundwassermessstellen für die niedersächsischen Grundwasserkörper im Rahmen des Grundwassermonitorings gemäß EG-WRRL (Engl. Trans.: Guideline for the Selection of Suitable Groundwater Monitoring Sites for the Groundwater Bodies in Lower Saxony within the Framework of Groundwater Monitoring according to EG-WRRL); Lower Saxony Water Management, Coastal Protection and Nature Conservation Agency (NLWKN); State Office for Mining, Energy and Geology (LBEG), 2006; Available online: https://www.nlwkn.niedersachsen.de/download/149483 (accessed on 5 May 2022).
  49. Gewaessernetz (Engl. Trans.: Hydrography). Excerpt from the Basic Geodata of the Lower Saxony Surveying and Cadastral Administration. Processed by the Lower Saxony Ministry for the Environment, Energy, Construction and Climate Protection; Lower Saxony Surveying and Cadastral Administration. 2020. Available online: http://www.lgn.niedersachsen.de (accessed on 15 October 2021).
  50. Verwaltungsgebiete 1: 1 000 000 VG1000 und VG1000-EW 2020 (Engl. Trans.: Administrative regions 1: 1 000 000 VG1000 and VG1000-EW 2020); Federal Agency for Cartography and Geodesy (BKG): Frankfurt, Germany, 2020.
  51. OpenStreetMap. 2021. Available online: https://www.openstreetmap.org (accessed on 15 October 2021).
  52. Verordnung zum Schutz der Oberflächengewässer (Oberflächengewässerverordnung) (Engl. Trans.: Surface Water Ordinance): OGewV. 2016. Available online: https://www.gesetze-im-internet.de/ogewv_2016/OGewV.pdf (accessed on 5 May 2022).
  53. Mann, H.B.; Whitney, D.R. On a Test of Whether one of Two Random Variables is Stochastically Larger than the Other. Ann. Math. Statist. 1947, 18, 50–60. [Google Scholar] [CrossRef]
  54. Wilcoxon, F. Individual Comparisons by Ranking Methods. Biom. Bull. 1945, 1, 80. [Google Scholar] [CrossRef]
  55. Hydrogeologische Raumgliederung von Deutschland (HYRAUM) (Engl. Trans.: Hydrogeological Spatial Structure of Germany (HYRAUM)): Digitale Kartendaten v3.2. HYRAUM v32; Federal Institute for Geosciences and Natural Resources (BGR); State Geological Surveys of the Federal Republic of Germany (SGD): Hannover, Germany, 2015.
  56. Kruskal, W.H.; Wallis, W.A. Use of Ranks in One-Criterion Variance Analysis. J. Am. Stat. Assoc. 1952, 47, 583. [Google Scholar] [CrossRef]
  57. Dunn, O.J. Multiple Comparisons Using Rank Sums. Technometrics 1964, 6, 241–252. [Google Scholar] [CrossRef]
  58. Friedman, M. The Use of Ranks to Avoid the Assumption of Normality Implicit in the Analysis of Variance. J. Am. Stat. Assoc. 1937, 32, 675–701. [Google Scholar] [CrossRef]
  59. Interaktive Nitratkarte—Überblick über die Belastung in den Kreisen (Engl. Trans.: Interactive Nitrate Map—Overview of the Load in the Districts). Available online: https://www.xn--vsr-gewsserschutz-wqb.de/nitratbelastung/belastetes-grundwasser/ni/ (accessed on 7 November 2021).
  60. Brockhage, F.; Beeken, M. Citizen Science & Schule—Wirkungen eines Forschungsprojektes zum Thema Gewässerschutz (Engl. Trans.: Citizen Science & School—Impacts of a Research Project on Water Protection). In Unsicherheit als Element von Naturwissenschaftsbezogenen Bildungsprozessen (Engl. Trans.: Uncertainty as an Element of Science-Related Educational Processes); Habig, S., van Vorst, H., Eds.; Gesellschaft für Didaktik der Chemie und Physik, 2022; pp. 524–527. Available online: https://gdcp-ev.de/wp-content/uploads/2022/05/Tagungsband-2022-Stand-13522.pdf (accessed on 30 June 2022).
  61. Lüsse, M.; Pietzner, V. Wirkung eines Heimexperimentiersets im Rahmen eines chemischen Citizen-Science-Projektes (Engl. Trans.: Effect of a home experiment set as part of a chemical citizen science project). In Unsicherheit als Element von Naturwissenschaftsbezogenen Bildungsprozessen (Engl. Trans.: Uncertainty as an Element of Science-Related Educational Processes); Habig, S., van Vorst, H., Eds.; Gesellschaft für Didaktik der Chemie und Physik, 2022; pp. 240–243. Available online: https://gdcp-ev.de/wp-content/uploads/2022/05/Tagungsband-2022-Stand-13522.pdf (accessed on 30 June 2022).
Figure 1. Structure of the citizen science project ‘Students and citizens conduct research together with scientists on the nitrogen pollution of local waters’ [22].
Sustainability 14 09516 g001
Figure 2. Area of investigation and monitoring sites of the nitrate monitoring. (own illustration using [49,50,51]).
Sustainability 14 09516 g002
Figure 3. Heatmap of well water monitoring sites. (radius: 8.92 km, kernel shape: bi-quadratic). (own illustration using [50,51]).
Sustainability 14 09516 g003
Figure 4. Measurement accuracy of test strips. (own illustration with data from [45]).
Sustainability 14 09516 g004
Figure 5. Assessment of the nitrate pollution of monitoring sites in groundwater and surface waters: (a) flowing waters; (b) standing waters; (c) rainwater; (d) well water; (e) spring water.
Sustainability 14 09516 g005
Figure 6. Seasonal fluctuations of: (a) flowing waters; (b) standing waters; (c) well water.
Sustainability 14 09516 g006
Figure 7. Comparison of the citizen science results with the VSR (German non-profit environmental protection organization) results. (own illustration with data from [59]).
Sustainability 14 09516 g007
Figure 8. Results of the nearest-neighbor analysis with data from NLWKN (Lower Saxony Water Management, Coastal Defence and Nature Conservation Agency) of: (a) flowing waters monitoring sites; (b) well water monitoring sites. (own illustration with data from the NLWKN).
Sustainability 14 09516 g008
Table 1. Total number of monitoring sites and their proportions in the spatially assigned classes.
Water Body TypeTotal Number of Monitoring SitesArtificial Surfaces 1Agricultural Areas 1Forests and Semi-natural Areas 1Sorted out for Spatial Analyses
flowing watersn = 180n = 63n = 58n = 9n = 50
Total Number of Monitoring SitesUrban Fabric 2Industrial, Commercial and Transportation Units 2Other Land Cover Classes 2Sorted out for Spatial Analyses
rainwatern = 34n = 21n = 5n = 8n = 0
Total Number of Monitoring SitesGeest 3Lowland 3Upland 3Sorted out for Spatial Analyses
well watern = 243n = 87n = 97n = 58n = 1
1 Corine classes level 1 [43] 2 Corine classes level 2 [43] 3 hydrogeological conditions [55].
Table 2. Total number of monitoring sites and number of sites sampled in the seasons.
Water Body TypeTotal Number of Monitoring SitesSites Sampled at Least Once in
Autumn 2019Winter 2019/2020Spring 2020Summer 2020Autumn 2020Winter 2020/2021Each Season
flowing watersn = 180n = 165n = 142n = 125n = 115n = 107n = 95n = 83
standing watersn = 73n = 52n = 46n = 30n = 21n = 22n = 18n = 13
well watern = 243n = 226n = 151n = 152n = 126n = 99n = 78n = 65
Table 3. Categorization of surface waters and groundwater measurements according to chemical limits and ecological target values for nitrate [46,47].
CategoryNitrate Concentration
Measured with Test Trips
Classification for Flowing Waters, Standing Waters and RainwaterClassification for Well and Spring Water
10 mg/L; 0 to 10 mg/L; 10 mg/LLow to moderate concentration
(less than 11.1 mg/L 1,2)
Low concentration
(less than 10 mg/L 1)
210 to 25 mg/L; 25 mg/LModerate to increased concentrationLow to medium concentration
325 to 50 mg/L; 50 mg/LIncreased concentration
(11.1 to 44.3 mg/L 1,2)
Medium concentration
(10 to 50 mg/L 1,3)
450 to 100 mg/L; 100 mg/LIncreased to very high concentrationMedium to high concentration
5100 to 250 mg/L; 250 mg/L; 250 to 500 mg/L; 500 mg/LVery high concentration
(more than 44.3 mg/L 1,2)
Hight concentration
(more than 50 mg/L 1,3)
1 With regard to the actual nitrate concentration (Figure 3). 2 11.1 mg/L nitrate = ecological target value for nitrate in surface waters [47]. 3 50 mg/L nitrate = chemical limit value for drinking water and groundwater [46].
Publisher’s Note: MDPI stays neutral with regard to jurisdictional claims in published maps and institutional affiliations.

