
Aging Population Spatial Distribution Discrepancy and Impacting Factor


Abstract
:1. Introduction
2. Materials and Methods
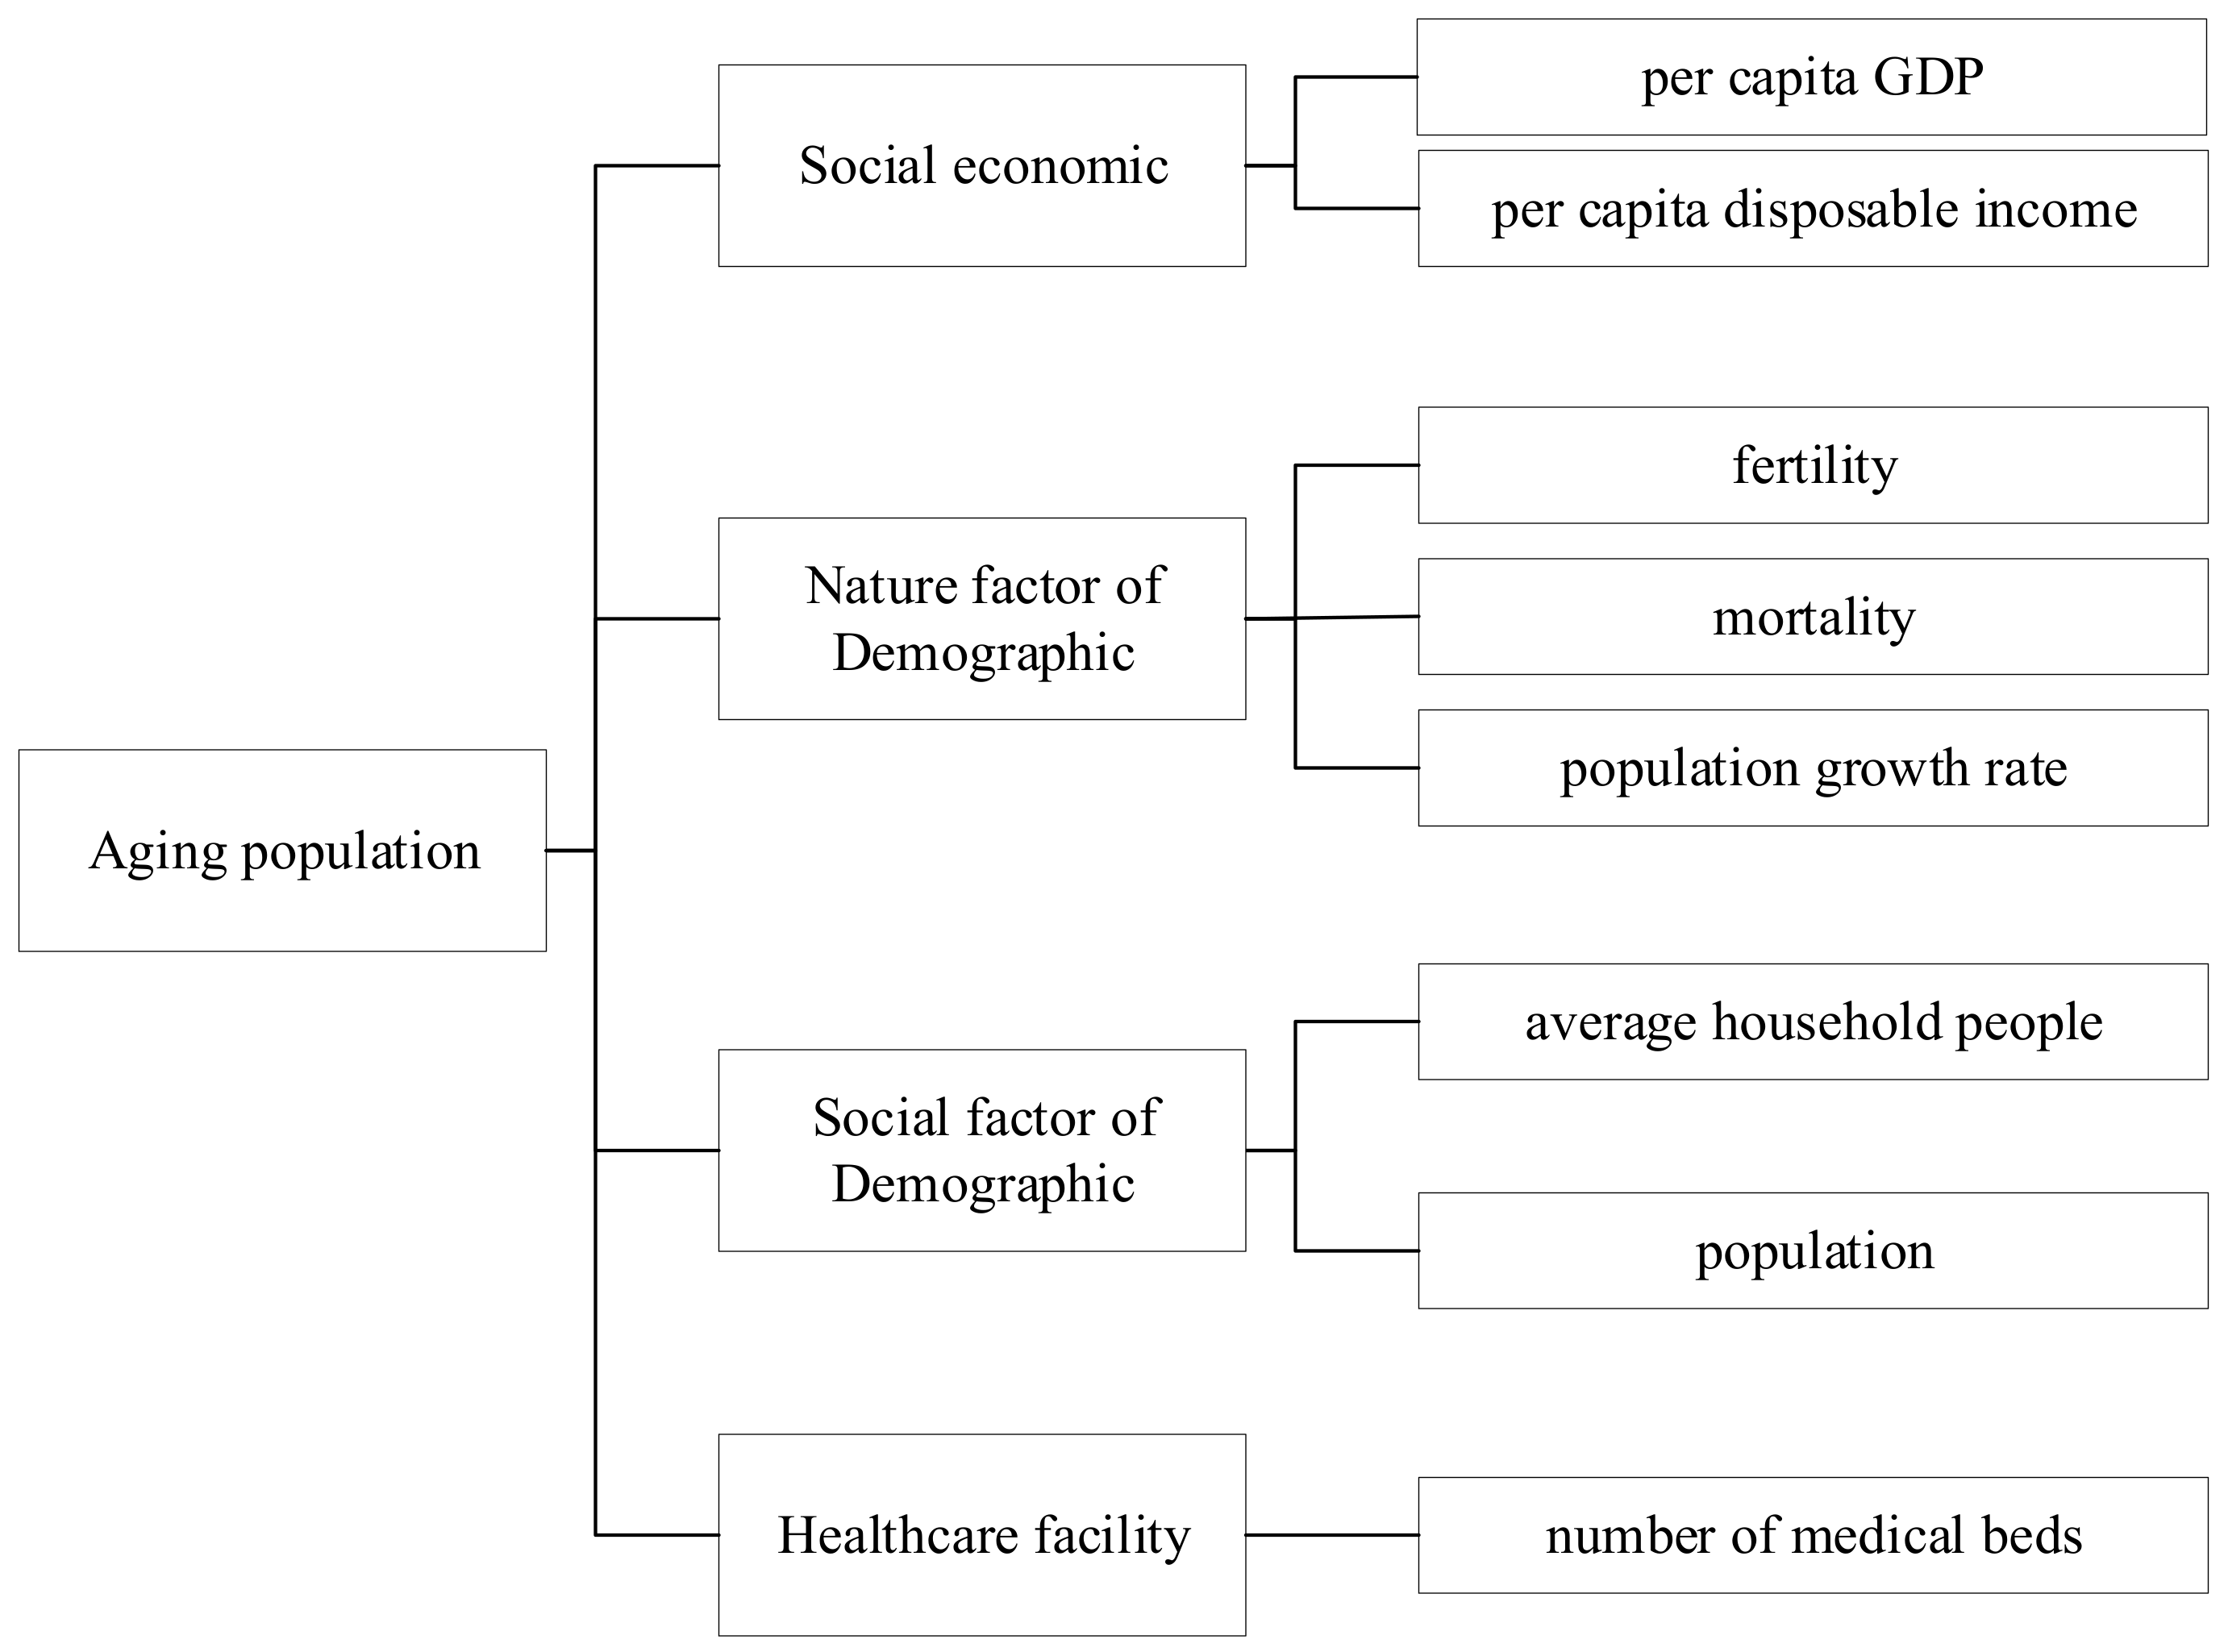
2.1. Impact Factor Literature Review
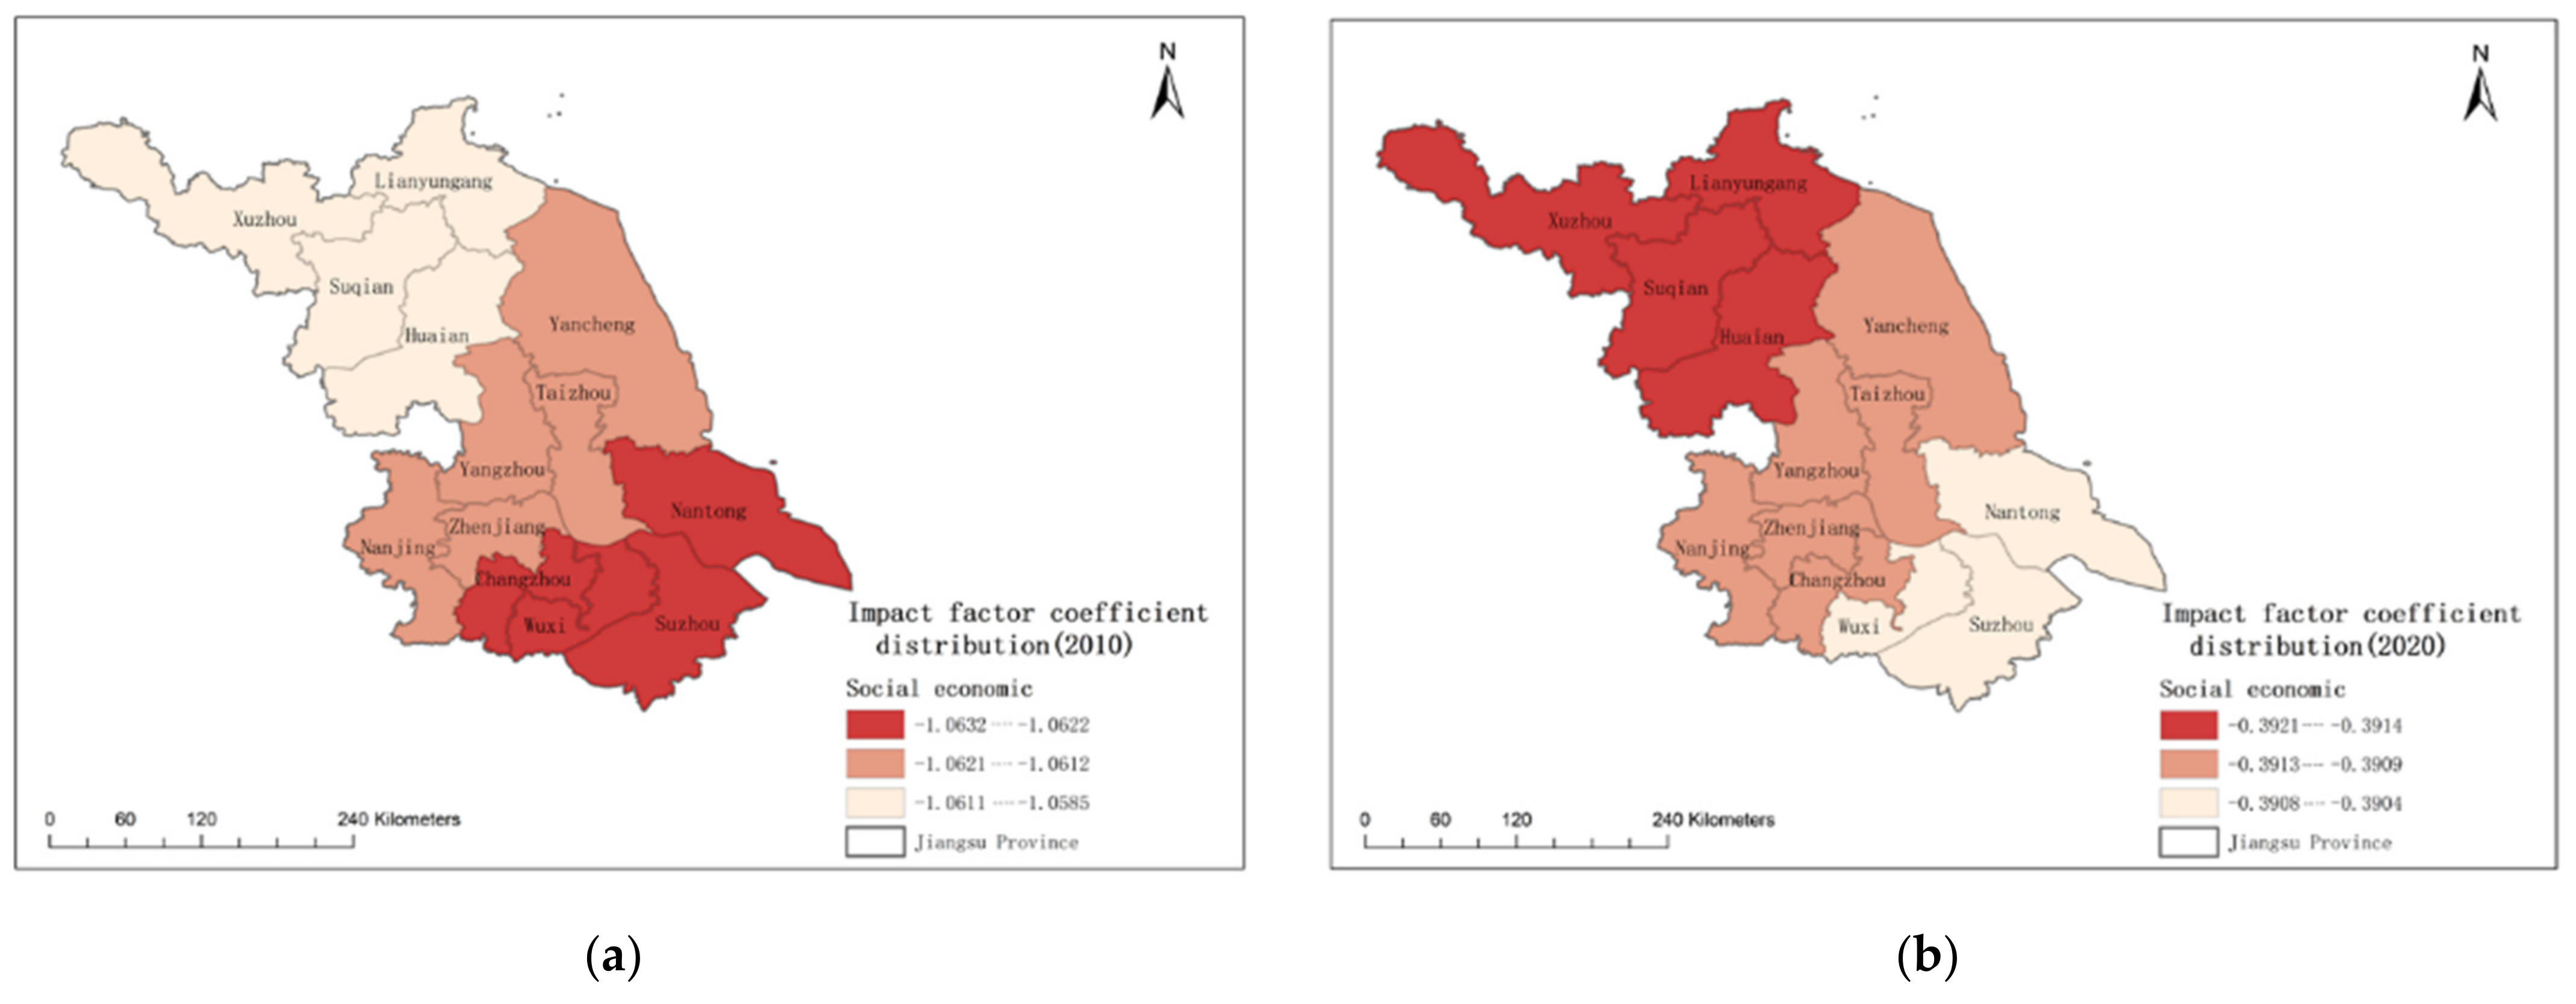
- Social economics
- 2.
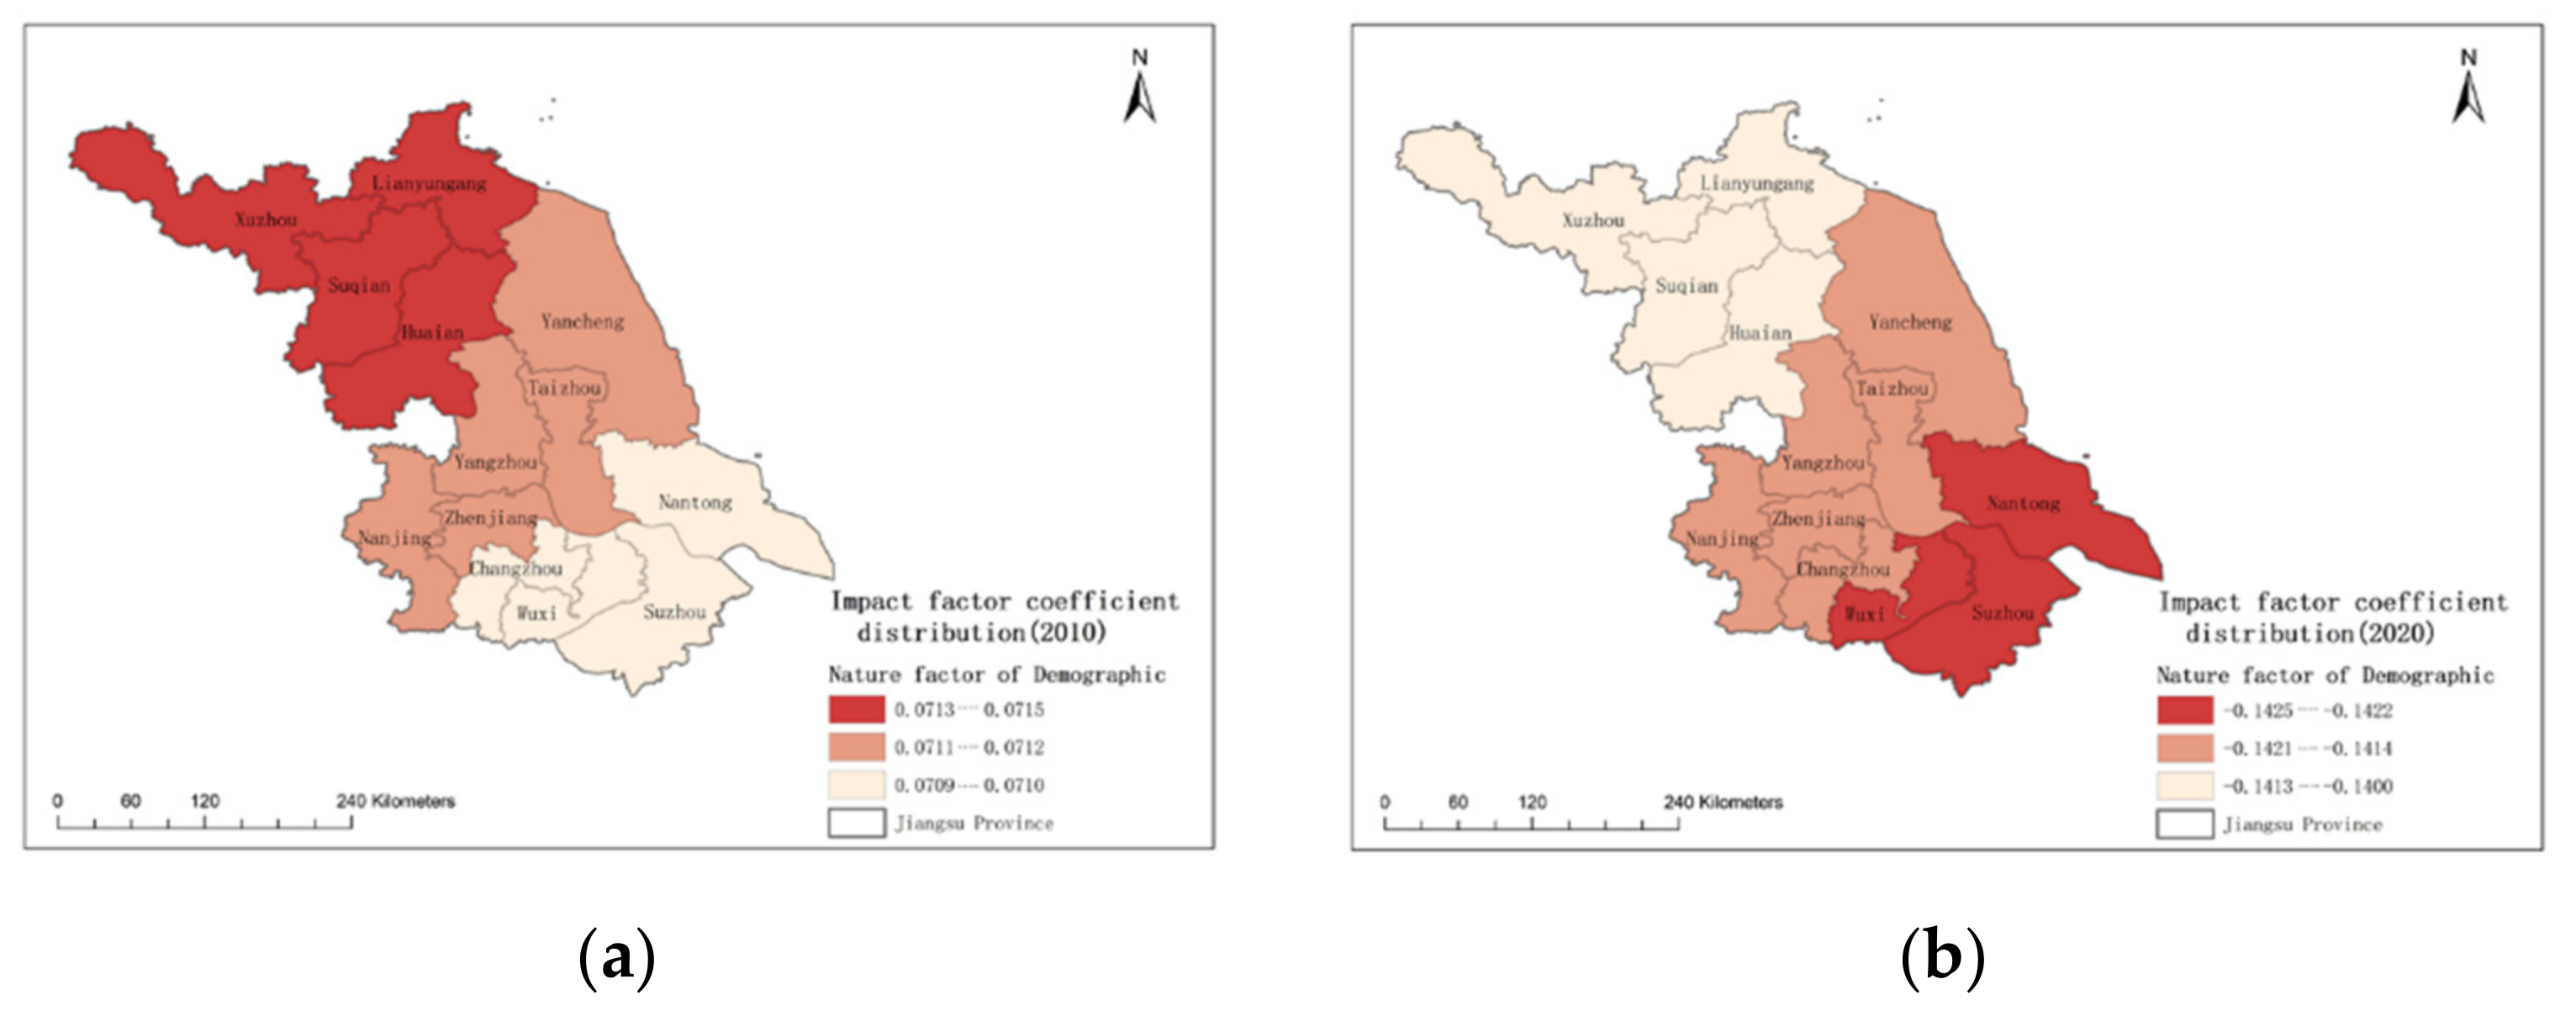
- Demographic
- (1)
- Nature factor of the DemographicDemographic characteristics directly represent the aging population situation, while fertility and mortality are bilateral attributes that affect the demographic structure. In recent years, the total fertility rates in some industrialized countries have reached historic lows [18]. Low fertility rates increase the pace and scale of population aging, negatively affecting the sustainability of the economy and public services. Fertility beginning to reduce will also lead to a decline in the population growth rate (but it will remain positive). That will lead to a decline in the total dependency ratio, due to the working-age population growing faster than the population as a whole.Age and socio-economic characteristics of the population are also more closely related to mortality than regional characteristics [19]. Mortality is associated with an aging population that will increase deaths in high-upper-middle- and lower-middle-income countries, except in low-income countries. The proportion of deaths attributed to the aging population is from −43.9% to 117.4% in 195 countries/territories [20]. This represents a significant correlation between mortality and the aging population. The population growth rate also directly reflects the chosen local demographic status and vitality development.
- (2)
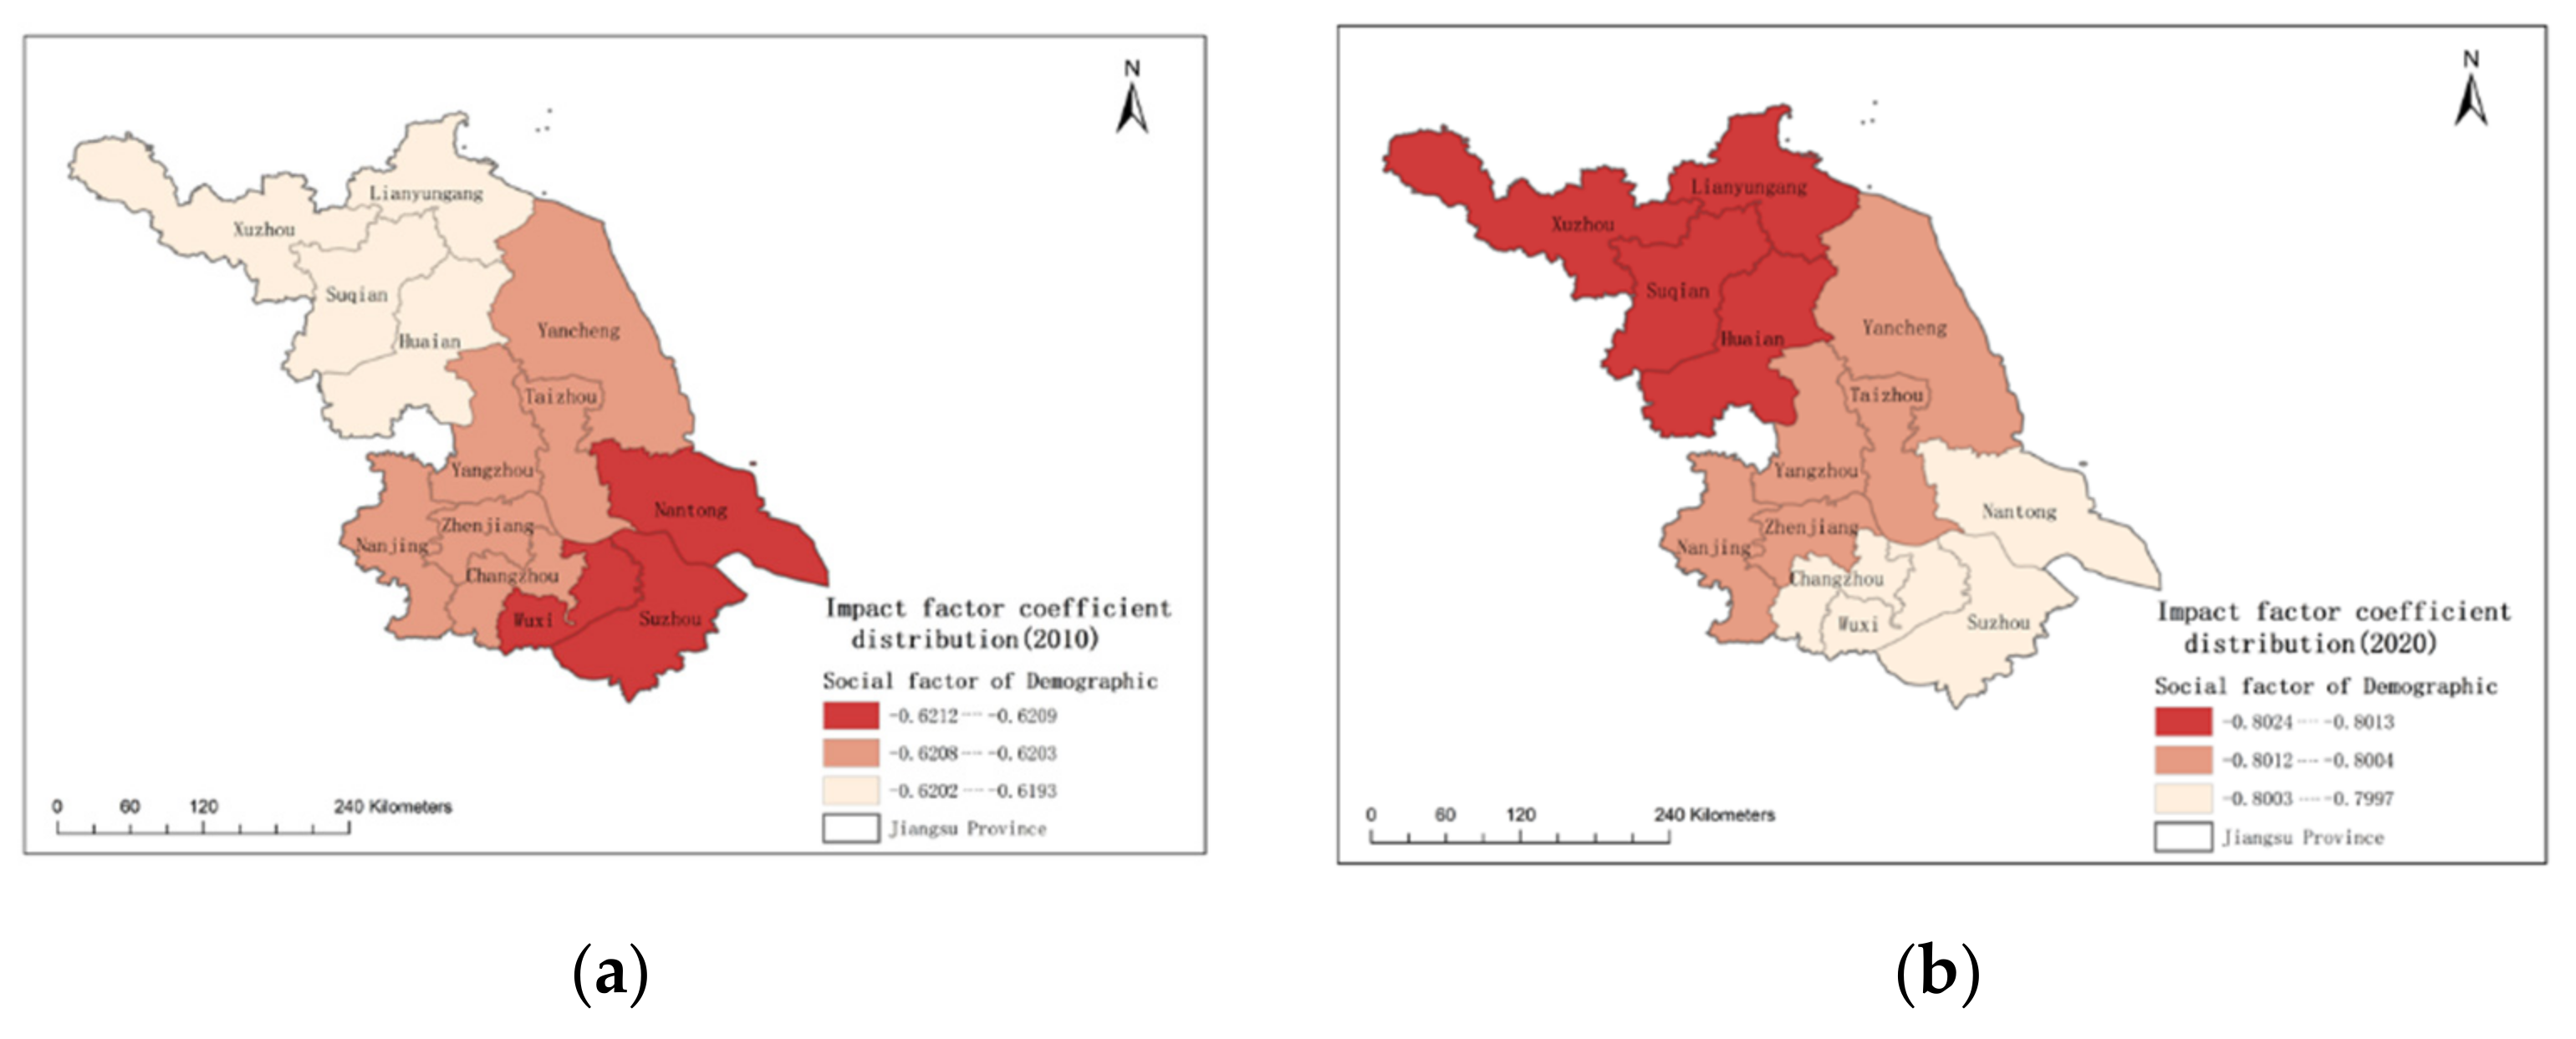
- Social factor of the DemographicChildren remain vital to the aging population, providing care, social companionship, and housekeeping [21]. The household wealth directly relates to the aging population that increased the availability of pensions and the housing reform beginning in the 1990s, which increased housing availability and enabled elders to live alone [22]. The number of household members may be associated with an aging population. Consequently, this paper selects it as a social demographic factor to determine its impact on the aging population.
- 3.
- Healthcare facility
2.2. Method
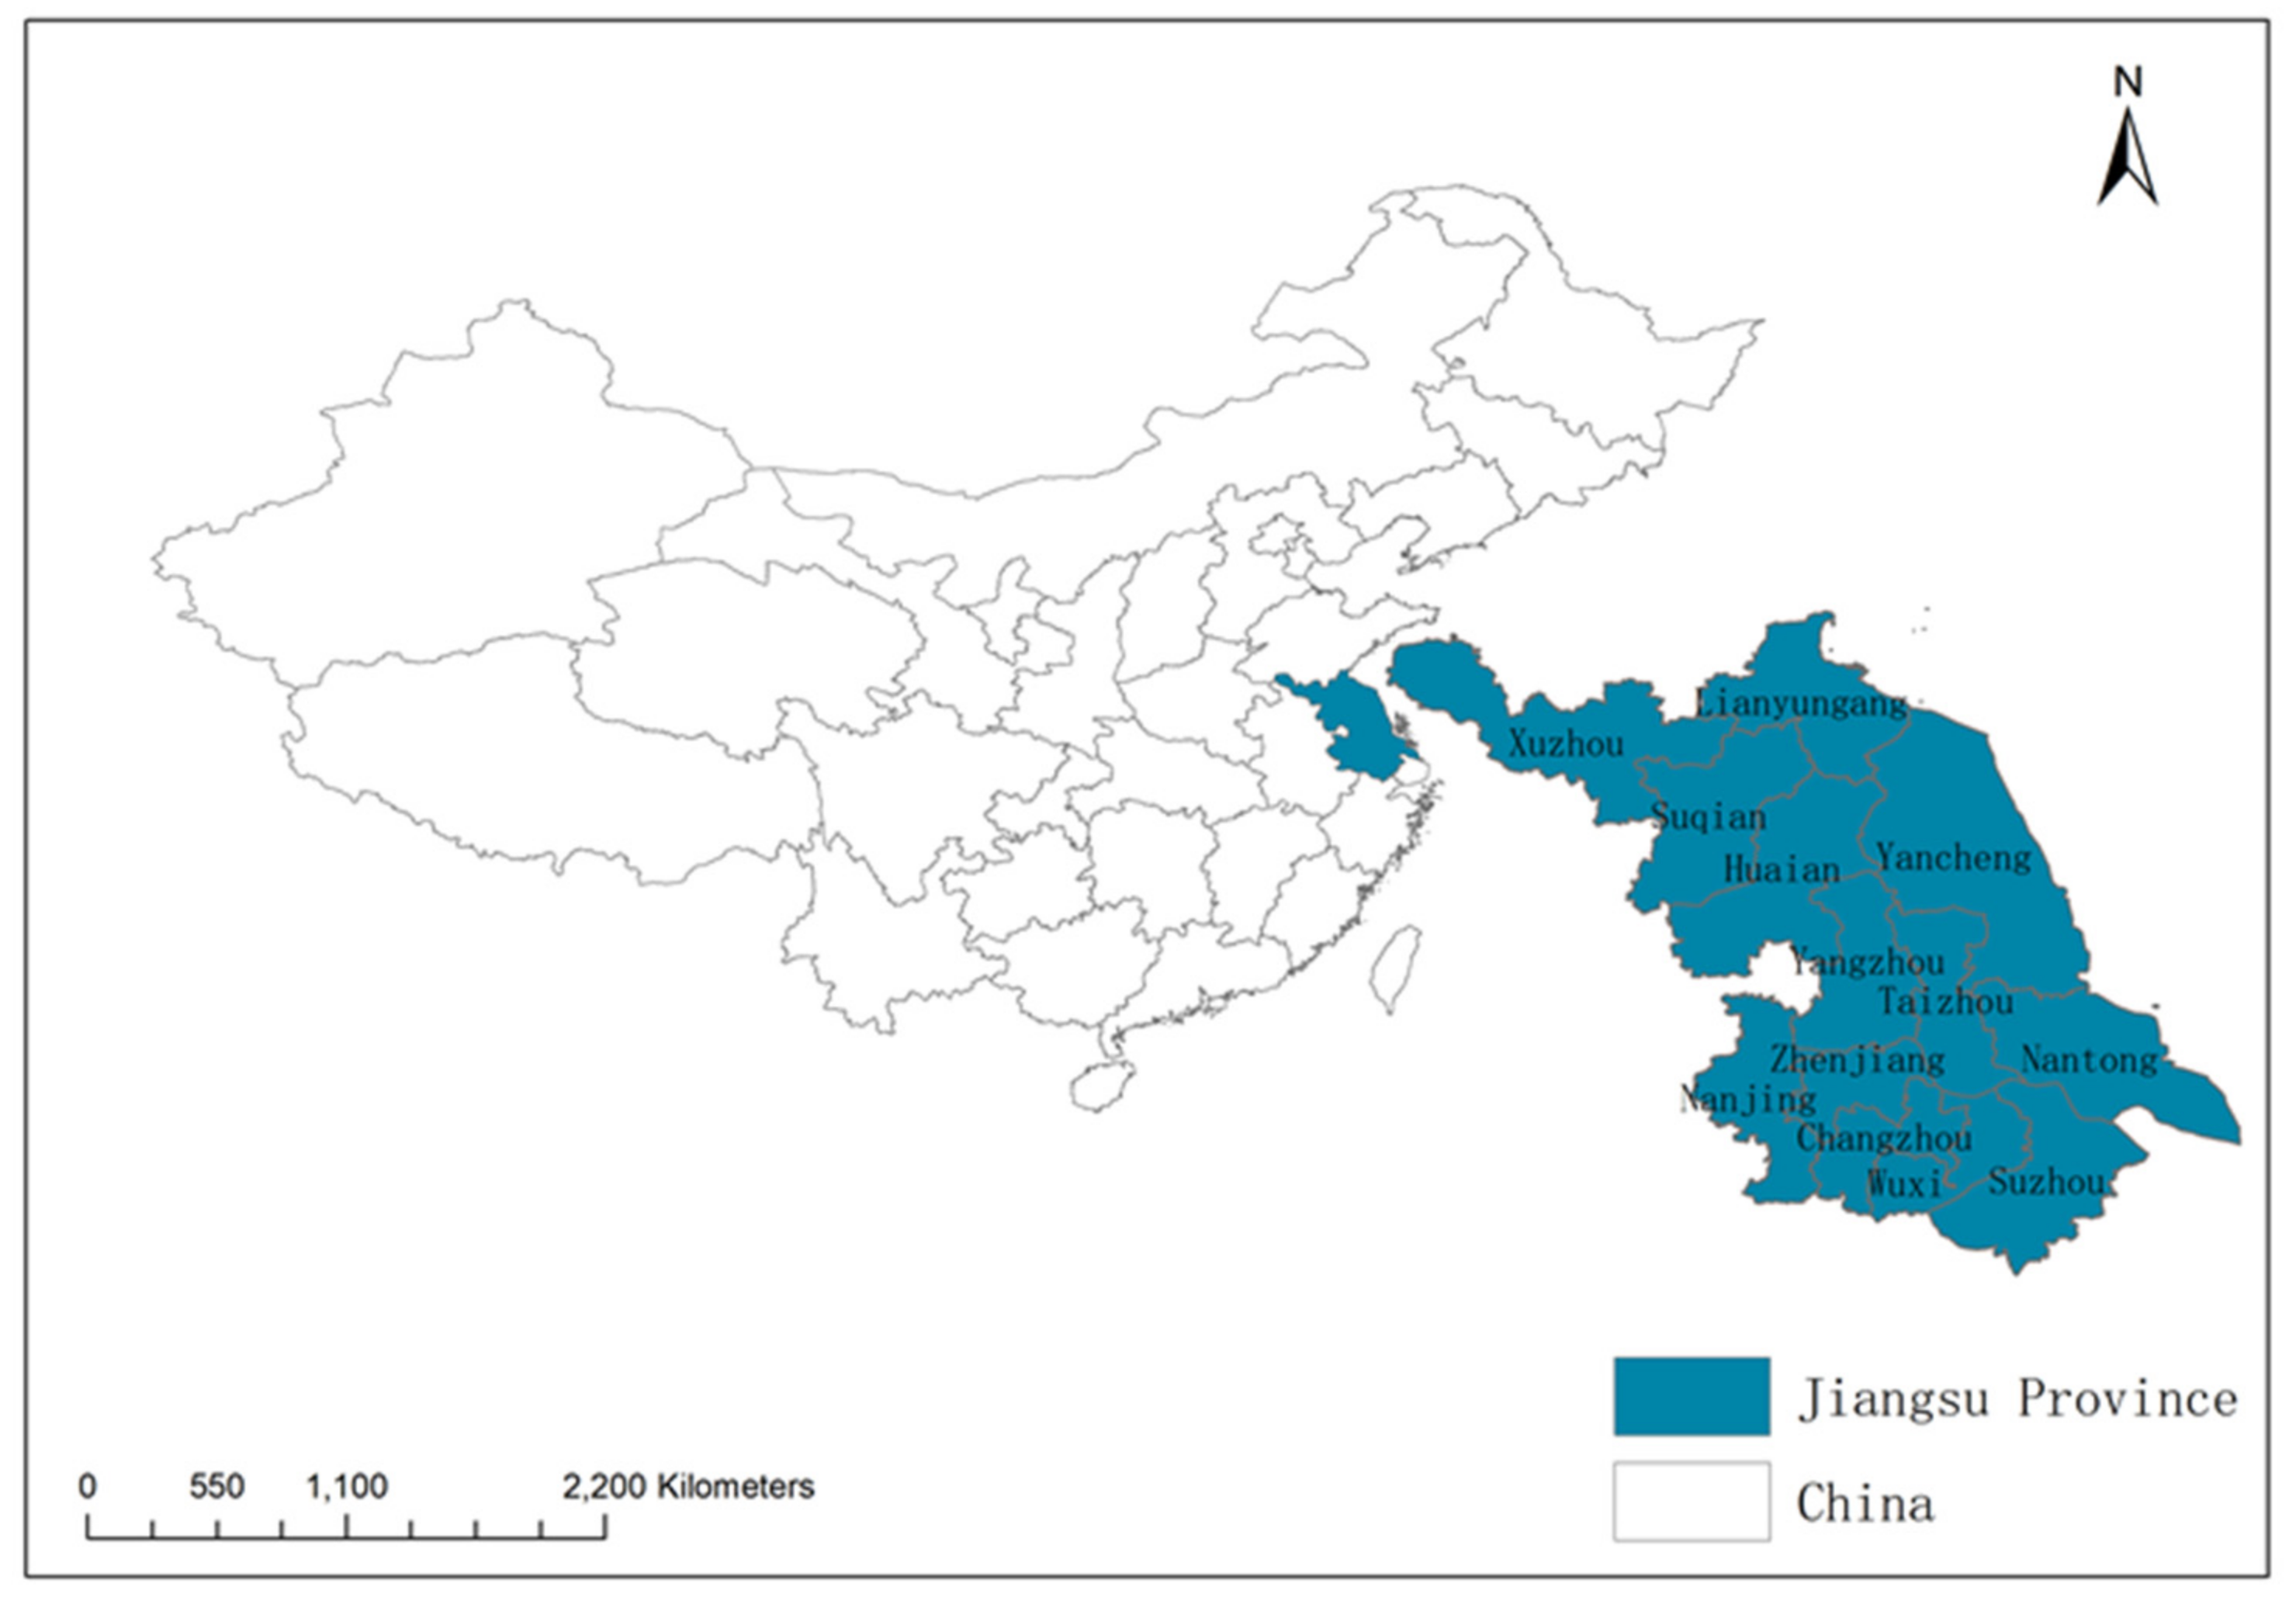
- Study area
- 2.
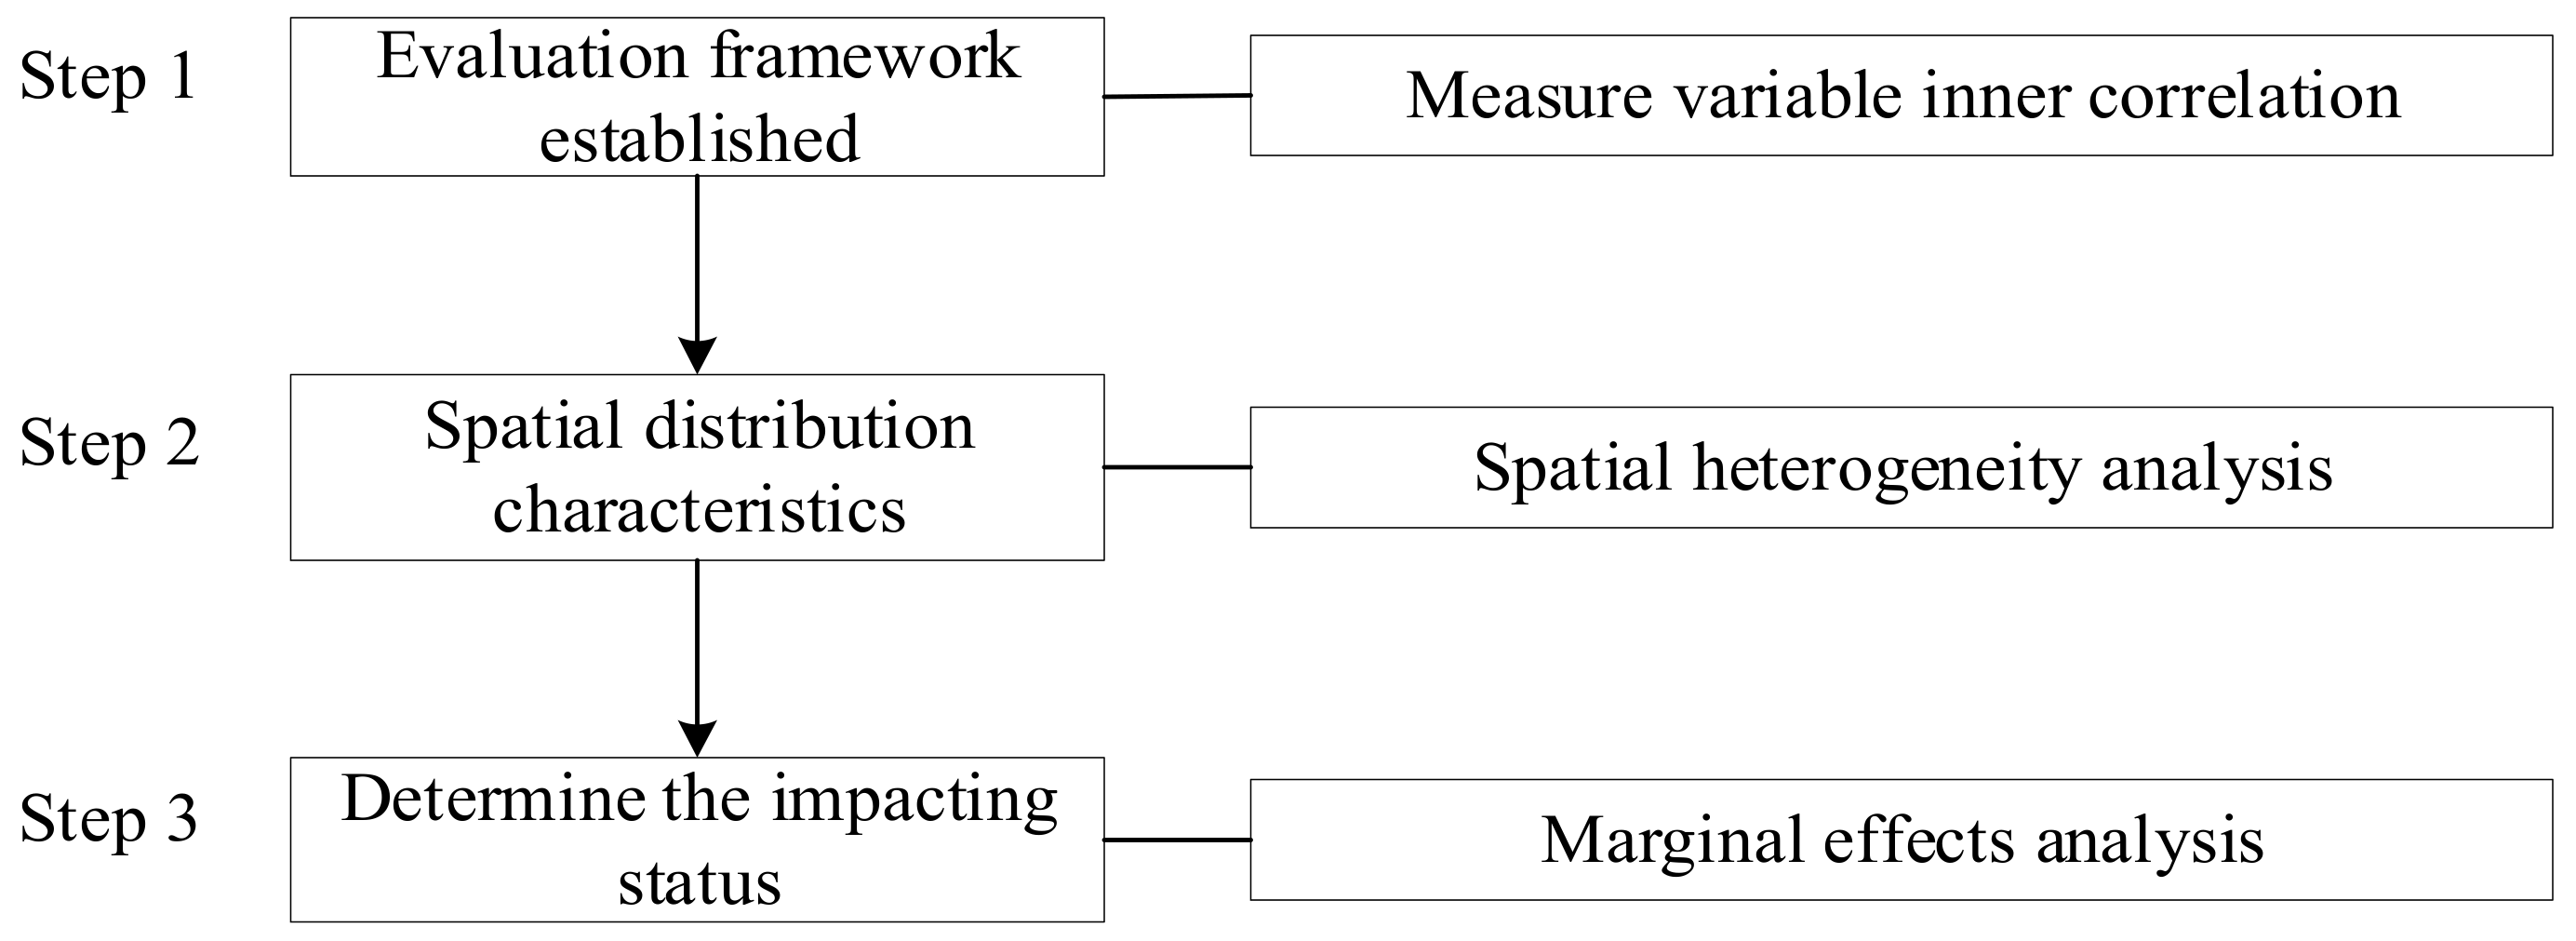
- Study process
- 3.
- Evaluating framework establishment and correlation test
- 4.
- Spatial heterogeneity analysis
- (1)
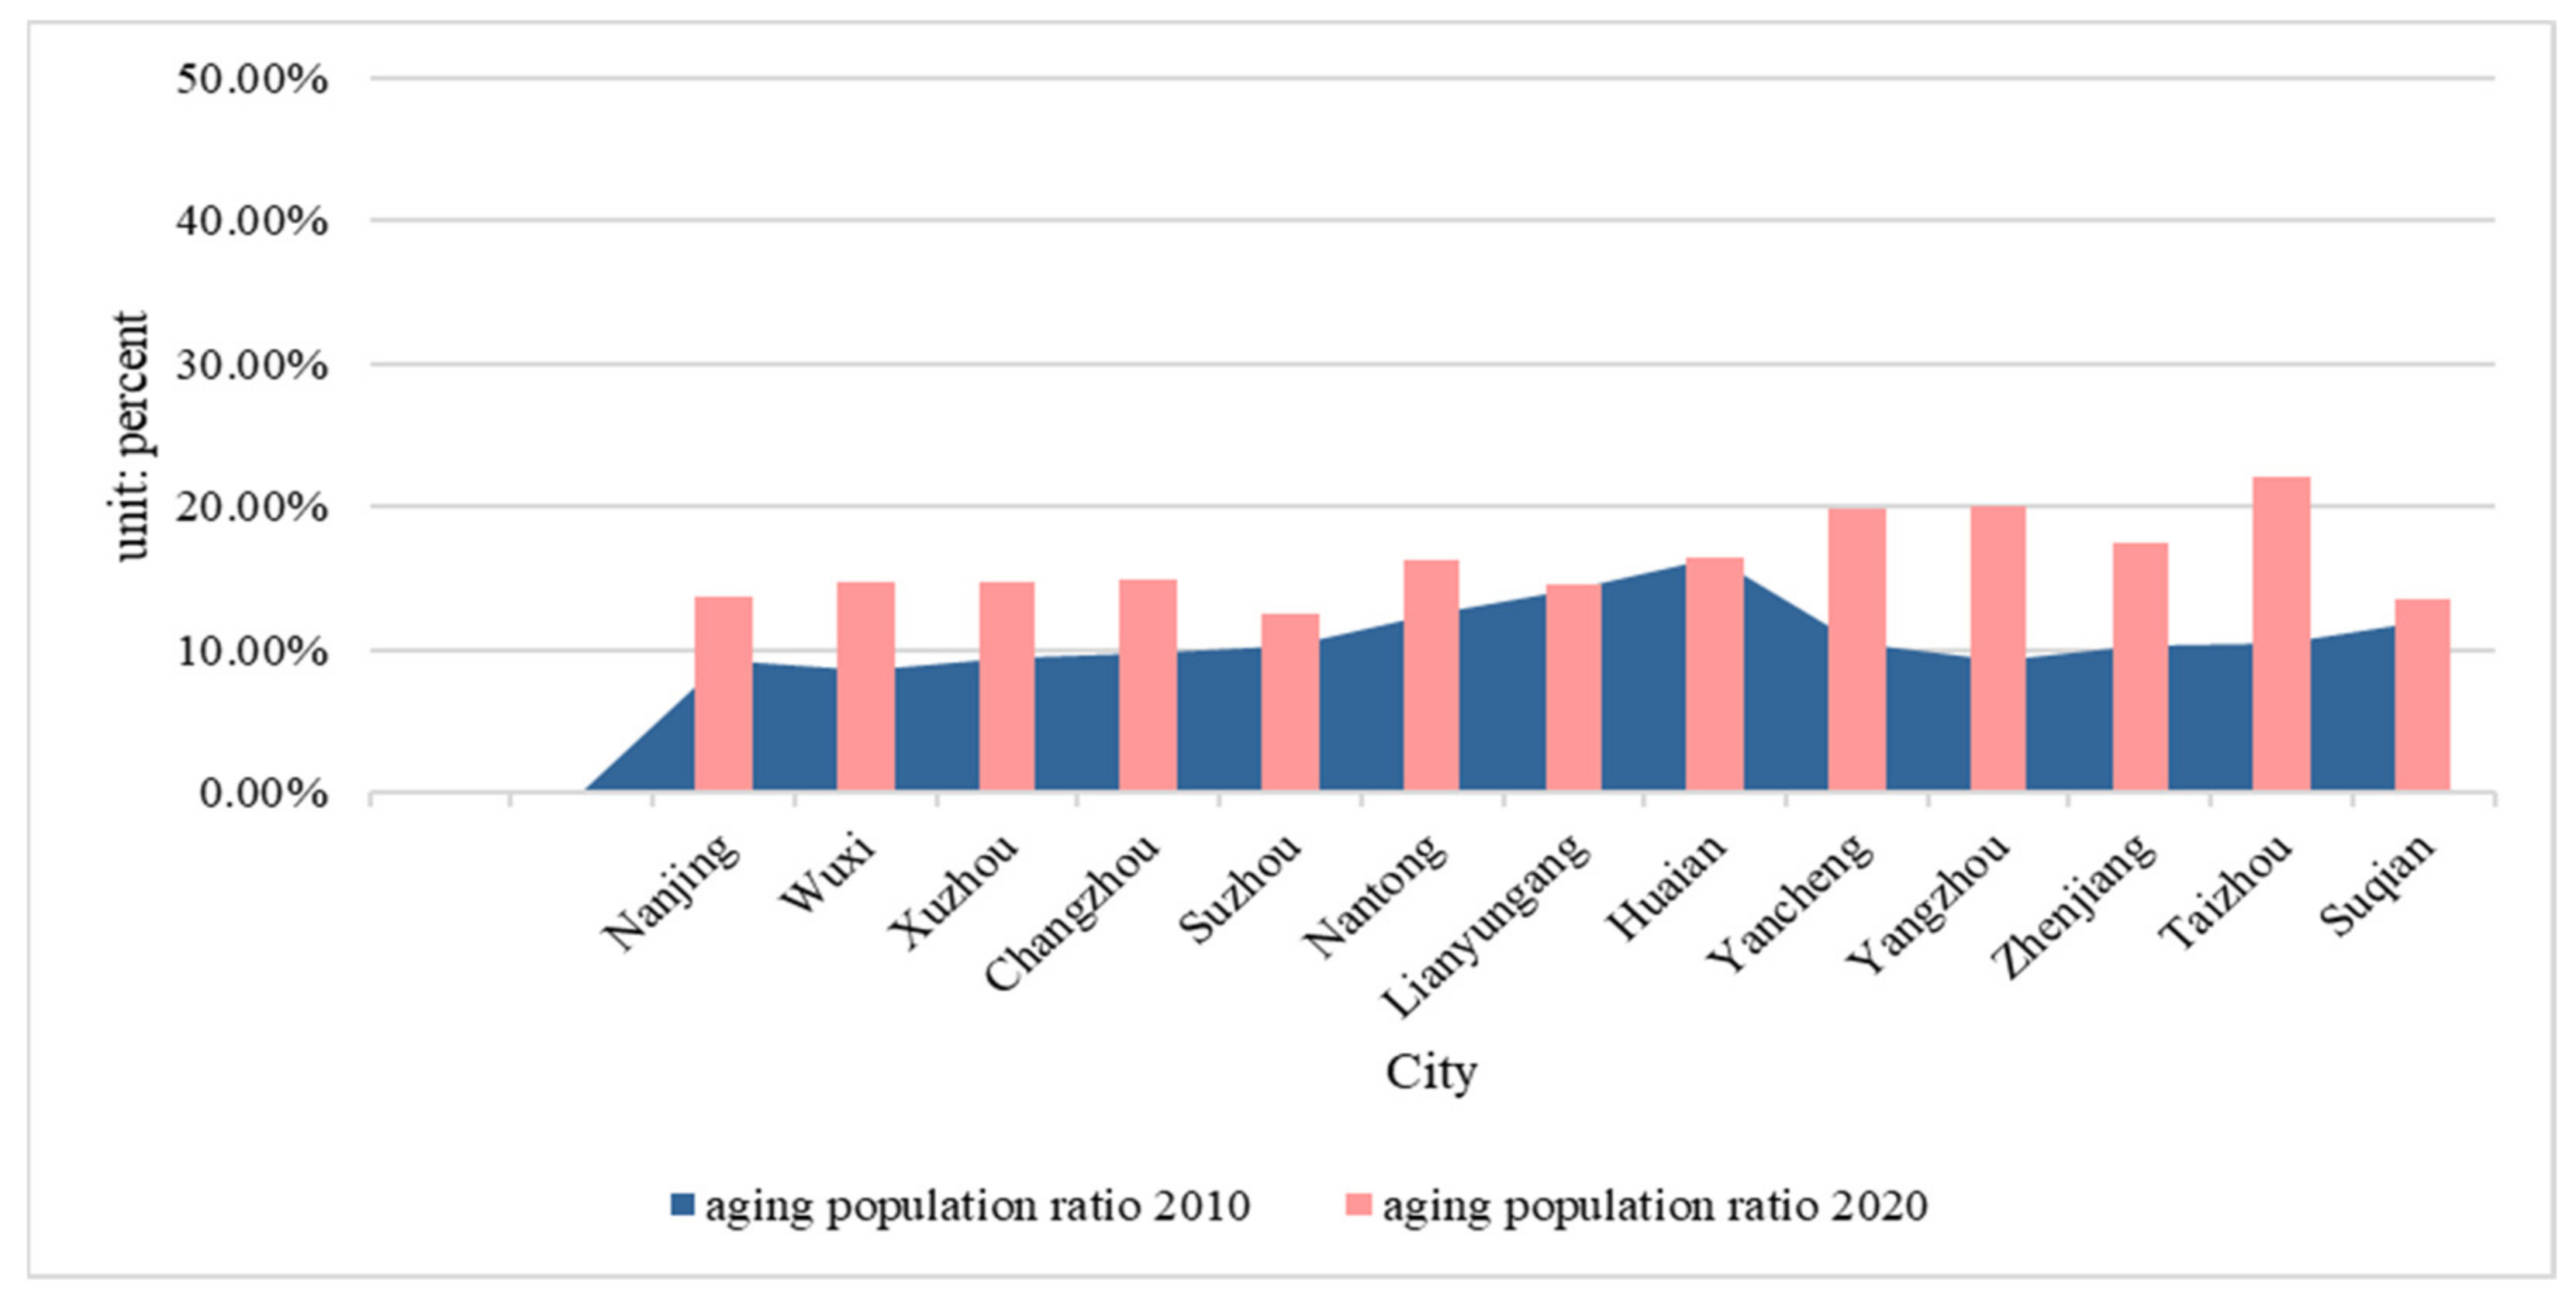
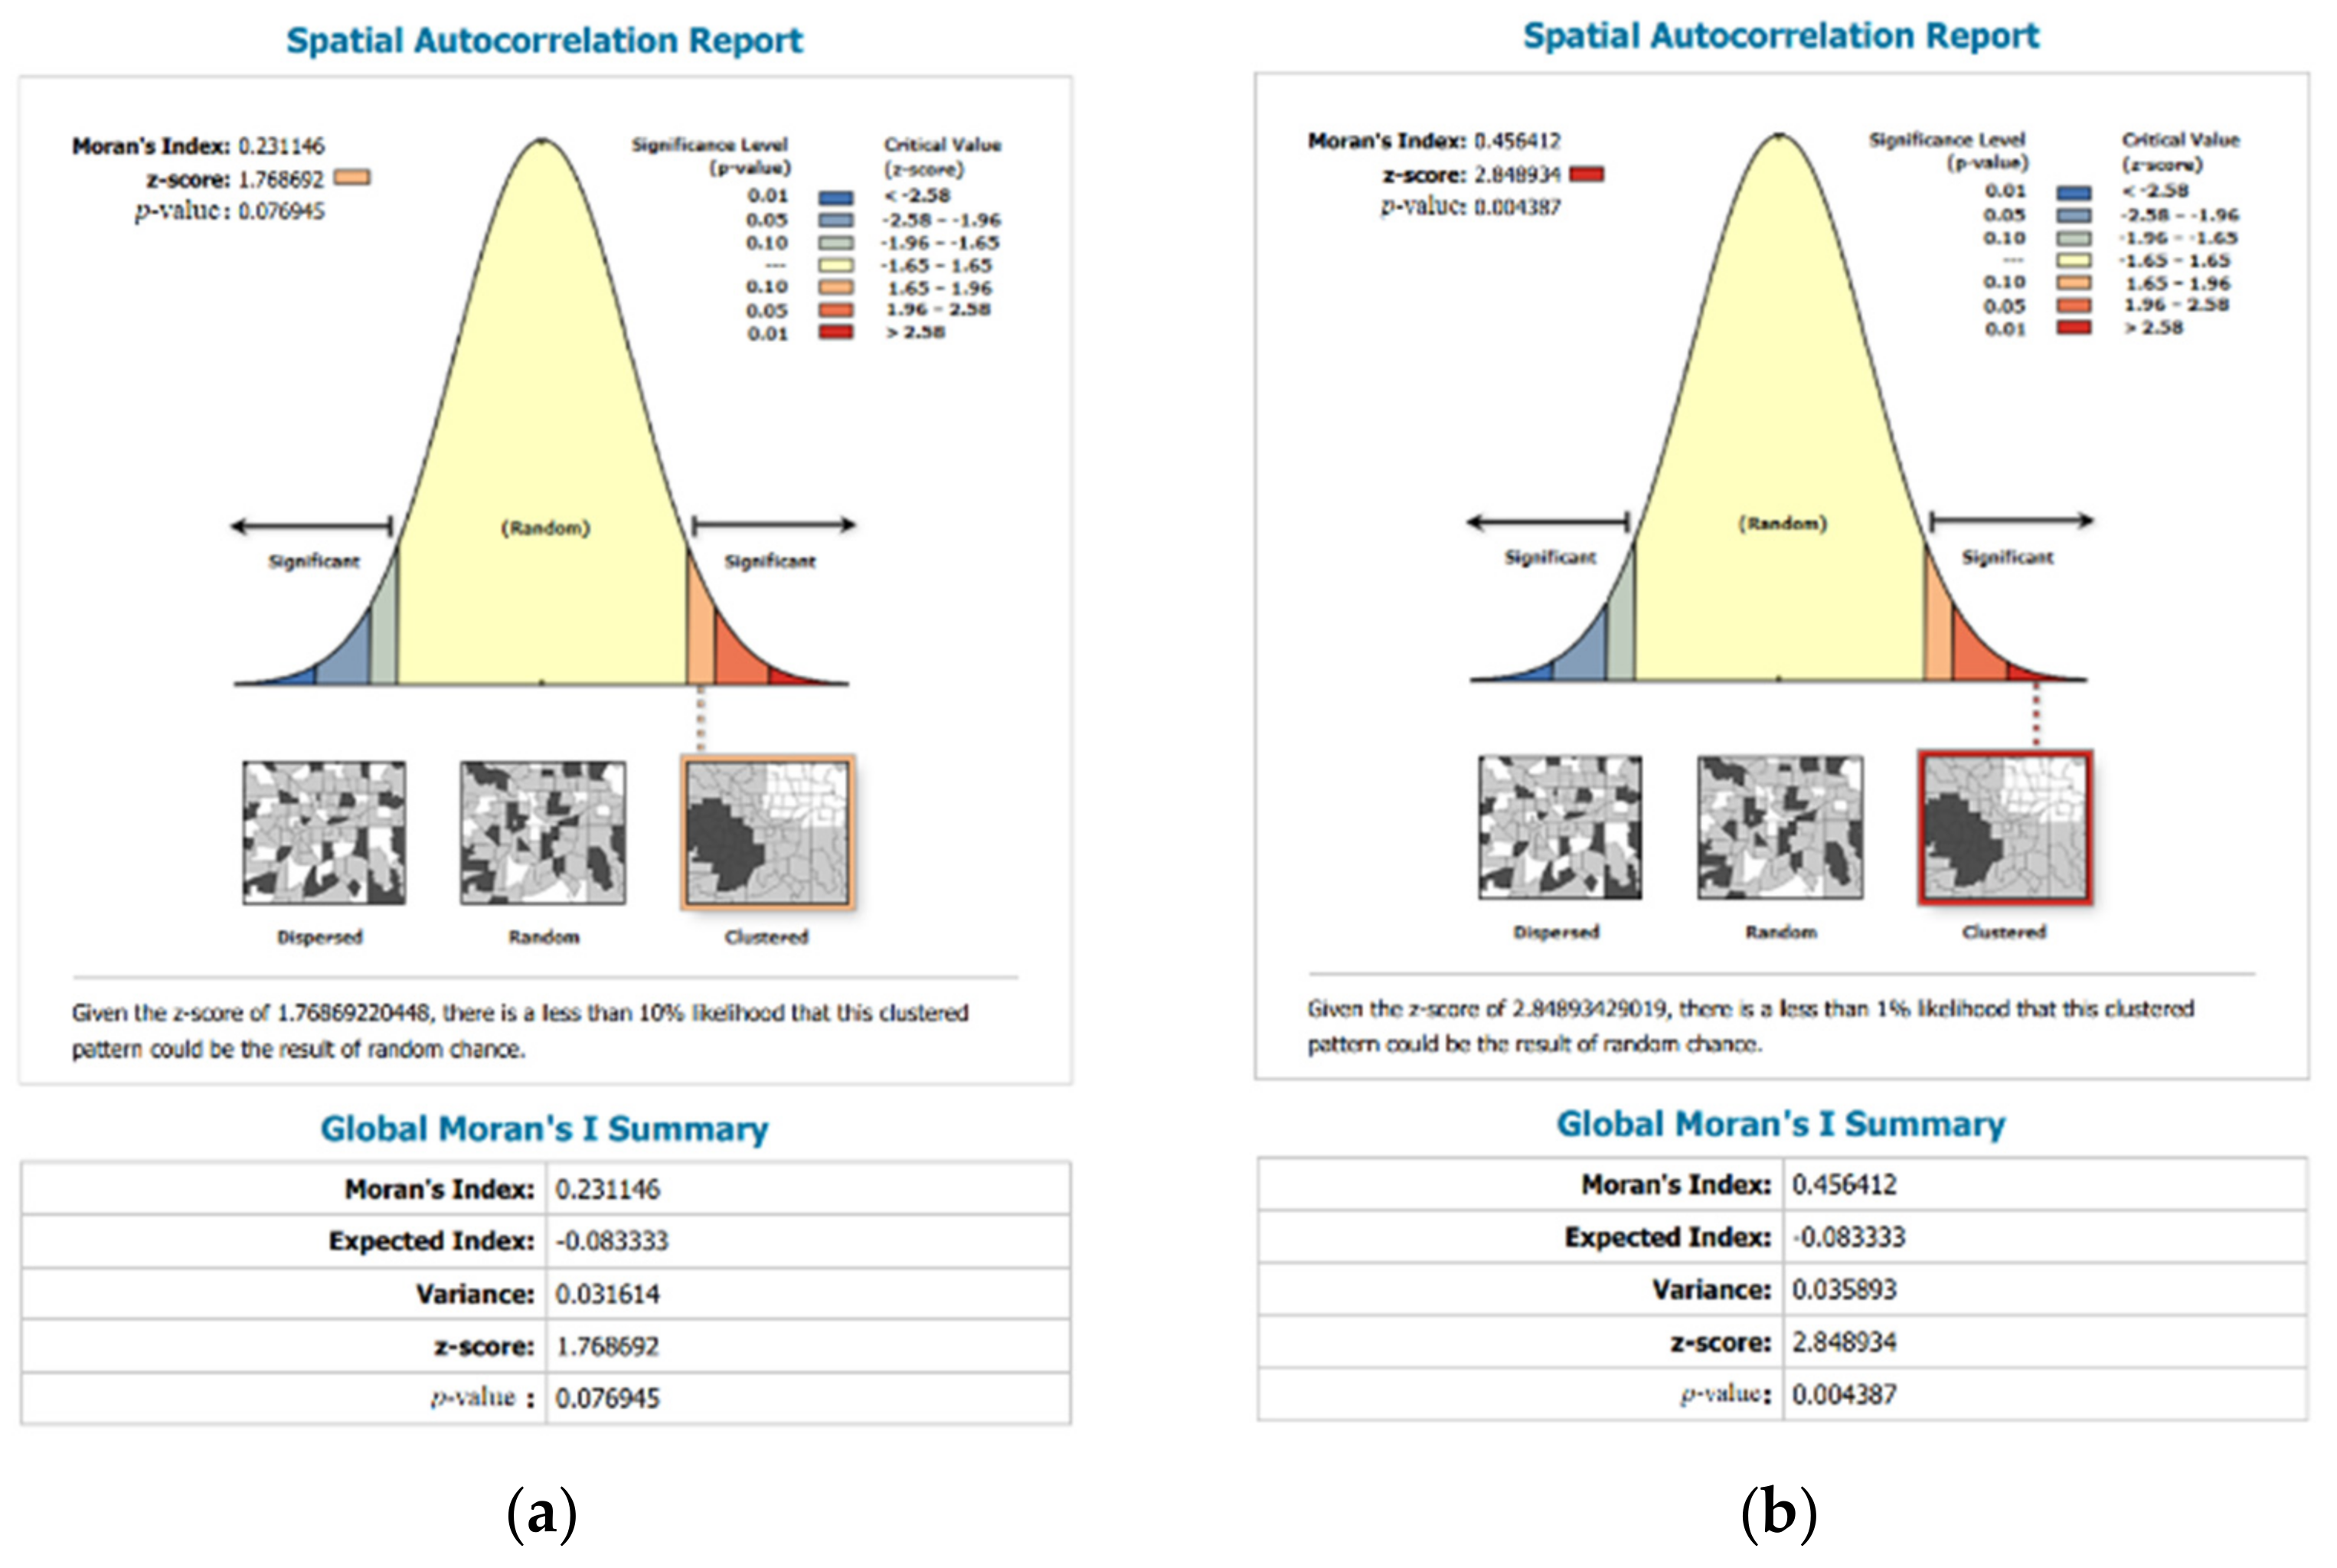
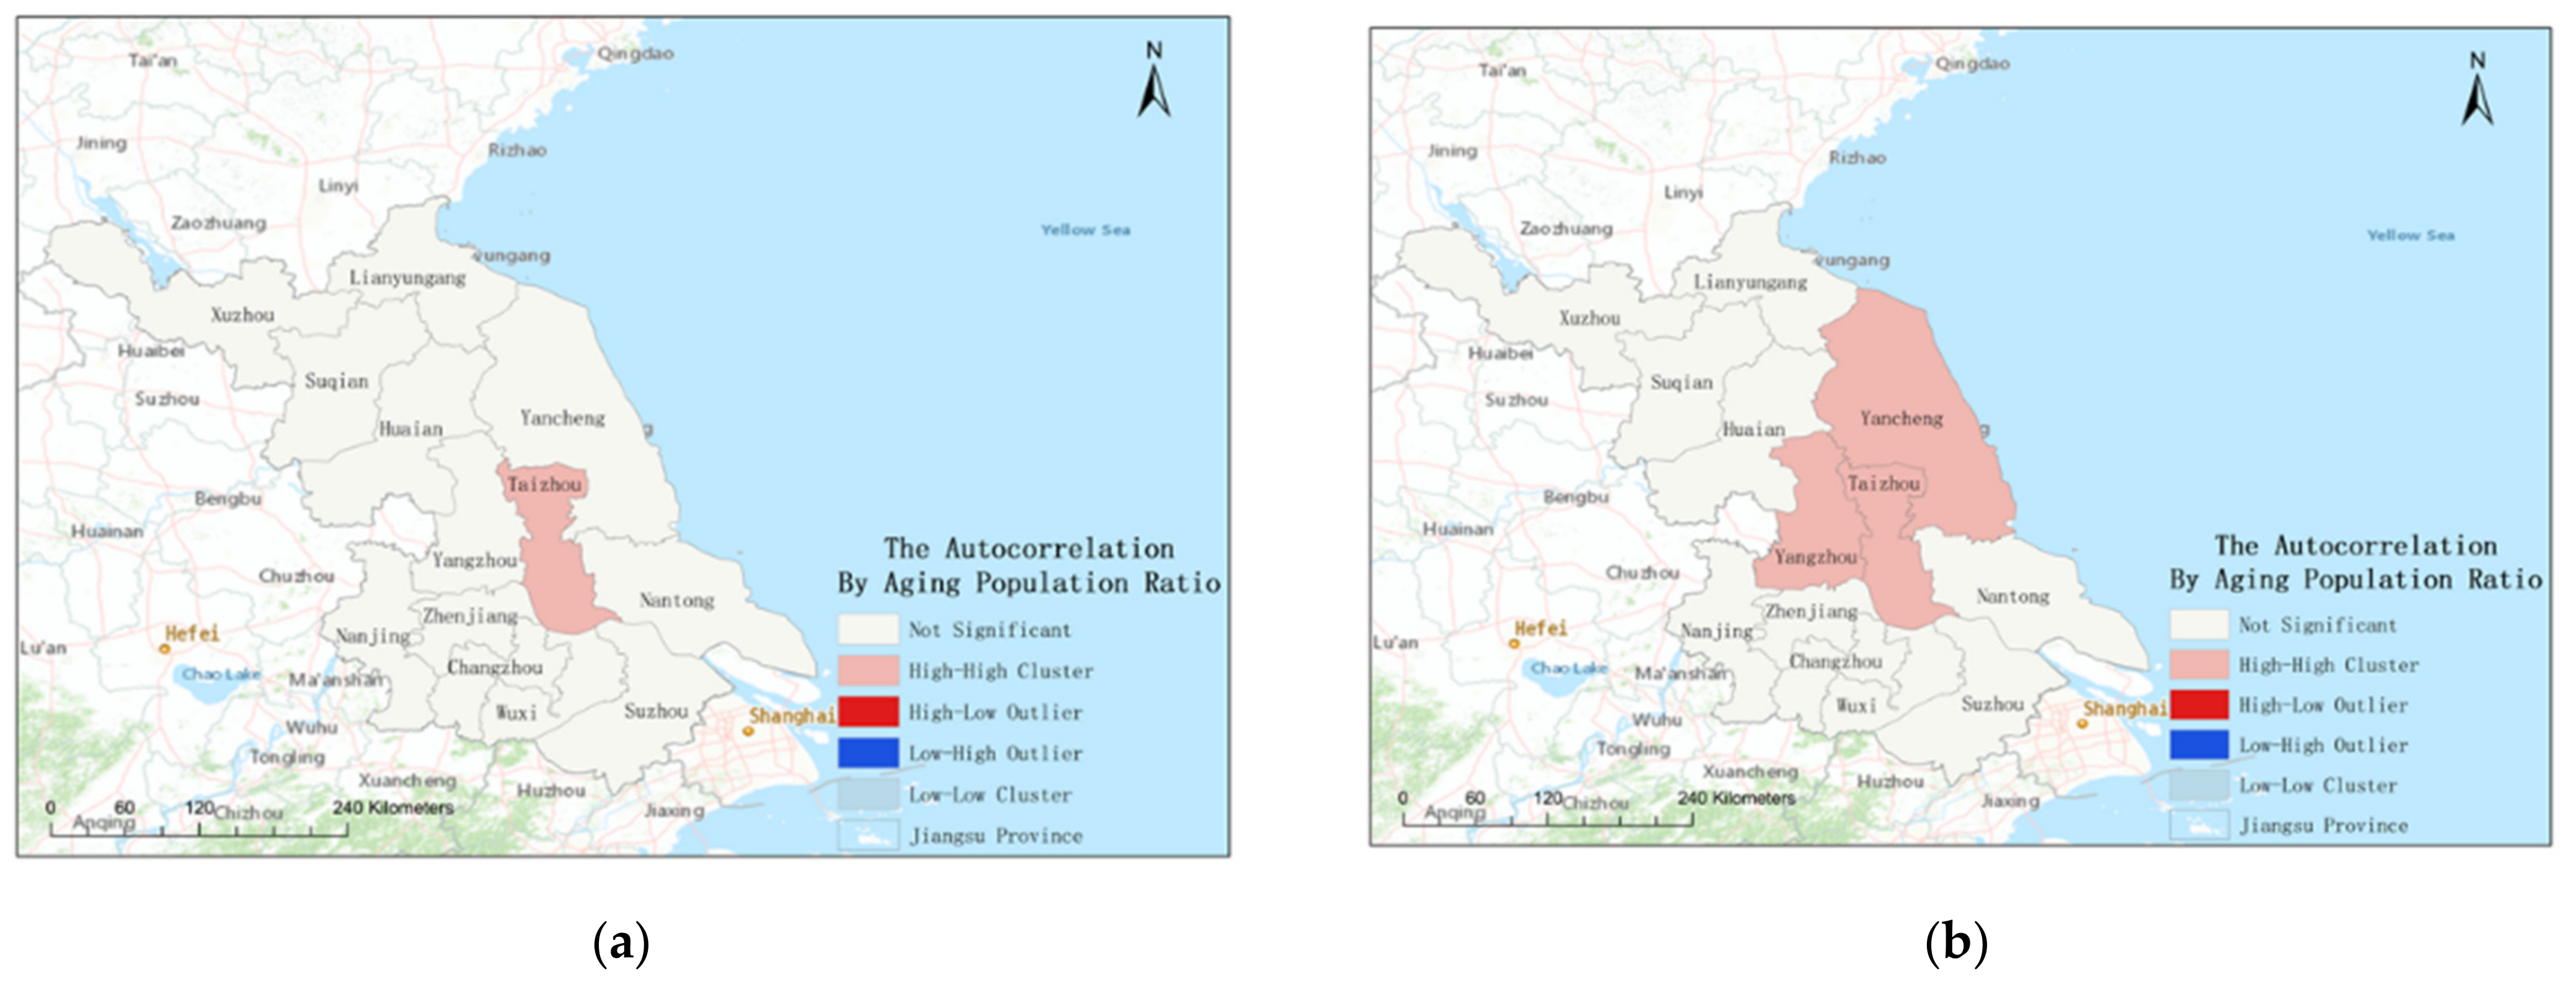
- Spatial auto-correlation analysisThe aging population ratio may reflect the absolute aging of the population and is the most famous indicator [12]. As mentioned above, all cities fall within the severe aging phase. Therefore, this paper will examine the aging society from the spatial factor to recognize the relationship between cities as a function of the elderly population ratio. Spatial auto-correlation is a method of evaluating the spatial distribution feature of the aging population, which divides the data into homogeneous groups and considers the geographic location of the feature [26]. This paper uses the spatial auto-correlation model to assess the geographical location attribute of the aging population to determine its distribution characteristic. This will recognize the distribution of the elderly in the study area, directly indicating the spatial heterogeneity of population aging.Moran’s I identifies the potential interdependence between observation data of some variables in the same distribution area. It has a finite range and a definite reference value distinguishing between negative and positive spatial auto-correlation. Meanwhile, its interval value is [–1, 1], where [–1, 0] represents the default negative auto-correlation vice and [0, 1] means positive [27]. The null hypothesis is “the attribute being analyzed is randomly distributed among the characteristics of your field of study”. Hence, if the p-value is not statistically significant, you cannot reject the null hypothesis.
- (2)
- Spatial heterogeneity for impact factorPopulation aging is linked to social–economic/demographic characteristics and healthcare facilities, and it is a complex societal problem. Moreover, many people identify its impact factor in various ways. Ref. [10] have adopted spatial spillovers to recognize the socio-economic influences of an aging population. They found that GNI per capita/rate of urbanization and life expectancy correlate positively with an aging population in a country and neighboring counties. Ref. [12] found that China’s aging population is determined by the demographic, socio-economic, and natural environment, but that there are different key factors in other regions.The spatial analysis method could also be used to assess the aging population in various cities with non-space attributes, such as by using Geographically Weighted Regression (GWR). It enables the effect of population aging and other variables to vary over a geographical area [28]. GWR could identify the impact of the specific situation in different regions with explained variables, providing an actual scenario to describe how it affects the aging population. GWR is a spatial statistical method that shifts from the global regression models to local models [29].In fact, in measuring the correlation between independent and dependent variables, different regression methods could be adopted. For instance, ordinary least square (OLS) has been widely used to identify the relationship, but this does not consider spatial variation [30]. In addition, machine learning methods such as random forest have also been applied to classify or determine the correlation [31]. GWR estimates and produces various parameters within the study area by weighting the distance [32]. That will recognize the spatial characteristics of the aging population and its correlation factor, which contributes to understanding the aging population feature of space distribution and defines variables that specifically impact the aging population in the study area. This paper adopts GWR to determine the correlation between population aging and the impact factor. Meanwhile, the GWR is merely quantifying the impact value in the specific area, and if we want to obtain holistic research, we could consider combining other methods.
- 5.
- Marginal effect evaluation
3. Finding and Analysis
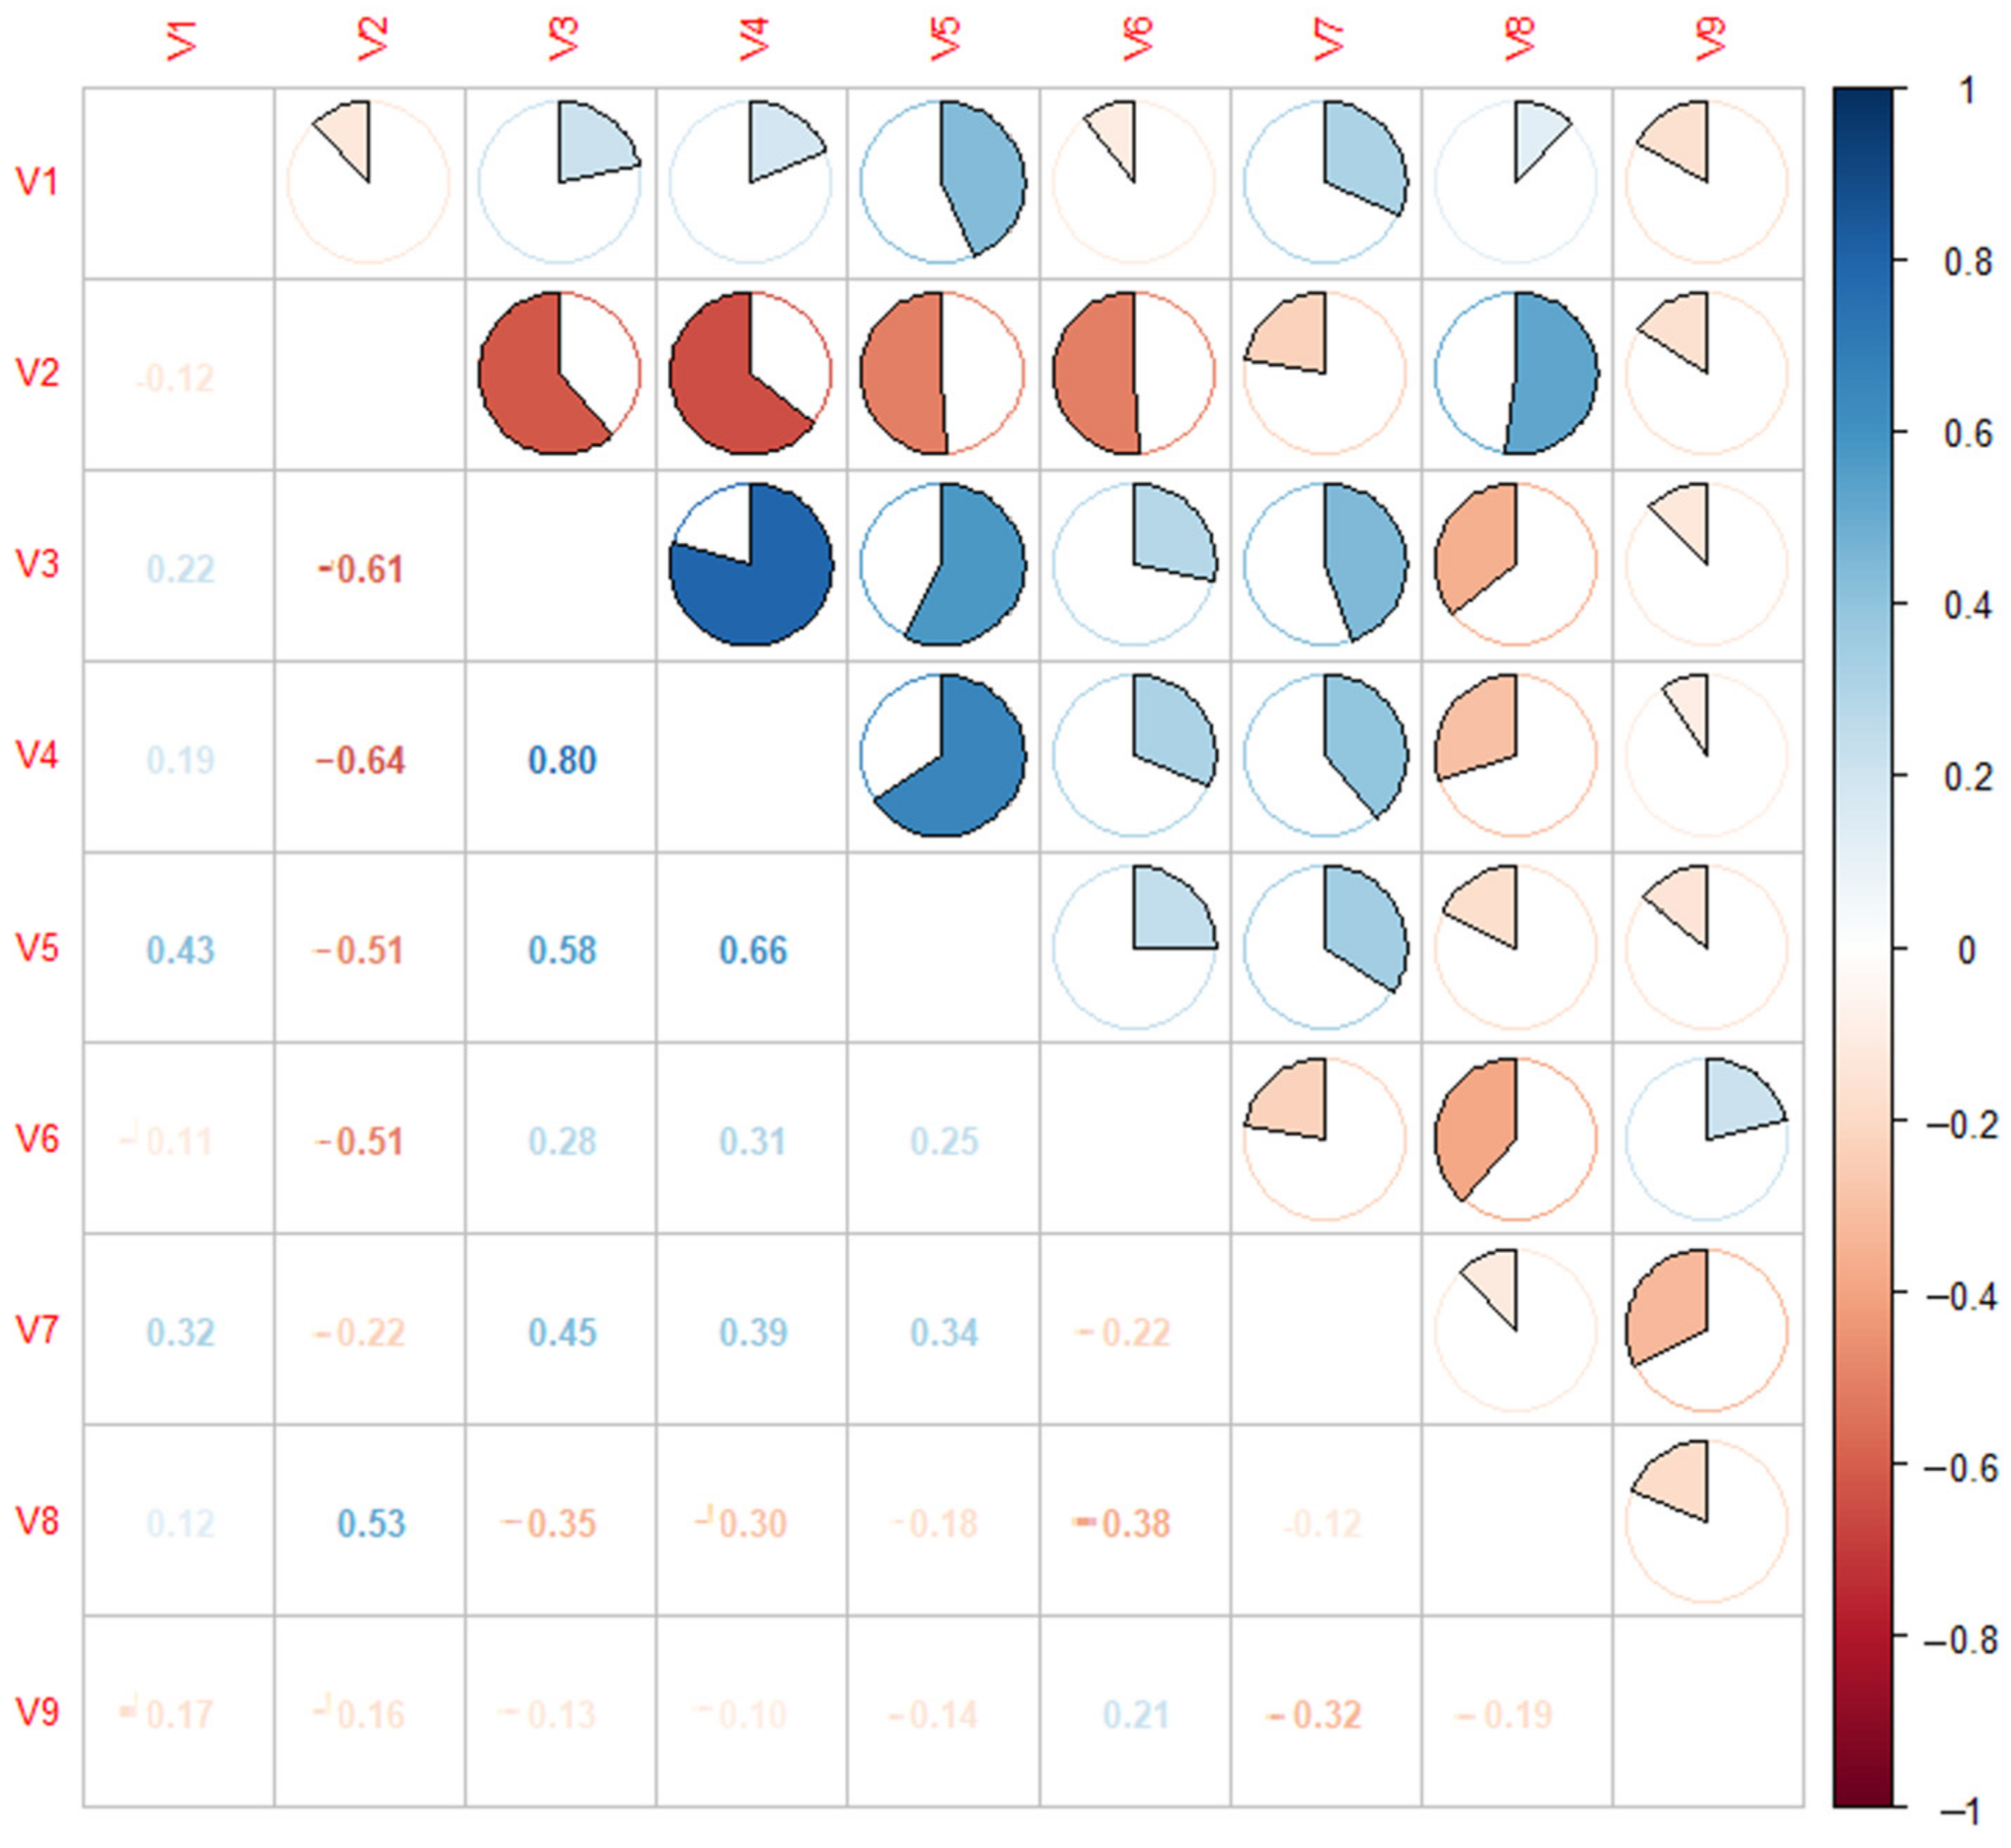
3.1. Explain Variable Correlation Measuring
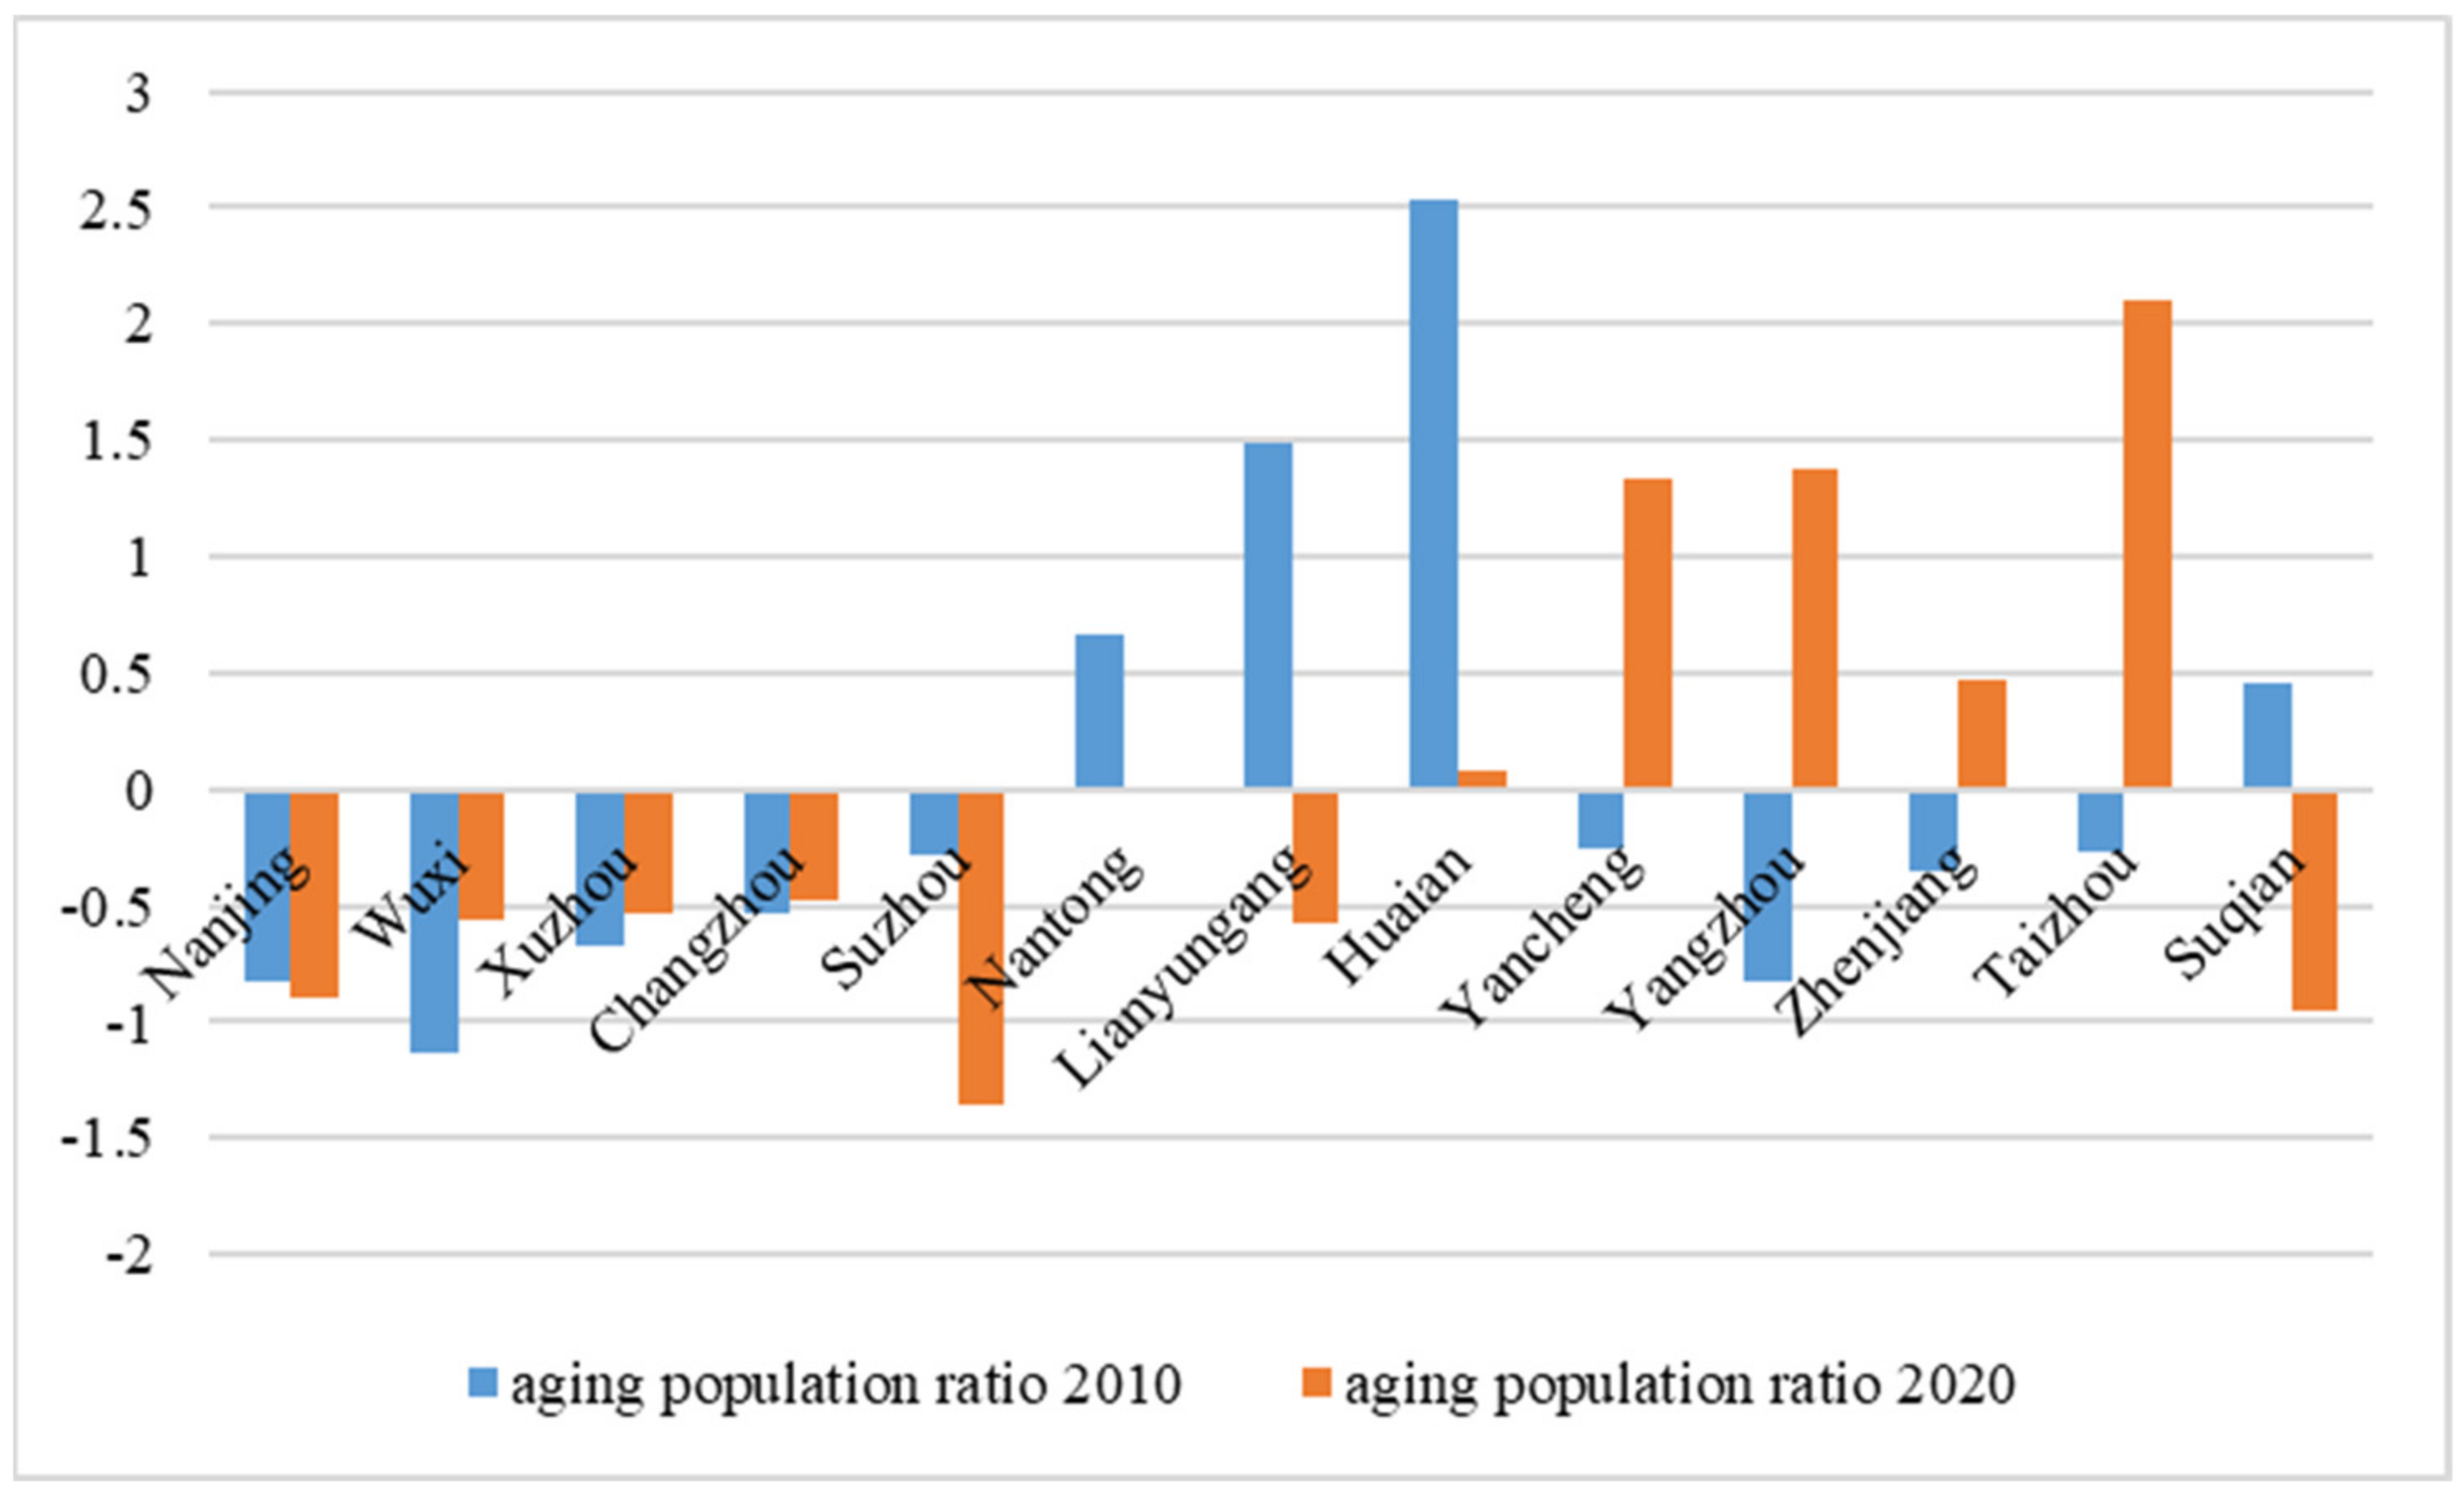
3.2. Aging Population Auto-Correlation
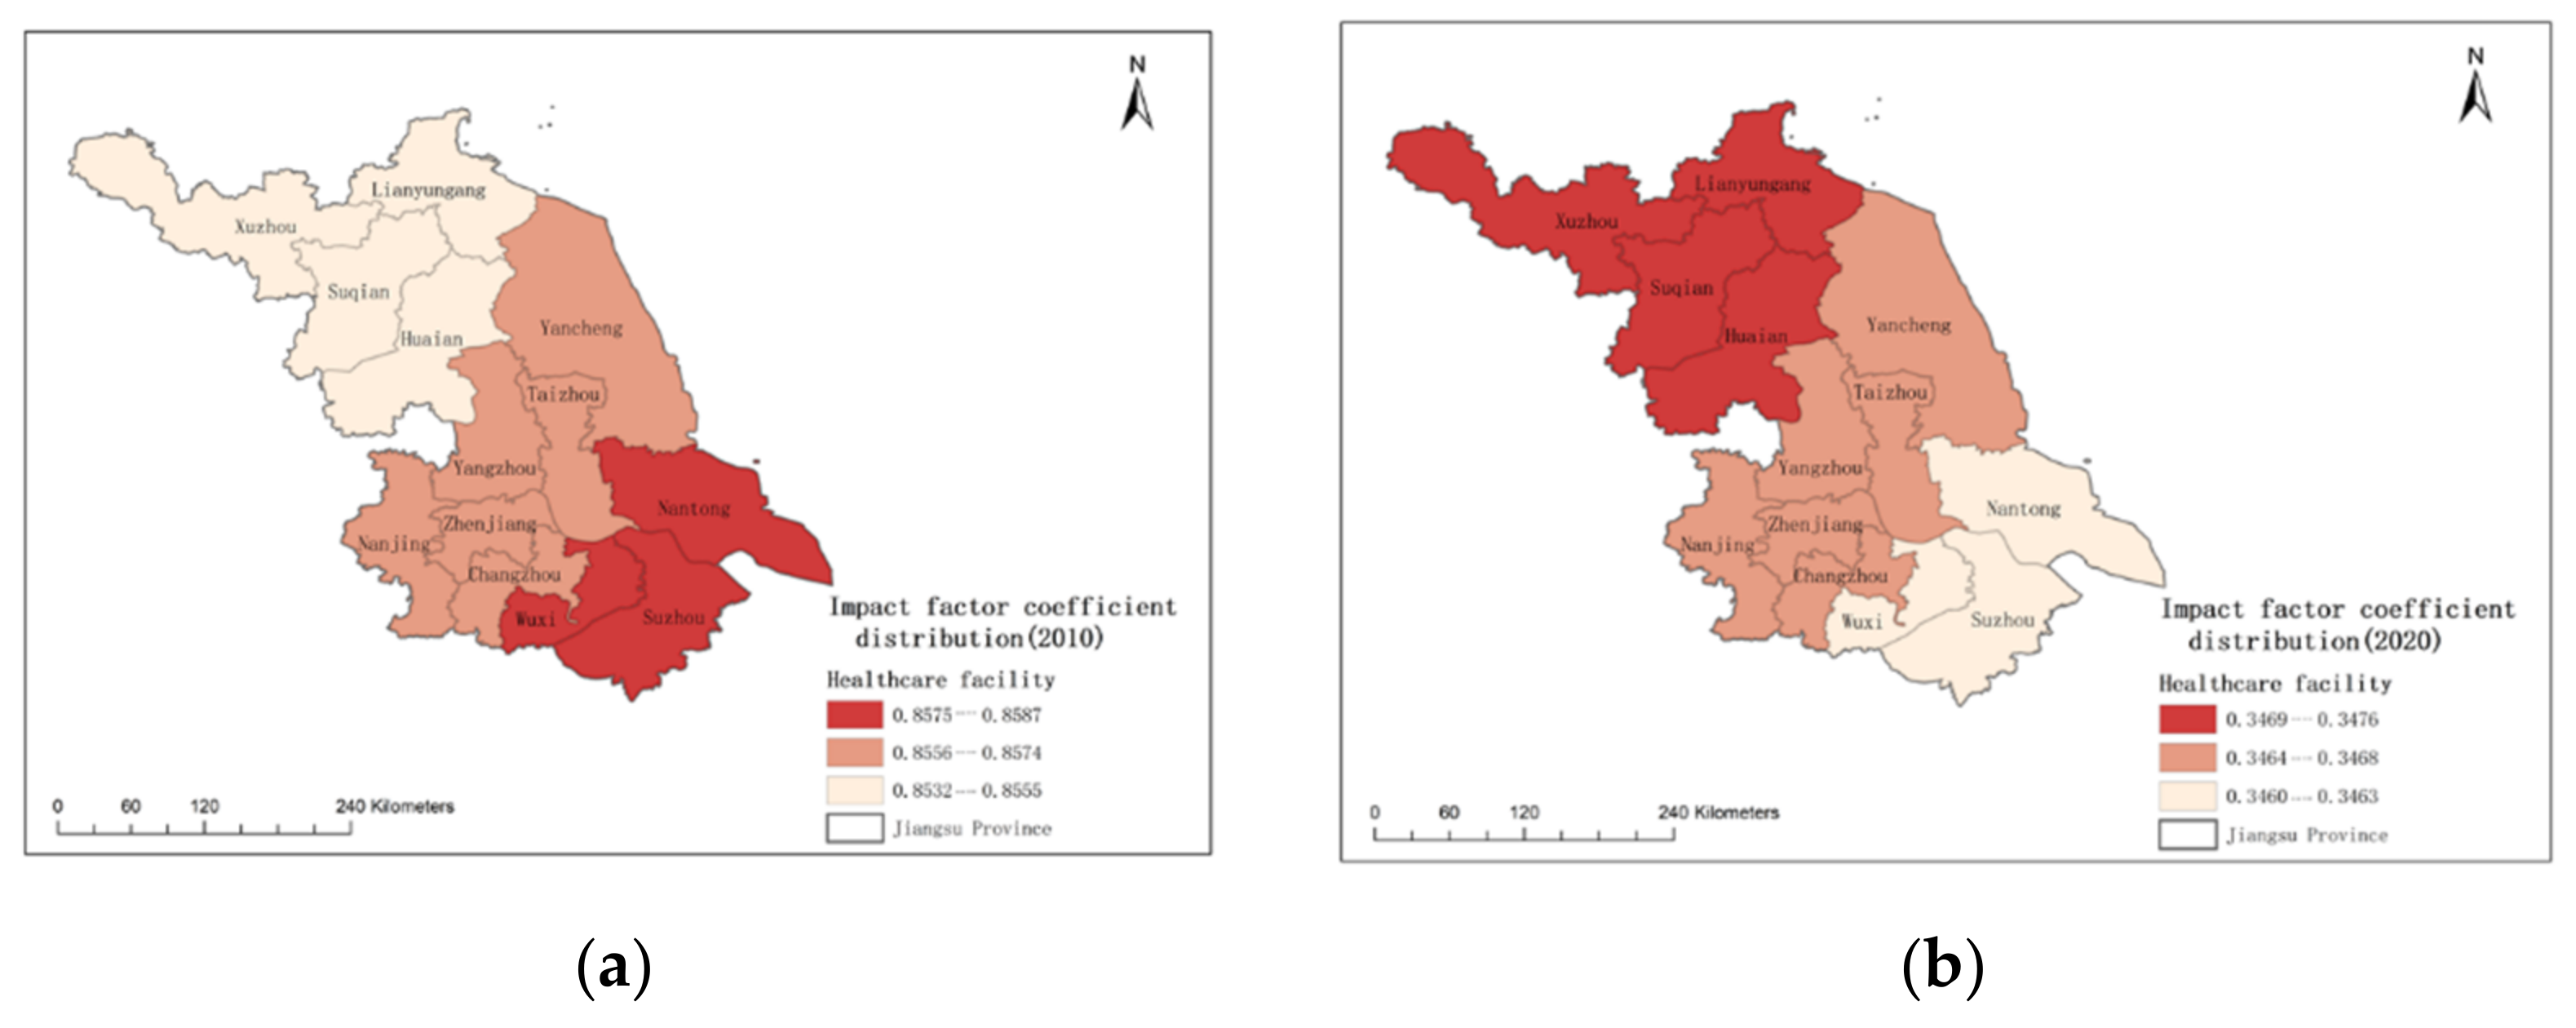
3.3. Spatial Heterogeneity for Impact Factor
3.4. Marginal Effect Evaluating
4. Discussion
4.1. Aging Population Sprawl Concentrated
4.2. Impacting Factor without Significant Spatial Heterogeneity
4.3. Impacting Factor Has Significant Temporal Heterogeneity
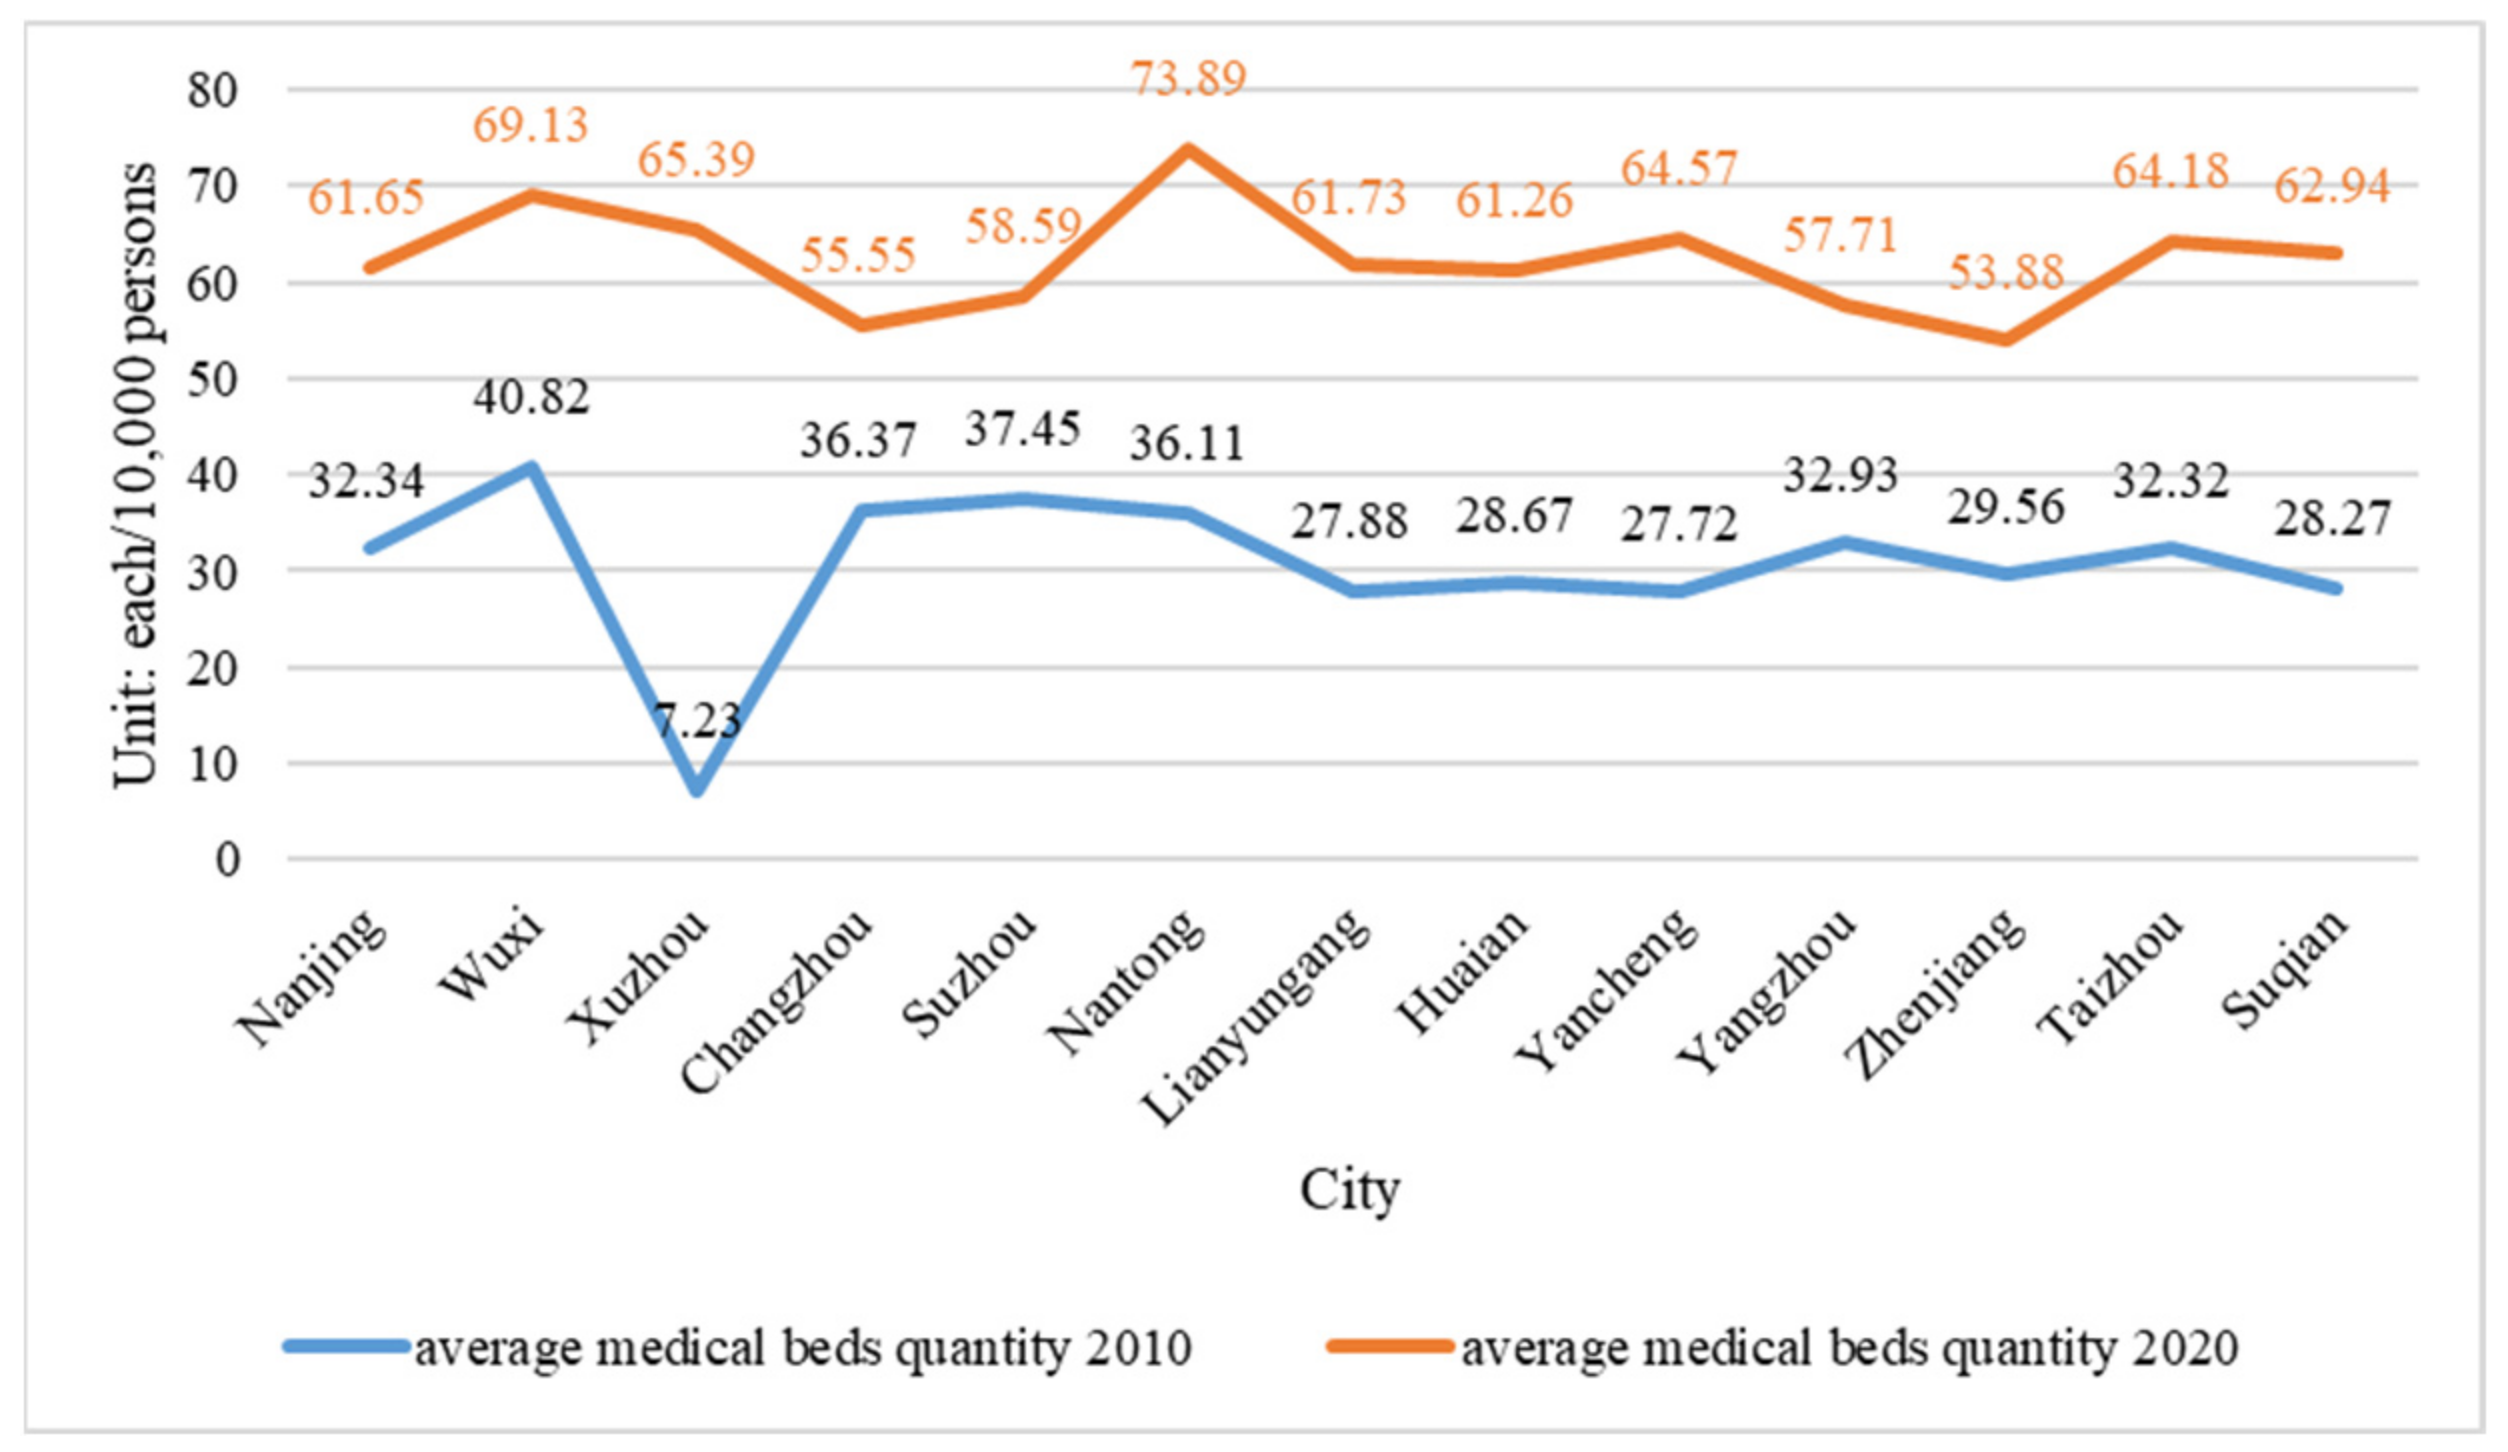
4.4. Provide More Facilities for Elderly Group
4.5. Provide More Policy for “Universal Three-Child Policy”
5. Conclusions and Implications
5.1. Conclusions
5.2. Implications
Author Contributions
Funding
Institutional Review Board Statement
Informed Consent Statement
Data Availability Statement
Conflicts of Interest
Appendix A. The Data-Based of Impacting Factor in 2010 and 2020
| City | Population (Unit:10,000) | Average Household (Unit: Person) | Per Capita GDP (Unit: 100 Million Yuan) | Per Capita Disposable Income (Unit: Yuan) | Number of Medical Beds (Unit: Each) | Aging Population Ratio | Population Growth Ratio | Fertility Ratio | Mortality Ratio |
| 2010 | |||||||||
| Nanjing | 800.76 | 2.77 | 79,427 | 28,312 | 25,894 | 9.20% | 28.31% | 9.09% | 7.87% |
| Wuxi | 637.26 | 2.78 | 92,166 | 25,947 | 26,012 | 9.50% | 23.03% | 7.83% | 7.13% |
| Xuzhou | 858.05 | 3.16 | 33,233 | 16,762 | 6200 | 10.43% | −5.47% | 22.52% | 8.22% |
| Changzhou | 459.2 | 2.7 | 67,327 | 26,269 | 16,701 | 9.80% | 19.40% | 7.80% | 8.50% |
| Suzhou | 1046.6 | 2.84 | 145,229 | 29,219 | 39,200 | 8.51% | 51.31% | 9.19% | 6.75% |
| Nantong | 728.36 | 2.65 | 47,419 | 21,825 | 26,300 | 16.50% | −1.03% | 7% | 7.88% |
| Lianyungang | 439.39 | 3.27 | 26,987 | 19,020 | 12,249 | 9.18% | −5.58% | 13.87% | 8.85% |
| Huai–an | 479.99 | 3.28 | 29,000 | 15,983 | 13,761 | 10.40% | −6.45% | 10.60% | 6.50% |
| Yancheng | 726.02 | 2.9 | 31,400 | 16,935 | 20,128 | 11.97% | 3.16% | 13.20% | 8.57% |
| Yangzhou | 445.98 | 3 | 48,955 | 21,766 | 14,685 | 12.45% | −4.56% | 7.71% | 9.34% |
| Zhenjiang | 311.34 | 2.92 | 64,281 | 23,075 | 9204 | 10.36% | 7.47% | 7.46% | 6.23% |
| Taizhou | 461.86 | 2.89 | 44,118 | 21,359 | 14,928 | 14.24% | 1.01% | 9.18% | 11.10% |
| Suqian | 471.56 | 3.56 | 22,525 | 13,784 | 13,330 | 10.22% | −8.51% | 18.70% | 10.10% |
| 2020 | |||||||||
| Nanjing | 931.97 | 2.48 | 159,322 | 60,606 | 57,455 | 13.70% | 16.38% | 9.49% | 6.00% |
| Wuxi | 746.4 | 2.56 | 165,851 | 57,589 | 51,600 | 14.65% | 17.06% | 7.75% | 7.91% |
| Xuzhou | 908.39 | 2.79 | 80,673 | 43,390 | 59,400 | 14.72% | 5.91% | 12.40% | 7.20% |
| Changzhou | 527.96 | 2.51 | 147,900 | 52,080 | 29,327 | 14.88% | 14.93% | 7.60% | 7.90% |
| Suzhou | 1274.96 | 2.62 | 158,466 | 62,582 | 74,700 | 12.44% | 21.88% | 9.01% | 7.36% |
| Nantong | 772.8 | 2.43 | 129,900 | 42,608 | 57,104 | 16.20% | 6.08% | 6.09% | 10.12% |
| Lianyungang | 460.1 | 2.83 | 71,303 | 29,501 | 28,400 | 14.63% | 4.69% | 0.1056 | 5.92% |
| Huai–an | 455.92 | 2.67 | 87,507 | 31,619 | 27,930 | 16.42% | −5.08% | 12% | 7.51% |
| Yancheng | 670.96 | 2.47 | 88,700 | 33,700 | 43,324 | 19.88% | −7.58% | 7.20% | 9.39% |
| Yangzhou | 455.98 | 2.57 | 132,784 | 38,843 | 26,316 | 19.99% | 2.24% | 6.52% | 8.91% |
| Zhenjiang | 321.1 | 2.51 | 131,580 | 46,180 | 17,300 | 17.51% | 3.09% | 6.81% | 8.78% |
| Taizhou | 451.28 | 2.48 | 114,596 | 39,701 | 28,962 | 22.01% | −2.03% | 7.10% | 9.66% |
| Suqian | 498.82 | 2.92 | 65,400 | 26,421 | 31,396 | 13.56% | 5.66% | 10.61% | 6.97% |
References
- Anderson, G.F.; Hussey, P.S. Population aging: A comparison among industrialized countries. Aging Male 2009, 3, 158. [Google Scholar] [CrossRef] [PubMed]
- Wu, F.; Yang, H.; Gao, B.; Gu, Y. Old, not yet rich? The impact of population aging on export upgrading in developing countries. China Econ. Rev. 2021, 70, 101707. [Google Scholar] [CrossRef]
- Hwang, S.; Choe, C.; Choi, K. Population ageing and income inequality. J. Econ. Ageing 2021, 20, 100345. [Google Scholar] [CrossRef]
- Kim, H.K.; Lee, S.-H. The effects of population aging on South Korea’s economy: The National Transfer Accounts approach. J. Econ. Ageing 2021, 20, 100340. [Google Scholar] [CrossRef]
- Zhao, Z.; Pan, Y.; Zhu, J.; Wu, J.; Zhu, R. The impact of urbanization on the delivery of public service–related SDGs in China. Sustain. Cities Soc. 2022, 80, 103776. [Google Scholar] [CrossRef]
- Watanabe, J.-i.; Kimura, T.; Nakamura, T.; Suzuki, D.; Takemoto, T.; Tamakoshi, A. Associations of social capital and health at a city with high aging rate and low population density. SSM-Popul. Health 2022, 17, 100981. [Google Scholar] [CrossRef]
- Otsu, K.; Shibayama, K. Population aging, government policy and the postwar Japanese economy. J. Jpn. Int. Econ. 2022, 64, 101191. [Google Scholar] [CrossRef]
- Tan, Y.; Liu, X.; Sun, H.; Zeng, C. Population ageing, labour market rigidity and corporate innovation: Evidence from China. Res. Policy 2022, 51, 104428. [Google Scholar] [CrossRef]
- Wang, X.-Q.; Chen, P.-J. Population ageing challenges health care in China. Lancet 2014, 383, 870. [Google Scholar] [CrossRef]
- Wang, S. Spatial patterns and social-economic influential factors of population aging: A global assessment from 1990 to 2010. Soc. Sci. Med. 2020, 253, 112963. [Google Scholar] [CrossRef] [PubMed]
- Singh, G.K.; Siahpush, M. Widening rural-urban disparities in life expectancy, U.S., 1969–2009. Am. J. Prev. Med. 2014, 46, e19–e29. [Google Scholar] [CrossRef] [PubMed]
- Wu, Y.; Song, Y.; Yu, T. Spatial differences in China’s population aging and influencing factors: The perspectives of spatial dependence and spatial heterogeneity. Sustainability 2019, 11, 5959. [Google Scholar] [CrossRef] [Green Version]
- Macia, E.; Cheve, D.; Montepare, J.M. Demographic aging and biopower. J. Aging. Stud. 2019, 51, 100820. [Google Scholar] [CrossRef] [PubMed]
- Luo, W.; Xie, Y. Economic growth, income inequality and life expectancy in China. Soc. Sci. Med. 2020, 256, 113046. [Google Scholar] [CrossRef] [PubMed]
- Acciai, F. The age pattern of social inequalities in health at older ages: Are common measures of socio-economic status interchangeable? Public Health 2018, 157, 135–141. [Google Scholar] [CrossRef] [PubMed]
- Park, J.-k.; Ryu, D.; Lee, K. What determines the economic size of a nation in the world: Determinants of a nation’s share in world GDP vs. per capita GDP. Struct. Chang. Econ. Dyn. 2019, 51, 203–214. [Google Scholar] [CrossRef]
- Costantini, M.; Paradiso, A. What do panel data say on inequality and GDP? New evidence at US state-level. Econ. Lett. 2018, 168, 115–117. [Google Scholar] [CrossRef]
- Marois, G.; Gietel-Basten, S.; Lutz, W. China’s low fertility may not hinder future prosperity. Proc. Natl. Acad. Sci. USA 2021, 118, e2108900118. [Google Scholar] [CrossRef]
- Suulamo, U.; Tarkiainen, L.; Remes, H.; Martikainen, P. Changes in regional variation in mortality over five decades-the contribution of age and socioeconomic population composition. SSM-Popul. Health 2021, 15, 100850. [Google Scholar] [CrossRef]
- Cheng, X.; Yang, Y.; Schwebel, D.C.; Liu, Z.; Li, L.; Cheng, P.; Ning, P.; Hu, G. Population ageing and mortality during 1990-2017: A global decomposition analysis. PLoS Med. 2020, 17, e1003138. [Google Scholar] [CrossRef]
- David, E.; Bloom, D.L.L. The global demography of aging: Facts, explanations, future. In Handbook of the Economics of Population Aging; North-Holland: Amsterdam, The Netherlands, 2016. [Google Scholar]
- Xin, M.; Chuliang, L.; Gustafsson, B.A.; Shi, L.; Sicular, T. What Determines Living Arrangements of the Elderly in Urban China? Inequality and Public Policy in China; Cambridge University Press: Cambridge, UK, 2008; pp. 267–286. [Google Scholar]
- Li, L.; Du, T.; Hu, Y. The effect of population aging on healthcare expenditure from a healthcare demand perspective among different age groups: Evidence from Beijing city in the people’s Republic of China. Risk Manag. Healthc. Policy 2020, 13, 1403–1412. [Google Scholar] [CrossRef] [PubMed]
- Deng, T.; Zhang, K.; Shen, Z.-J. A systematic review of a digital twin city: A new pattern of urban governance toward smart cities. J. Manag. Sci. Eng. 2021, 6, 125–134. [Google Scholar] [CrossRef]
- Yi, X.; Jue, W.; Huan, H. Does economic development bring more livability? Evidence from Jiangsu Province, China. J. Clean. Prod. 2021, 293, 126187. [Google Scholar] [CrossRef]
- Peeters, A.; Zude, M.; Käthner, J.; Ünlü, M.; Kanber, R.; Hetzroni, A.; Gebbers, R.; Ben-Gal, A. Getis–Ord’s hot- and cold-spot statistics as a basis for multivariate spatial clustering of orchard tree data. Comput. Electron. Agric. 2015, 111, 140–150. [Google Scholar] [CrossRef]
- Tillé, Y.; Dickson, M.M.; Espa, G.; Giuliani, D. Measuring the spatial balance of a sample: A new measure based on Moran’sIindex. Spat. Stat. 2018, 23, 182–192. [Google Scholar] [CrossRef] [Green Version]
- Dziauddin, M.F. Estimating land value uplift around light rail transit stations in Greater Kuala Lumpur: An empirical study based on geographically weighted regression (GWR). Res. Transp. Econ. 2019, 74, 10–20. [Google Scholar] [CrossRef]
- Brunsdon, C.; Fotheringham, A.S.; Charlton, M.E. Geographically weighted regression: A method for exploring spatial nonstationarity. Geogr. Anal. 1996, 28, 281–298. [Google Scholar] [CrossRef]
- Jun, M.-J.; Choi, K.; Jeong, J.-E.; Kwon, K.-H.; Kim, H.-J. Land use characteristics of subway catchment areas and their influence on subway ridership in Seoul. J. Transp. Geogr. 2015, 48, 30–40. [Google Scholar] [CrossRef]
- Cheng, L.; Chen, X.; De Vos, J.; Lai, X.; Witlox, F. Applying a random forest method approach to model travel mode choice behavior. Travel Behav. Soc. 2019, 14, 1–10. [Google Scholar] [CrossRef]
- Gan, Z.; Yang, M.; Feng, T.; Timmermans, H. Understanding urban mobility patterns from a spatiotemporal perspective: Daily ridership profiles of metro stations. Transportation 2018, 47, 315–336. [Google Scholar] [CrossRef]
- Li, R.; Krishna Sinniah, G.; Li, X. The factors influencing resident’s intentions on e-bike sharing usage in China. Sustainability 2022, 14, 5013. [Google Scholar] [CrossRef]
- Wang, T.; Wang, Y.; Zhao, X.; Fu, X. Spatial distribution pattern of the customer count and satisfaction of commercial facilities based on social network review data in Beijing, China. Comput. Environ. Urban Syst. 2018, 71, 88–97. [Google Scholar] [CrossRef]


| City | 2020 | 2010 |
|---|---|---|
| Nanjing | 13.70% | 9.20% |
| Wuxi | 14.65% | 9.50% |
| Xuzhou | 14.72% | 10.43% |
| Changzhou | 14.88% | 9.80% |
| Suzhou | 12.44% | 8.51% |
| Nantong | 16.20% | 16.50% |
| Lianyungang | 14.63% | 9.18% |
| Huai’an | 16.42% | 10.40% |
| Yancheng | 19.88% | 11.97% |
| Yangzhou | 19.99% | 12.45% |
| Zhenjiang | 17.51% | 10.36% |
| Taizhou | 22.01% | 14.24% |
| Suqian | 13.56% | 10.22% |
| Items | 2010 | 2020 |
|---|---|---|
| Bandwidth | 43.22 | 43.22 |
| Residual Squares | 0.48 | 0.342 |
| Effective Number | 5.01 | 5.011 |
| Sigma | 0.245 | 0.207 |
| AICc | 20.051 | 15.636 |
| R2 | 0.505 | 0.686 |
Publisher’s Note: MDPI stays neutral with regard to jurisdictional claims in published maps and institutional affiliations. |
© 2022 by the authors. Licensee MDPI, Basel, Switzerland. This article is an open access article distributed under the terms and conditions of the Creative Commons Attribution (CC BY) license (https://creativecommons.org/licenses/by/4.0/).
Share and Cite
Zhang, K.; Sun, H.; Li, X. Aging Population Spatial Distribution Discrepancy and Impacting Factor. Sustainability 2022, 14, 9528. https://doi.org/10.3390/su14159528
Zhang K, Sun H, Li X. Aging Population Spatial Distribution Discrepancy and Impacting Factor. Sustainability. 2022; 14(15):9528. https://doi.org/10.3390/su14159528
Chicago/Turabian StyleZhang, Ke, Hao Sun, and Xiangyu Li. 2022. "Aging Population Spatial Distribution Discrepancy and Impacting Factor" Sustainability 14, no. 15: 9528. https://doi.org/10.3390/su14159528