Article

Does Park Size Affect Green Gentrification? Insights from Chongqing, China

1
School of Economics and Management, Chongqing JiaoTong University, Chongqing 400067, China
2
School of Tourism and Service Management, Chongqing University of Education, Chongqing 400067, China
*
Author to whom correspondence should be addressed.
Sustainability 2022, 14(16), 9916; https://doi.org/10.3390/su14169916
Submission received: 30 May 2022 / Revised: 5 August 2022 / Accepted: 6 August 2022 / Published: 11 August 2022
(This article belongs to the Special Issue Social Challenges of Sustainable Development)

Abstract

:
International studies have shown that urban parks lead to rising residential prices and, consequently, gentrification effects. However, the studies on whether the size of the park drives gentrification are controversial. In this article, using the insight from Chongqing China, a hedonic price model is used to evaluate the influence of park size on residential prices, a geographically weighted regression model is employed to explore the spatial differentiation characteristics of park premiums, and a questionnaire survey is conducted to study residential socio-economic characteristics and attitudes toward green gentrification. We find that park premium is a strong predictor of gentrification, while park size is not. Most medium and large parks do not lead to green gentrification. The parks with high premiums that will lead to green gentrification are a small percentage of parks, only about 20% in Chongqing, China. Green gentrification in China is not due to the crowding out of low-income by middle- and high-income residents, but mainly due to the filtering of the real estate market. These findings provide new explanations for the relationship between parks and gentrification.

1. Introduction

Parks play an important role in improving ecosystem services, beautifying cities, and providing leisure and recreation places [1]. Researchers increasingly recognize that parks can stimulate investment and regional economic development. Many park projects are implemented partly with this goal, such as Central Park in New York and Birkenhead Park in Liverpool, UK [2]. However, the influence of parks on economic development has its drawbacks.
Parks can increase property values and drive out lower-income residents, triggering undesirable gentrification, which has been confirmed by more and more studies. Existing literature defines this phenomenon as green gentrification [3], ecological gentrification [4], or environmental gentrification [5]. We adopt the term “green gentrification” to describe this phenomenon. Similarly to other gentrification situations, green gentrification can produce social inequality and displacement of lower income residents [6]. City development planning faces a paradox. On the one hand, it is important to build or restore green spaces in low-income areas, especially those with poor access to parks [7]. On the other hand, doing so may trigger green gentrification, resulting in the displacement of the lower-income residents such projects were intended to benefit [8].
Not all parks result in green gentrification. Many studies indicate that larger parks are more likely to cause gentrification [9], while smaller parks do not trigger gentrification [10]. As a result, larger park projects are increasingly regarded as an unwelcome land-use category by low-income residents and ethnic minorities [11]. Some researchers have proposed “just green enough”, suggesting small parks for long-term residents to avoid environmental and social inequities. In contrast, Rigolon and Németh [12] concluded that park size is not a predictor of gentrification, the finding of which was confirmed by Pearsall and Eller [13]. Therefore, studying the relationship between park size and gentrification helps avoid residential differentiation and guides the spatial layout of cities.
Furthermore, green gentrification has been studied more in developed countries and less in developing countries such as China. China attaches importance to park development as evinced by urban planners increasing the number of parks 3.5-fold (5.6-fold in area terms) in the last 20 years. The newly built and expanded parks involve reorganizing and replacing many physical spaces, social economy, and population. Unlike other studies of the free market in private land ownership scenarios, Chinese cities are under public land tenure and subject to integrated urban planning. Our research in China allows us to provide an impactful and diverse sample of green gentrification.
The marginal contributions of our research include the following three aspects:
In terms of research scope, we extend from the applicability of specific isolated examples to cities. Green gentrification has been found primarily in specific parks in developed countries, and little research is available on whether this trend holds true on a broader scale and in other contexts. Therefore, the city of Chongqing, which is representative of Chinese cities, is used as an ideal case for analysis.
In terms of research methodology, we combine the quantitative research of green gentrification with a typical case investigation. The existing literature is still dominated by qualitative methods, but using it may not capture information on the broad changes caused by gentrification, such as changes in demographic characteristics, housing values, etc. Studies using quantitative methods alone cannot study the attitudes and impacts of gentrification on different participants. We can employ quantitative approaches to characterize the relationship between parks of different sizes and gentrification through large amounts of data, and use typical case investigations to obtain more information to elucidate the influence of gentrification on the different groups.
In terms of research findings, unlike other views in the literature, we argue that park premium is a strong predictor of green gentrification, while park size is not. This could explain the two opposing views on the relationship between park size and gentrification. Small park strategies may be inappropriate in China, where most large and medium parks do not result in gentrification, especially when surrounded by older housing. Green gentrification, which has been negatively evaluated in most studies, is more positively evaluated by residents in China because low-income residents are beneficiaries even if they are demolished.
Next, in Section 2 we review what is known about green gentrification. Thereafter, in Section 3, the study area, methodology, and data are described. In Section 4, the impact of different-sized parks on residential prices is analyzed using a hedonic price model, the spatial divergence of park premium is explored using a geographically weighted regression model, and then the socio-economic structural characteristics of residents and their attitudes toward green gentrification are studied using a questionnaire. Discussions are held in Section 5. A summary is presented in Section 6.

2. Literature Review

2.1. Theoretical Explanation of Green Gentrification Formation

There are two main theoretical explanations for the formation of green gentrification: the first focuses on demand and preference, and the second focuses on supply and capital. The view of demand side emphasizes gentrification as a result of middle-class preferences for park choices. Rigolon and Németh [12] argued that the improved quality of green environments may make the middle class willing to pay more to settle in these areas, thereby crowding out long-term, low-income residents.
In contrast, the view of supply side emphasizes capital, income classes, and land values, arguing that the process of gentrification is not initiated by consumer preferences, but rather by unintentional or intentional gentrification by producers. Loughran [14] argued that developers, government agencies, and others tend to favor the consumption habits of the middle class when establishing urban green projects, with little attention to the needs of diverse consumers, especially low-income groups. It has also been argued that the property premium from green investments allows developers to maximize profits through mid- to high-end property development [15,16].

2.2. Green Gentrification and Its Characteristics

In most studies, green gentrification is usually understood as the replacement of low-income residents in communities by high-income households and is always accompanied by an increase in house prices [17,18]. Therefore, the indicators for identifying and measuring green gentrification are also mainly considered from two aspects: demographic indicators and housing price indicators. Indicators of demographics include changes in income, race, age, education, and occupational status [19]. For example, the restoration of Prospect Park in Brooklyn, New York, led to a significant increase in new constructions in the surrounding areas and a shift in the racial and class composition of these areas toward a more affluent and white population [10]. Indicators of house prices are mainly the housing price premium obtained from urban parks. For example, Black et al. estimate the hedonic impact of the High Line’s implementation in New York City while also relating this new green space housing premium to the overarching social issue of eco-gentrification [20]. Chen et al. believe that residential neighborhoods proximate to such parks can command a premium in property values and rental prices [21]. Thus, the housing price premium from urban parks is referred to as park premium in our paper.

2.3. Research Methods

Research methods on the relationship between green gentrification and park size have mostly been qualitative, using interviews, field research, historical documentation, and media reports. Qualitative analyses can focus on the experiences of different local participants affected by gentrification and the psychological perception of shifting neighborhood network relationships [22,23]. However, qualitative analysis fails to capture changes caused by gentrification on a large scale.
Therefore, some studies have used census data to explore the applicability of the results between gentrification and park size in cities. They used methods such as correlation analysis and logistic regression [21]. However, relatively coarse census data cannot pinpoint the scope of the influence of parks. In addition, the gentrification of an area is influenced by multiple factors. Correlation and regression models using only socio-demographic characteristics and park attributes cannot eliminate other influences.
Hedonic price models are often used to estimate the strength of the influences of specific factors on commodity prices and to eliminate the influences of other factors. But the most basic assumption of hedonic price model is stationarity. There are differences in the premium between parks, so the hedonic price model is often used in the study of single and typical parks.
Combining the above studies, we use quantitative research and typical case investigation. The research mainly includes three stages. The first stage is the global regression, using the hedonic price model to explore the impact of parks of different sizes on residential prices. The second stage is the local regression, using the geographically weighted regression model to determine the difference of park premium in different geographical locations. Park premiums and different income classes are compared to reveal gradient differences in housing consumption. In the third stage, typical case investigations from quantitative results confirm the results of green gentrification and focus on residential attitudes. The park premium was linked with housing consumption, and compensated for the roughness of census data by using micro housing prices.

3. Data and Methodology

3.1. Research Area

Chongqing, China is chosen as the study area for this analysis due to three reasons. First, Chongqing is representative of China’s urban development and is the economic center of the west. Second, Chongqing’s parks are growing at a much faster rate than the national level, with the number of parks increased 8.8-fold and the area increased nearly 17-fold in the last 20 years. Third, Chongqing has implemented the concept of sustainable development to bring the social and ecological benefits of parks to all parts of the city.
Chongqing is a large area, close to that of a typical province of China. Chongqing consists of the central urban area and peripheral districts. The peripheral districts have a lot of farmland and natural forests, which are not part of our study. The central urban area is the core of the city, with an area of 5464 km2, accounting for 6.6% of the city, a resident population of 10.34 million, accounting for 32.3% of the city, and a GDP of RMB 104.73 billion in 2020, accounting for 41.9% of the city. Therefore, this research focuses on the central area of Chongqing.

3.2. Research Methods

3.2.1. Hedonic Price Model

The hedonic price model assumes that the combination of characteristic factors forms commodity prices and is widely employed to measure the strength and direction of the influences of distinct factors on commodity prices [24]. Residential price is affected by many factors and is a typical hedonic price. Among them, parks are an essential factor affecting residential prices. Therefore, a standard hedonic price model is applied, as shown in Equation (1):
lnP = α + β lnParks i + i = 1 n λ x i + ε
where P is the residential price; Parksi is the main variable of the study, and it includes different park size variables, xi represents the control variable, α, β, and λ are coefficients to be estimated, and ε is the random error term.

3.2.2. Geographically Weighted Regression Model

Geographically weighted regression model (GWR) allows spatial non-stationary data. There may be spatial heterogeneity in residential prices. Applying spatial factors to the model can intuitively reveal the spatial differentiation of park premiums. The model is expressed in Equation (2):
y i = β 0 ( u i , v i ) + k = 1 ρ β k ( u i , v i ) x i k + ε i
where yi is the residential price of the ith sample; (ui, vi) are the spatial geographic coordinates of the ith sample, βk (ui, vi) is the kth regression parameter on the ith sample.
In the GWR, each sample corresponds to a different weight matrix because the location of each sample is different. The double square function often used in empirical studies is used as the weighting function of GWR and is shown in Equation (3):
W ij = { [ 1 ( d ij b ) 2 ] 2 , d ij < b 0 , otherwise
where dij represents the distance between sample j and observed sample i; b is the bandwidth, which is an important parameter. The smaller the bandwidth, the faster the weight changes as the distance increases; on the contrary, the larger the bandwidth, the slower the weight changes. When the bandwidth is given, the weight of the sample farthest from sample i tends to 0. To determine the bandwidth, we use the AICc information criterion to determine the optimal bandwidth.

3.2.3. Typical Case Investigation

To corroborate the gentrification results and investigate residents’ attitudes toward green gentrification, we screened six parks with different premiums based on the GWR and conducted a questionnaire survey of their surrounding neighborhoods. There are three reasons to use questionnaires. First, questionnaires can determine the scope of the study, which is more accurate than census data. The smallest unit area of China’s census data is large, with a population of about 100,000. Using the questionnaire, there is no need to assume that the park is evenly distributed over the range of the census data. Second, the questionnaire survey can obtain indicators that are more representative than census data. For example, there is no “income” in the census data, but “income” is an important indicator of gentrification. Third, it is also possible to collect residents’ attitudes toward gentrification, which are not available using quantitative analysis methods and census data alone.

3.3. Residential Characteristics and Data Sources

In terms of the sample, we used residential communities. Residential community is a relatively closed and independent residential group separated by urban roads. It is a living mode in line with Chinese people’s lifestyle and living standards.
According to the relevant research of landscape on housing price premium [23,24,25] and data availability, we divided the residential characteristics variables into building characteristics, neighborhood characteristics, and location characteristics. Architectural characteristics include the age of the building and the presence of elevators. Neighborhood characteristics include property fee and greening rate. Location characteristics include distance to parks, distance to hospital, distance to river, distance to subway, and distance to bus stop. Referring to China’s urban green space classification standards, parks are divided into large parks (>20 ha), medium parks (2–20 ha), and small parks (<2 ha) according to their area. Our focus is on parks of different sizes, so these variables are taken out of the location characteristics and placed in the forefront. The variables are described and statistically summarized in Table 1.
In terms of data acquisition, residential transaction information from the China Real Estate Transaction Center is not published to the public, so most studies use listing information provided by commercial websites [23,25]. Information on residential prices, building characteristics variables, and neighborhood characteristics variables were collected during July 2021 from the Anjuke website(www.anjuke.com, accessed on 28 July 2021). The Anjuke website is the leading real estate rental and sales service website in China and contains a wealth of information on properties with extensive coverage. The geographic information of communities, parks, CBD, hospitals, rivers, subway stations, and bus stops are obtained from Gaode Map. The distance measurement is done by ArcGIS10.2 after the projection coordinate transformation in WGS84. A total of 4098 communities are included, and data pertaining to 3796 valid communities are obtained after eliminating abnormal and missing data (Figure 1).

4. Results

4.1. Phase I: The Global Regression

The results of Equation (1) are presented in Table 2, indicating an adjusted R2 of 0.694, which proves the validity of the model. The variance inflation factor (VIF) of each variable is between 1.067 and 2.288, which is much less than 10, indicating that there is no multi-collinearity. All variables are significant except for the distance to bus stop variable. The influence of the distance to bus stop on the residential price is not obvious. The reason for this is that the central urban area of Chongqing has convenient transportation with abundant bus stops, subways, cabs, etc. Therefore, the dependence on buses is low.
The results of Equation (1) imply that the biggest impact of parks on residential price is large parks, with an elastic coefficient of −0.037 (p < 0.01); followed by medium parks, with an elastic coefficient of −0.007 (p < 0.10); while small parks exhibit no influence.

4.2. Phase II: The Local Regression

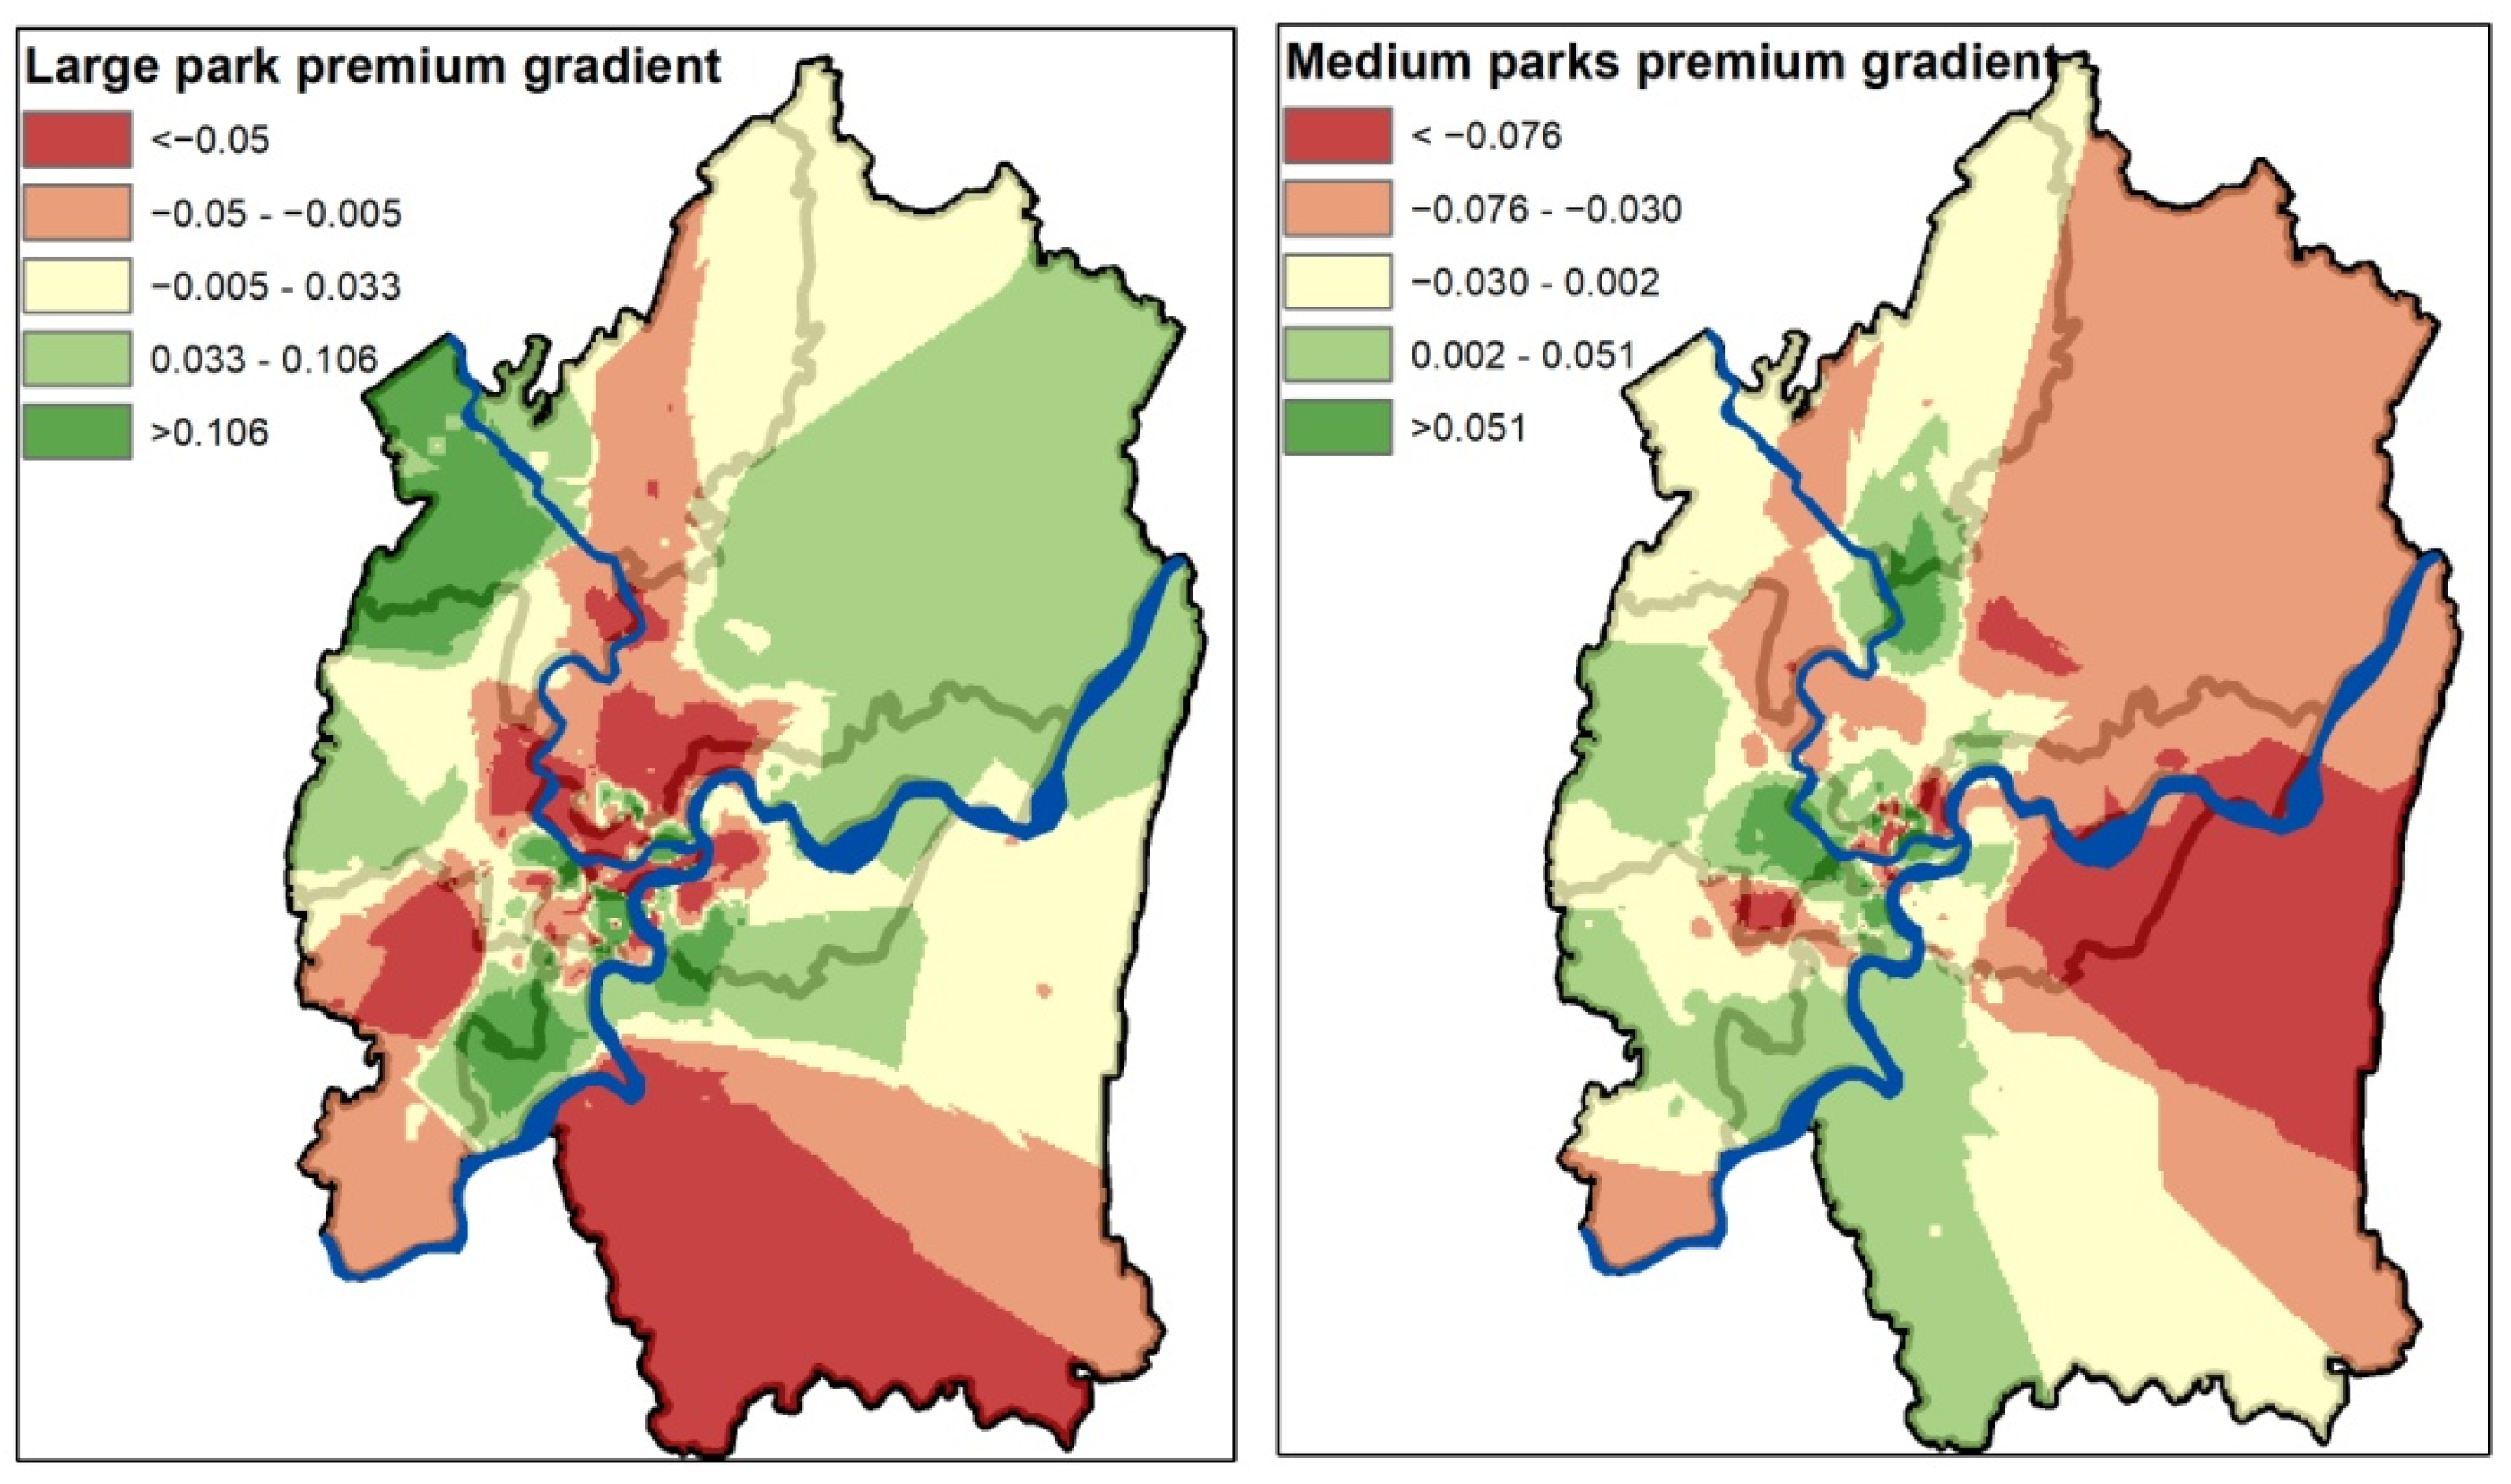
4.2.1. The Result of GWR

Using Moran’s I to detect the degree of spatial agglomeration of residential prices, based on the first K-nearest weight matrix, Moran’s I statistic for residential prices is 0.541 at the 99.9% level, and the Z-value is 52.197, which is greater than 2.58, indicating that residential prices show significant spatial positive correlation with significant regional spatial clustering.
Equations (2) and (3) are used to obtain the regression coefficients of park distance for each residential sample, as displayed in Table 3. The positive or negative regression coefficients represent the increase or decrease on residential prices, and the absolute magnitude represents the strength of the influence. The adjusted R2 increased to 0.811, indicating that the GWR improved the accuracy of this simulation.
Table 3 shows that the regression coefficients have directional differences at the upper and lower bounds, indicating that the park premiums vary spatially. In order to further study the spatially divergent characteristics, the spatial marginal role maps of large and medium parks are obtained by Kriging interpolation (Figure 2).
Large parks with high premium gradient are clustered in the central and northern parts of the central urban area. The central part is the origin and core of Chongqing city, with well-developed public facilities that are in the process of continuous renewal and renovation. The northern part is the key direction of the area’s development in the last decade or so. Under the “Chongqing to the North” policy, it now contains 70% (by area) of large park.
Medium parks with high premium gradient are clustered in newly developed areas, including Liangjiang New Area in the north, Chaoyuan New Area in the south, and Hi-Tech Development Zone and Huayan New City in the west. The newly developed areas are established by government-led efforts to open new spaces at the edge of the area and are important poles for economic growth.

4.2.2. Housing Affordability Differences Due to Park Premiums

Green gentrification is due to the difference in housing affordability brought about by parks. Therefore, it is possible to compare the additional housing expenses that can be afforded by different income classes with park premiums (Equation (4)):
Additional housing expenses = Income difference * Ratio of housing expenditure to income * Housing price to income ratio/per capita housing area
where income differential is the difference between the income grouping of all permanent residents in quintiles (data from Chongqing 2021 Statistical Yearbook), the ratio of housing expenditure to income is taken as 30% (that within 30% is a reasonable proportion, and that exceeding 30% is an excessive burden), the house price to income ratio is taken as 6 (a reasonable value thereof should be between 3 to 6, here we take the high value), and the housing floor area per resident is 39.66 m2 (data from Chongqing 2021 Statistical Yearbook). The results for additional housing expenses are listed in Table 4.
Park premiums are divided into three grades: high, low, and none, according to the results of GWR, using the natural breakpoint scoring method combined with significance. Residences within 1000 meters of a park were identified to compare park premiums to housing affordability for two main reasons. First, relevant research shows that the impact radius of a park on residential prices is about 1000 meters. For example, Black et al. used residences within 800 m of the U.S. Highline Park as the study radius [20]. Wu et al. show that the average effect radius of parks in Shenzhen can reach 1.73 km according to the ecology threshold theory [26]. Shi and Zhang have demonstrated that the maximum radius of the large park in Shanghai could reach 1.59 km [27]. Second, the absolute t-values of the park factor in the GWR results were significantly higher within 1000 m from the park. Based on the spatial weight matrix and the average number of neighbors of residences measured at the one-sided 90% significance level, the proportion of large parks in high premiums with absolute T-values >1.290 is 96.8% and the proportion of medium parks is 80.7%.
Therefore, we set dummy variables with communities that have a high premium of a large park, low premium of a large park, high premium of a medium park, or a low premium of a medium park within 1000 m. The marginal price of the park is calculated by the hedonic price model (Table 5).
Comparing Table 4 and Table 5, it is found that only the upper-middle and high-income groups can afford the high premium for parks. The additional affordable expenses for the upper-middle and high-income groups are RMB 600/m2 and RMB 1462/m2. The high premiums of large and medium parks are RMB 1461/m2 and RMB 597/m2, which are valid at the 99% level. The regression coefficient of low premium of large parks is not significant, indicating that the high average residential price is not due to parks; the middle- and lower-income groups can afford low premiums for medium and large parks.
Therefore, from the perspective of housing affordability, we believe that park premiums are a strong predictor of green gentrification, while park size is not. Park premiums are an accurate measure of the residential price factor attributable to the influence of a park. Many of the large and medium parks in the low and no-premium gradient do not cause differences in consumption.

4.3. Phase III: Typical Case Investigation

4.3.1. The Selection of Typical Parks

To confirm the argument that park premiums have a significant influence on green gentrification, six parks with high premium, low premium, and no premium are selected (Table 6). The conditions for selecting the park are: first, there are a certain number of residential communities around the park. In the sample, 33.3% of the large parks have no residential areas around 1000 m, and the proportion of the medium park is 20%. Second, according to the literature related to parks in Chongqing [28,29], parks with relatively high patronage and social influence were selected. The scope of the questionnaire survey is the residential communities within 1000 m of the park. We first investigated the gentrification characteristics of the residents, and then asked the residents about their perceptions and attitudes towards green gentrification.
Table 6 indicates that Sample 1 has the highest housing price, much higher than the full sample, mainly because the residences around Sample 1 are newer, with a mean age of only 4 years, and the area lies in the Yubei New District, which lies in the main direction of development in Chongqing. The second highest house prices appear in sample 5. It is located in the core area of Chongqing, which is also a typical old urban area. Therefore, the residential age gap is large and the standard deviation of residential price is large. The lowest of residential prices are in samples 3 and 6, which are far from the down-town area and contain the oldest residences.

4.3.2. Differences of Gentrification Indicators in Typical Community Samples

The existing literature suggests that indicators of gentrification characteristics include age, education, professional status, and income of residents, but not all characteristics are consistent with China. Most cities in China are predominantly Han Chinese and have no ethnic conflict. Therefore, we use four indicators of gentrification: age, educational attainment, professional status, and income. We conducted a questionnaire survey in August–October 2021 by random distribution; 420 questionnaires were distributed, and 394 valid questionnaires were returned; the key statistical data are listed in Table 7.
It is generally accepted that the lower the aging rate, the higher the level of education, the higher the professional status, and the higher the income, the more gentrified a region [21,30]. The age distribution shows that aging rates in samples 1, 4, and 5 are low and lower than the average of the central urban area of Chongqing. The level of education implies that samples 1, 4, and 5 are highly educated. In terms of professional status, samples 1, 4, and 5 are mostly engaged in management and professional-technical jobs, with a proportion of about 40% and more in respected occupations. In terms of income levels, residents in samples 1, 4, and 5 have high-income levels. Therefore, we conclude that samples 1, 4, and 5 are highly gentrified, while sample 2 is at the average level, while samples 3 and 6 are below the average level.
This corroborates that green gentrification is related to park premiums and not to park size. Gentrification occurs around the parks of samples 1 and 4 with high premiums, and no gentrification appears around the parks of samples 3 and 6 without premiums.
Low park premiums do not bring about a difference in the ability to pay and thus do not trigger gentrification. Sample 2 does not trigger gentrification, but sample 4 with a low premium demonstrates gentrification. A further study found that samples 2 and 4 differ in the purpose of construction of the park.
The park in sample 2 was built by the government, and the developer purchased a piece of land to build a residential community. However, sample 5 is where a developer acquired a large piece of land and then built a park. The park was built for the purpose of land appreciation around it. In sample 5, the developer developed high-end residential projects according to the advantages of the park, with an average price of RMB 19,673/m2, to maximize profits. In addition, there is a large variation in house price in the area representing sample 5, with a high of 26,029 and a low of 8299, a difference of RMB 17,730/m2. This suggests that high and low incomes are mixed, and that the park may not crowd out low-income people.

4.3.3. Residents’ Perceptions and Attitudes towards Green Gentrification

Gentrification has been studied more in the west, and it is necessary to study whether green gentrification is perceived in China and how residents’ attitudes arise thereto, so we conducted a survey on a five-point scale, the results of which are summarized in Table 8.
The residents’ perception of green gentrification is low. The residents’ recognition of parks to improve quality of life shows a high level. This reflects the residents’ identification with parks as providing public well-being in modern cities. The recognition of residential price increases by parks is high. The view that parks have a positive influence on residential prices is well established, although there are differences in residential perceptions and statistics pertaining thereto. The recognition of parks that can lead to gentrification has a low level. This may be because Chongqing has little large-scale residential differentiation, with upscale communities often presenting as collage-like and embedded in the urban.
Residential concerns about green gentrification are low. The level of concern about the discriminated against by the residents of the upscale communities around is low. This is because the scope of residential activities is mainly enshrined in the community, and there are few connections between communities. Moreover, Chongqing is a very inclusive city and will not discriminate against outsiders or low-income people. The level of concern about being relocated is low. This is because relocation can be highly compensated. The attitude of the residents has changed from fear to hope for relocation. Even though low-income residents have been relocated to more remote areas, they still have faith in the government’s urban development.

5. Discussion

Why is the park premium a strong predictor of green gentrification? Many studies believe that gentrification can be measured by the fact that housing prices are significantly higher than the community average [20,31]. This is from the perspective of housing affordability. From this perspective, we believe that park premium is a strong predictor of green gentrification. Only high premiums for large and medium parks lead to residential consumption differences, but the proportion of high-premium parks is low, at around 20%. Many of the large and medium parks in the low and no-premium gradient do not cause differences in consumption. Park size is not a strong predictor of green gentrification.
Park premiums vary by park size. Park premiums vary because of scarcity, according to the theory of supply and demand. In modern cities, larger parks are scarcer, because land is scarce and expensive. The percentage of communities with a large park within 1000 m was 7.6%, 39.7% with a medium park, and 42.2% with a small park. Large parks are rarest, followed by medium and small parks. As a result, large parks command the highest premium, followed by medium parks. The premium attached to small parks is not significant. This is because China requires a standard greening rate of no less than 35% in residential communities, and small parks are virtually indistinguishable from greening in residential communities. This means that there is no way for small parks to filter low-income people through the housing market. Therefore, we believe that small parks have no impact on green gentrification, which is consistent with many studies [6,10].
Park premiums vary in space. There are three reasons. The first reason is the location of the park according to GWR analysis. High park premiums are concentrated in important areas with high land prices and few large and medium parks. Low premiums are in suburban areas with cheap land and many parks. Parks without premiums are far from residential communities and have poor accessibility. The second reason is the purpose of park construction according to the typical case investigation. The purpose of park construction is to promote the land appreciation and regional development of the area. With such a purpose, there is a large amount of land to be developed around the park. This also makes it easy for real estate developers to upgrade their residences and make more profits. The third reason is the age of the residences around the park, according to the hedonic price model analysis. Calculations found that large and medium parks do not have a significant influence on the price of older residential communities, where large parks do not exert a significant influence on those older than 18 years, and medium parks on those older than 14 years. However, it was not found that the younger the resident, the higher the premium. This is because older communities have a poor living experience, and living near a park is not a rigid need at the moment.

6. Conclusions

This study advances previous empirical research on green gentrification by arguing whether the size of parks affects the gentrification. We collected the data of 3796 residential communities in the central urban area of Chongqing, used the hedonic price model to evaluate the impact of different park sizes on residential prices, used the GWR to explore the spatial differences in park premiums, and obtained 396 valid questionnaires. The main conclusions are outlined below.
Park premium is a strong predictor of gentrification, while park size is not. Park premiums are the expression of social and economic judgments about park value in residential prices. Large and medium parks have a significant influence on residential prices, while small parks have no influence. This could explain why most studies argue that larger parks are more likely to cause gentrification [6,9], mainly because larger parks bring a significant premium on residential prices. It could also explain the studies arguing that gentrification is not related to park size but to location [12], because parks in good locations command a higher premium. Parks close to down-town areas have significant premiums, while parks further away, although often larger, are not surrounded by residential communities and do not have significant premiums.
Green gentrification in China is due to the filtering of the real estate market, rather than being crowded out by middle- and upper-income groups. Old residences, due to poor living experience, will not be purchased by the middle class. Therefore, the park premium near these old residences is generally low. And the high-premium parks that trigger green gentrification are located close to down-town, the direction of urban development and newly developed areas. These areas are used by developers to build upscale communities, either intentionally or unintentionally. However, the proportion of these high premium parks is low, only 20% in Chongqing, China. This finding challenges one of the “just green enough” strategies specific to urban green space [6], where large parks do trigger green gentrification. We believe that most large and medium parks will not lead to gentrification.
The park-induced gentrification phenomenon has a low perception and positive attitude among residents in China. Low-income people are also beneficiaries of the park. If they are demolished by the government, they are willing due to the huge compensation benefits they receive. This is different from the view that “green gentrification” is harmful to low-income people. Even if high-grade and low-grade residential areas are mixed, gentrification has little influence on residents’ sense of psychological security, because the community is the main sphere of life for residents and the city is harmonious.
The limitations of our study provide avenues for future research. First, we argued that park size is not an important predictor of gentrification, while park premiums are. However, park premiums are influenced by those factors and the interaction with residential characteristics needs further study. Second, our study describes gentrification as a phenomenon of rising house prices. However, changes in neighborhoods and community belonging can also exert a significant influence on long-term residents’ sense of place. Future research should build on multi-dimensional quantitative studies to reveal the results of gentrification more accurately.

Author Contributions

Project administration, W.M.; Supervision, S.H.; Writing – original draft, B.W. All authors have read and agreed to the published version of the manuscript.

Funding

This study was supported by the Major Project of Chongqing Social Science Planning (Grant No. 2021ZDSC06) and the Science and Technology Research Program of Chongqing Municipal Education Commission (Grant No. KJQN202101613).

Conflicts of Interest

The authors declare no conflict of interest.

References

  1. Du, Y.; Zhao, R. Research on the Development of Urban Parks Based on the Perception of Tourists: A Case Study of Taihu Park in Beijing. Int. J. Environ. Res. Public Health 2022, 19, 5287. [Google Scholar] [CrossRef]
  2. Crompton, J.L. The role of the proximate principle in the emergence of urban parks in the United Kingdom and in the United States. Leis. Stud. 2007, 26, 213–234. [Google Scholar] [CrossRef]
  3. Gould, K.A.; Lewis, T.L. Green Gentrification: Urban Sustainability and the Struggle for Environmental Justice; Routledge: London, UK, 2016. [Google Scholar] [CrossRef]
  4. Dooling, S. Ecological gentrification: A research agenda exploring justice in the city. Int. J. Urban Reg. Res. 2009, 33, 621–639. [Google Scholar] [CrossRef]
  5. Pearsall, H. From brown to green? Assessing social vulnerability to environmental gentrification in New York City. Environ. Plan. C Gov. Policy 2010, 28, 872–886. [Google Scholar] [CrossRef]
  6. Wolch, J.R.; Byrne, J.; Newell, J.P. Urban green space, public health, and environmental justice: The challenge of making cities ‘just green enough’. Urban Plan 2014, 125, 234–244. [Google Scholar] [CrossRef] [Green Version]
  7. Sister, C.; Wolch, J.; Wilson, J. Got green? Addressing environmental justice in park provision. GeoJournal 2010, 75, 229–248. [Google Scholar] [CrossRef]
  8. Isabelle, A. From Toxic Sites to Parks as (Green) LULUs? New Challenges of Inequity, Privilege, Gentrification, and Exclusion for Urban Environmental Justice. J. Plan. Lit. 2016, 31, 23–36. [Google Scholar] [CrossRef]
  9. Immergluck, D. Large redevelopment initiatives, housing values and gentrification: The case of the Atlanta Beltline. Urban Stud. 2009, 46, 1723–1745. [Google Scholar] [CrossRef] [Green Version]
  10. Curran, W.; Hamilton, T. Just green enough: Contesting environmental gentrification in Greenpoint, Brooklyn. Local Environ. 2012, 17, 1027–1042. [Google Scholar] [CrossRef]
  11. Kwon, Y.; Joo, S.; Han, S.; Park, C. Mapping the distribution pattern of gentrification near urban parks in the case of Gyeongui Line Forest Park, Seoul, Korea. Sustainability 2017, 9, 231. [Google Scholar] [CrossRef] [Green Version]
  12. Rigolon, A.; Németh, J. Green gentrification or ‘just green enough’: Do park location, size and function affect whether a place gentrifies or not? Urban Stud. 2020, 57, 402–420. [Google Scholar] [CrossRef]
  13. Pearsall, H.; Eller, J.K. Locating the green space paradox: A study of gentrification and public green space accessibility in Philadelphia, Pennsylvania. Urban Plan 2020, 195, 103708. [Google Scholar] [CrossRef]
  14. Loughran, K. Parks for profit: The high line, growth machines, and the uneven development of urban public spaces. City Community 2014, 13, 49–68. [Google Scholar] [CrossRef]
  15. Checker, M. Wiped out by the “greenwave”: Environmental gentrification and the paradoxical politics of urban sustainability. City Soc. 2011, 23, 210–229. [Google Scholar] [CrossRef]
  16. Anguelovski, I.; Connolly, J.J.T.; Masip, L.; Pearsall, H. Assessing green gentrification in historically disenfranchised neighborhoods: A longitudinal and spatial analysis of Barcelona. Urban Geogr. 2017, 39, 458–491. [Google Scholar] [CrossRef]
  17. Cole, H.V.; Triguero-Mas, M.; Connolly, J.J.; Anguelovski, I. Determining the health benefits of green space: Does gentrification matter? Health Place 2019, 57, 1–11. [Google Scholar] [CrossRef]
  18. Dong, H. Rail-transit-induced gentrification and the affordability paradox of TOD. J. Transp. Geogr. 2017, 63, 1–10. [Google Scholar] [CrossRef]
  19. Hwang, J. The social construction of a gentrifying neighborhood: Reifying and redefining identity and boundaries in inequality. Urban Aff. Rev. 2016, 52, 98–128. [Google Scholar] [CrossRef]
  20. Black, K.J.; Richards, M. Eco-gentrification and who benefits from urban green amenities: NYC’s high Line. Landsc. Urban Plan. 2020, 204, 103900. [Google Scholar] [CrossRef]
  21. Chen, Y.; Xu, Z.; Byrne, J.; Xu, T.; Wang, S.; Wu, J. Can smaller parks limit green gentrification? Insights from Hangzhou, China. Urban For. Urban Green. 2021, 59, 127009. [Google Scholar] [CrossRef]
  22. Goossens, C.; Oosterlynck, S.; Bradt, L. Livable streets? Green gentrification and the displacement of longtime residents in Ghent, Belgium. Urban Geography 2020, 41, 550–572. [Google Scholar] [CrossRef]
  23. Liu, G.; Wang, X.; Gu, J.; Liu, Y.; Zhou, T. Temporal and spatial effects of a ‘Shan Shui’ landscape on housing price: A case study of Chongqing, China. Habitat Int. 2019, 94, 102068. [Google Scholar] [CrossRef]
  24. Wen, H.; Xiao, Y.; Zhang, L. Spatial effect of river landscape on housing price: An empirical study on the Grand Canal in Hangzhou, China. Habitat Int. 2017, 63, 34–44. [Google Scholar] [CrossRef]
  25. Wen, H.; Zhang, Y.; Zhang, L. Assessing amenity effects of urban landscapes on housing price in Hangzhou, China. Urban For. Urban Green. 2015, 14, 1017–1026. [Google Scholar] [CrossRef]
  26. Wu, J.; Wang, M.; Li, W.; Peng, J.; Huang, L. Impact of Urban Green Space on Residential Housing Prices: Case Study in Shenzhen. J. Urban Plan. Dev. 2014, 141, 05014023. [Google Scholar] [CrossRef]
  27. Shi, Y.S.; Zhang, R. Temporal-spatial impact effects of large-scale parks on residential prices: Exemplified by the Huangxing Park in Shanghai. Geogr. Res. 2010, 29, 510–520. [Google Scholar] [CrossRef]
  28. Ren, H.; Zhen, K.L. Capitalized effect and spatial heterogeneity of parks: Taking Chongqing for example. Urban Probl. 2019, 38, 78–84. [Google Scholar] [CrossRef]
  29. Liu, Y.; Hu, J.; Yang, W.; Luo, C. Effects of urban park environment on recreational jogging activity based on trajectory data: A case of Chongqing, China. Urban For. Urban Green. 2022, 67, 127443. [Google Scholar] [CrossRef]
  30. Haase, D.; Kabisch, S.; Haase, A.; Andersson, E.; Banzhaf, E.; Baró, F.; Brenck, M.; Fischer, L.K.; Frantzeskaki, N.; Kabisch, N.; et al. Greening cities—To be socially inclusive? About the alleged paradox of society and ecology in cities. Habitat Int. 2017, 64, 41–48. [Google Scholar] [CrossRef]
  31. Landis, J.D. Tracking and explaining neighborhood socioeconomic change in US metropolitan areas between 1990 and 2010. Hous. Policy Debate 2016, 26, 2–52. [Google Scholar] [CrossRef]
Figure 1. Study area which contains 348 parks and 3796 communities.
Sustainability 14 09916 g001
Figure 2. Distribution results including large park and medium park premiums.
Sustainability 14 09916 g002
Table 1. Variable description and statistical information.
CategoryVariableDescriptionMeanStandard Deviation
Dependent variableResidential priceAverage price of residential quarters (RMB/m2)12,7534006
Independent variable
Distance to parksDistance to large parksDistance to the nearest large park (m)31081890
Distance to medium parksDistance to the nearest medium park (m)15011377
Distance to small parksDistance to the nearest small park (m)1318924
Control variables
Building characteristicsResidence ageYear from when the residence community was built (year)13.266.39
Elevator1 = With elevator, 0 = otherwise0.770.42
Neighborhood characteristicsProperty feeProperty fee of the community (RMB/m2 per month)1.480.94
Greening rateGreening rate of the community (%)0.320.08
Location characteristicsDistance to CBDDistance to the nearest central business district (m)81688980
Distance to hospitalDistance to the nearest third-class hospital (m)50375358
Distance to riverDistance to Yangtze and Jialing rivers (m)32793268
Distance to subwayDistance to the nearest subway station (m)11732011
Distance to bus stopDistance to the nearest bus stop (m)480701
Table 2. Basic results of the hedonic price model.
CategoryVariableCoefficientt-StatisticVIF
Constant term10.986 ***147.471
Distance to the parkLog Distance to large park−0.034 ***−6.8511.222
Log Distance to medium park−0.007 *−1.6981.228
Log Distance to small park−0.004−0.9691.149
Building characteristicsLog residence age−0.071 ***−12.0572.288
elevator0.347 ***44.2411.415
Neighborhood characteristicsLog property fee0.166 ***21.8022.113
Log greening rate0.047 ***4.6821.067
Location characteristicsLog distance to CBD−0.033 ***−10.3841.731
Log distance to hospital−0.052 ***−14.5961.765
Log distance to river−0.023 ***−7.6581.476
Log distance to subway−0.066 ***−15.9761.494
Log distance to bus stop−0.001−0.3131.275
Adjusted R2 0.694Mean VIF1.519
Notes: *** represents p < 0.01, * represents p < 0.1.
Table 3. Basic results of GWR.
VariableMinimumMaximumMeanStandard
Log distance to large park−0.6840.823−0.0010.102
Log distance to medium park−0.4070.557−0.0120.062
Log distance to small park−0.6200.597−0.0130.056
Adjusted R20.811
Table 4. Income quintile groupings and differentials of Chongqing residents.
Income Quintiles of Permanent ResidentsLow IncomeLower–Middle IncomeMiddle IncomeUpper–Middle IncomeHigh Income
Annual income (RMB/year)966017,19526,02339,25171,467
Differential 7535882813,22832,216
Bear additional annual cost of housing for different levels (RMB/m2) 3424016001462
Table 5. Marginal appreciation of parks to residential prices.
Park Size and PremiumsLarge ParksMedium Parks
High PremiumsLow PremiumsHigh PremiumsLow Premiums
Percentage of parks22.64%26.42%14.13%38.04%
Average residential price17,16214,71513,56712,821
Regression coefficient0.143 ***0.024 (Insignificant)0.044 ***0.028 ***
Coefficient of semi-elasticity (%)14.3%2.4%4.4%2.8%
Marginal appreciation (RMB/m2)2454353597359
Notes: *** represents p < 0.01.
Table 6. Summary of park premiums and residential communities.
Park SizeLarge ParksMedium Parks
Park Premium GradeHigh PremiumLow PremiumNo PremiumHigh PremiumLow PremiumNo Premium
Park nameZhimushan Forest ParkCaiyun Lake National Wetland ParkShuanglong Lake ParkMu Xian Lake Wetland ParkRong Qiao ParkSmiley Park
Sample number123456
Park area (ha)2871363212119.5
Number of residential communities within 1 km (pcs)91711201715
Park premium on average−0.08−0.03None−0.08−0.03None
Average price of residential community (RMB/m2)24,011
(2167)
13,491
(2049)
9299
(2395)
14,924
(4095)
16,064
(5128)
7592
(1732)
Average age of residential community (year)4(1)12(5)16(5)10(4)11(6)15(5)
Note: The standard deviation is in “()”.
Table 7. Survey of residents’ gentrification characteristics.
Sample Number123456Average of the
Central Urban Area
Age distribution
Ages 18–3521%23%19%29%23%19%24%
Ages 35–6057%47%42%45%53%41%47%
Ages 60 and above22%30%39%26%24%41%29%
Educational level
College and above43%37%28%40%48%25%35%
High school19%24%23%22%21%22%21%
Junior high school and below36%39%48%39%30%53%44%
Professional status
Managers of enterprises and institutions9%3%0%5%6%0%2%
Professional, technical, clerical staff40%20%9%31%36%11%13%
Service workers, general workers, etc.17%41%47%29%21%47%46%
Non-economically active persons33%37%44%35%36%42%38%
Payable income per capita
More than 80 k33%19%6%25%30%5%
60 k–80 k28%25%16%31%33%13%
40 k–60 k19%24%30%25%18%34%
20 k–40 k16%24%31%14%14%30%
≤20 k3%9%17%6%5%19%
Note: Average data from Chongqing Statistical Yearbook in 2021.
Table 8. Perceptions and attitudes of green gentrification.
Sample Number123456
Recognition of parks to improve quality of life4.34.24.43.83.73.7
Recognition of residential price increases by parks4.13.74.23.53.33.4
Recognition of parks leading to gentrification2.21.71.21.71.81.3
Discriminated against by the residents of the surrounding high-end houses1.01.11.51.31.41.3
Concerns about being relocated due to parks2.01.92.02.21.72.1
Publisher’s Note: MDPI stays neutral with regard to jurisdictional claims in published maps and institutional affiliations.

