Abstract
This study reviewed data from 1350 Clean Development Mechanism (CDM) project design documents for the energy industry; these projects were registered with the United Nations Framework Convention on Climate Change from the European Union Emissions Trading System’s second period (December 2012) to the present. This paper contributes to the literature on the energy industry in that it was the first attempt to directly estimate the issuance price based on CDM PDD data. This study extracted and databased effective samples for investment analysis. In addition, carbon emissions pricing analysis in the energy industry (which has the highest proportion in the CDM sector) was conducted to demonstrate which factors, including renewable energy technology, contribute to changing the investment cost per unit of carbon emissions. Cluster analysis shows that business methods and size are unimportant for classifying clusters; after multiple regression analysis, the technology variable was determined to affect investment cost. The issued price was low, in the order of biomass, wind power, hydropower, and waste heat management technology. The empirical results show that biomass technology has the highest investment efficiency, and the carbon emission issuance price of biomass technologies is lower than that of wind and solar technologies, which the Korean government is investing in actively. Therefore, if by-products and natural resources in rural areas are recycled or reused as biomass raw materials, costs can be reduced and linked to rural regeneration channels.
1. Introduction
The acceleration of global warming has promoted the international community’s perception of the need for emergency measures for an urgent climate crisis. Through the World Risk Report 2020, the World Economic Forum selected “climate action failure” as the most significant risk affecting humankind; the UN Secretary-General warned of a more profound environmental emergency than the COVID-19 crisis in a message marking the 50th anniversary of Earth Day, urging decisive action for global protection [1,2,3,4]. The Paris Agreement became effective in 2016, and all agreeing have set and implemented voluntary greenhouse gas reduction goals. Leading global companies, such as Microsoft and Nestle, devised measures to neutralize carbon in 2020, followed by national plans to implement carbon neutrality by 2050 in major countries (China until 2060) [5,6,7]. Furthermore, in connection with the Paris Agreement, the C40 (Cities Climate Leadership Group) required local governments from each country to establish and present a 2050 carbon neutrality vision and plan by 2020 [8].
Currently, the international community is responding to climate change by introducing a market-based greenhouse gas reduction system and technology, which reflects the cost of climate change in the cost of goods or services and determines the price of emission rights through the supply and demand of carbon emission rights. This mechanism is referred to as the Kyoto mechanism because it was agreed upon internationally in the Kyoto Protocol [9]. In Article 25 of the Enforcement Decree of the Framework Act on Low Carbon Green Growth announced in December 2019, South Korea declared reducing its 2030 greenhouse gas reduction target by 24.4% compared to 2017 based on Business as usual. The country added that it would limit emissions to 536 million tons by 2030 [10]; however, according to a European climate change organization report, Korea’s Nationally Determined Contribution (NDC) is insufficient to prevent global temperature increases, and Korea needs transformational contributions in all sectors, not gradual changes. The South Korean government is under pressure to reach a level consistent with the Paris Agreement, saying that the current reduction should be more than doubled [11]. Therefore, the Korean government has pledged to raise the NDC by the end of 2021, announcing that it would reduce the NDC by 40% compared to the emissions peak in 2018 [12].
The Clean Development Mechanism (CDM) project is defined in Article 12 of the Kyoto Protocol. Annex I includes the achievement (emission credit) realized by developed countries (Annex I countries) through providing technology and funds for implementing greenhouse gas reduction projects to non-Annex I countries (developing countries). The system can be used to achieve the reduction targets assigned to developed countries [13]. Through the CDM project, developed countries acquire a carbon emission rights (CER) that can be used to achieve their reduction goals, and developing countries can contribute to their sustainable development by receiving technology and financial support from developed countries. The emission market plays an auxiliary role in the allowance market, and CER and ERU (emission rights for JI projects) are usually formed at relatively lower prices than the EUA (EU Allowance). They are considered alternatives to achieving mandatory compliance [14]. In the case of CERs, this study’s subject of analysis, the obligation to reduce greenhouse gas emissions was fulfilled as much as the CERs issued in the CDM project registered before 2012. CERs could be traded in the emission market; however, in the 3rd European Union Emissions Trading System (EU–ETS) (2013–2020), only CERs acquired in the least-developed countries were restricted. Meanwhile, the United Nations Framework Convention on Climate Change (UNFCCC) plans to make CERs irreplaceable to the mandatory allowance in the 4th EU–ETS (2021–2030); it is expected to be somewhat flexible if it enters the mandatory reduction period [15,16].
CERs are divided into sCER (secondary CER) and pCER (primary CER) in the international carbon market; they enter the distribution stage after issuance. When a company implements a greenhouse gas reduction project and registers with the UNFCCC, the emission right certified as the final certification reduction is called pCER; this pCER is called sCER for emission rights traded in the secondary market, i.e., the exchange market or over-the-counter market. Therefore, the difference between pCER and sCER prices can be regarded conceptually as the marketing margin of companies participating in the emission market [17]. Unlike pCER, sCER does not have a risk of acquisition, and EUA and sCER theoretically have the same price as when operators utilize EU–ETS compliance; however, CER differs by country and phase, and EU–ETS recognizes credit usage up to 13.5% of total emissions. Korea’s maximum ratio is limited to 10%, lowering the CER exchange value.
Existing research on carbon prices and economic analysis of carbon reduction projects has been conducted primarily by identifying dynamic price analysis between trading products (EUA and CER) and exchanges or pricing factors by the CDM project sector [18,19,20]. Mo et al. (2005) [18] tested the law of one price using the price data of all operations (vintage) traded for Nord Pool and EU–ETS, which trade the same product, called carbon emission rights. As a result of the cointegration test, the law of one price was established between the two markets. Causality analysis revealed that EU–ETS led the price of the Nord Pool exchange and influenced the movement of Nord Pool prices [18].
Kim and Park (2008) [19] combined the vector error correction model and graph theory using price data from the EU carbon emission market to empirically analyze the discovery process of emission credit prices between major markets and the causality between markets. They found that all emission exchanges in the EU are organically connected directly or indirectly through any route, whether it is a simultaneous causal relationship in terms of price information flow or a time lag. In particular, the role of the Nord Pool leading market in absorbing and channeling information in the price discovery process and the influence of major power exchanges, such as Powernext and the European Energy Exchange, played a significant role [19].
Park and Cho (2013) [14] analyzed the price influencing factors between the allocation emission credit (EUA) and the offset emission credit (sCER) for the entire period of the EU–ETS phase 2 (2008–2013). They analyzed the factors that determine the spread between the two units, finding that the EUA and sCER are affected in similar directions concerning energy and economic variables, such as coal price (-) and financial crisis (-). Furthermore, they found that policy variables, such as power price, CER usage restrictions, and price differences between EUA and ERU, are affected in different directions [14]. Lim and Yang (2008) published the results of the issuance price of carbon emission credits (CER) and the level of the investment break-even point. The results were analyzed using past survey data (CDM Project Design Document, PDD) conducted between April 2000 and June 2006, and there were only about 40 CDM project methodologies [20]. In other words, many CER supplies were issued when the issuance price differed significantly from the company’s marginal abatement cost (MAC) because economic analyses were conducted initially when the carbon market grew insufficiently. Therefore, the results of the CER issuance price and the CDM project’s investment branching point at the time of the study cannot explain the current situation where the carbon market has entered a growth phase through an initial learning effect.
This study aims to provide information on the market to business entities that inevitably must reduce greenhouse gas emissions when Korea is obligated to reduce greenhouse gas from the EU–ETS phase under the Paris Climate Change Convention. Future investors in the CDM project, represented by investors, business operators, and mandatory reduction companies, invest a certain amount in the related greenhouse gas reduction project (environmental facility investment). Carbon credits (CER) represent the final output from the reduction project, and it is essential to understand the projected sales before going to market. This becomes a project value, and investment entities are bound to face the following problems in decision making. The current market price (sCER) can be obtained through the market’s transaction price, but the issuance price (pCER) can only directly estimate the investment cost of the CDM project. Therefore, decision makers must prepare for the CDM project and determine the appropriate level of issuance price until CERs, the final product of business activities, are issued. In addition, an analysis that distinguishes CDM projects with similar attributes can be helpful information for investors’ decision making. Specifically, this study reviewed 1350 CDM project plan data in the energy industry sector registered with the UNFCCC from when the EU–ETS phase 2 ended in December 2012 until now. The research then extracted effective samples for investment analysis and converted them into databases. After analyzing the determinants of the investment cost of the CDM project in the energy industry sector, an empirical analysis was conducted on which factors, including renewable energy technology, act to raise or lower the issuance price per unit of carbon emission credits.
This study provides theoretical knowledge for CDM project development, achieving “2050 carbon neutral” and implementing the “New and Renewable Energy 3020 Implementation Plan” with companies participating in the GHG target management system, including companies preparing for the CDM project. This study hopes to provide helpful information for the relevant policy authorities. In particular, greenhouse gas reduction projects must presuppose companies’ voluntary and competitive participation. From this perspective, it is significant to analyze the factors affecting the investment cost of the CDM project for future mandatory reduction companies that assume risk factors, such as irreversibility of investment and uncertainty in carbon credit prices.
2. Current Status of CDM Project in the Energy Industry Sector
As of June 2021, 7854 CDM projects were registered on the UNFCCC website, with the energy industry (No. 1) accounting for the highest proportion by sector [21]. The number of energy industry sectors subject to this study was 6601 (84.05%), the most among all CDM project sectors (Table 1).

Table 1.
CDM project registration status.
Table 2 summarizes the project registration status of the energy industry sector. Regarding CDM projects registered by country in the energy industry sector, China has the most CDM projects with 3536 (53.57%), followed by India with 1444 (21.88%), Vietnam with 244 (3.70%), Brazil with 219 (3.32%), other countries with 1080 (16.36%), and Korea has 78 (1.18%) so far (Table 2).
Table 2.
Current status of CDM project registration in the energy industry sector by country, size, and classification.
The market share by project size consists of 3995 (60.52%) large-scale projects and 2606 (39.48%) small-scale projects. According to the participating countries’ standards, 4668 (70.72%) bilateral CDM projects, representing developed countries developing and hosting CDM projects from developing countries, and 1933 (29.28%) unilateral CDM projects are implemented in developing countries without developed country participation (Table 2).
As of May 2020, there were 7829 CDM project registrations, and the total number of CDM project registrations increased by only 25 over the past year; this increase is significantly dropping compared to the early CDM project registrations. The market mechanism’s detailed implementation rules, Article 6 of the Paris Agreement concluded at the UN climate change conference (COP21), did not reach an agreement at the COP25 in December 2019. Unlike the Kyoto Protocol mechanism, where only developed countries (Annex I countries) participated in greenhouse gas reduction, developing countries (Annex I countries) must also respond to climate change. The discussion was to be finalized at the 26th United Nations Conference of Parties (COP26, Glasgow, UK) in December 2020; however, it was postponed to November 2021 due to the coronavirus and increased market uncertainty, and the number of new project registration cases have decreased [22]. This decrease is due to concerns over a reduction in CER demand, as EU–ETS, the largest trading market for emission credit, plans to restrict the use of CER and EUA from 2021 to 2030. In addition, about 2.078 billion tons of carbon dioxide equivalent (tCO2e) were issued due to ongoing CDM project activities, of which about 72 million CERs were voluntarily canceled. An additional 28 million CERs were voluntarily canceled online (March 2021). The CER in the international market was canceled voluntarily, and the credit was used within the domestic emission trading system because credits intended for utilization within the national emission trading system cannot also be used as international credits [14].
Concerning greenhouse gas emissions by sector in Korea, the total greenhouse gas emissions, including land use, land-use change, and forestry (LULUCF), increased by 169.8% compared to 1990 [23]. Among them, the energy sector emits up to 37 times more than other sectors as of 2018, and the increase/decrease rate compared to the previous year is also the largest (Table 3). Korea has declared carbon neutrality to achieve a net greenhouse gas emission of zero by 2050, and it is urgent to reduce greenhouse gas in the energy industry sector.
Table 3.
Greenhouse gas emissions by sector in Korea (million CO2t, %).
Among the CDM projects currently registered with the UNFCCC, the most applied is the energy industry sector methodology [24]. In particular, the most commonly used methodologies, grid-connected electricity generation from renewable sources (ACM0002) and grid-connected renewable electricity generation (AMS-I.D.) account for 42% and 27%, respectively. The ACM0002 and AMS-I.D. methodologies are applied to about 70% of the 3050 projects receiving CER (Table 4).
Table 4.
Status of CDM project registration and CER issuance by methodology.
The technical scope of the ACM0002 methodology (Figure 1) is using renewable energy sources, constructing and operating new power plants that supply electricity to grids (greenfield power plants), and targeting renovation and recycling (or maintenance), replacement, or capacity increase projects [25]. As an application condition, one renewable energy power generation system (hydroelectric power, wind power, geothermal power, solar power, wave power, and tidal power) should be used; this methodology cannot be applied to fossil fuel conversion and biogas power generation projects. ACM0002 includes capacity addition, retrofit, rehabilitation, and replacement operations where existing power plants began commercial operations at least five years previously, and it does not require capacity addition, facility renovation, improvement, or replacements during the same period. Hydroelectric power generation must be realized at the existing capacity (4 W/m2 or more) without changing the storage capacity of the project. Additionally, if new storage is established according to the project, the power density must exceed 4 W/m2. Furthermore, the penetration rate of specific technologies, including solar power generation technology, solar thermal generation, concentrated solar power generation (CSP) technology, offshore wind technology, offshore wave technology, offshore tidal technology, and offshore thermal technology, is connected to the entire grid installed in the host country. If the host country’s total installed capacity of the technology is less than 50 MW, or below 2% of the power generation capacity, the condition is automatically considered satisfied.
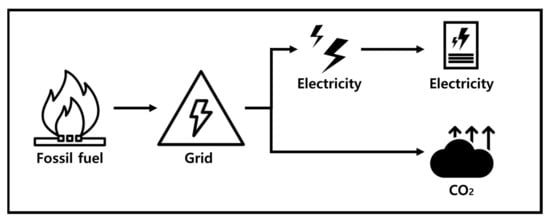
Figure 1.
The baseline scenario for the ACM0002 methodology.
Suppose, in the existing scenario, the grid receives electricity from greenhouse gas-intensive means. In that case, the project scenario involves a methodology to replace the existing greenhouse gas power generation by installing new renewable power plants or renovating, replacing, or increasing capacity (Figure 2).
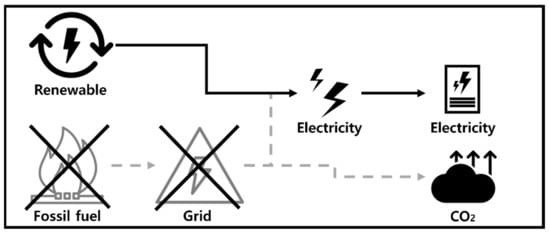
Figure 2.
The project scenario for the ACM0002 methodology.
The technical scope of the AMS-I.D. methodology is the construction and operation of a power plant that uses renewable energy sources and supplies electricity to the grid, or remodeling, replacement, or capacity increase projects (Figure 3). As a measure to alleviate greenhouse gas emissions, AMS-I.D. replaces electricity provided to the transmission network by greenhouse gas-intensive means, and conditions for applying the methodology should not be through a combination of heat and power generation.
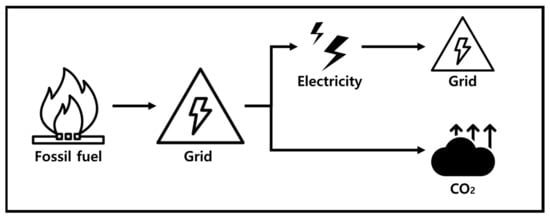
Figure 3.
The baseline scenario for the AMS-I.D. methodology.
If electricity is supplied to the grid by greenhouse gas-intensive means in the existing scenario, the project scenario is a methodology of supplying electricity to the grid using renewable energy technology.
In the future, greenhouse gas reduction is expected to center on the power generation sector. The fact that CDM projects are concentrated in the power generation sector makes it easy for the power generation sector to apply the appropriate technology (renewable energy power generation) to reduce greenhouse gas emissions. It also has a high reduction potential, indicating that it can play a vital role in the future transition to a low-carbon energy system (Figure 4).
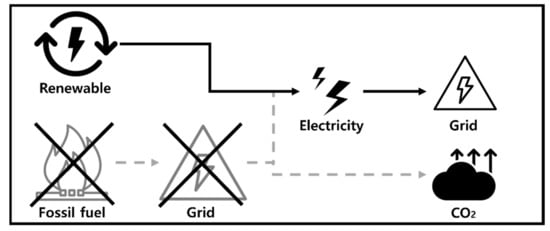
Figure 4.
The project scenario for the AMS-I.D. methodology.
3. Methodology and Empirical Result
Information on the market price (sCER) of CERs can be obtained through the price traded in the market, but the issuance price (pCER) must estimate the investment cost of the CDM project directly. Therefore, while preparing for a CDM project, investment entities must know the appropriate investment cost level until CER is issued. To estimate the carbon emission issuance price, we reviewed 1350 PDDs for the energy industry and calculated the price by substituting it into the formula. Based on this, we drive the carbon emission issuance price. Although studies have conducted price analysis based on the actual market price, there is no direct estimation of the carbon emission issuance price in the energy industry. This chapter aims to quantify various risk factors and analyze how individual factors affect the investment cost of a CDM project. The clustering methods are used for empirical analysis in Section 3, and are much more systematic than arbitrary variable selection methods that do not have clear classification criteria or are unknown. We then conduct multiple regression analysis.
3.1. Explanation of Sampling Methods and Data
This study obtained data for the empirical analysis by analyzing data from 565 PDD in the energy industry sector (No. 1) registered with the UNFCCC, from 2013 to the present, after the EU–ETS phase 2. This allowed the extraction of variables listed in the financial indicator; however, disclosing the project plan’s investment costs can strategically expose the CDM project implementer, the offset business operator. Therefore, several project plans were found without or partially omitting investment-related financial indicators. Finally, 1350 cases were reviewed by adding 785 CDM project plans registered with the UN in December 2012. Therefore, there is a difference in observations between the population and the sample; this study’s empirical analysis used 248 effective samples, from which the investment cost of the CDM project and the financial index values related to the investment were extracted based on the project plan (Table 5). The investment cost per unit is theoretically the same as the MAC in the case of reducing greenhouse gases through investment in environmental facilities, called the CDM project.
Table 5.
Characteristics of data on determinants of investment cost in CDM project.
The characteristics of the sample are as follows. Among the 248 samples, China hosts the most CDM projects, with 99 (39.92%) projects, followed by India with 74 projects (29.84%), indicating that China and India host about 70% of the projects in the total sample. By technology applied to the project, wind power 109 (43.95%), hydropower 80 (32.26%), waste heat management 24 (9.68%), biomass 16 (6.45%), biogas 11 (4.44%), solar 5 (2.02%), and landfill gas (LFG) 3 (1.21%) appeared. There were 142 (57.26%) large-scale projects and 106 (42.74%) small-scale projects. By project type, 84 (33.87%) were bilateral and 164 (66.13%) were unilateral in the host country. While there were 217 (87.5%) independent projects in the energy industry (No. 1), 31 CDM projects were implemented in connection with other industries (No. 4 manufacturing, No. 5 chemical industry, and No. 13 waste handling and treatment) (13.5%). Lastly, the investment environment value of the host country, considered a country risk variable, is a national risk indicator in the data released annually by the World Bank, including the three indices of political stability, degree of regulation, and safety of law application. It was used after obtaining the average value of the data from 2004, when the CDM project was first implemented, to 2019, the most recent data [26]. Specifically, it is classified from −2.5 to 2.5; the higher the value, the better the country’s general investment environment.
3.2. Cluster Analysis
This section aims to identify the CDM project’s determinants as the first step in empirical analysis and a preliminary step in analyzing price determinants; a cluster analysis method binds them into homogeneous groups by interrelationship. Participants in the CDM project face various risks, such as whether the project reduces greenhouse gas emissions, causes price fluctuations in the distribution market after CER issuance (price risk), and creates investment loss (certification risk) if CER is not issued. Therefore, information must be obtained to classify the similarity of significant attributes, such as investment cost, reduction volume, host country investment environment, project type, project scale, project method, and technology. Through this process, CDM project implementers and investors must understand the project’s inherent risks and make reasonable investment decisions by resolving project uncertainty. Cluster analysis is a multivariate statistical processing method that can distinguish the properties of relatively homogeneous groups in a given data set; it is the first analysis method designed to investigate or classify major concepts in group-specific factor analysis [27]. In Section 3, this study extracts attribute variables through the clustering method for empirical analysis, which is more systematic than any variable selection method with unclear or unknown classification criteria.
The analysis procedure is as follows. First, a cluster group that minimizes variance is established by making the CDM project’s factor (variable) values closest to each grouping. Using the Bayesian Information Criteria clustering criterion, the smallest value becomes the optimal number of clusters for the analysis data; this study determined three classification clusters. The variables for cluster analysis included the project sector, project size, project type, used technology (wind, hydro, biogas, biomass, LFG, solar, and waste heat management), and the host country’s investment environment (comprising political stability, degree of regulation, and stability of law application). After obtaining the average value for the most recent data (from 2004 to 2019), the World Bank announced the World Governance Indicators Dataset, which specified that these indices are national risks related to CDM project attraction. For categorical variables, dummy variables are used for large-scale projects, bilateral projects, and the energy sector (No. 1). The energy and manufacturing industry, chemical industry, and waste handling and treatment (1–4, 1–5, and 1–13) were treated as reference variables with attributes.
In Annex I countries, CDM projects reduce greenhouse gas emissions and are a relatively cost-minimizing method compared to using carbon prices to reduce the cost of greenhouse gas emissions. CDM projects began with large companies to attract CDM projects in large developing countries, where the proportion of fossil fuels is absolute, energy efficiency is low, and it is easier to reduce greenhouse gas emissions because they are still in the relatively early development stage.
The function formula for cluster analysis is shown in Equation (1). IC (Investment Climate) is a continuous variable representing the investment environment index of the host country; DScale, DType, and Dsector represent categorical variables in which project scale, project type, and project sector, respectively, are treated as dummy variables (attribute = 1):
Equation (1) includes the continuous variables, investment climate, and the categorical variables, project size, project type, project sector, and technology (wind, hydro, biogas, biomass, LFG, solar, waste heat management). Table 6 presents each cluster’s characteristics.
Table 6.
Representative characteristics of each cluster considering technical characteristics.
In Cluster 1, the investment environment of the CDM project’s host country was similar to the cluster combination with the total number of cases; Cluster 2 has a relatively sound investment environment on average. The distribution of clusters consisted of 108 CDM projects in Cluster 1, 61 CDM projects in Cluster 2, and 79 CDM projects in Cluster 3 (248 total). The results of the two-stage cluster analysis indicate concentrations around technology, an essential variable factor, wind technology for Cluster 1, waste heat management (WHM) technology for Cluster 2, and hydro technology for Cluster 3 (Table 6).
Table 7 presents cluster configurations by attribute. First, Cluster 1 included wind power projects. Second, all CDM projects using hydroelectric power were included in Cluster 3. Third, the CDM project using waste heat management and biomass, biogas, solar power, and LFG technologies were included in Cluster 2; WHM technology was a significant technological factor that constituted the cluster. In addition, projects linked to the energy industry (No. 1) and the manufacturing, chemical, waste treatment, and handling sectors (No. 1–4, 1–5, 1–13) were included in Cluster 2. The project type and scale were not important attributes in classifying clusters.
Table 7.
Cluster configuration diagram considering individual attributes.
Figure 5 shows the results showing the level of investment cost by cluster. Overall, there was no significant difference in the average investment cost between clusters; however, relatively low-priced biomass technology accompanies the investment costs for landfill gas, WHM, and biomass (including various technologies, such as WHM). Regarding the CDM project’s technical factors, the biomass project showed the lowest cost structure, while the issuance price of landfill gas, WHM technology, and biogas technology was relatively high. Biomass issuance prices are low because biomass raw materials, such as animal feces, sewage sludge, black liquor, waste paper, food waste, and forest residues are relatively cost-saving due to local resource recycling.
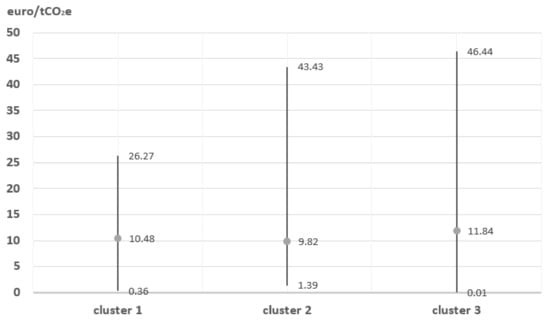
Figure 5.
Level of investment cost for each cluster considering technical characteristics.
Cluster 1, represented by wind power technology, accounted for about 93% of 108 projects in two countries, with 49 in China and 51 in India. This is because greenhouse gas emissions increase rapidly as large developing countries become urbanized, and wind power generation technology can supply affordable power to underdeveloped areas, such as falling islands. In addition, the disadvantages of wind power include the high cost of materials and the relatively limited installation area. China and India have been preparing for national energy policies for a long time and have significantly reduced emission capacity among developing countries. Implementing this substantial and high technology investment lowers average costs due to economies of scale.
3.3. Analysis of Determinants of Investment Costs in CDM Projects in the Energy Industry Sector
This section aims to quantify various risk factors and analyze how individual factors affect the investment cost of a CDM project. A hypothesis test is performed through multiple regression analysis to analyze the factors that affect the investment cost of the CDM project in the energy industry. Table 8 shows the contents of this study’s four hypotheses based on classifying the correlation attributes in the cluster analysis. First, to examine the effect of economies of scale, Hypotheses 1 and 2 test the effect of greenhouse gas reduction volume and project size on investment cost. Second, depending on whether the CDM project is bilateral or unilateral and whether it links the energy, manufacturing, chemical, waste handling, and treatment sectors together (rather than considering the energy industry alone), Hypotheses 3 and 4 test whether the effect on the cost differs. Third, Hypothesis 5 tests the effect of the investment environment of the host country, an indicator of national risk, on the investment cost of the CDM project. Fourth, Hypotheses 6 and 7 test the effect of technical risk on CDM investment cost to determine whether the project with which technology lowers or increases the investment cost.
Table 8.
Hypothesis test of CDM invest determinant.
Equation (2) shows the regression model and variables used to analyze the determinants of investment cost in the energy industry sector’s CDM business. This study used the investment cost extracted from the CDM project plan as a dependent variable:
where:
- = Average investment cost per unit (tCO2e): total investment cost divided by expected emissions reduction;
- Reduction = Annual emissions reduction due to CDM project;
- Dscale = Dummy variable for project scale (large = 1, small = 0);
- Dsector = Dummy variable for project sector (No. 1–4 = 1, No. 1–5 = 1, No. 1–13 = 1, only No.1 = 0);
- IC = Variables for typical investment climate;
- DWind = Dummy variable for technology (Wind = 1, otherwise = 0);
- DHydro = Dummy variable for technology (Hydro = 1, otherwise = 0);
- DBiomass = Dummy variable for technology (Biomass = 1, otherwise = 0);
- DBiogas = Dummy variable for technology (Biogas = 1, otherwise = 0);
- DSolar = Dummy variable for technology (Solar = 1, otherwise = 0);
- DLFG = Dummy variable for technology (LFG = 1, otherwise = 0);
- DWHM = Dummy variable for technology (WHM = 1, otherwise = 0);
- = Parameters by pricing factor (i = 1–12);
- = error term.
The analysis model’s explanatory variables are as follows: The project scale, project type, and project sector variables are treated as dummy variables. The large scale, bilateral type, and energy industry (No. 1) linked with manufacturing (No. 4), chemical industry (No. 5), and waste handling and treatment (No. 13) in the business sector were treated as having attributes. The general investment environment—a proxy variable for the host country’s investment environment—used three indices of national risk, political safety, degree of regulation, and law application; it was used after calculating the average value for 2019 data, the most recent data since 2004 when the CDM project first began. The analysis method used the generalized least squares method.
Table 9 shows the basic statistics of the CDM project’s determinants of investment cost. The average investment cost of the sample is EUR 10.75 per ton. The sample with the lowest investment cost is from Sri Lanka, which invested EUR 0.01 per ton; the highest project was from Laos, which cost EUR 46.44 per ton. The average greenhouse gas reduction in the analysis data is 967,380 tons annually. By project characteristics, large-scale projects accounted for 57%, bilateral business types accounted for 34%, and projects that considered energy, manufacturing, chemical, and waste treatment together accounted for 13%. The proportion of project technology is the highest in the wind power business at 44%, followed by hydropower, WHM, and biomass. The average value of the host country’s investment environment is −0.41.
Table 9.
Basic statistics for analysis of determinants of investment cost in CDM project.
When the t-statistics are low and the F value is high, multicollinearity between regression variables can be generally suspected [25]. Furthermore, estimating the significance probability value of the hydro-technical variable included within the 5% confidence interval in this regression model through ANOVA, the F value is also statistically significant at 4.466; therefore, there is no problem with the model’s linear regression estimation.
Table 10 summarizes the analysis results for the determinants of the CDM project’s investment cost in the energy industry sector. First, technology variables influence the CDM project’s investment cost. According to the statistical significance, a rather conservative analysis is required; the investment cost was low in biomass, wind power, hydropower, solar power, biogas, WHM, and LFG technology. Additionally, the investment cost of hydropower and WHM technology is relatively higher than that of wind power technology. Second, the higher the emission reduction, the lower the investment cost; however, the investment cost of large-scale projects was higher than that of small-scale projects. This seems to result from large-scale facilities requiring more facility and maintenance costs throughout the project. Therefore, the effect of economies of scale in the energy industry’s greenhouse gas reduction project has not been confirmed. This can be observed in advanced developing countries, such as China, India, and Brazil, which invested long-term in the fuel conversion sector, wind power, hydropower, and biomass technologies to focus their environment and energy policies on renewable energy, even if CDM investment does not generate immediate profits. Third, compared to the unilateral project, the bilateral project was verified to increase the investment cost. The host country’s cost of procuring technology or capital for facilities is cheaper than relocating it from an investment country, which is an advanced country. In particular, China and India attract many CDM projects, indicating that long-term investments in their environmental and energy policy projects based on sufficient technology and capital lower the average cost (issuance price) of greenhouse gas reduction projects. Lastly, the investment cost of a project in which the energy, manufacturing, chemical, and waste handling and treatment sectors were linked was lower than projects that only consider the energy industry sector. This is a result of confirming that projects linked to manufacturing, chemical, and waste sectors increase the cost of facilities rather than their businesses in the energy industry, lowering investment costs due to sales revenue of by-products (electricity, compost, etc.) and cost reduction using local resources. As a result, it can be inferred that the economic effect is working around the renewable energy market. Lastly, the investment cost of the CDM project is higher as the investment environment of the host country is good (Table 11).
Table 10.
Result of multiple regression analysis.
Table 11.
Result of the hypothesis test for CDM investment cost determinants.
Overall, Hypotheses 1, 3, 4, 5, and 6 were supported at a statistically valid level.
4. Discussion
Faced with the historical challenge of carbon neutrality, future companies in all countries, including developed countries, must determine when to invest in greenhouse gas reduction by comparing their workplaces’ marginal cost with international emission credit prices. This study used registration with the UNFCCC from December 2012 to the present to identify the investment cost of CDM projects of overseas companies currently implementing greenhouse gas projects. After reviewing 1350 CDM project plans (PDDs) in the energy industry sector, 248 raw data containing financial indicators were converted into a database for empirical analysis. Based on this, we derive the carbon emission issuance price. Although studies have conducted price analysis based on the actual market price, there is no direct estimation of the carbon emission issuance price in the energy industry. Determinants of the investment cost of CDM projects in the energy industry sector were analyzed. More specifically, investment entities analyzed how individual factors affect the investment cost of CDM projects by quantifying various risk factors. This is a critical requirement to determine the appropriate level of issuance price until decision-makers receive CER, a project-based emission credit.
First, as a preliminary step in analyzing the determinants of investment costs in CDM projects, the cluster analysis results that bind them into homogeneous groups by interrelationship are as follows. The cluster analysis results confirmed that the clusters were classified based on the technology. Cluster 1 included all wind power projects, and Cluster 3 included all projects using hydropower. CDM projects using waste heat management technology (WHM), biomass, biogas, solar, and LFG technology were all included in Cluster 2. WHM technology was an important technological factor in the cluster. Cluster 2 also included projects linked to the energy sector (No. 1) and the manufacturing, chemical, waste treatment, and handling sectors (No. 1–4, 1–5, and 1–13). It was found that project method and size were not important attributes in classifying clusters.
Next, the results of analyzing the factors affecting the investment cost of CDM projects in the energy industry through multiple regression analysis are as follows. First, technology variables influence the investment cost of CDM projects. Investment costs per unit were low, in the order of biomass (−1.99), wind power (1.00), hydropower (1.99), solar (2.59), biogas (4.03), WHM (4.13), and LFG (5.22) technologies. Second, the higher the amount of emission reduction, the lower the CDM project investment cost; however, since the investment cost of a large-scale project is higher than that of a small-scale project, it is difficult to say that the energy industry CDM project suggests economies of scale. Third, projects that linked the manufacturing, chemical, and waste sectors had lower CDM project investment costs than projects considering the energy industry alone. This can be seen as a result of the economic effect of a range of related industries centered on renewable energy technology. Fourth, compared to the unilateral project, the bilateral project increased the CDM project’s investment cost. Lastly, the CDM project investment cost is higher as the investment environment of the host country is good, supporting the hypothesis at a statistically valid level.
The CDM project is an efficient system that uses market mechanisms to achieve cost-effective reduction targets. The Paris Agreement has agreed on guidelines for the international carbon market mechanism in an extensive framework. The international carbon market is expected to be officially launched after further technical discussions, such as specific methodologies and supervisory and management systems. In addition, the Paris Agreement, like the Kyoto system, is expected to be used as a method of inheriting the CDM to achieve cost-effective reduction goals using market mechanisms [28].
In particular, advanced developing countries, such as China and India, have already attracted several CDM projects based on sufficient technology and capital. Even if there is no immediate profit, greenhouse gas reduction projects’ average cost (issuance price) is falling via long-term investments aiming to reorganize environmental and energy policies, primarily renewable energy.
Of course, a region’s special conditions, such as local endowed resources, must be considered; among the technologies for reducing greenhouse gases in the energy industry sector, biomass technology can be considered the most useful technology. This study’s empirical analysis found that biomass technology had the highest investment efficiency. Although statistical significance is not guaranteed, the investment cost of biomass technology is lower than that of wind and solar power technology, which the Korean government is investing in actively. If the local by-products and natural resources are recycled or reused and used as raw materials for biomass, it will be possible to reduce costs and link the path to rural regeneration. Biomass issuance prices are low because biomass raw materials such as animal feeds, waste sludge, black liquid, waste paper, food waste, and forest waste are cheaper than other existing resources [29]. This is detailed in the results of previous research [30]; according to the use and storage of significant biomass in Japan, 90% of livestock waste is used as fertilizer, 70% of waste is used as construction materials or fertilizer, 60% of black waste is used as raw materials, 25% of food waste is used as fertilizer or feed, and forest waste is the most challenging to use. Meanwhile, between 2008 and 2009, investment costs for Animal Waste Management System projects registered with the UNFCCC were determined to be between EUR 1.8 and EUR 7.5 per ton, and investment costs for CDM projects were determined between EUR 11.6 and EUR 19.6 for biogas plant projects [30]. Considering that emission credit prices were traded between EUR 20 and 30 in the EU–ETS phase 1, economic feasibility is expected to be sufficient given the international agency’s prospect that emission credit prices will start at the current price of EUR 40 and rise between EUR 80 and 100 EUR if activated. In addition, the government must carefully apply various business methods, such as small-scale bundling and program CDM, to suit local conditions so that local by-products and natural resources can be used as raw materials.
5. Conclusions
This study aimed to provide business entities that need to reduce greenhouse gases in the future with market information in making investment decisions in the CDM project. To this end, after reviewing data from 1350 CDM project plans in the energy industry registered with UNFCCC, effective samples were extracted and converted into a database for investment analysis. In addition, the determinants of CDM project investment costs in the energy industry, which has the highest proportion in the CDM project sector, were analyzed through cluster and multiple regression analysis. This study provided theoretical knowledge for CDM project development and suggested implications to mandatory reduction companies, including companies preparing for the CDM project and policy authorities implementing the 2030 implementation plan for renewable energy and achieving 2050 carbon neutrality.
This study has an academic contribution in that it analyzed the factors affecting the investment cost of CDM projects based on the financial indicators of the CDM project plan in the energy industry sector registered with UNFCCC. The results of the empirical analysis show that technology variables act as factors affecting investment costs and that the investment efficiency of biomass technology is the highest empirically. This research contributes to the literature in several ways. First, the result provides basic data on how much profitable mandatory reduction companies, business operators, and investors can make through reduction, and the second emphasized the contribution in terms of recycling biomass resources in the local community. If the local by-products and natural resources are recycled or reused and used as raw materials for biomass, it will be possible to reduce costs and link the path to rural regeneration. Future studies can conduct an in-depth analysis of the acceptability and economic feasibility of the local community for biomass technology.
Author Contributions
Conceptualization, S.-S.L. and J.-H.K.; methodology, S.-S.L. and J.-H.K.; validation, J.-H.K. and S.-S.L.; investigation (data and evidence collection), J.-H.K.; writing—original draft preparation, J.-H.K., T.-H.K. and S.-S.L.; writing—review and editing, T.-H.K. and S.-S.L.; supervision, S.-S.L. All authors have read and agreed to the published version of the manuscript.
Funding
This research was conducted with support from the Chungbuk Green Environment Center (CBGEC-2021: 21-02-90-93-16).
Institutional Review Board Statement
Not applicable.
Informed Consent Statement
Not applicable.
Data Availability Statement
Data sharing is not applicable.
Conflicts of Interest
The authors declare no conflict of interest.
References
- Guterres, A. UN Secretary-General’s Message to Celebrate Earth Day’s 50th Anniversary. Available online: https://www.un.org/en/observances/earth-day/message (accessed on 28 April 2022).
- Emillio, G.F. The Global Risks Report 2020, 15th ed.; World Economic Forum: Geneva, Switzerland, 2020. [Google Scholar]
- Wang, Q.; Su, M. A preliminary assessment of the impact of COVID–19 on environment—A case study of China. Sci. Total Environ. 2020, 728, 138915. [Google Scholar] [CrossRef] [PubMed]
- Wang, Q.; Zhang, F.Y. What does the China’s economic recovery after COVID–19 pandemic mean for the economic growth and energy consumption of other countries? J. Clean. Prod. 2021, 295, 126265. [Google Scholar] [CrossRef] [PubMed]
- Smith, B. Microsoft Will Be Carbon Negative by 2030. Available online: https://blog.microsoft.com (accessed on 27 April 2022).
- Song, Y. Opinions of the State Council of the Central Committee of the Communist Party of China on the Complete, Accurate and Comprehensive Implementation of the New Development Idea and the Work. Xinhuanet Newspaper, 24 October 2021. [Google Scholar]
- UNFCCC Secretariat. National Determined Contributions under the Paris Agreement-synthesis report by the secretariat. In Proceedings of the Glasgow Climate Change Conference, Glasgow, UK, 31 October–12 November 2021. [Google Scholar]
- 700+ Cities in 53 Countries Now Committed to Halve Emissions by 2030 and Reach Net Zero by 2050. Available online: https://www.c40.org/news/cities-committed-race-to-zero/?gclid=CjwKCAjw7IeUBhBbEiwADhiEMagC4GYDWF-pnuZsK8Z-IXat5YSDYcXNYiFsMZesrIn0F8f98b_mJxoC5-MQAvD_BwE (accessed on 29 April 2022).
- Wikipedia. Available online: https://en.wikipedia.org/wiki/Kyoto_Protocol (accessed on 18 March 2022).
- Joint Related Ministry. Revised Basic Road Map to Achieve Nationally Determined Contribution (NDC) Goals in 2030; Joint Related Ministry: Sejong, Korea, 2018. [Google Scholar]
- Ursula, F.H.; Ryan, W.; Matthew, G.; Gaurav, G.; Deborah, R.; Bill, H. Transitioning towards A Zero-Carbon Society: Science-Based Emissions Reduction Pathways for South Korea under the Paris Agreement; Climate Analytics: Berlin, Germany, 2020. [Google Scholar]
- Joint Related Ministry. An Upward Plan to Nationally Determined Contribution (NDC) Goals in 2030; Joint Related Ministry: Sejong, Korea, 2021. [Google Scholar]
- Lim, S.S. An Analysis on the Determinants Factors of CER Price and the Optimal Level Regard as Economic Feasibility. Ph.D. Thesis, Korea University, Seoul, Korea, 2008. [Google Scholar]
- Park, S.C.; Cho, Y.S. Analysis on price driver of spread and different patterns of EUA and sCER. Environ. Resour. Econ. Rev. 2013, 22, 759–784. [Google Scholar] [CrossRef][Green Version]
- United Nations Environment Programme. Equal Exchange: Determining a Fair Price for Carbon; UNEP: Nairobi, Kenya, 2007. [Google Scholar]
- Korea Energy Agency. Report on the Decisions of the 109th CDM Executive Committee Meeting; Korea Energy Agency: Ulsan, Korea, 2021. [Google Scholar]
- Kim, J.H.; Lim, S.S. An analysis on the invest determinants of CDM Project: Evidence from waste handling and disposal sector. Korean. J. Org. Agri. 2020, 28, 535–553. [Google Scholar]
- Mo, J.Y.; Yang, S.R.; Cho, Y.S. The law of one price and dynamic relationship between EU ETS and nord pool carbon prices. Environ. Resour. Econ. Rev. 2005, 14, 569–593. [Google Scholar]
- Kim, S.Y.; Park, H.J. Research on price discovery process of CO2 allowance trades in EU markets. J. Econ. Stu. 2008, 26, 1–20. [Google Scholar]
- Lim, S.S.; Yang, S.R. An analysis on the determinants of the price of primary CER. Environ. Resour. Econ. Rev. 2008, 17, 691–717. [Google Scholar]
- UNFCCC. Available online: https://cdm.unfccc.int/Projects/projsearch.html (accessed on 30 June 2021).
- Office for Government Policy Coordination/Prime Minister’s Secretariat. Mid-to Long-Term Greenhouse Gas Reduction Strategies Using the International Carbon Market: A Basic Study on the Implementation Plan in Korea; OGPC: Sejong, Korea, 2020. [Google Scholar]
- Greenhouse Gas Inventory and Research Center. 2020 National Greenhouse Gas Inventory Report of Korea; GIR: Incheon, Korea, 2020. [Google Scholar]
- IGES. IGES CDM Methodology Parameter Data. Available online: https://www.iges.or.jp/en/pub/iges-cdm-methodology-parameter-data/en (accessed on 18 March 2022).
- UNFCCC. CDM Methodology Booklet, 13th ed.; UNFCCC: Bonn, Germany, 2022; ISBN 978-92-9219-200-6. [Google Scholar]
- World Bank. Worldwide Governance Indicators. Available online: https://datacatalog.worldbank.org/dataset/worldwide-governance-indicators (accessed on 30 June 2021).
- Rudd, P.A. An Introduction to Classical Econometric Theory; Oxford University Press: New York, NY, USA, 2000; ISBN 978-0195111644. [Google Scholar]
- UN Climate Change. COP26: The Negotiations Explained; UN Climate Change: Glasgow, UK, 2021. [Google Scholar]
- Seo, S.W. The Core of Low Carbon Growth, Using Biomass; GS&J Institute: Hanam, Korea, 2009. [Google Scholar]
- Lim, S.S. An analysis on the CDM project in agricultural sector and its implications for Korea: Focused on animal waste management CDM project. J. Korea Soc. Waste Manag. 2014, 31, 800–810. [Google Scholar] [CrossRef]


Publisher’s Note: MDPI stays neutral with regard to jurisdictional claims in published maps and institutional affiliations. |
© 2022 by the authors. Licensee MDPI, Basel, Switzerland. This article is an open access article distributed under the terms and conditions of the Creative Commons Attribution (CC BY) license (https://creativecommons.org/licenses/by/4.0/).