Article

Factors That Influence Travelers’ Willingness to Adopt Bus Rapid Transit (Green Line) Service in Karachi

by
Rabia Soomro
1,*,
Irfan Ahmed Memon
2,*,
Agha Faisal Habib Pathan
1,
Waqas Ahmed Mahar
3,
Noman Sahito
2 and
Zulfiqar Ali Lashari
2
1
Department of Civil Engineering, Mehran University of Engineering and Technology, Jamshoro 76062, Sindh, Pakistan
2
Department of City and Regional Planning, Mehran University of Engineering and Technology, Jamshoro 76062, Sindh, Pakistan
3
Department of Architecture, Balochistan University of Information Technology, Engineering and Management Sciences (BUITEMS), Airport Road, Baleli, Quetta 87300, Balochistan, Pakistan
*
Authors to whom correspondence should be addressed.
Sustainability 2022, 14(16), 10184; https://doi.org/10.3390/su141610184
Submission received: 8 July 2022 / Revised: 4 August 2022 / Accepted: 5 August 2022 / Published: 16 August 2022

Abstract

:
Bus rapid transit (BRT) system is a sustainable mode choice alternative and traffic management method for traffic congestion problems in urban areas. As an extent of total demand management, BRT has broadly been implemented in many countries. BRT has proven to be progressive in alleviating traffic congestion and the difficulty of finding parking spaces in city centers. Currently, people driving their automobiles to work cause traffic congestion along Karachi’s main corridors. People cannot be persuaded to use public transit until their travel patterns are understood. Therefore, the disparity between public and private transportation must be addressed. This research aimed to develop a model to shift car travelers toward Karachi’s Green Line BRT and investigate the factors that influence car travelers’ decisions. A questionnaire-based survey was carried out on single-occupant vehicle (SOV) users in the Green Line corridor of Karachi. This study investigated the elements that influence SOV users’ willingness to adopt the BRT system and studied the possible ways of attracting car drivers to BRT. Data were examined using descriptive-analytic techniques such as the contingency table approach in conjunction with a Chi-square test of the independence/association model in SPSS. Furthermore, binary logistic regression was applied to the highly mediated associated variables. The research’s outcomes were geared at the imposition of parking fees at workplaces to deter individuals from parking their automobiles there. SOV travelers can be diverted to BRT services using this strategy. The research findings will assist policymakers and serve as a foundation for scientific investigations on the travel demand model for the BRT system.

1. Introduction

“A developed country is not a place where the poor have cars; it is where the rich use public transport”, Gustavo Petro, Mayor of Bogota, Colombia [1]. Road transportation is one of the most serious issues confronting most of the world’s population. Traffic congestion is a typical phenomenon in major cities across the world, including Karachi [2,3]. In metropolitan settings, traffic congestion tends to delay, hinder, and be non-productive economic operations. Several studies on traffic-related issues are being conducted under various clusters, with economic and financial issues being considered. Financial losses due to traffic congestion have been recorded in several urban centers across the world. It has been found that the annual cost of traffic congestion in Karachi topped USD one billion in 2018. This is equivalent to 2% of Karachi’s yearly gross domestic product (GDP) [2,4,5]. That cost is calculated using valuable time, oil costs, and energy use.
Karachi is the provincial capital of Sindh, Pakistan. Karachi, located on the Arabian Sea, acts as a transportation center and is the house of Pakistan’s two main shipping ports, the Port of Karachi and Port Bin Qasim, including the region’s busiest airport [6]. Karachi is among the largest and most significant cities in South Asia. The city’s tremendous growth in past decades has increased the demand for mass transportation infrastructure. The city now has 17 million citizens and a population density of 24,000 persons per square kilometer [7]. Overall, 60 percent of Karachi’s population relies excessively on private transportation, causing massive traffic jams and severe air pollution [8,9]. All major Pakistani banks have their headquarters in Karachi, and the Karachi Stock Exchange is the nation’s biggest, with annual revenue of PKR 436 million (USD 7.2 million). Sindh province generates 70% of the income tax and 62% of the sales tax collected by the Government of Pakistan, with Karachi accounting for 94% of this total [10].
One of the biggest causes of traffic congestion is inadequate transportation infrastructure [2,11]. As a result, accessibility, health well-being, and monetary services suffer [9,12]. The city’s increased urbanization and economic growth have created a large strain on travel demand [13,14]. Private transportation ownership instantly fills around 33% of current transport infrastructure, putting significant strain on roadways [13,15].
This study was aimed at SOV users’ willingness to adopt BRT services in Karachi’s urban core. Persons traveling by personal vehicle typically generate traffic congestion in Karachi’s central business district (CBD) [2,8,13]. Individuals cannot be convinced to switch to public transportation unless their travel patterns are known [4,11,16,17,18,19,20,21]. The gap between public and private transportation has now widened. The “gap between public transportation” means the usability of public transportation versus single-occupant vehicles (SOVs). Currently, travelers are induced and encouraged to use and are accustomed to SOVs, which is why the usability of SOVs is higher than public transportation which widened the gap in usability [3,12,20]. As a result, it is critical to analyze SOV users’ commuting patterns to shift them to alternate modes of transportation such as BRT transport [22]. BRT services are extensively used in many cities and have proved useful in reducing traffic congestion and locating parking spaces.
Furthermore, the purpose of this research was to identify the characteristics that affect SOV users to utilize BRT in Karachi Business District. This research project can give a comprehensive picture of travel patterns in a growing city’s adoption of BRT services. This research will serve as a beneficial reference for authorities in the efficient productivity and design of BRT services [4,19].
Therefore, to accomplish this goal, it is necessary to perform travel pattern research and identify the characteristics that motivate SOV users to switch from automobile travel to the BRT system in Karachi. Thus, it contained goals such as analyzing the elements that impact travelers’ modes of transportation in Karachi.
This study focused on the readiness to embrace the BRT service and aimed to identify elements that might attract SOV users to adopt the BRT system as well as the influencing factors of captive travelers. As a result, a holistic travel demand model can accommodate the core of Karachi and is practicable for developing countries because it has a mix of modern and conventional densely populated places. Karachi CBD was chosen since it is a densely inhabited historic city. This research concentrated on a wide set of attributes that were classified into seven distinct groups which are discussed in the literature review section.

2. Literature

2.1. Study Area (Karachi)

Over the last few years, the fastest-growing urban centers have mostly been in developing nations [23]. Karachi has dominated the growth rate, with an astonishing 80 percent growth in population from 2000 to 2010 [23]. Karachi has a populace of about 17 million people and is regarded as the world’s fastest-growing megalopolis [23]. Since the establishment of Pakistan, the city’s population has grown 35 times, and its areas have increased about 16 times, with an annual increase of more than 5% [13], as illustrated in Table 1.
Karachi is Pakistan’s main urban and financial hub, and it is undergoing an uncontrolled period of rapid expansion and motorization [13,14]. The city’s rapid urbanization and economic expansion have put significant strain on travel demand [13,14]. The increasing demand has swiftly overloaded the transportation infrastructure, with almost 33 percent of cars in the country crowding the country’s urban roadways [13,14]. Figure 1 illustrates that automobiles and motorcycles account for 87 percent of the vehicle fleet, compared to 7 percent for taxis and rickshaws and 1 percent for public transportation [24]. This fast increase in SOV ownership, combined with a lack of economic mechanisms such as paid parking and congestion pricing, has resulted in massive congestion, particularly in the city’s core. As a result, the average commuting time in Karachi has increased by more than 45 min [13]. Figure 1 depicts the rising number of different means of transportation in 2011, clearly indicating that private vehicles and motorbikes are on the rise.
The urban transportation demands of a metropolis are volatile and heavily influenced by inhabitants’ travel patterns [25,26]. Table 2 shows the modal shares from two studies conducted by the Traffic Engineering Bureau of Karachi in 1987 and 2004. Despite private car journeys rising, it is worth noting that buses/minibusses continue to meet more than half of the transport demand. Hence, buses/minibusses are the most significant means of public transportation in Karachi, and improved transport management techniques, service, availability, and accessibility can assist in reducing the usage of private automobiles.
Non-motorized mobility is among the most efficient modes of transportation; however, it is underused in Karachi and is only utilized by low-income people who cannot afford public transportation. According to the figures in Table 2, the number of trips performed by walking/cycling was 12% of commuters in 1987, with little or no records in 2004. Some of the key reasons why lower- and middle-income people are not using non-motorized transportation are security and safety issues, the lack of pedestrian/cyclist planning, and the encroached/poorly maintained sidewalks. Pedestrians are not only affected by air and noise pollution, but they are also the victims of road accidents, with about 600 commuters being killed in road accidents in Karachi each year, with more than half of them being pedestrians [13,14].
The concerned government is trying to resolve the traffic congestion issue through the development of overpasses and new expressways [25,26]. These techniques are boosting traffic and rising the need for SOVs daily [13,14]. The government is taking traditional measures that encourage automobile users rather than sustainable solutions such as BRT services [13,14]. Hence, there is a significant imbalance between public and private transportation [13,14,25,26,27,28].
Furthermore, this study explored the environmental, trip, individual, transport, and quality-specific attributes that influence the modal split of SOV users. Moreover, it explored the level of difference between the factors of SOV and public transport users in the city. As a result, this study contributes to a methodology that might attract SOV users to BRT services for the future marketing and design of BRT infrastructure.
Transport is a major source of travel. Michael Mc Greevy 2021 performed a statistical and physical analysis of five widely used transport systems—public transport, mixed traffic, heavy rail, light rail, and bus rapid transit—in the area of Adelaide, South Australia, where private vehicles are used mainly as compared to public transport due to the absence of a rapid transit system. The government proposed a light rail “trams” system which is connected to major areas or business hubs of the city. According to the observations, Curitiba city designed a bus rapid transit system. It is a famous BRT system for the area because it is far less exclusive than light and heavy rail [29].
Bilal et al., 2021 conducted a study on BRT, covering all stations of the corridors located in Lahore. Statistical methods, cross-comparison, and correlation were used to explore the travel characteristics. Among the 21 service quality attributes, they found 8 factors of convergence, including spectrums of highest, lowest, and average ratings, as well as spatial relationships of service quality [30].
Lutfi Prayogi and Anggana F. S., in 2019, investigated roughly the issues and behavior of passengers while traveling, especially the passengers who change their mode of transport. For instance, shifting from private vehicles and adopting the BRT system. The authors performed a literature review to conduct a study, and their findings reveal many components of BRT system service quality and the built environment. Hence, the impact was not the same due to the different backgrounds of passengers and different types of trips [31].
Afzal et al., 2020 conducted research in Karachi and analyzed the mode selection of university students and their preference for a proposed bus rapid transit. The students were surveyed to determine their preferences toward various attributes of existing travel modes and the proposed BRT line. Participants were divided into three categories: private, public vehicles, and university shuttles. This study examined the impact of one-way travel time, travel fares, and level of comfort on the ability to travel to estimate the number of trips expected to be transferred to the proposed BRT line. As a result, it was found that students who use a private vehicle value travel time over other factors. BRT will have the least effect on shuttle service users since shuttles offer subsidized fares along with greater convenience [32].
Syyed et al., 2020 explored how transport enhances the economy of the country. The main objective of the study was to identify the different possibilities for energy proficiency in BRT in developing countries. The study was conducted in Multan city located in Pakistan. A comparative study was performed for conventional fuel by applying a decision-making efficiency methodology. It was observed that the hybrid bus system proved to be energy-efficient and that it replaced the conventional fuel mechanism [33].
Sh. Ataeiana et al., 2021, found that the quality of public transportation has a significant impact on the quality of urban life. A great deal of attention should be paid to the system’s utility and attractiveness in the whole planning process, especially when determining frequency and timing. This study proposed a mixed-integer nonlinear programming model for setting timetables on an intercity bus network with maximum synchronization and minimum fleet size. In this approach, timetables are set according to two different samples of varying sizes on a large-scale and small-scale transit network, respectively. By using General Algebraic Modeling System (GAMS) software, the timetable obtained was reasonable in this study. Additionally, the proposed model proved to be efficient in establishing timetables on transit networks of various sizes [34].
Weichuan et al. investigated and concluded in 2020 that it is possible to increase the number of urban transit routes based on neighborhood features, boost transportation efficiency, and raise the commercial value of urban bus routes. This study discussed comprehensive optimization of the urban bus corridor placement and lane arrangement while considering the corridor’s aggregation impact. Initially, the K-shortest path algorithm was used to generate passenger bus corridors. Following that, the business’s influencing attributes were examined. Consequently, it constructed a bus corridor site identification model using the minimal generalized cost function, considering arc capacity, plot ratio, corridor development, and time limitations. Finally, the real-world example of Beijing city was used, and bus lines were identified, especially during peak hours. Most of the routes identified as bus corridors move more than 6671 people per hour in one direction. Bus corridors and bus lanes are closely linked to passenger flow [35].
According to Nadeem et al., 2021, BRT is an efficient and inexpensive means of urban transit that offers city dwellers safe, high-quality transport services. The authors surveyed 21 BRT stations and passengers out of 420 respondents to evaluate the performance of BRT in Multan and find out the research gap for this study. Their survey was based on a perception of passenger and BRT standards. Statistical Package for Social Science (SPSS) was used for the analysis of the dataset. Cronbach’s alpha was applied for the reliability of experiments. According to the findings, 54% of the passengers agreed with the BRT system due to the easiness of traveling [36].
Lucy Joseph et al. performed a comparative study between two transport activities: informal public transport (IPT) and BRT. The data were collected by interviews with the residents of Dar es Salaam city, Tanzania. It was proved to be efficient in daily activities such as work, education, shopping, etc., while BRT is designed to provide relief to a precise crowd of residents, particularly those who work at offices, do specialized work, etc. [37].
Irfan et al., 2021, discussed that Karachi is the biggest and most famous business hub. A survey for the collection of the data and the logistic regression test was performed for the validity of the data. The investigation was conducted using the SPSS program, and it was discovered that almost 70% of respondents used motorcycles to prevent stress and preserve the environment [20].
Nazam Ali et al., 2020 explained the development of technologies that the transportation network company (TNC) introduced, and then companies introduced Careem and Uber paratransit services to provide comfort to the commuters. The authors conducted an online survey on three categories of transport: Uber, Careem, and public transport. Only 317 respondents were chosen based on their personal and trip characteristics. For the selection of mode mechanism, the travel cost, privacy, safety, and time travel were observed. According to their findings, respondents having low income prefer TNCs because of their low pay while respondents having high income prefer their vehicles [38].
Tia D et al., 2021 revealed that BRT is the base of Semarang’s public transportation system, contributing significantly to the city’s sustainable mobility. Even though BRT has been in existence for a decade, its efficiency has not resulted in a significant switch from the use of SOVs for transportation. As a result, the purpose of this research was to evaluate the efficacy of BRT service in supporting the paradigm of a resilient city. The evaluation was carried out by comparing city- and corridor-level effectiveness using a scoring procedure against a set of infrastructural and standard operating procedures. At the municipal level, performance only met 45.12 percent of the quality standard. Corridors I and IV had the best performance at the corridor level, with 15% and 6%, respectively, above the average point percentage. BRT in Semarang city, Indonesia, is not yet deemed robust since the criteria ensuring accessibility, reactivity to disturbance, and inclusion need to be improved [39].
Andrés E. Díez et al., 2021 identified an electrical configuration approach for transit systems that use batteries in grid-connected vehicles. The authors performed the study in the following ways: initially, they performed a literature review about the electric system, grid-connected, and battery-based operation. Secondly, they looked at the advantages of that system in BRT. Lastly, a computational simulation experiment was conducted in the Medellin area, Colombia. This technique had two objectives: one was from the vehicle’s side to show the correct size of batteries and power trainability, and the other was from the system side to locate and size the route segments to be electrified. It was observed that the method proved to be efficient to find the least practicable cost elucidation [40,41].
Robel Desta et al., 2021 suggested that in BRT, many lanes operate through interconnected technologies, and the time-series process (TSP) delay at any intersection is considered a major issue. The authors’ proposed simulation models were developed for selected intersections along with real-time calibration and validation. PTV Vissim (a microscopic multi-modal traffic flow simulation software package developed by PTV Planung Transport Verkehr AG in Karlsruhe, Germany) with VisVAP (vehicle-actuated programming) add-on simulation tools was used for the evolution of the TSP. The authors generated different scenarios with and without the TSP to conduct experiments to evaluate the performance of BRT concerning traffic. According to their findings, the TSP reduces the time of travel and delays control, and hence it improves speed, and it can decrease passengers’ delays by 10–20% [42].
Rafidah Md Noor et al. in 2021 proposed a model for predicting trip time with good precision using data mining algorithms such as the support vector machine (SVM) and artificial neural network (ANN) algorithms. They conducted a case study on a shuttle bus that runs at a university. This study also deliberated the cost of fuel and the emission of gas during transportation. It was concluded that ANN performs better than SVM. Moreover, the authors recommended a system for the selection of suitable routes [43].

2.2. BRT Lines in Karachi

The Karachi Transit Arterials plan is the official mass transit master plan announced by the Pakistani government in 1995. The proposal was developed for the Karachi Mass Transit Project in 1990, it suggested overhead and on-ground bus lanes. Bus routes were intended to be compatible with the light rail transit (LRT) service. Numerous efforts were made to fulfill the design, but these routes were never established. The initial busway design was transformed into a railway system, and private investors were awarded a build, operate, and transfer (BOT) concession on Corridor I; however, all plans failed. Meanwhile, under the “Public-Private based ecologically friendly public transport system for Karachi in 2006”, the BRT system was proposed. This research introduced a modern-style BRT infrastructure to Karachi, and BRT gained popularity among Karachi’s transportation officials and planners [44].
The scheme suggested included 16 BRT lines, 21 secondary lines, and peripheral routes. As part of the Megalopolis Project, the Asian Development Bank (ADB) took over the BRT program and proposed three priority lines. Eventually, the ADB abandoned the BRT proposal in 2007. From April 2010 to June 2012, the Japan International Cooperation Agency (JICA) collaborated with the Karachi Mass Transit Cell (KMTC) and City District Government Karachi (CDGK) on the Karachi Transportation Improvement Project (KTIP). The master plan phase and the feasibility study comprise the KTIP.
The JICA Study Team suggested KCR (Karachi Circular Railway), two railway systems, and six BRT lanes in the master plan study. Every route was given a color to make it easier to understand. Following the master plan stage, the JICA chose two BRT routes, the Green Line and the Red Line, for the feasibility report. From July 2011 to June 2012, the Green Line and Red Line preliminary studies were carried out. With 57 stops, it was intended to provide bus routes in the road median along the Green Line (M.A. Jinnah Road–Gurmandir–Lasbela–A.O. Clock–Surjani) and Red Line (Regal Chowk–People’s Roundabout–University Road–Model Colony [45].

2.3. Present Situation of Public Transport in Karachi

Karachi’s public transportation system is now terrible. Bus passengers account for around 5.6 million each day, 40% of all vehicular travel modes. With about 21,800 certified buses and minibusses, a bus transports 257 people every day. Buses go at an average speed of 17 km per hour. Overloading, including rooftop seats, waiting for travelers at a bus station for a longer period, no stopping at bus stations with a limited number of passengers, and low frequency during off-peak hours are typical in Karachi since buses are managed by individual operators who strive to maximize ticket income. Figure 2 depicts how bus services are unreliable, crowded, unsafe, and unpleasant. People who can utilize other forms of transportation favor SOVs, rickshaws, and taxis over buses [46].

2.4. Future Urban Growth in Karachi

In 2010, Karachi’s population was estimated to be 18.9 million. Figure 3 shows that the population grew to 27.6 million in 2020 and is expected to reach 31.6 million in 2030. This indicates that almost 10 million additional residents will be added to Karachi City during the next two decades.

2.5. Necessity of the Project

With limitations such as a lower capacity than train systems and the use of current road capacity, BRT systems are not the ideal answer for Karachi’s public transportation system. However, the capital costs for a railway system are prohibitively high, and only the KCR is achieving progress with JICA funding. Moreover, the rising megacity cannot afford a public transit system until the city’s income growth is good enough to justify an expensive project. Therefore, in terms of cost-efficiency and recourses, BRT is the optimal method for the planned routes for improving Karachi’s mass transit system.

2.6. Bus Rapid Transit

BRT is an executive bus service that provides faster, more efficient, and more luxurious services than typical public transportation. BRT is an exclusive route connected to KCR, with a high speed, exact trip time, and large capacity [44].

2.6.1. World Trends

In 1974, Curitiba (Brazil) launched an executive bus service. It is currently acknowledged as the world’s first effective operation of BRT. Even though some cities have adopted advanced bus services such as busways and dedicated bus lanes, as seen in Figure 4. Bogota (Columbia) built an advanced BRT system (TransMillenio) in 2000, which had a huge influence on transport planners and stakeholders worldwide. It demonstrates that BRT, like railway systems, can provide large-capacity transportation services [45].
BRT was launched in a few major cities throughout the world in the 2000s, such as Taipei (2001), Seoul (2004), Jakarta (2004), Beijing (2005), New Delhi (2008), Istanbul (2008), Lima (2010), and Bangkok. BRT was already regarded as a cost-effective public transport system that may alleviate urban transportation problems in both developed and developing economies.

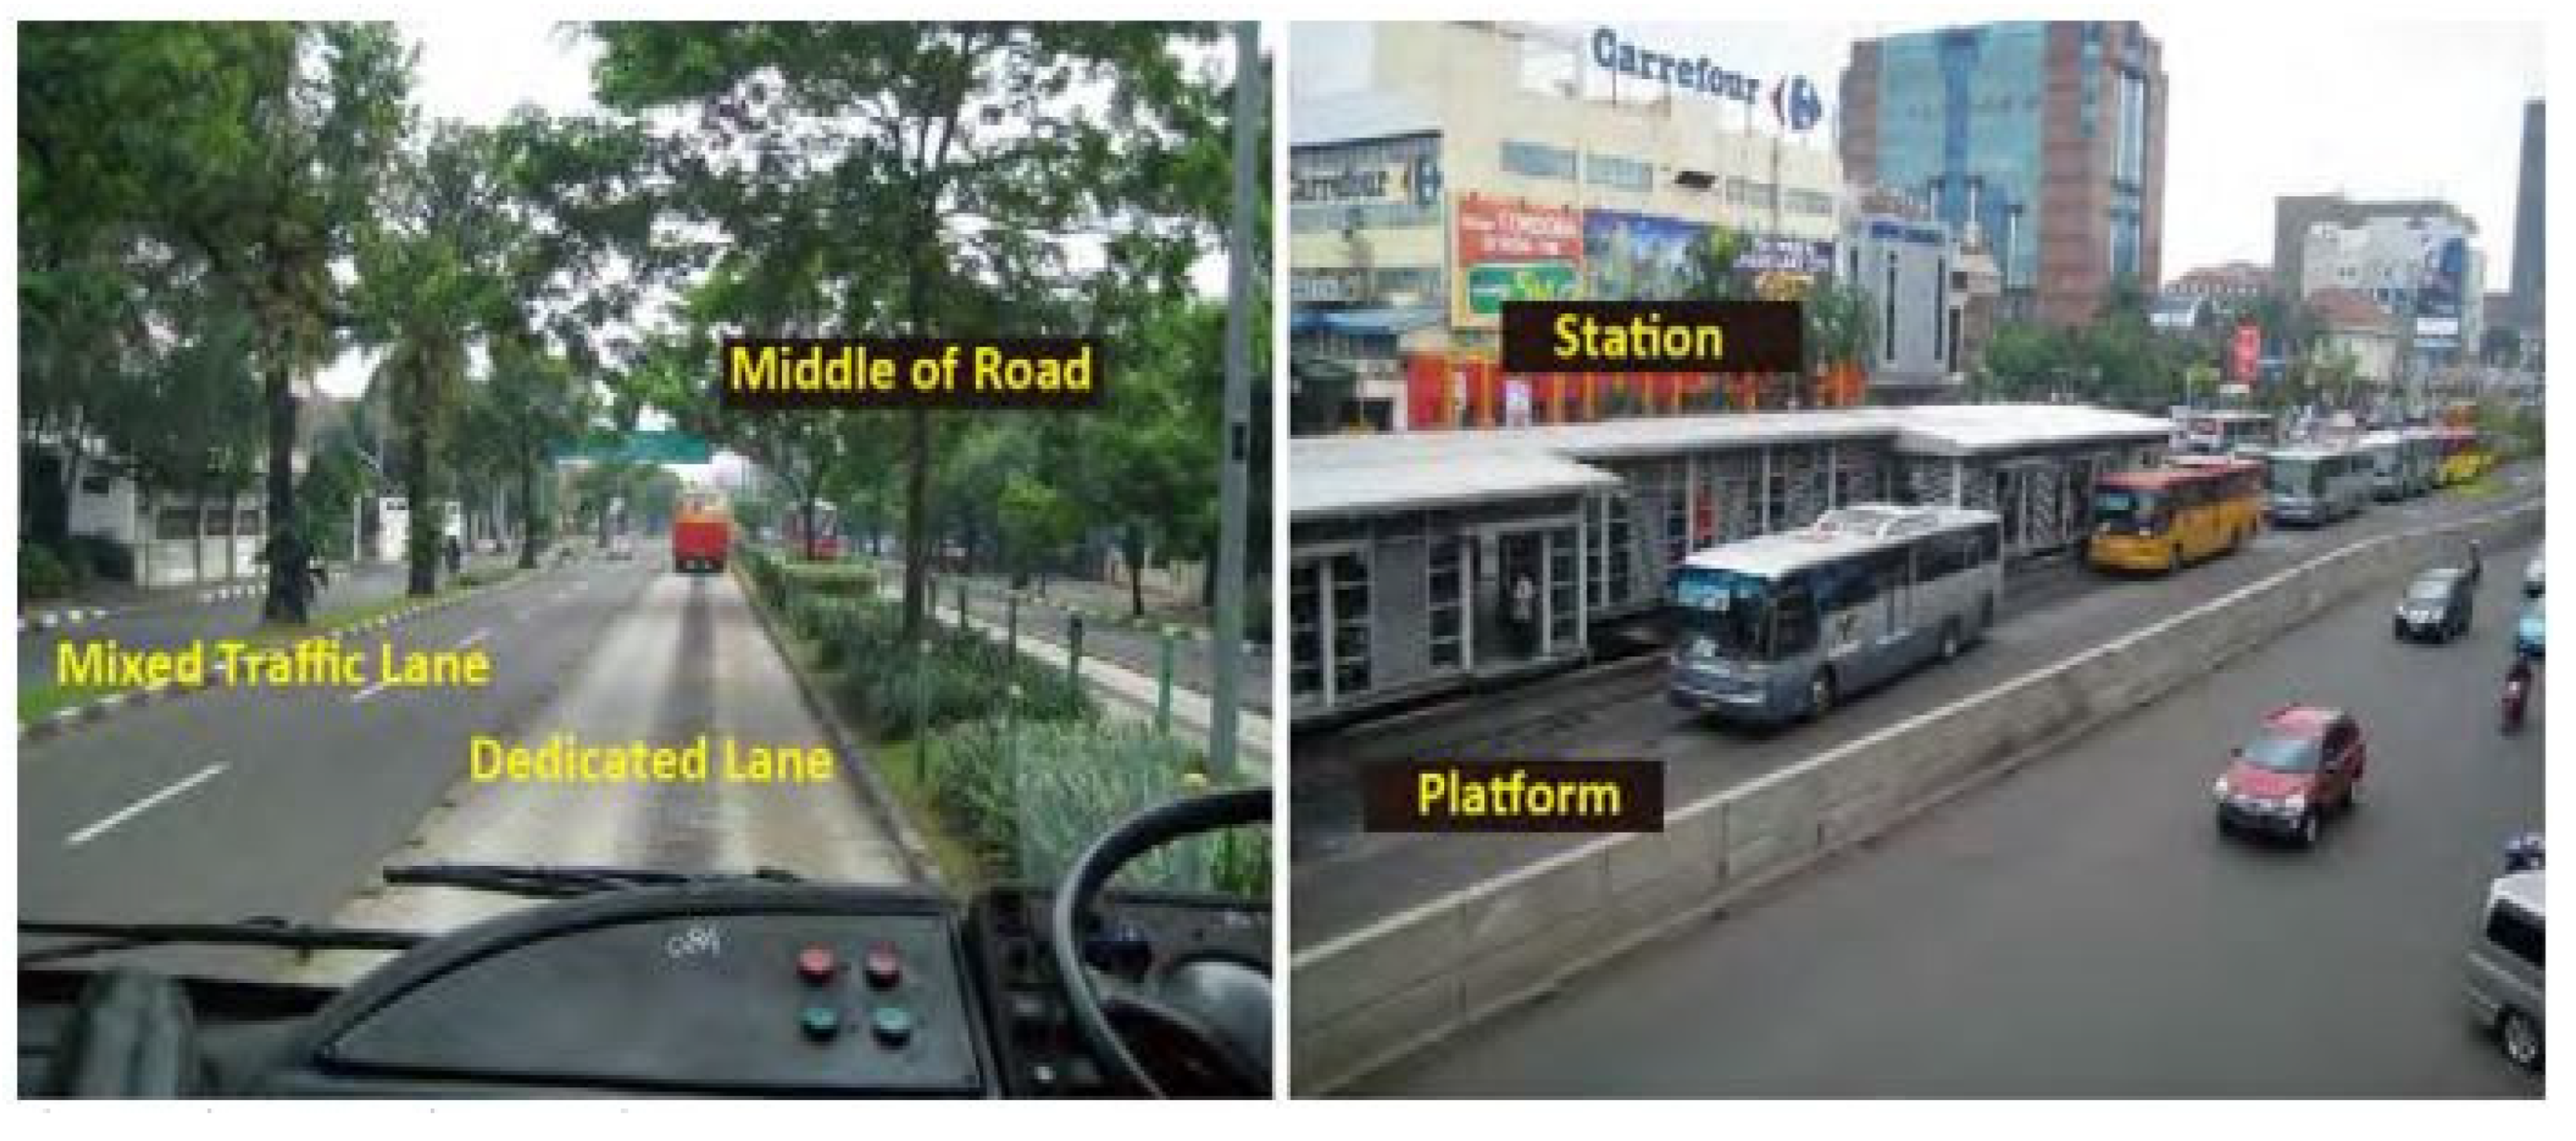
2.6.2. Major Feature of BRT

As illustrated in Figure 5, there are several variants of BRT systems across the world. Although articulated buses are common, many cities still utilize standard-sized buses. The following are the key criteria of effective BRT systems:
  • Segregated bus lanes in the center of the road (on the ground).
  • Platforms for smooth loading or unloading.
  • High frequency and swift operation.
  • Separation of paid and unpaid sections in a station for pre-boarding fare collecting.
  • Minimal rates in comparison to other public transportation systems.

2.6.3. BRT Capacity

The Bogota BRT (TransMillenio) demonstrates that a BRT system may provide transit capacity comparable to a train system, with a capacity of 43,000 travelers per hour in each direction. Many cities have considered BRT as an alternative to rail-based public transportation systems. Conversely, TransMillenio is exclusive, with no other BRT achieving such a high traveler flow. The popularity of TransMillenio created a perception about BRT’s potential, as though BRT could be a potential alternative to the train system. A basic BRT has a rated limit of roughly 13,000 travelers per hour in each direction. BRT payload, like railway capacity, is determined by service frequency and fleet capacity. The frequency of service is determined by stay duration and departure time. When the stopover, duration, and departure times are 20 and 20 s, consecutively, the frequency is computed to be 1.5 buses per minute (60/(20 + 20)), which equates to 90 buses per hour (1.5 × 60). The capacity is assessed at 13,500 if express buses with a capacity of 150 passengers are employed. This is the scenario when the parking bay is always occupied by automobiles. Vehicle speed is affected by the number of times cars use a parking bay (saturation level). To guarantee good operation, the saturation level should be less than 0.4. If 40% of the potential is occupied, then the previously computed potential becomes 5400 travelers per hour in each direction. Additional parking lots can be added to enhance efficiency.
If a terminal has three parking yards, the previously stated capacity (5400) rises to 16,200. The number of circulating buses (express operation) is another major component in increasing transportation capacity. It should be noted that the inclusion of parking bays necessitates the use of a passing lane at the terminal. Figure 6 depicts travelers’ volume per hour in each direction throughout the world. Only Bogota’s BRT has a capability of 43,000 passengers, with Sao Paulo and Santiago coming in at around 20,000. Curitiba and Quito have a circulation of around 12,000–13,000. Other urban centers have passenger volumes ranging from 3600 to 9000.

2.6.4. Speed

Experiences from across the world reveal that BRT is not always a high-speed infrastructure. A regular BRT’s average operational speed is roughly 20 km/h, ranging from 15 to 25 km/h, whereas TransMillenio averages about 30 km/h. A basic BRT is projected to reach operational speeds of 25–30 km/h. The operational speed is affected by the distance between stations, the number of junctions to be traversed, and the time it takes at stops. Due to junction delays, the top speed of a BRT without stops would be around 30–40 km/h, based on the signal offered to BRT routes. With stops, the pace would drop to 20–30 km/h. Given that the average pace of current minibusses in Karachi is around 17 km/h, a speed of 20 km/h will provide relatively little advantage in terms of travel time savings. As a result, higher operational speed than minibusses is required.

2.6.5. Why BRT System Is Proposed for Karachi

In previous studies, the BRT system was considered a mass transportation method for Karachi since it is a more cost-effective network than train systems.
Because of the following reasons, a BRT system is being suggested for two corridors:
  • Travel time is consistent.
  • Swifter than buses.
  • Interval is consistent.
  • Prioritize visual messages on public transportation.
  • Lower capital costs.
  • Localized system.

2.7. Proposed BRT System for Karachi (Green Line Route)

As indicated in Figure 7, the Green Line’s terminal sites are Municipal Park (Aurangzeb Park) in the center and Surjani Town Sector 7. Since the segment between the Tower and the Cloth Market is too congested and busy for a BRT service, the line’s endpoint is a small park. Cars make a U-turn at the intersection. The BRT depot is at the opposite terminal point. M.A. Jinnah Road–Jahangir Road–Business Recorder Road–Nawab Sadiq Ali Khan Road–Khayaban-e-Sher Shah Suri–Shahrah-e-Usman–Chaudry Fazal Ellahi Road–Rd 5000 is the route. The overall length is 21.70 km.

2.8. Economic Benefits of the BRT

2.8.1. Travel Time Reduction of Bus Passengers

In Karachi, the operational speed of a minibus is now 17 km/h. The BRT system is anticipated to run at a speed of 25 km/h on average. This will minimize passengers’ trip time. The annual savings from reduced travel time are anticipated to reach PKR 2.69 billion [44,45].

2.8.2. Reduction in Vehicle Operating Cost (VOC)

The use of big buses for the BRT service will lower the number of buses, saving fuel and vehicle running expenses. The overall annual vehicle operational cost savings are projected to be PKR 3.49 billion [45].

2.8.3. Improvement in City’s Image

In recent years, megacities throughout the world have adopted BRT systems, impressing the world with their economic growth. The mass transit network in these urban areas became a reflection of the city’s constant progress. Karachi’s image will improve because of the BRT system, which will use contemporary cars [45].

2.8.4. Increase in Women’s Trips

Women’s travel rates in Karachi are now quite low due to social and cultural factors. However, one of the factors is a weak transportation system. The BRT system will be a safer mode of transportation than the current minibusses. The project would encourage women to travel more to socialize [12,45].

2.8.5. Crime Reduction

The BRT service would assure transparent fee collection by deploying ticket barriers and surveillance cameras to prevent free passengers. Surveillance will be deployed at strategic intersections to supervise the functioning of BRT operations. Video surveillance can help to minimize criminal activity in the city. Lights at stations will help to decrease criminality at night [45].

2.8.6. Pedestrian Safety

Pedestrian crossings will be built to provide access to BRT stations. People who do not utilize BRT can use pedestrian crosswalks. The additional pedestrian crossings will increase the number of access places along the corridors, encouraging users to use the crossings rather than crossing busy roadways. Traffic accidents on the roadway involving pedestrians and automobiles are predicted to reduce [12,45].

2.8.7. City Development

Gadap Town development is a significant land-use reform because the BRT route connects the north of New Karachi to the city center. As indicated in Figure 8, the urban development in the north would be supported.

2.9. Factors That Influence the Choice of Travel Mode

Factors are employed in a variety of transportation and attitude models. Magelund investigated how numerous factors influence passengers’ choice between SOVs and public transportation. Magelund did not include automobile ownership as an explanatory feature in its model because it is persistent on the other characteristics. Her research shows that gender does not predict behavior but is highly connected to wealth and work-related characteristics. Income and employment, on the other hand, have a significant impact on the mode of transportation chosen. The findings indicate that opinions have a significant point of clarity. Travelers who use public transportation have low salaries and poor parking at their employment. People who choose an automobile are guided by work-related considerations [48,49].

2.9.1. Some Ways of Classifying Factors That Affect the Choice of Travel Mode

Numerous variables influence modal choice, ranging from vehicles and public characteristics (descriptions of the different components of the transportation system) to two personally related elements such as a traveler’s views and conduct. In the literature, these factors are classified in a variety of ways. Some of them are discussed more below. Figure 9 depicts the many variables and associated variables.

Hard and Soft Factors

Researchers have opted to categorize the characteristics as hard or soft, with hard factors being simpler to assess than soft ones. Hard factors are commonly encountered in classic transport mode choice models that are focused on utility maximization. Examples of hard facts are journey time, wait time, and ticket price (fare). Comfort, service, and information are examples of soft factors. Soft variables can also be psychological, such as flexibility, the flexibility of orienting, and so on [49].

Internal and External Factors

Factors influencing mode selection can alternatively be classified as internal or external. Attitudes, social and demographic characteristics, habits, and perceived amount of control are examples of internal factors. External influences include the amount of time spent and the expense of the trip [50].

Subjective and Objective Factors

Rystam (1998) utilized another method to divide the variables into subjective and objective variables. The objective variables are often based on objective acts and are easily quantifiable. Rystam considered other so-called hard standard variables, such as travel duration, fare, and so on, as objective considerations, as well as soft factors such as comfort, information, and so on. The objective measure also includes socioeconomic aspects such as gender and age, as well as trip-specific ones such as intent. Weather, geography, safety, and the environment are examples of additional objective aspects. Estimates of the traveler’s traits, attitudes, and quality of life are examples of subjective elements. These effects are dependent on a person’s consciousness and are typically more difficult to define [51].

3. Materials and Methods

This research flow is further divided into three parts based on the nature of the study design. The research begins with an overview of the present urban transportation system in the studied location. The first step is pre-analysis, usually referred to as preliminary analysis, the second is scientific analysis, and the third is post-analysis. The research methodology diagram as shown in Figure 10 below depicts the details of the three phases. This research relies on original data. Primary data were acquired via a self-administered questionnaire, which is also addressed further below.
The study’s primary target group was private transportation users (SOV users). SOV travelers were asked to complete a self-administered survey form. To fulfill the demand, the surveys were filled out both physically at the office and via a Google survey technique. The study survey had both revealed and stated preference methods.
The technical analysis step addresses data modeling. To determine the relationship between dependent and independent variables, the Chi-square test (χ2) of association is used.

3.1. Data Source

There are two approaches to data collection; one is revealed preference (RP), and the other is stated preference (SP), which are discussed below.
A self-administered survey questionnaire was adopted by using the stated and RP method. The travelers were asked hypothetical, socioeconomic characteristics questions for their trip and mode choice information from home to office and office to home.

3.2. Survey Strategy

As discussed earlier, this research strategy is based on a survey. Survey research is the gathering of primary data by asking respondents about their behavior, attitude, and opinions in a systematic manner. This strategy is most widely adopted in primary data collection. It is used to obtain many kinds of different behaviors, attributes, and situations. This method provides information more quickly and at a lower cost than other observational or experimental strategies.
In this research, there is only one study area for data collection which is Karachi. Surveys for non-users of BRT services as private transport users and captive users were conducted. This survey was carried out physically by the researchers and online using Google Forms in Karachi during office hours at workplaces in the CBDs of the city. Self-administered questionnaires were physically filled by individual travelers at their workplaces in Karachi.
The survey was conducted during office hours especially in the early morning from 7:30 A.M. to 9:00 A.M. The survey collected information on the real trip choices made by the users (RP) and information related to hypothetical situations (SP). The SP data were evaluated to determine the traveler’s willingness to use or not to use the BRT service.

3.3. Target Population

This research mainly focuses on employees or working people. Especially those whose workplaces exist in the central business districts of the city center of the study areas. The main reason to choose working people is that they perform their journey at a given moment and at a specific place at the peak times of morning and evening, which is the leading cause of traffic jamming and congestion. This study, only focuses on private transport users. It was preferred to make the study meaningful; the researchers only focused on the employees of the study areas. There was no age limit for the respondents because they were all working people and therefore had to be above 18 years old and independent. There is also a benefit of choosing working people because they usually travel at peak times. The respondents were asked to participate in the study. If they agreed, a self-administered questionnaire was provided to the non-users of the BRT service at their workplaces.

3.4. Questionnaire

The questionnaire is a general term that includes all methods of data collection where each person is asked to respond to some set of questions in a predetermined way [52,53]. The structure of a questionnaire differs based on how it is directed and, specifically, the number of contacts with the respondents. A questionnaire has two types: self-administered and interviewer-administered, as shown in Figure 11 [54]. The self-administered questionnaire is a quantitative research approach. This questionnaire is further divided into three types: internet questionnaire, postal questionnaire, and delivery and collection questionnaire. In contrast, the interviewer-administered questionnaire is divided into two categories: telephone questionnaire and structured interview. This approach is adopted in qualitative research.
In this research, a self-administered questionnaire was adopted due to the quantitative research approach. There were two kinds of approaches adopted in the self-administered questionnaire: internet-mediated and delivery and collection questionnaire. The Google Forms method was selected for the internet-mediated questionnaire.

Questionnaire Content

The questionnaire’s contents depend upon what a researcher needs to ask. That questionnaire can provide unprecedented information about the long-term social and economic well-being of the study area. Questionnaire variables are the main part of the questionnaire content. There are three types of questionnaire variables: attributes, opinions, and behaviors [54]. The attribute variable contains data regarding the characteristics of respondents, such as age, income, gender, occupation, marital status, educational level, etc. The opinion variable records how the respondents feel about something, what they think or believe is true or false, or what they are willing to adopt or not. This type of variable is known as an SP in mode choice modeling research. Finally, the behavioral variable refers to behaviors, as its name suggests. This variable contains data on what respondents did in the past, are doing now, or will do in the future. The behavioral variable is known as an RP in mode choice modeling research. There is little difference between opinion and behavioral variables—there is a thin line between these two variables.
In light of the above questionnaire contents and their variables, this research also contained these three variables. Attribute variables contained only sociodemographic variables: age, sex, income, education, household size, and transport ownership. The behavioral variables contained the environment, trip, transport, quality, attitude, and uncertainty-specific variables. This behavioral variable is also known as an RP. Furthermore, the opinion variable, which states a preference (SP), contained only three variables: transport, quality, and uncertainty, as shown in Table 3.
The questionnaire was designed to find out travelers’ willingness to use or not to use BRT services for different aspects and to collect comprehensive information about travelers’ characteristics. A questionnaire was filled out by both private and public transport users.
The questionnaire was divided into two parts. Part A consisted of information regarding the attributes of travelers/respondents, and it had six questions. Part B was about travel characteristics: stated and RP. This part consisted of thirteen questions. The overall traveler characteristics studied with behavioral and opinion variables are included, as shown in Table 3, in which mode choice, traveling time, travel cost, trip time, the frequency of public transport, travel cost, traveling time, weather conditions, and parking availability at work and home are included. The questionnaire also included questions about the current situation in which uncertainty-specific factors such as snatching, robbery in public transportation, uncertain conditions of the city, and the threat of terrorism and violence were mentioned.
The questionnaire also included questions about the factors that would make them use the BRT service more frequently than today, as well as distances between BRT stations and the workplace. The travelers were also asked about their fuel cost to work by car and the distance from home to work. Socioeconomic questions were included, such as age, gender, income, family size, and qualification. Finally, a hypothetical question was asked about the willingness to use or not to use the BRT service in the future.

3.5. Sample Size and Strategy

The sample size was determined as per the selection of sample size consistent with the required accuracy of the estimated population which is an important consideration for any research. From the number of the sample frame, the sample size was calculated to select the number of respondents required to be surveyed. The formula to calculate the sample is in Equation (1):
n = N/1 + Ne2
where n is the sample size, N represents population size, and e is a standard error. The sample size for this study was 382, according to Krejcie and Morgan’s sampling method shown in the above equation [55,56]. Ortuzar and Willumsen in 1996 [57,58] mentioned that the sample size should not be less than 250 observations. Recent research in England suggested that the sample should be large enough so that when it is divided into groups, each group will have a minimum sample size of 100 [59]. The sample size for this study was 500 samples of SOV users taken from Karachi Green Line routes.
A non-probability purposive sampling technique was adopted to present the targeted population. Purposive sampling is also known as the subjective, judgmental, or selective sampling technique [60]. It contains a specific purpose and uses people relevant to the targeted area and leaves unmatched with the sample of the research. This method of sampling is chosen because the population of study areas is known, but the sample frame or probability of sample selection is unknown. In other words, it is hard to know the population of buildings, departments, or offices, particularly in study areas. Furthermore, there are different purposive sampling approaches in which a homogeneous sampling approach is suitable for this study. The homogeneous sampling technique is used to focus on a sample that shares the same characteristics or traits to achieve a homogenous sample.
This method is popular in many areas of research that focus on a specific point. This method of sampling is also supportive of the research that is relevant to the field of transportation [17]. The researcher, in general, focuses on respondents from the selected targeted people for the research to obtain proper feedback.
This section is about the research methodology adopted for this study. This research had explanatory and cross-sectional time horizons. The survey strategy was adopted which was based on primary data through a self-administered questionnaire.
Moreover, research methods and their flow are defined in detail. After that, the study variable considered in this research is discussed. Data sources are discussed, in which the type of data collection and revealed and SP approaches are expressed in detail. Consequently, under Survey Strategy, study areas and methods of data collection are elaborated on in detail. The targeted population is also highlighted, defining the specific population considered in this research.

4. Data Analysis

The cross-tabulation technique was used to compare the characteristics of a group with the willingness to use the BRT service. The Chi-square test ( χ 2 ) for association was selected to know the association between dependent and independent variables. This test explores whether two nominal and ordinal variables are associated. This test also decides if two factors are statistically independent. Hence, this test is correspondingly referred to as the Chi-square test of independence. Additionally, it tests for the association/independence between two nominal/dichotomous factors. The estimation of χ 2 is ascertained by taking the squared differences between the observed frequencies and expected frequencies divided by the expected value as shown in Equation (2). This is performed for all categories of the factors, which are then summarized.
χ 2 = ( O E ) 2 E
where O = the observed frequency and E = the expected frequency. Cramer’s V ranges from 0 to +1 with a value of 0 indicating no association and a value of 1 indicating a complete association. According to Laerd Statistics 2016, Cohen (1988) suggested the guidelines for interpreting Cramer’s V, as shown in Table 4 [61].

4.1. Sociodemographic Factors of Karachi SOV Travellers

This segment elaborates on the detailed sociodemographic characteristics of the selected population. Table 4 shows the Chi-square test of association between sociodemographic factors and willingness to switch to the BRT service among Karachi city center employees. In overall terms, 90% (450) of respondents were male, and the remaining 10% (50) were female. A graphical representation of willingness to switch and the sociodemographic factors is presented in Figure 12.
A Chi-square test of association was conducted between willingness to switch and gender. All expected cell frequencies were greater than five. There was a statistically significant association between willingness to switch and gender, χ2 (1) = 41.179, p < 0.0005. The association was moderately strong, with Cramer’s V and φ = 0.203.
In the survey, age was distributed on five different scales as illustrated in Figure 12. Around ninety percent of respondents were in the age group of 21–50 years: 30% (155), 32% (160), and 26% (130) respondents belonged to the age groups of 21–30, 31–40, and 41–50, respectively. Subsequently, eight percent of respondents were 51–60 years of age, and the remaining three percent, which were only male respondents, were 60 and older. All expected cell frequencies were greater than 5. A significant association was found between willingness to use BRT services and age groups, χ2 (4) = 29.381, p < 0.0005. Cramer’s V = 0.171 shows there is a small association between willingness to use the BRT service and age groups.
Respondents were categorized into five different monthly income levels: PKR 30,000/−, PKR 30,001–60,000/−, PKR 60,001–120,000/−, PKR 120,001–180,000/−, and above PKR 180,000/−, as shown in Figure 12. The Chi-square test was conducted, and all the cell frequencies were 9.60 which was greater than 5. A moderate significant relationship between willingness to use and income per month was found, χ2 (4) = 58.546, p < 0.0005. Cramer’s V = 0.242, as shown in Table 5.
Education is divided into four preliminary stages: secondary, post-secondary, master’s, and Ph.D. educational levels. Most of the respondents (70%) belonged to the master’s level of education. The second-highest number of respondents (21%) were graduates (post-secondary). Almost all levels of education are willing to use the BRT service. Few Ph.D. scholars are also willing to use that service, as shown in Figure 12. The Chi-square test of independence was applied to know the association between willingness to use and level of education. Only one cell Ph.D. has an expected count of less than five which was 2.40, which shows no association between the “No” option of willingness to use the BRT service. Overall, near to moderate relationships were found between the willingness to adopt BRT services and the level of education, χ2 (3) = 53.102, p < 0.0005. Cramer’s V = 0.230.
In the survey, more than 50% of participants’ household sizes were around five to seven persons, as shown in Figure 12. There were few respondents who had a household size of one person only. Pakistan’s average household size is 6.41 according to the report of the “Express Tribune with the International New York Times”, 2015, around 13% of people had a household size of more than seven people. The second highest frequency of households was two to four persons, which is 35%. A Chi-square test of independence was conducted between willingness to use and household size. All expected cells were above five except for the one-person household size. There is a statistically moderate association between these two variables, χ2 (3) = 70.580, p < 0.0005. Cramer’s V = 0.266.
There are three categories of transport ownership: motorbike, car, and car+motorbike, as shown in Figure 12. It can be seen that more than sixty percent of almost six hundred and fifty employees owned a car, eleven percent (55) had a car and a motorbike, and approximately twenty-five percent of respondents had a motorbike. The Chi-square test of independence shows that the minimum cell count frequency is 24.60 which is greater than 5. A small significant relationship between willingness to use and income per month was found, χ2 (3) = 11.167, p < 0.011. Cramer’s V = 0.106.

4.2. Environment-Specific Factors of Karachi SOV Travellers

Environment-specific factors have significant value in the usage of the BRT service and in mode choice as discussed in the literature review section. There are two variables: protecting the environment and harsh weather. Protecting the environment is included in the willingness to use the BRT service, but harsh weather contributes to not using the BRT service, as shown in Figure 13. There were 380 out of 500 respondents who were willing to use the BRT service. Almost 55% of them agreed on the issue of protecting the environment, as shown in Table 6. Respondents who were not willing to change their mode of transport accounted for almost 24% (120). Only 9% (45) of them agreed on the issue of harsh weather. The rest did not agree with the factor of harsh weather.
The Chi-square test of independence was applied, and it was observed that there is a strong association between the variables of protecting the environment and harsh weather and the willingness to use BRT services, with a value of exactly 1 out of 1; the detailed result is elaborated in Figure 13 and Table 6.

4.3. Trip-Specific Factors of Karachi SOV Travellers

Trip-specific factors consist of trip generation and trip distribution: the effect of travel time, transport sharing, dropping off kids and/or family members, going for shopping or errands, travel directly from home to office and office to home, travel expenses, the distance between office and home, travel time per trip, and trips per day.
Firstly, the effect of travel time is one of the most important factors in a trip. In this study, travel time impact was considered in relation to travelers switching to the BRT service. The impact of the journey time was measured on a Likert scale: Agree, Neutral, and Disagree, as shown in Figure 14. The Chi-square test of association was applied, and the results are shown in Table 7. There is a strong association between travel time and willingness to switch to the BRT service as Cramer’s V = 0.266.
Secondly, transport sharing is also an important factor. The respondents were asked if they shared their private vehicle for a home-to-office trip, and 75% (375) of people replied with “yes” which means they share their vehicle while going to the office as displayed in Figure 14. Therefore, it was imperative to measure the association of this factor, and the results show a quite low association between sharing transport and the willingness to adopt the BRT service.
Dropping off kids or family members and going shopping before or after coming from the workplace are also reasons to use a private mode of transport instead of public transport. This factor also needs attention to understand the travel behavior of travelers to persuade them to switch to the BRT service. These factors were also tested through three-point Likert scales as with the travel time factor. It was observed that almost 90% (450) of respondents do not drop their kids or family off and do not go shopping. There are only 10% (50) of employees who are dropping off their kids and family members and going shopping, and they are not willing to switch their mode of transport to the BRT service and want to remain with their current modal split. Similarly, the Chi-square test of association was applied, and a strong association was found between willingness to switch to the BRT service and dropping off kids/family members and going for shopping. All the expected cell frequencies were above 5, χ2 (2) = 1000, p < 0.0005. Cramer’s V = 1.
There can be a few other errands or factors that are involved in the trip from home to office and office to home. Therefore, the respondents were asked the general question of “travel directly from home to office and office to home” in the form of “Yes” and “No”. There were 76% (380) of the respondents who directly travel from home to office and office to home, and around 10% (50) of them are not willing to use the BRT service. The remaining 22% (110) of respondents replied with “No”, meaning they do not directly go from home to office and office to home. Moreover, 20% (100) of them are willing to switch to the BRT service. There is a quite low or near to no association between willingness to switch and directly going from home to office and office to home. All the expected frequencies were more than 5, and the minimum expected count was 33.60. Therefore, this variable was found insignificant and was taken out of further model development.
Travel expenses are included, and it is a major factor. Here, the travelers were asked about their monthly travel expenses related only to office trips. Travel expenses are distributed into six categories from 3000/− to 15,000/− Pakistani rupees (PKR). There were almost 138 respondents who had PKR 3000/− travel expenses, and approximately 150 respondents were willing to switch their mode of transport. There were virtually 210 respondents (42%) who have PKR 3001–6000 travel expenses, and almost 160 respondents from them are willing to shift their mode of transport. The rest of the four categories are shown in Figure 14. The association between travel expenses and willingness to switch to the BRT service is low. The minimum expected cell count is 7.20 which is more than 5. Further details of the Chi-square test of association are in Table 7.
The employees were then asked about the distance between home and office. There are five categories to measure the distance from home to office, as shown in Figure 14. In the first category, 135 respondents have less than 10 km of distance, from which 98 are willing to use the BRT service. A total of 130 respondents belong to the third category of 15.1 to 20 km of distance. A large number of them, 105 respondents, are willing to adopt the BRT service. The rest of the respondents are divided into the other three categories, and the majority are willing to adopt the BRT service, as shown in Figure 14. The Chi-square test was applied, and a moderate association was observed between the distance from home to the office and willingness to switch to the BRT service. The minimum expected count frequency is 33.70, and all cell frequencies are higher than 5; the other results are expressed in Table 7.
Travel time from home to office per trip was also asked of the employees, and it is divided into four categories: 5–10, 11–20, 21–30, and more than 30 min. It is interesting that 265 respondents, more than 50% (250), consume more than 30 min for a single trip from home to the office. Surprisingly, 205 of them are willing to adopt the BRT service. More specifically, 100 respondents consume 21–30 min and 200 spend 11–20 min on a single trip. Most of them are willing to switch their mode of transport to the BRT service. Consequently, there is the least association between willingness to adopt the BRT service and travel time according to the Chi-square test of association. There was no cell having an expected count of less than 5, and the minimum expected count is 16.80. The detailed statistical output is presented in Table 7.
Last but not least, the trip-specific factor is trips per day. It was also revealed by the respondents how many trips per day they perform from home to office and office to home. The maximum number of trips per day performed was three. Almost 94% (470) of the employees perform a single trip from home to the office, and most of them are willing to switch to the BRT service. Only 5% (25) perform two trips per day from home to office, and 1% (5) have three trips from home to office; both categories of respondents are willing to switch to the BRT service. A Chi-square test of association was applied, and there is also a weak association found between trips per day and willingness to switch to the BRT service. There is one cell three times a day that has an expected count of less than 5, and the minimum count is 2.10. Other statistical details are mentioned in Table 7.

4.4. Transport-Specific Factors of Karachi SOV Travellers

Transport-specific factors consist of six variables: mode of traveling, parking problem at the workplace, traffic congestion, fare rate cheaper than a car, and frequency of the bus. These variables were considered for the non-users of the BRT service.
The mode of traveling is a key part of this study. It is highly important to reveal the current mode of transport and its association with the willingness to switch to the BRT service. This variable has all the possible mode choices: walking, bicycling, motorbike, car, shared auto, para-transit (taxi, rickshaw), and public transport; however, only private transport users such as motorbike and car owners were focused on. There are only 48% (240) of respondents using the bike as a mode of transport, and almost 52% (260) of travelers are using the car as a mode choice for their workplace trips. From them, more than 80% of respondents are willing to adopt the BRT service, as shown in Figure 15. The Chi-square test of association was applied, and the value of association is 0.305. It reflects that there is a modest association between the mode of choice of Karachi’s respondents and their willingness to switch to the BRT service. Two cells have an expected count of less than 5, and the minimum count is 4.80 for both cells. Further details of the test are in Table 8.
Parking is one of the key elements in mode choice modeling. Easy availability of parking at the workplace can also encourage car users. Travelers, who are willing to use the BRT service, were asked if they were moving to the BRT service because of a parking problem in the workplace. This variable was measured through a 3-point Likert scale as described in Figure 15. It was found that more than 50% (250) respondents agreed about the parking problem at the workplace, and nearly 25% (120) disagreed, but they are also willing to switch their mode of transport. The Chi-square test was applied, and all the frequencies of cells have an expected count above 5, and the minimum expected count is 57.60, as shown in Table 8. There is a strong association found between parking problems and willingness to switch to the BRT service.
Traffic congestion also can be a factor that would cause travelers to switch to the BRT service. Similarly, this factor was also computed through a 3-point Likert scale, as shown in Figure 15. This factor was addressed to the respondents who are willing to switch to the BRT service. Almost 60% (more than 300) of respondents agreed that traffic congestion is also one of the reasons they would switch their mode of transport. There were also 15% (nearly 75) of respondents who disagreed with the traffic congestion issue. Through the Chi-square test of association, it was found that there is a close relationship or association between traffic congestion and willingness to switch to the BRT service. All cells’ expected count was more than 5, and the minimum count is 36, as described in Table 8.
Fare rate also can be a variable that can influence travelers to choose mode choice according to its affordability. Hence, the “fare rate is cheaper” factor was included in the questionnaire to ask the travelers if they were willing to adopt the BRT service. This factor was also measured through Likert scales “Agree, Neutral, and Disagree”. There are 63% (315) of respondents who agreed with this factor that cheaper fare rates than cars attract travelers to the BRT service, and almost 24% (120) of respondents disagreed with the influence of cheaper fare rates. A Chi-square test of association shows that there is a large association between cheaper fare rates and willingness to adopt the BRT service. There is no cell that has less than five expected frequencies; the minimum expected count is 55.20. Further details of the test are χ2 (2) = 1000, p < 0.0005. Cramer’s V = 1, as shown in Table 8.
Lastly, the frequency of the bus factor is also included in the data; this factor belongs to SP data. In the survey, this factor was asked with four choices: from 5 min to 20 min with the interval of 5 min. This question was asked of all the respondents who are willing to switch to the BRT service or not under the following condition: Under which circumstances would you like to use BRT service? A total of 165 respondents replied that bus frequency should be at every 5 min, out of which almost 50 belong to those not willing to use the BRT service. Secondly, nearly 150 employees, with 35 of them not ready to use the BRT service, said they would use it if the frequency of the bus was every 10 min. There was not a single cell that had an expected frequency of less than 5, and the minimum expected count is 37.44. The Chi-square test of association found that there is a very low association with the willingness to adopt the BRT service. Hence, the frequency of the bus variable was taken out of the model due to insignificance.

4.5. Quality-Specific Factors of Karachi SOV Travellers

The quality of life affects the individual’s mode choice. Therefore, it is necessary to consider quality factors to attract travelers. Comfort preference, expensive parking at the workplace, and avoiding mental stress are the variables that are considered in quality-specific factors. Further details of the test are shown in Figure 16 and Table 9.
Firstly, the comfort preference for public transport was included in the survey. There were two main choices for the comfort preference variable: an air-conditioned bus with the surety of seat availability and an air-conditioned bus with seat availability or comfortable standing. These variables count as SP data. This question was asked of both users and non-users of the BRT service. Almost 50% (250) of individuals prefer air-conditioned buses with the surety of seat availability, of which 62 respondents are not willing to adopt the BRT service. Similarly, the remaining nearly 50% (250) of participants agreed with an air-conditioned bus with the availability of seats or comfortable standing, of which 58 are not willing to adopt the BRT service. Moreover, the Chi-square test of association was applied, and a very low association was found between comfort preference and the adoption of the BRT service, and this variable was taken out of the model development. All cells’ expected frequencies are more than 5, and the minimum expected cell count is 119.04.
The expensive parking at the workplace variable was included to know if travelers would prefer to park their cars at the workplace if the parking at the workplace becomes expensive. Therefore, three choices were given to the respondents: safe and secure parking at the BRT lot with nominal cost, safe and secure parking at the BRT lot without any cost, and would remain with the current mode of transport. As a result, almost 50% (250) of respondents who agreed and 17% (87) who disagreed to adopt the BRT service chose the first option that safe and secure parking at a BRT lot with nominal cost will encourage them to use the BRT service. The second choice, safe and secure parking at the BRT lot without any price, was selected by almost 20% (99) of willing respondents, and only 50% (251) of respondents not willing to use the BRT service. The remaining respondents selected that they would prefer to park their car at their workplace at any cost. Furthermore, the Chi-square test of association was applied, and it showed that there is no significant relationship between the adoption of the BRT service and expensive parking at the workplace. Therefore, this variable was not considered for model development. All expected cells’ count is more than 5, and the minimum expected count is 17.28.
Avoiding mental stress is an important variable because, due to driving stress, travelers may prefer public transport. Thus, to explore the influence of this variable, it was included for the travelers who are willing to use the BRT service. This variable was rated using a 3-point Likert scale: “Agree, Neutral, and Disagree”. There were almost 330 respondents who agreed with the influence of the variable. The rest of the travelers did not agree with this variable. The Chi-square test of association was applied, and it reflected that there is a strong relationship between avoiding mental stress and the adoption of the BRT service. All cells’ expected count frequency is more than 5, and the minimum count is 24.00. Additional data from the test are presented in Figure 16 and Table 9.

4.6. Attitude-Specific Factors of Karachi SOV Travellers

Attitude-specific factors were tested as a modest variable through three specific variables: personal status, privacy, and car is convenient. Attitude-specific factors measure the psychological impact of travelers toward the BRT service. Personal status is concerned with the individuals who are using their private mode of transport. Therefore, this variable included testing its influence on the private transport users who are not willing to switch their mode of transport. This variable was also measured through a three-point Likert scale. The results show that there is a total of 120 respondents who are not willing to switch their mode of transport and remain with the same one; only 45 respondents, 9% of the total sample size, agreed with this variable, as shown in Figure 17. Moreover, the Chi-square test of association was applied, and the details are listed in Table 10. There is a good association between the adoption of the BRT service and personal status; there is no cell with an expected frequency count of less than 5, and the minimum is 21.60.
The privacy variable is also connected to private transport users. This variable was included to check the influence of privacy on the captive travelers of private transport. This factor was also tested through the above-mentioned three-point Likert scale. It was observed that almost 85 respondents out of 120 who are not willing to adopt BRT services agreed that privacy is a factor that is influencing them to be captive users of private transport. The remaining 35 respondents disagreed with this variable, as shown in Figure 17. The Chi-square test was applied, and it indicates that there is a strong relationship between the adoption of the BRT service and privacy. More details of the test are described in Table 10. No cell has an expected count of less than 5, and the minimum cell expected count frequency is 16.80.
The car is convenient, and therefore, this variable was also included to explore the influence on travelers who are not willing to change their mode of transport. This variable was measured through the same above-mentioned Likert scale. There were only 45 respondents from 120 who agreed that they are using the car because it is convenient, but the majority, around 75, disagreed with the influence of this variable. The Chi-square test of association found that there is a positive and vigorous association between willingness to adopt the BRT service and the car’s convenience. The expected cell count is more than 5, and the minimum frequency count is 21.60. Further details of the tests are shown in Table 10.
Travel time per day is also an important variable because travel distance can influence people to use a certain mode of transport. Thus, the effect of travel time per day on the travelers’ willingness to use the BRT service was examined. This variable asked all the respondents to choose their specific travel time range from four choices: 30 min to more than 2 h and 30 min. Consequently, almost 50% (250) of travelers spent 60 to 90 min traveling per day, and there were 28% (140) of individuals who spent up to 30 min per day on their journey to work. Additional details are shown in Figure 17. The Chi-square test of association was applied to check the association between willingness to switch and travel time per day. A moderate association was found between them, and the details are presented in Table 10. None of the cells has an expected count of less than 5, and the minimum cell count frequency is 7.20.

4.7. Uncertainty-Specific Factors of Karachi SOV Traveller

Safety and security are indeed the major concern of travelers. The parking lot of the BRT service must be secure enough to ensure the safety and security of travelers and their vehicles. This variable may affect the travelers; to ensure the effectiveness of this variable, it was tested through four SP options. A total of 418 travelers, more than 40% of the respondents, are willing to switch to the BRT services if safety and security are at a nominal cost. Secondly, the largest number of respondents, almost 44% (440), want safety and security without any cost. The details of the other two options are shown in Figure 18. The Chi-square test of association was applied, and it revealed that there is no significant association between safety and security on the BRT service and willingness to switch to the BRT service. Therefore, this variable was taken out of the model development. No cell has an expected count of less than 5. The minimum expected count is 5.76. Further details of significant variables are shown in Table 11.
The threat of robbery and snatching can be a major concern for travelers, especially when they are using public transport instead of their private vehicle. Therefore, this variable was included to check its influence on the non-users or not willing to use the BRT service. This variable was tested through a three-point Likert scale as described above. There were a total of 120 respondents (24%) not willing to switch their current mode of transport out of the 145 (19%) who agreed with the threat of robbery and snatching. The remaining 25 respondents disagreed with the variable. The Chi-square test of association was applied, and it was found that there is a strong association between willingness to switch and the threat of robbery and snatching. The minimum expected count is 12, and all the expected counts were more than 5.
The threat of terrorism/violence is a variable that can limit the activities of travelers. Due to the threat of terrorism, travelers may prefer SOVs and try to avoid the BRT mode choice. The threat of terrorism was tested through the above-mentioned Likert scale. A total of 75 respondents (15%) agreed with the influence of the threat of terrorism/violence. The remaining 23 respondents disagreed with the effect of the threat of terrorism/violence. Furthermore, the Chi-square test of association was applied, and it revealed that there is also a strong relationship between the threat of terrorism/violence and willingness to switch to the BRT service. No cell has an expected count of less than 5, and the minimum expected cell frequency is 21.60. Further values are shown in Table 11.
In conclusion, the Chi-square test of association was the primary statistical method applied to test the significant association between dependent and independent variables. Therefore, Table 12 shows the variables that are highly and moderately associated with the dependent variable of willingness to switch or not. In conclusion, the below factors’ null hypothesis is rejected, and the alternative hypothesis is accepted which shows that there is a significant relationship between these factors and willingness to switch or not to the BRT service.
An approach combining RP and SP was adopted in this study to model the determining factors that influence travelers’ mode choices. Firstly, the cross-tabulation technique was used to compare the characteristics of a group with the willingness to use the BRT service. The Chi-square test (χ2) of association was selected to know the association between dependent and independent variables. The variables with a high and medium level of association, as shown in Table 12, were used to develop a binary logit regression (BLR) model to find the best fitting model for the collected results from Karachi. From these variables, the best model was selected for the willingness to use the BRT service, and it revealed the best mode for captive users. Secondly, the chosen model is analyzed and discussed in detail below. The discrete choice model approach is adopted in which the binary logit model is selected on the nature of the data of travel behavior. In this sub-section, the model development is discussed in detail for willingness to use the BRT service.
The BLR model consists of independent/predictor variables (I.V): gender, income per month, household size, environment protection, harsh weather, travel time per trip, dropping off kids at school, going shopping, the distance between office and home, mode of traveling, parking problem, traffic congestion, fare rate cheaper, avoiding mental stress, privacy, personal status, the threat of terrorism/violence, the threat of robbery and snatching. BLR was conducted to examine whether I.Vs significantly affected the odds of observing the cluster coded as 1 of willingness to switch to the BRT service as shown in Equation (3). The reference group for the desire to shift was 0. Variance inflation factors (VIFs) were estimated to identify the presence of multicollinearity in the model. Variance inflation factors greater than 5 are cause for concern, whereas VIFs of 10 should be considered the maximum upper limit [3,11,63]. Table 13 presents the VIF for each predictor in the model.
U w i l l i n g n e s s   t o   s w i t c h = β 0 + β 1 × G e n d e r F e m a l e + β 1 × G e n d e r M a l e + β 2 ×   Age   × M o n t h l y   I n c o m e < R M 1000 + β 2 × M o n t h l y   I n c o m e < R M 1000 2000 + β 2 × M o n t h l y   I n c o m e R M 2001 4000 + β 2 × M o n t h l y   I n c o m e R M 4001 6000 + β 2 × M o n t h l y   I n c o m e > R M 6000 + β 3 × H o u s e h o l d   s i z e 1 + β 3 × H o u s e h o l d   s i z e 2 4 + β 3 × H o u s e h o l d   s i z e 5 7 + β 3 × H o u s e h o l d   s i z e > 7 + β 4 × T r a n s p o r t   o w n e r s h i p C a r + β 4 × T r a n s p o r t   o w n e r s h i p B i k e + β 4 × T r a n s p o r t   o w n e r s h i p B i k e + C a r + β 5 × P r o t e c t   E n v i r o n m e n t   ( N o ) + β 5 × P r o t e c t   E n v i r o n m e n t   ( N e u t r a l ) + β 5 × P r o t e c t   E n v i r o n m e n t   ( Y e s ) + β 6 × V e h i c l e   S h a r i n g ( N o ) + β 6 × V e h i c l e   s h a r i n g ( N e u t r a l ) + β 6 × V e h i c l e   S h a r i n g ( Y e s ) + β 7 × A v o i d   M e n t a l   S t r e s s ( N o ) + β 7 × A v o i d   M e n t a l   S t r e s s ( N e u t r a l ) + β 7 × A v o i d   M e n t a l   S t r e s s ( Y e s ) + β 8 × H a r s h   W e a t h e r ( N o ) + β 8 × H a r s h   W e a t h e r ( N e u t r a l ) + β 8 × H a r s h   W e a t h e r ( Y e s ) + β 9 × D r o p   K i d s   ( N o ) + β 9 × D r o p   K i d s   ( N e u t r a l ) + β 9 × D r o p   K i d s   ( Y e s ) + β 10 × S h o p p i n g   ( N o ) + β 10 × S h o p p i n g   ( N e u t r a l ) + β 10 × S h o p p i n g   ( Y e s ) + β 11 × P a r k i n g   P r o b l e m   ( N o ) + β 11 × P a r k i n g   P r o b l e m   ( N e u t r a l ) + β 11 × P a r k i n g   P r o b l e m   ( Y e s ) + β 12 × F a r e   R a t e   C h e a p e r   ( N o ) + β 12 × F a r e   R a t e   C h e a p e r   ( N e u t r a l ) + β 12 × F a r e   R a t e   C h e a p e r   ( Y e s ) + β 13 × T r a f f i c   C o n g e s t i o n   ( N o ) + β 13 × T r a f f i c   C o n g e s t i o n   ( N e u t r a l ) + β 13 × T r a f f i c   C o n g e s t i o n   ( Y e s ) + β 13 × P r i v a c y ( N o ) + β 13 × P r i v a c y ( N e u t r a l ) + β 13 × P r i v a c y ( Y e s ) + β 14 × C a r   i s   C o n v i n e n t ( N o ) + β 14 × C a r   i s   C o n v i n e n t ( N e u t r a l ) + β 14 × C a r   i s   C o n v i n e n t ( Y e s ) + β 15 × P e r s o n a l   S t a t u s ( N o ) + β 15 × P e r s o n a l   S t a t u s ( N e u t r a l ) + β 15 × P e r s o n a l   S t a t u s ( Y e s ) + β 16 × T h r e a t   o f   R o b b e r y   a n d   S n a t c h i n g   ( N o ) + β 16 × T h r e a t   o f   R o b b e r y   a n d   S n a t c h i n g   ( N e u t r a l ) + β 16 × T h r e a t   o f   R o b b e r y   a n d   S n a t c h i n g   ( Y e s ) + β 17 × T h r e a t   o f   T e r r o r i s m / V i o l e n c e   ( N o ) + β 17 × T h r e a t   o f   T e r r o r i s m / V i o l e n c e   ( N e u t r a l ) + β 17 × T h r e a t   o f   T e r r o r i s m / V i o l e n c e   ( Y e s )
There were eighteen predictive variables in the BLR model, and all of them were categorical and had different choices. All these eighteen variables were found to be significant variables, as shown in Table 14. Consequently, harsh weather (Yes), privacy (Yes), car convenience (Yes), and personal status (Yes) were found negatively significant. It is predicted that motorbike users and people who want to avoid mental stress and protect the environment are willing to adopt the BRT service. SOV users are willing to use BRT due to traffic congestion, fare rate being cheaper, and to avoid parking problems, but due to harsh weather, privacy, convenience, and due to personal status, they are not willing to use the BRT service. Finally, the threat of terrorism, violence, robbery, and snatching are the major concerns of private transport users regarding the shift to the BRT service.
The overall model was statistically significant, χ2 (19) = 0.0 p < 0.001, suggesting that gender, income per month, household size, environment protection, travel time per trip, dropping off kids at school, going shopping, the distance between office and home, mode of traveling, parking problems, traffic congestion, cheaper fare rate, avoiding mental stress, the threat of terrorism/violence, and the threat of robbery and snatching significantly affected the odds of observing one cluster of willingness to switch. The McFadden R-squared value measured for this model was 0.98. The classification table before including predictive variables showed that 76% of the cases could be accurately categorized simply if all cases were categorized as a willingness to switch. However, after the inclusion of independent variables, the model now correctly classifies 99.5% of overall cases. The sensitivity was 98.8%, specificity was 99.7%, the model’s positive estimated value was 99.6%, and the negative estimated value was 99.1%.

5. Conclusions

Data were discussed, in which all six factors were discussed in depth. The sociodemographic variables of gender, income, level of education, and household size were found moderately associated with the adoption of the BRT service. Environment and trip factors such as travel time, dropping off kids/family, shopping, and distance were strongly associated. In contrast, the quality factors of avoiding mental stress, personal status, privacy, car convenience, and uncertainty factors were highly associated with willingness to adopt the BRT service.
It is concluded from the study that there are many factors with positive and negative influences on the mode choice of travelers. Most private transport users are willing to use the BRT service as it is the most sustainable and convenient approach, under certain conditions. The most influencing variables are gender (male), household size (2–4 persons), income (below PKR 30,000 to 120,000), ownership of private transport (motorbike), environment protection (Yes), frequency of bus (15 min), transport share (Yes), avoiding mental stress (Yes), and time spent per day on traveling (61–120 min). Karachi’s private transport users positively influence all of these variables.
Similar variables that influence Karachi SOV users are monthly income and time spent on traveling. All of these factors that were found significant in this research can help policymakers to switch SOV users to a sustainable mode of transport. These variables can help but are not enough to switch SOV users to the BRT service. According to travel demand management, there are push and pull measures. There must be the adoption of both measures, such as frequency of buses, expensive parking at the workplace, and limited parking spaces at workplaces.
However, the current coronavirus disease 2019 (COVID-19) pandemic restricts urban mobility. Public transportation is being avoided by travelers. Travelers prefer their vehicles, which undoubtedly creates traffic congestion and increases road rage. Therefore, in this pandemic, BRT services can be a suitable mode choice, as it is a hybrid mode choice of private vehicle, walk, and public transportation. These research findings contribute to the literature and methodology in the field of mode choice modeling, specifically for developing the world. This study was focused on employees, who travel by a private mode of transport from home to office, specifically in the CBD of Karachi. Working people times are specified from 8 A.M. to 5 P.M., Monday to Friday in the city. These specific office times are morning and evening peak hours. A wide range of specific factors was synthesized such as sociodemographic, trip, transport, environment, quality, attitude, and uncertainty, and many of the variables of these factors were found significant.

Author Contributions

Conceptualization, R.S., I.A.M. and A.F.H.P.; Formal analysis, R.S., I.A.M. and A.F.H.P., W.A.M. and N.S.; Investigation, R.S., I.A.M., W.A.M. and Z.A.L.; Methodology, R.S., I.A.M., A.F.H.P., W.A.M. and Z.A.L.; Project administration, I.A.M. and A.F.H.P.; Resources, R.S. and I.A.M.; Software, I.A.M., W.A.M. and N.S.; Supervision, I.A.M. and A.F.H.P.; Validation, W.A.M., Z.A.L. and N.S.; Visualization, R.S., I.A.M., A.F.H.P. and W.A.M.; Writing—original draft, R.S.; Writing—review & editing, I.A.M. and A.F.H.P. All authors have read and agreed to the published version of the manuscript.

Funding

This research received no external funding.

Institutional Review Board Statement

Not applicable.

Informed Consent Statement

Not applicable.

Data Availability Statement

The data that support the findings of this study are available from the corresponding author upon reasonable request.

Conflicts of Interest

The authors declare no conflict of interest.

References

  1. Kun, J. Where the Rich Use Public Transport. 2016. Available online: http://newyork.thecityatlas.org/lifestyle/developed-area-rich-public-transport-ways-city/ (accessed on 14 November 2018).
  2. Ali, M.S.; Adnan, M.; Noman, S.M.; Baqueri, S.F.A. Estimation of traffic congestion cost-a case study of a major arterial in Karachi. Procedia Eng. 2014, 77, 37–44. [Google Scholar] [CrossRef]
  3. Memon, I.A.; Soomro, U.; Qureshi, S.; Chandio, I.A.; Talpur, M.A.H.; Napiah, M. Multilayer perceptron modelling of travelers towards park-and-ride service in Karachi. In Advances in Road Infrastructure and Mobility; Springer: Cham, Switzerland, 2022; pp. 1026–1038. [Google Scholar]
  4. Memon, I.A. Mode Choice Modelling to Shift Car Travelers towards Park and Ride Service in the CBD of Putrajaya and Karachi; Universiti Teknologi PETRONAS: Tronoh, Malaysia, 2018. [Google Scholar]
  5. Brohi, S.; Memon, I.A.; Kalwar, S.; Sahito, N. Predicting the use of public transportation service: The case study of Karachi circular railway. PalArch’s J. Archaeol. Egypt Egyptol. 2021, 18, 13. Available online: https://archives.palarch.nl/index.php/jae/article/view/7575; (accessed on 15 January 2022).
  6. Earth.Esta.Int. Karachi, Pakistan. 2021. Available online: https://earth.esa.int/web/earth-watching/historical-views/content/-/article/karachi-pakistan#:~:text=Situated%20on%20the%20Arabian%20Sea,the%20busiest%20airport%20in%20Pakistan (accessed on 25 December 2021).
  7. M. O. Statistics. Census Quick Results. Government of Pakistan. 2017. Available online: http://www.statistics.gov.pk/census-results.html (accessed on 11 September 2019).
  8. Indus, T. Research on Traffic Congestion. Toyota. 2017. Available online: http://www.toyota-indus.com/toyota-research-on-traffic-congestion-2012-13/ (accessed on 14 April 2018).
  9. ITDP. Addressing Congestion on the Streets of Karachi. Institute for Transportation & Development Policy. 2017. Available online: https://www.itdp.org/addressing-congestion-streets-karachi/ (accessed on 18 April 2022).
  10. Hasan, M.M.A. The Case Study of Karachi, Pakistan; University College: London, UK, 2020. [Google Scholar]
  11. Memon, I.A.; Kalwar, S.; Sahito, N.; Napiah, M.B. Factors that influence travelera willingness to use or not park and ride service in Putrajaya and Karachi CBD. PalArch’s J. Archaeol. Egypt Egyptol. 2021, 18, 720–734. [Google Scholar]
  12. Qureshi, S.; Memon, I.A.; Talpur, M.A.H. Association between Objectively Measured Neighbourhood Built Environment and Walkability. Mehran Univ. Res. J. Eng. Technol. 2022, 41, 157–168. [Google Scholar] [CrossRef]
  13. Qureshi, I.A.; Lu, H. Urban transport and sustainable transport strategies: A case study of Karachi, Pakistan. Tsinghua Sci. Technol. 2007, 12, 309–317. [Google Scholar] [CrossRef]
  14. Mama, F.G.; Yang, Z.Z.; Xia, D.D. Strategies for sustainable urban transport: A case study of Cotonou, Benin. Int. J. Eng. Res. Afr. 2015, 13, 9–20. [Google Scholar] [CrossRef]
  15. Khan, A.F.; Ghodmare, S.D. Sustainability Impact Analysis of Intelligent Transportation System. Int. J. Sci. Technol. Eng. 2017, 3, 10. [Google Scholar]
  16. Hamid, N.A.; Mohamad, J.; Karim, M.R. Travel behavior of the park-and-ride users and the factors influencing the demand for the use of the park-and-ride facility. Chem. Int. 2008, 37, 10–14. [Google Scholar]
  17. Memon, I.A. Factors Influencing Travel Behaviour and Mode Choice among Universiti Teknologi Malaysia Employees; Universiti Teknologi Malaysia: Johor, Malaysia, 2010. [Google Scholar]
  18. Memon, I.A.; Napiah, M.; Hussain, M.A.; Hakro, M.R. Influence of factors to shift private transport users to Park-and-Ride service in Putrajaya. In Proceedings of the 3rd International Conference on Civil, Offshore and Environmental Engineering ICCOEE 2016, Kuala Lumpure, Malaysia, 15–17 August 2016; p. 385. [Google Scholar]
  19. Memon, I.A.; Napiah, M.; Talpur, M.A.H.; Hakro, M.R. Mode choice modelling method to shift car travelers towards Park and Ride service. ARPN J. Eng. Appl. Sci. 2016, 11, 3677–3683. [Google Scholar]
  20. Memon, I.A.; Kalwar, S.; Sahito, N.; Talpur, M.A.; Chandio, I.A.; Napiah, M.; Tayyeb, H. Mode choice modeling to shift car travelers towards park and ride service in the city centre of Karachi. Sustainability 2021, 13, 5638. [Google Scholar] [CrossRef]
  21. Memon, I.A.; Madzlan, N.; Talpur, M.A.H.; Hakro, M.R.; Chandio, I.A. A Review on the Factors Influencing the Park-and-Ride Traffic Management Method. Appl. Mech. Mater. 2014, 567, 663–668. [Google Scholar] [CrossRef]
  22. Qin, H.; Guan, H.; Wu, Y.-J. Analysis of park-and-ride decision behavior based on Decision Field Theory. Transp. Res. Part F Traffic Psychol. Behav. 2013, 18, 199–212. [Google Scholar] [CrossRef]
  23. Kotkin, J.; Cox, W. The World’s Fastets-Growing Megacitie. Forbes. Available online: http://www.forbes.com/sites/joelkotkin/2013/04/08/the-worlds-fastest-growing-megacities/ (accessed on 26 September 2013).
  24. Kazmi, J.H.; Zubair, S. Estimation of Vehicle Damage Cost Involved in Road Traffic Accidents in Karachi, Pakistan: A Geospatial Perspective. Procedia Eng. 2014, 77, 70–78. [Google Scholar] [CrossRef]
  25. Ahmed, Q.I.; Lu, H.; Ye, S. Urban transportation and equity: A case study of Beijing and Karachi. Transp. Res. Part A Policy Pract. 2008, 42, 125–139. [Google Scholar] [CrossRef]
  26. Mangi, M.Y.; Yue, Z.; Kalwar, S.; Lashari, Z.A. Comparative analysis of urban development trends of Beijing and Karachi metropolitan areas. Sustainability 2020, 12, 451. [Google Scholar] [CrossRef]
  27. Gakenheimer, R. Urban mobility in the developing world. Transp. Res. Part A Policy Pract. 1999, 33, 671–689. [Google Scholar] [CrossRef]
  28. Vasconcellos, E.A. Urban Transport Environment and Equity: The Case for Developing Countries; Routledge: Abington, UK, 2014. [Google Scholar]
  29. McGreevy, M. Cost, reliability, convenience, equity or image? The cases for and against the introduction of light rail and bus rapid transit in inners suburban Adelaide, South Australia. Case Stud. Transp. Policy 2021, 9, 271–279. [Google Scholar] [CrossRef]
  30. Malik, B.Z.; Rehman, Z.u.; Khan, A.H.; Akram, W. Investigating users’ travel behaviours and perceptions of single-corridor BRT: Lessons from Lahore. J. Transp. Geogr. 2021, 91, 102942. [Google Scholar] [CrossRef]
  31. Prayogi, L.; Satwikasari, A.F. Bus Rapid Transit-oriented Development: An Identification of Bus Rapid Transit System Passengers’ Modal Shift Potential Considerations. CSID J. Infrastruct. Dev. 2019, 2, 127–136. [Google Scholar] [CrossRef]
  32. Ahmed, A.; Zaidi, S.O.R.; Ali, M.S.; Gul, P. Modelling Behavior of Shuttle Service Users and Preference towards a Proposed Bus Rapid Transit Line; Associazone Italiana per Ingegneria del Traffic e dei Trasporti: Rome, Italy, 2020. [Google Scholar]
  33. Shah, S.A.R.; Shahzad, M.; Ahmad, N.; Zamad, A.; Hussan, S.; Aslam, M.A.; Khan, A.R.; Asif, M.A.; Shahzadi, G.; Waseem, M. Performance evaluation of bus rapid transit system: A comparative analysis of alternative approaches for energy efficient eco-friendly public transport system. Energies 2020, 13, 1377. [Google Scholar] [CrossRef]
  34. Ataeian, S.; Solimanpur, M.; Amiripour, S.; Shankar, R. Synchronized timetables for bus rapid transit networks in small and large cities. Sci. Iran. 2021, 28, 477–491. [Google Scholar] [CrossRef]
  35. Yin, W.; Zhang, Y. Identification Method for Optimal Urban Bus Corridor Location. Sustainability 2020, 12, 7167. [Google Scholar] [CrossRef]
  36. Nadeem, M.; Azam, M.; Asim, M.; Al-Rashid, M.A.; Puan, O.C.; Campisi, T. Does Bus Rapid Transit System (BRTS) Meet the Citizens’ Mobility Needs? Evaluating Performance for the Case of Multan, Pakistan. Sustainability 2021, 13, 7314. [Google Scholar] [CrossRef]
  37. Joseph, L.; Neven, A.; Martens, K.; Kweka, O.; Wets, G.; Janssens, D. Activity Participation and Perceptions on Informal Public Transport and Bus Rapid Transit in Dar es Salaam. Transp. Res. Rec. 2020, 2674, 573–583. [Google Scholar] [CrossRef]
  38. Ali, N.; Javid, M.A.; Rahim, A. Predicting Transit Mode Choice Behavior from Parents’ Perspectives: A Case Study in Lahore, Pakistan. Jordan J. Civ. Eng. 2020, 14, 476–489. [Google Scholar]
  39. Insani, T.D.; Handayani, W.; Astuti, M.F. A Performance Study of Bus Rapid Transit Lite: Toward A Resilient Semarang City. Transp. Probl. 2021, 16, 105–119. [Google Scholar] [CrossRef]
  40. Li, Q.; Huerta, A.K.R.; Mao, A.C.; Qiao, F. Using Random Undersampling Boosting Classifier to Estimate Mode Shift Response to Bus Local Network Expansion and Bus Rapid Transit Services. Int. J. Civ. Eng. 2021, 19, 1127–1141. [Google Scholar] [CrossRef]
  41. Díez, A.E.; Restrepo, M. A Planning Method for Partially Grid-Connected Bus Rapid Transit Systems Operating with In-Motion Charging Batteries. Energies 2021, 14, 2550. [Google Scholar] [CrossRef]
  42. Desta, R.; Dubale, T.; Tóth, J. Transit performance evaluation at signalized intersections of bus rapid transit corridors. In VEHITS; SCITEPRESS—Science and Technology Publications: Setúbal, Portugal, 2021; pp. 618–625. [Google Scholar]
  43. Noor, R.M.; Rasyidi, N.B.G.; Nandy, T.; Kolandaisamy, R. Campus shuttle bus route optimization using machine learning predictive analysis: A case study. Sustainability 2021, 13, 225. [Google Scholar] [CrossRef]
  44. Kamijo, T.; Huang, G. Improving the quality of environmental impacts assessment reports: Effectiveness of alternatives analysis and public involvement in JICA supported projects. Impact Assess. Proj. Apprais. 2016, 34, 1461–5517. [Google Scholar] [CrossRef]
  45. Japan Internationa Cooperation Agency (JICA). The Study for Karachi Transportation Improvement Project in the Islamic Republic of Pakistan; IUCN: Gland, Switzerland, 2012. [Google Scholar]
  46. Cell, K.M.T. Public Transport System in Karachi; C40 Cities Climate Leadership Group, Inc.: London, UK, 2019. [Google Scholar]
  47. P. B. O. Statistics. Census Report; P. B. O. Statistics: Islamabad, Pakistan, 2017. [Google Scholar]
  48. Magelund, L. Valg af Transportmiddel i Storbyen: Bil og Kollektiv Transport i Bolig-Arbejdsrejsen; Transportrådet: Stockholm, Sweden, 1997. [Google Scholar]
  49. Olsson, A.-L.L. Factors That Influence Choice of Travel Mode in Major Urban Areas. 2003. Available online: https://www.diva-portal.org/smash/get/diva2:7556/FULLTEXT01.pdf (accessed on 25 January 2018).
  50. Niska, C.v.A. Väglagets Betydelse för val av Färdmedel (VTI meddelande, 0347-6049; 861). Linköping: Väg- och TransportForskningsinstitutet; VTI: Stockholm, Sweden, 1999. [Google Scholar]
  51. Rystam, Å. Färdmedelsvalet och Valprocessen för Lokala Resor till Regional Tågtrafik: En Analys med Betoning på Cykelns Betydelse; Lund University: Lund, Sweden, 1998. [Google Scholar]
  52. De Vaus, D. Analyzing Social Science Data: 50 Key Problems in Data Analysis; Sage: Newbury Park, CA, USA, 2002. [Google Scholar]
  53. De Vaus, D.; de Vaus, D. Surveys in Social Research; Routledge: Abington, UK, 2013. [Google Scholar]
  54. Saunders, M.; Lewis, P.; Thornhill, A. Research Methods for Business Students, 7th ed.; Prentice Hall: Hoboken, NJ, USA, 2015. [Google Scholar]
  55. Krejcie, R.V.; Morgan, D.W. Determining sample size for research activities. Educ. Psychol. Meas. 1970, 30, 607–610. [Google Scholar] [CrossRef]
  56. Sekaran, U.; Bougie, R. Research Methods for Business: A Skill Building Approach; John Wiley & Sons: Hoboken, NJ, USA, 2016. [Google Scholar]
  57. De Dios Ortuzar, J.; Willumsen, G.L. Modelling Transport; John Wiley & Sons: Hoboken, NJ, USA, 1994. [Google Scholar]
  58. De Dios Ortuzar, J.; Willumsen, G.L. Modelling Transport, 4th ed.; Wiley: Hoboken, NJ, USA, 2011. [Google Scholar]
  59. Pathan, A.F.H. Modelling Travellers’ Choice of Information Sources and of Mode. Ph.D. Thesis, University of Leeds, Leeds, UK, 2010. [Google Scholar]
  60. Lund Research Ltd. Purposive Sampling Lærd Dissertation. 2017. Available online: http://dissertation.laerd.com/purposive-sampling.php (accessed on 15 February 2020).
  61. Laerd Statistics. Chi-square Test for Association Using SPSS Statistics. Available online: https://statistics.laerd.com/premium/spss/cstfa/chi-square-test-for-association-in-spss-10.php (accessed on 13 July 2017).
  62. POL242 Lab Manual: Exercise 3A. Available online: http://groups.chass.utoronto.ca/pol242/Labs/LM-3A/LM-3A_content.htm (accessed on 3 October 2018).
  63. Jariyasunant, J. Improving Traveler Information and Collecting Behavior Data with Smartphones 3527137. Ph.D. Thesis, University of California, Berkeley, CA, USA, 2012. Available online: http://search.proquest.com/docview/1081704510?accountid=47520 (accessed on 8 August 2019).
Figure 1. Share of passenger vehicle fleet in Karachi, 2011.
Sustainability 14 10184 g001
Figure 2. Current situation of public transport in Karachi [46].
Sustainability 14 10184 g002
Figure 3. Karachi population growth rate by 2030 [47].
Sustainability 14 10184 g003
Figure 4. BRT system in Curitiba and Bogota [45].
Sustainability 14 10184 g004
Figure 5. BRT dedicated lanes, platforms, and stations [45].
Sustainability 14 10184 g005
Figure 6. BRT operated successfully in different countries [45].
Sustainability 14 10184 g006
Figure 7. Green Line route and stations [45].
Sustainability 14 10184 g007
Figure 8. Master plan network (JICA Study Team) [45].
Sustainability 14 10184 g008
Figure 9. Different types of factors [49].
Sustainability 14 10184 g009
Figure 10. Research methodological flow.
Sustainability 14 10184 g010
Figure 11. Types of questionnaires [54].
Sustainability 14 10184 g011
Figure 12. Sociodemographic factors and willingness to use BRT service in Karachi.
Sustainability 14 10184 g012
Figure 13. Willingness to use BRT service versus environment-specific factors of Karachi.
Sustainability 14 10184 g013
Figure 14. Willingness to use BRT service versus trip-specific factors of Karachi.
Sustainability 14 10184 g014
Figure 15. Willingness to use BRT service versus transport factors of Karachi.
Sustainability 14 10184 g015
Figure 16. Willingness to use BRT versus quality-specific factors of Karachi.
Sustainability 14 10184 g016
Figure 17. Willingness to use BRT versus attitude-specific factors of Karachi.
Sustainability 14 10184 g017
Figure 18. Willingness to use BRT service versus uncertainty-specific variables.
Sustainability 14 10184 g018
Table 1. Karachi metropolitan population and area growth rates [23].
YearPopulation (Million)Area (km2)
19470.4233
19815.31994
19989.83527
200414.03566
202016.5More than 3728
Table 2. The trend of mode split in Karachi [13].
Mode Share (%)
YearPublic TransportPrivate TransportWalking/Cycling
1987573112
20045248--
Table 3. Questionnaire content classification according to the variables.
Attribute VariablesBehavioral Variables (RP)Opinion Variables (SP)
AgeProtect environmentAdopt BRT service
GenderEffect of travel timeFrequency of bus
IncomeTransport sharingComfort preference
EducationDrop off kids/family member
Household sizeGoing for shopping
Transport ownershipTravel directly
Travel expenses
Trip distance
Trips per day
Mode of traveling
Parking problem
Traffic congestion
Fare rate cheaper than car
Avoid mental stress
Personal status
Privacy
Travel time per trip
Car is convenient
The threat of violence/terrorism
The threat of robbery/snatching
Table 4. Test values of Phi and Cramer’s V [62].
Verbal DescriptionLevel of Association
No Relationship0.00
Very Weak0.01–0.15
Weak0.15–0.20
Moderate0.20–0.25
Moderately Strong0.25–0.30
Strong0.30–0.35
Very Strong0.35–0.40
Worrisomely Strong0.40–0.50
Redundant0.50–0.99
Perfect Relationship1.00
Table 5. Chi-square test of association of sociodemographic factors of Karachi.
FactorsPhi (φ)Cramer’s Vp-Valueχ2
Gender0.2030.203p < 0.0005χ2 (1) = 41.179
Age0.1710.171p < 0.0005χ2 (4) = 29.381
Income0.2420.242p < 0.0005χ2 (4) = 58.546
Level of education0.2300.230p < 0.0005χ2 (3) = 53.102
Household size0.2660.266p = 0.002χ2 (3) = 70.580
Type of transport ownership0.1060.106p = 0.011χ2 (3) = 11.167
Table 6. Chi-square test of independence output.
FactorsPhi (φ)Cramer’s Vp-Valueχ2
Protect environment1.01.0p < 0.0005χ2 (2) = 1000
Harsh weather1.01.0p < 0.0005χ2 (2) = 1000
Table 7. Chi-square test of association results for trip-specific factors.
FactorsPhi (φ)Cramer’s Vp-Valueχ2
Effect of travel time1.001.0p < 0.0005χ2 (2) = 1000
Transport sharing0.1140.114p < 0.0005χ2 (1) = 12.963
Drop off kids/family member1.01.0p < 0.0005χ2 (2) = 1000
Going for shopping1.01.0p < 0.0005χ2 (2) = 1000
Travel expenses0.1280.128p < 0.006χ2 (5) = 16.313
Distance b home and office0.2180.218p < 0.0005χ2 (4) = 47.431
Travel time per trip0.1380.138p < 0.0005χ2 (3) = 19.180
Trips per day (home to office and office to home)0.1420.142p < 0.0005χ2 (2) = 20.157
Table 8. Chi-square test of association for transport-specific factors of Karachi.
FactorsPhi (φ)Cramer’s Vp-Valueχ2
Mode of Traveling0.3050.305p < 0.0005χ2 (6) = 93.313
Parking Problems1.01.0p < 0.0005χ2 (2) = 4.158
Traffic Congestion1.01.0p < 0.0005χ2 (2) = 1000
Fare Rate Cheaper1.01.0p < 0.0005χ2 (2) = 1000
Table 9. Chi-square test of association for quality-specific factors of Karachi.
FactorsPhi (φ)Cramer’s Vp-Valueχ2
Avoid Mental Stress1.01.0p < 0.0005χ2 (2) = 1000
Table 10. Chi-square test of association for attitude-specific factors of Karachi.
FactorsPhi (φ)Cramer’s Vp-Valueχ2
Personal Status1.01.0p < 0.0005χ2 (2) = 1000
Privacy1.01.0p < 0.0005χ2 (2) = 1000
Car Is Convenient1.01.0p < 0.0005χ2 (2) = 1000
Table 11. Chi-square test of association for uncertainty-specific variables of Karachi.
FactorsPhi (φ)Cramer’s Vp-Valueχ2
The threat of robbery and snatching0.2030.203p < 0.0005χ2 (2) = 41.228
The threat of terrorism/violence0.3330.333p < 0.0005χ2 (2) = 110.62
Table 12. Individual influencing factors categorized as per the Chi-square test of association.
S.No.VariablesFactor Chi-Square Test of Association
01Sociodemographic factorsHighMedium
Gender
Income
Level of education
Household size
02Environment-specific factorsProtect environment
Harsh weather
03Trip-specific factorsTravel time
Drop off kids/family
Going for shopping
Distance b/w home and office
04Transport-specific factorsMode of traveling
Parking problem
Traffic congestion
Fare rate cheaper than a car
05Quality-specific factors Avoid mental stress
Car is convenient
06Attitude-specific factorsPrivacy
Personal status
07Uncertainty-specific factorsThreat of robbery
Threat of terrorism
Table 13. Variance inflation factors for BLR model.
BLR ModelCollinearity Statistics
VariablesToleranceVIF
Gender0.9871.013
Education0.8751.190
Income per month0.8451.184
Household size0.9651.036
Protect environment0.9991.001
Harsh weather conditions0.9991.001
Travel time per trip0.9311.074
Drop off kids at school0.9391.065
Going shopping/banking0.9261.080
Distance b/w office and home0.9611.041
Mode of traveling0.9821.019
Parking problem0.8201.220
Traffic congestion0.8051.242
Fare rate cheaper0.9321.073
Avoid mental stress0.9941.006
Privacy0.2504.002
Personal status0.3532.829
The threat of terrorism/violence0.7661.305
The threat of robbery and snatching0.7671.303
Table 14. Logistic regression significant variables of BLR model.
Variablesβp-Value
Gender Male1.4560.000
Education (Secondary)2.4780.001
Education (Post. Sec:)1.6010.011
Household (2–4)2.2630.000
Income (PKR > 30,000)1.7280.000
Income (PKR 30,001–60,000)1.1690.003
Income (PKR 60,001–120,000)2.1980.000
Ownership Bike + Car0.6650.025
Protect Environment (Yes)7.2090.000
Harsh Weather (Yes)−6.770.000
Vehicle Sharing (Yes)3.2270.006
Drop off Kids (Neutral)7.4970.000
Shopping (Neutral)7.7620.000
Parking Problem (Yes)7.6860.000
Fare Rate Cheaper (Yes)4.9940.003
Traffic Congestion (Yes)7.9880.000
Avoid Mental Stress (Yes)8.260.000
Privacy (Yes)−6.5320.000
Car Convenient (Yes)−3.6150.000
Personal Status (Yes)−6.2690.000
The Threat of Robbery and Snatching (Yes)6.7710.00
The Threat of Terrorism/Violence (Yes)6.7710.00
Nagelkerke R20.98
Chi-Square0.00
Log-likelihood28.2
df8
Hosmer and Lemeshow1.00
Publisher’s Note: MDPI stays neutral with regard to jurisdictional claims in published maps and institutional affiliations.

