Article

Assessment of Struvite as an Alternative Sources of Fertilizer-Phosphorus for Flood-Irrigated Rice

1
Department of Crop, Soil, and Environmental Sciences, University of Arkansas, Fayetteville, AR 72701, USA
2
Department of Agricultural Economics & Agribusiness, University of Arkansas, Fayetteville, AR 72701, USA
3
Department of Chemical Engineering, University of Arkansas, Fayetteville, AR 72701, USA
4
Department of Chemical Engineering, Pennsylvania State University, State College, PA 16802, USA
*
Author to whom correspondence should be addressed.
Sustainability 2022, 14(15), 9621; https://doi.org/10.3390/su14159621
Submission received: 23 June 2022 / Revised: 24 July 2022 / Accepted: 31 July 2022 / Published: 4 August 2022

Abstract

:
Phosphorus (P) recovery from wastewaters as struvite (MgNH4PO4·6H2O) may be a viable alternative fertilizer-P source for agriculture. The objective of this study was to evaluate the economic and environmental implications of struvite as a fertilizer-P source for flood-irrigated rice (Oryza sativa) relative to other commonly used commercially available fertilizer-P sources. A field study was conducted in 2019 and 2020 to evaluate the effects of wastewater-recovered struvite (chemically precipitated struvite (CPST) and electrochemically precipitated struvite (ECST)) on rice yield response in a P-deficient, silt–loam soil in eastern Arkansas relative to triple superphosphate, monoammonium and diammonium phosphate, and rock phosphate. A life cycle assessment methodology was used to estimate the global warming potentials associated with rice produced with the various fertilizer-P sources. Life cycle inventory data were based on the field trials conducted with and without struvite application for both years. A partial budget analysis showed that, across both years, net revenues for ECST and CPST were 1.4 to 26.8% lower than those associated with the other fertilizer-P sources. The estimated greenhouse gas emissions varied between 0.58 and 0.70 kg CO2 eq kg rice−1 from CPST and between 0.56 and 0.81 kg CO2 eq kg rice−1 from ECST in 2019 and 2020, respectively, which were numerically similar to those for the other fertilizer-P sources in 2019 and 2020. The similar rice responses compared to commercially available fertilizer-P sources suggest that wastewater-recovered struvite materials might be an alternative fertilizer-P-source option for flood-irrigated rice production if struvite can become price-competitive to other fertilizer-P sources.

1. Introduction

Maximum agricultural production is almost always the goal of any producer and is typically achieved with large inputs of inorganic fertilizers, such a nitrogen (N) and phosphorus (P). Many N fertilizers require large energy inputs to create through the Haber–Bosch process [1], whereas most P fertilizers are produced from a finite supply of rock phosphate (RP), such as apatite and phosphorite, that must be first mined from the ground and processed [2]. A more readily available source of potential fertilizer nutrients than the atmosphere or the ground, as in the present case with N and P, respectively, could be beneficial for agricultural production and other sectors of human society and the environment.
Wastewater is generated constantly by municipalities and many industries. Tiseo [3] estimated that 67 billion m3 year−1 of wastewater are generated by Europe and North America combined. Many wastewaters, such as municipal, agricultural, and industrial, among others, contain large concentrations of potentially useful nutrients, such as N and P [4,5,6]. Unless removed from the wastewater stream, excess nutrients may pose a burden to processing facilities, such as wastewater treatment plants (WWTPs), and/or the environment, if nutrient loads to receiving waters are large. UNESCO [7] estimated that only 20% of the globally produced wastewaters are treated before being discharged back into receiving waters. Consequences of excess nutrients in wastewaters can include pipe clogging in the infrastructure, the creation of process inefficiencies, and greater costs associated with WWTPs [8,9] and cultural eutrophication, followed by the cascade of potential negative effects that may lead to serious environmental degradation [10,11,12].
Struvite (MgNH4PO4·6H2O), a white, crystalline mineral, is one of several minerals that may precipitate in WWTP pipes under certain aqueous chemical conditions that can restrict or completely stop pipe flow. Though unintentional struvite formation is undesirable, intentional struvite formation may be beneficial as a means to recycle excess nutrients from waste streams, such as those that enter WWTPs. Intentional struvite formation has been accomplished through chemical precipitation, where Mg is dosed at a strategic location in a WWTP to purposefully cause struvite to form and remove or recycle P and N from the wastewater, reducing the potential to precipitate and clog pipes. Once collected, the precipitate can be further processed into pellets, packaged, and sold as a blended fertilizer-P and -N material, which was accomplished recently by Ostara Nutrient Recovery Technologies, Inc. (Vancouver, BC, Canada) in association with a municipal WWTP near Atlanta, GA.
More recently, electrochemical precipitation techniques have been developed and tested to create struvite from synthetic wastewater, where an electrical current is imposed on a Mg electrode with a stainless-steel counter-electrode [13,14,15]. Magnesium is supplied to the P- and N-containing solution as the Mg electrode corrodes. Aside from eliminating the need for external chemical inputs to promote the reaction to form struvite, as with the chemical precipitation method, the electrochemical method generates hydrogen that can be subsequently captured and used as an alternative energy source [16].
Both chemically precipitated (CPST) and electrochemically precipitated struvite (ECST) have been evaluated in a variety of settings for their potential use as an alternative, blended fertilizer-P and -N source compared to other commonly used, commercially available fertilizers, including triple superphosphate (TSP), monoammonium phosphate (MAP), diammonium phosphate (DAP), and RP. Studies have reported similar plant growth from struvite [17,18], whereas others have reported reduced agronomic effectiveness of struvite [19,20] compared to typical commercially available fertilizer-P sources. The behavior of CPST and ECST in various soil textures over time has been evaluated without plants in a series of laboratory incubations under moist [21] and flooded [22,23] soil conditions. Ylagan et al. [24] evaluated corn (Zea mays) and soybean (Glycine max) response to CPST and ECST in a greenhouse study. Omidire et al. [25] conducted a 2 year field study on a P-deficient silt–loam soil in eastern Arkansas to evaluate rice (Oryza sativa) response to CPST and ECST compared to TSP, MAP, DAP, and RP, where urea was used to balance the N among the various fertilizer materials. Results of these studies conducted in Arkansas indicate struvite’s behavior in soil and struvite’s performance with a variety of crops are at least comparable to those of other commonly used, commercially available fertilizer-P/-N materials.
For a newly developed, alternative fertilizer material to find a market niche, the material must be economically viable as well, not just agronomically effective. Although struvite has been recognized as a viable fertilizer product since the late 1950s, initial commercial production was limited due to large manufacturing costs [26]. Issues related to transportation, storage, composition, and purity also hindered commercial-scale development. However, in recent years, technological advancements, coupled with concern for resource and environmental conservation, have led to the implementation of large-scale commercial struvite production across several countries, such as Germany, the Netherlands, Japan, Canada, and the United States [27].
The most widely used struvite product in the United States is Crystal Green®, produced using Ostara Pearl technology [28]. Like most technological innovations, Crystal Green® has not entered the market as the lowest-cost option [28,29], with prices being roughly double those of other fertilizer-P materials in 2019 and 2020. Field trials conducted by Ostara have shown greater yields for crops grown using Crystal Green®, resulting in returns on investment upwards of 4:1, but researchers note that fluctuations in price for crops and alternative fertilizers can impact year-to-year profitability [29,30].
Omidire et al. [31] used preliminary results after one year of field trials in rice, corn, and soybean to evaluate CPST and ECST relative to TSP and other commonly used, commercially available fertilizers. Market prices from CPST currently exceed those of other commonly used fertilizer-P sources [32,33]; therefore, greater yields and/or lower total fertilization costs will likely need to occur to allow the struvite materials to economically compete with current production practices using other commonly used fertilizer-P sources. However, a more formal economic evaluation of struvite material use in row-crop agriculture has not been conducted to date.
In addition to assessment of economic viability, the environmental implications of struvite use are also an important consideration. Life cycle assessment (LCA) provides a widely accepted framework to assess struvite’s potential environmental impacts under various scenarios as a potential replacement for other commonly used, commercially available fertilizers. Life cycle assessment has recently been used to evaluate implications of red rice on food security [34] and agricultural water management [35] associated with rice production in the Lower Mississippi Delta Region, encompassing Arkansas, Louisiana, and Mississippi. Considering struvite has been characterized as having slow-release characteristics under certain soil conditions [17,19,36,37,38], it is possible that the in-season physiological timing of plant demand for P and N will be better matched with P and N release from struvite than the dissolution timing of other fertilizer sources. Consequently, N volatilization and/or denitrification losses may be minimized relative to those from other P and/or N fertilizer sources, such that the use of struvite may result in lower greenhouse gas (GHG) emissions.
The potential societal and environmental benefits of using recycled nutrients from wastewaters as fertilizer materials in large-scale row-crop agricultural production warrant investigation. Furthermore, considering Arkansas, as the largest rice-producing state, has consistently accounted for nearly 50% of the total annual rice production in the United States in recent decades [39], evaluating the economic and environmental impacts of struvite use in rice production in Arkansas is more than justified. Thus, the objective of this study was to evaluate the economic and global warming implications of using struvite as a fertilizer-P source for flood-irrigated rice relative to other commonly used commercially available fertilizer-P sources in Arkansas. Despite similar rice yields among fertilizer-P treatments within a growing season, it was hypothesized that struvite-P treatments will result in lower net returns compared to other fertilizer-P sources given the expected greater market prices for ECST and CPST, on account of CPST’s relative newness and ECST’s non-existence in the market yet, compared to other fertilizer-P sources. It was also hypothesized that TSP, the most commonly used fertilizer-P source in the region, would economically out-perform all other fertilizer-P sources evaluated. Furthermore, it was hypothesized that the struvite-P treatments and application of recovered-P sources in flood-irrigated rice production would provide environmental benefits to the rice production system by reducing the global warming potential (GWP) compared to the application of conventional fertilizers.

2. Materials and Methods

This study used mean rice yields by treatment from a recent 2-year field study that evaluated rice response to several fertilizer-P sources in a P-deficient soil in eastern Arkansas. Details regarding the 2-year field study are fully described in Omidire et al. [25], and condensed procedures for the field study are necessarily described below. However, the analyses conducted and results generated and presented for the current study represent new research as an integration and extension of the field trial that was previously conducted to generate the necessary rice-response data to drive the economic and life cycle analyses conducted for the current study.

2.1. Field Site Description and Cropping History

A field study was conducted in 2019 and 2020 at the Pine Tree Research Station (PTRS) near Colt, AR [25]. Calhoun silt loam (fine–silty, mixed, active, thermic Typic Glossaqualfs) [40] was the soil mapped throughout the study area. The soil averaged 12% sand, 72% silt, and 16% clay and had a mean pH of 7.6, extractable-soil P concentration of 19.5 mg kg−1, and soil organic matter concentration of 2.3% in the top 10 cm [25]. For the prior five years, a rice–soybean rotation was imposed throughout the study area. University of Arkansas System Division of Agriculture recommendations [41] were followed to manage the previous soybean and rice crops. The 30-year (i.e., 1981 to 2010) average annual precipitation and air temperature in the study area are 123.0 cm and 16.1 °C, respectively [42], with a humid–temperate climate classification [25].

2.2. Field Treatments and Experimental Layout

This field study evaluated several fertilizer-P sources, including two struvite sources (ECST and CPST), TSP, MAP, DAP, RP, and an unamended control treatment for two consecutive growing seasons, 2019 and 2020. The unamended control received no fertilizer-P addition, but received fertilizer-N additions, and is hereafter referred to as the control treatment. The seven fertilizer-P-source treatments were arranged in a randomized complete block design with four replications each year within a 0.03 ha area [25]. Each year, field plots (4.9 m long × 1.8 m wide, 28 total plots) were established in an area following soybeans; thus, the exact same plots were not used in each year, but rather the plots shifted location in the same field by approximately 100 m [25]. Additional details regarding the field trials and experimental site and treatment layout are described in Omidire et al. [25].
Kékedy-Nagy et al. [15] described the procedures for producing the ECST material in two separate batches in the laboratory from synthetic wastewater, where one batch was used in 2019 and the second batch was used in 2020. A solution of synthetic wastewater (0.85 L total) was created with 7.53 g L−1 (0.077 M) of ammonium dihydrogen phosphate (NH4H2PO4) and placed in a bench-top-scale, single-compartment reactor that contained a Mg anode and a stainless-steel plate as the cathode. An electrical current was applied to the system to precipitate struvite that was collected at the end of each batch.
Crystal Green® is the trade name (Ostara Nutrient Recovery Technologies, Inc.) of the CPST material used in this study that was created from an active wastewater treatment plant near Atlanta, GA. Magnesium salts were added to the wastewater, which already contained P and N, to stimulate chemical precipitation of struvite, which was followed by a pelletization process [28]. The morphology and elemental compositions of the CPST and ECST materials, as determined by X-ray diffraction [15] and laboratory analyses [23], respectively, were similar to one another and fit the range of properties consistent with the mineral struvite. Having been produced from raw municipal wastewater, the CPST’s chemical composition was more diverse than that for ECST, which was created from a synthetic, P- and N-containing solution [23].

2.3. Fertilizer-P Source Characterization

Replicate sub-samples of each fertilizer material used were chemically characterized. Since TSP, MAP, DAP, and CPST were in pellet form; ECST was in crystal form; and RP was in powder form, the pelletized and crystalline materials were mechanically crushed before chemical characterization for total N, P, and Mg. Total P, K, and Mg concentrations were determined by inductively coupled, argon-plasma spectrometry after strong-acid digestion [43]. High-temperature combustion [44] was used to determine total N and total C concentrations, except for the ECST 2020 material, for which C analyses were not performed. Measured chemical properties and the laboratory-measured fertilizer grade of the fertilizer-P materials are summarized in Table 1.

2.4. Plot Management

Field plots were established in April 2019 and 2020. The initial Mehlich-3 soil-test-P concentration and soil pH in the top 10 cm [25] was used to determine the recommended P-fertilization rate for flood-irrigated rice on a silt–loam soil (29.4 kg P ha−1) [41], which was used along with the measured total-recoverable P concentrations of each fertilizer-P material (Table 1) to determine the fertilizer-P quantity that was applied per field plot. Since the N concentrations differed among fertilizer-P materials (Table 1), the total N applied was balanced among all treatments each year, including the control, using uncoated urea (46% N) based on the fertilizer-P material with the largest total N concentration, which was DAP (Table 1).
Fertilizer-P treatments were manually broadcast-applied on 30 April 2019 and 4 May 2020 separately to each plot at 29.4 kg P ha−1. To maintain the rice–soybean rotation, field plots were moved to a nearby but different area within the same field for the 2020 growing season. Muriate of potash was mechanically broadcast-applied each year at 83.7 kg K ha−1. Fertilizer-P materials were surface-applied in their original, solid forms. A rototiller was used to incorporate all applied fertilizers to a depth of approximately 10 cm prior to planting. Field plots were drill-seeded with the pureline rice cultivar “Diamond” at 80 kg seed ha−1 on the same day after fertilizer application and incorporation, resulting in nine rows with 19 cm row spacing in each plot.
A single, preflood application of uncoated urea was mechanically broadcast-applied at 145.7 kg N ha−1 on 4 June 2019 and 12 June 2020. On 5 June 2019 and 13 June 2020, the flood was established to minimize potential ammonia volatilization losses. The flood was maintained throughout the remainder of the rice-growing seasons at approximately a 10 cm depth. On 25 August 2019 and 20 August 2020, the flood was released to prepare for harvest. A plot combine was used to harvest rice grain on 17 September 2019 and 10 September 2020. Weeds were managed each year with various herbicides according to University of Arkansas’ Cooperative Extension Service recommendations [45].
Rice grain harvested per plot was collected and weighed. Yields were reported at 12% moisture content [25]. For the purposes of this study, mean yields by fertilizer-P treatment are reported and were used for the economic evaluations and environmental assessments by LCA. Formal statistical evaluations of fertilizer-P treatment effects on rice response, including yield, were conducted and reported in Omidire et al. [25]. Additional details regarding field management practices are described in Omidire et al. [25].

2.5. Economic Analyses

The economic evaluation consisted of a partial budget analysis that focused on returns to fertilization. Data from the field study related to annual fertilization and the resulting yields were combined with relevant price data to estimate per hectare net revenues for rice production associated with each fertilizer-P and -N treatment combination. While plots were also treated with potash and zinc, these treatments were not included in the economic analysis as these applications were not expected to be needed annually, thus were not considered part of routine fertilization management, and the application rates did not change among different fertilizer-P source treatments. First, individual plot-level yields per treatment were averaged and scaled up to create an average yield per hectare. Total revenue per treatment was calculated by multiplying the average yield per treatment by the relevant market prices for rice in 2019 [33] and 2020 [46]. Second, P and N fertilization rates were scaled up to one hectare of production. Among fertilizer sources, treatments were the same across both years, except for ECST due to the two different batches of ECST that were used in the field. The chemical compositions, specifically the N concentrations, were slightly different in the batches used in each year. Prices were obtained for urea and each fertilizer-P source [32,33,47,48,49], with the exception of ECST. Because ECST is not yet commercially available and the equipment and inputs used in ECST’s production process are similar, the market price for CPST was assumed for ECST as well. Urea and fertilizer-P rates were multiplied by their relevant price and added together to calculate total costs for each fertilizer-P treatment. Third, net revenues per treatment were calculated as total revenue minus total fertilizer-P and -N costs. Finally, net revenues from the various fertilizer-P treatments were compared to net revenues from TSP as the baseline treatment to determine how the other fertilizer-P sources performed economically compared to that from TSP, which is the most common fertilizer-P source used for rice production in Arkansas.

2.6. Environmental Evaluation

An environmental evaluation of rice production using various fertilizer-P and -N sources was conducted using LCA methodology. For the purposes of this study, the environmental evaluation focused solely on estimating and comparing GWP. The standard procedure, as documented in the International Organization for Standardization (IOS) standards [50], was followed. The LCA was conducted according to the following steps: (i) goal and scope definition, (ii) life cycle inventory (LCI) development and analysis, (iii) life cycle impact assessment (LCIA), and (iv) interpretation of LCIA results. The system boundary (Figure 1) encompasses both background and foreground sub-systems. The background system includes all the upstream processes necessary to produce the raw materials (i.e., agri-chemicals, irrigation, and fuel/energy) consumed in the foreground system. The foreground system is the rice production system, including the struvite production system for the struvite scenarios, which is the focus of this study. The background system LCI was taken from the consequential Ecoinvent database v3.6 [51]. The functional unit (FU) considered for this study was 1 kg of rice produced on an oven-dry basis (i.e., 88% of the reported yield, which had 12% moisture content) for each of several investigated scenarios evaluating the application of different fertilizer-P sources.

2.6.1. Rice Production System

The rice production scenarios investigated in this study consisted of both struvite and non-struvite fertilizer-P sources. For the struvite-based scenarios, both CPST and ECST were evaluated. For the non-struvite-based scenarios, TSP, MAP, DAP, and RP were evaluated along with the control treatment.
Similar to the economic analysis, the plot-level, raw material inputs and field-measured rice yields were scaled up to 1 ha of production. The plot-level inputs and resulting yields were used in the development of LCI models of the rice production scenarios depicted in the 2-year field study conducted by Omidire et al. [25] (Table 2 and Table 3). Detailed descriptions of the assumptions made for calculating the raw material inputs and emissions are also described in the footnotes of Table 2. All data on crop nutrient inputs, irrigation, and fuel inputs were based on field procedures used by Omidire et al. [25]. Methane (CH4) emissions were based on previous reports for flood-irrigated rice grown on a silt–loam soil in eastern Arkansas [52,53,54]. For N inputs, the contributions from various sources were (i) synthetic fertilizers and struvite materials, (ii) atmospheric deposition (3.9 to 12.4 kg ha−1 year−1) [55,56], and (iii) N from seeds (0.012 g N g−1 seed) [57]. Direct and indirect nitrous oxide (N2O)-N emissions were also based on results of field trials conducted on silt–loam soils in east–central Arkansas from flood-irrigated rice [58,59]. Potential nitrate (NO3)-N leaching loss was estimated using a partial N-balance approach [60] (Table 2). In the N-balance method, first the field-N balance was calculated as total N inputs minus the crop N removed in the harvested grain. Crop-N removal was based on direct measurements from Omidire et al. [25] (Table 2). From the calculated N balance, N losses were subtracted to finally estimate potential nitrate leaching (NO3-N).

2.6.2. Struvite Production System

The LCI data for the ECST production process were adopted from a bench-scale reactor with 16 L of simulated wastewater containing known concentrations of P and N [15,65]. The 2019 batch of ECST contained 3.3% N, resulting in 1 kg of ECST equaling 0.033 kg N, which substituted for 0.072 kg of urea. The 2019 batch of ECST also contained 18.5% P (i.e., 42.6% P2O5); thus, 1 kg of ECST was equivalent to 0.426 kg P2O5, which substituted 1.018 kg of TSP. A different synthetic wastewater batch was used in 2020, where 1 kg of ECST contained 0.051 kg N, which substituted 0.110 kg urea, and contained 0.370 kg P2O5, which substituted 0.884 kg TSP. For CPST and ECST, to account for the environmental benefits of substituted fertilizers and to avoid double counting their impact, the impact of the total applied N, P, and K, as required with no struvite application, was first considered in the LCIA, from which credits for the substituted N, P, and K were subsequently subtracted based on the fertilizer input data (Table 2). Modeling the system in this way enabled consistent amounts of fertilizers to be used in all treatments. The electricity input for the electrochemical process was assumed to be 0.35 kW-hr kg−1 struvite, which ranged from 0.1 to 0.35 kW-hr kg−1 struvite, and the use of a Mg plate electrode (99.9% purity) was 0.31 kg kg−1 ECST produced, which ranged from 0.18 to 0.31 kg−1 ECST produced. Some of the data that were necessary for calculations associated with the ECST production in the laboratory were unpublished data (Sultana, unpublished data, 2021). The unit process assumed for the Mg component of ECST production was adopted from Ecoinvent v3.6 [51] (i.e., “Magnesium (IL), magnesium production, electrolysis, Conseq, U”), and the electricity consumption in the electrolysis processes was modified to the US electricity production mix.
The same CPST material used in both years contained 5.7% N; thus, 1 kg of CPST was equivalent to 0.057 kg N, which substituted 0.124 kg urea kg−1 struvite produced. Similarly, 1 kg of CPST was equivalent to 0.269 kg P2O5, which substituted 0.643 kg TSP kg−1 struvite produced. For the production of CPST, average raw material inputs were assumed as follows: (i) sodium hydroxide (NaOH) at 0.130 kg per kg CPST, which was estimated from 1 kg NaOH per kg P recovered [25,63,64], and (ii) magnesium oxide (MgO) at 0.30 kg per kg CPST [66], which was estimated from 2.40 kg MgO per kg P recovered [64].

2.6.3. Evaluation Approach

A consequential life cycle assessment (CLCA) approach was used to estimate the total life cycle GHG emissions and to account for the burdens/benefits of the fertilizer substitutions due to the use of the two struvite-fertilizer materials. Equivalent amounts of substituted synthetic fertilizer were calculated based on the relative P and N concentrations in the struvite materials and the corresponding crop nutrient concentrations in the synthetic fertilizers (Table 2 and Table 3). Net N emissions accounted for all gaseous N forms, including N2O, ammonia (NH3), and NOx, and potential N leaching losses, calculated using the partial N-balance method [60,67] following the use of relevant emission factors as reported in IPCC [68]. Ultimately, total crop-available P and N from both struvite materials were calculated to determine the equivalent amounts of substitutable synthetic P and N fertilizers (calculations are shown in the footnotes of Table 2 and Table 3). The benefits of crop nutrients provided by the struvite were considered to be avoiding the environmental impact that would have occurred due to the production of equivalent amounts of synthetic fertilizers. Hence, the net environmental impact of the applied struvite was the burden related to the raw materials consumed for struvite precipitation minus credits gained due to applying the required amount of struvite to produce 1 kg rice (i.e., functional unit). A similar approach of system expansion with nutrient recycling has been used in previous studies related to the production of agricultural crops [67] and for struvite materials specifically [69].
The life cycle GWP was estimated using a computational tool, SimaPro© 9.1.1 (PRé Sustainability B.V, Amersfoort, The Netherlands), using the ReCiPe method (H) [70]. SimaPro is one of the leading LCA computational tools that has been used in the past three decades. The tool is widely used by companies, consultants, and academics to conduct holistic sustainability evaluations of environmental footprints of various product systems/processes. The tool helps to collect, synthesize, and analyze sustainability performance data of a product, service, or process. The tool is widely used for various applications, such as sustainability reporting and product footprinting, including for carbon. For the purposes of this study, GWP-100 for N2O and CH4 used in the default ReCiPe method were modified to 265 and 28, respectively, following the recommendation of the 5th Assessment Report [71].

3. Results and Discussion

3.1. Rice Yield Response

Rice yields differed among fertilizer-P treatments between years (p < 0.05) [25]. In 2019, rice yields did not differ among fertilizer-P treatments, ranging from 14.4 Mg ha−1 in the control to 15.6 Mg ha−1 in both the TSP and RP treatments (Table 4) [25]. However, rice yields in every fertilizer-P treatment were lower in 2020 than in their respective treatment in 2019 due to a combination of differences in growing-season weather conditions and different initial soil properties [25]. For practical purposes, the field studies shifted locations by ~100 m from 2019 to 2020, which resulted in a shift in soil pH from 7.4 in 2019 to 7.8 in 2020 plus increased extractable soil Ca to result in likely greater Ca-P precipitation in the soil, lowering the plant availability of the added fertilizer P [25]. Furthermore, wetter pre-flood soil conditions from greater rainfall in 2019 likely promoted greater fertilizer-P dissolution and plant availability compared to the drier pre-flood period in 2020 [25]. In 2020, rice yields from TSP, MAP, DAP, RP, and control did not differ and were greater than from ECST (Table 4) [25]. Rice yields in 2020 from CPST and ECST were similar to those from MAP, DAP, RP, and the control (Table 4) despite the fertilizer-P materials having differing expected solubilities [25].

3.2. Economic Evaluation

Although different fertilizer-P treatments did not always produce statistically different in-field yields in 2019 and 2020 (Table 4), net revenues can still vary greatly across treatments, as profits are based on actual costs and yields observed rather than statistically significant yield differences. Estimated total fertilizer costs, total revenues, and net revenues by fertilizer-P treatment are summarized in Table 5. Total revenue associated with the TSP treatment exceeded total revenue to all other treatments in both years. Even with some fertilizer-N cost savings provided by both CPST and ECST, total fertilization costs of both struvite treatments ranked first and third highest, respectively, in 2019 and 2020. With the exception of MAP in 2019, estimated economic net returns from TSP outperformed net returns from all other fertilizer-P sources in both years. An analysis of two-year total and average annual net revenues by fertilizer-P source (Table 6) shows that TSP had the largest total net revenues and average revenues across the two-year study period. Across all fertilizer-P treatments, returns from CPST numerically ranked seventh and sixth for 2019 and 2020, respectively, where returns from ECST numerically ranked fifth and seventh for 2019 and 2020, respectively (Table 7). In both years, CPST and ECST produced lower net revenues than those of MAP, DAP, TSP, and RP, which are all commercially available fertilizer-P sources (Table 7).
Although urea-N rates applied to the struvite fertilizer treatments to balance fertilizer-N applications across all fertilizer treatments were similar to rates applied to most other treatment plots, the current market price of struvite fertilizer remains more than double many conventional fertilizer products (e.g., on average, USD 0.86 kg−1 vs. USD 0.42 kg−1, respectively). Therefore, total costs of P and N fertilization for the struvite treatments were about 24 to 65% greater than those for TSP, depending on the specific fertilizer-P source and year. Furthermore, average measured yields from the struvite treatments were generally numerically lower, though not always significantly lower, than from other fertilizer-P treatments. Yields from CPST numerically ranked sixth both years, whereas yields from ECST numerically ranked fourth in 2019 and seventh, even behind the control treatment, in 2020 (Table 4). The combination of the relatively greater P and N fertilization costs and the lower yields led to the relatively poor estimated economic performance of the struvite materials as fertilizer-P sources across both years.
Though CPST has a place in the fertilizer market already as a recycled nutrient source, ECST’s actual costs have yet to be fully determined and vetted, as the electrochemical technology is in its infancy and still being developed as a potentially viable technique to recycle nutrients from wastewaters. Furthermore, one must also consider the additional benefits of both CPST and ECST as fertilizer-P sources generated by removing excess P and N from waste streams that can decrease the P and N loads in WWTPs, which may lead to reduced operational costs, and can potentially decrease the P and N loads returned to the natural environment in receiving waters.

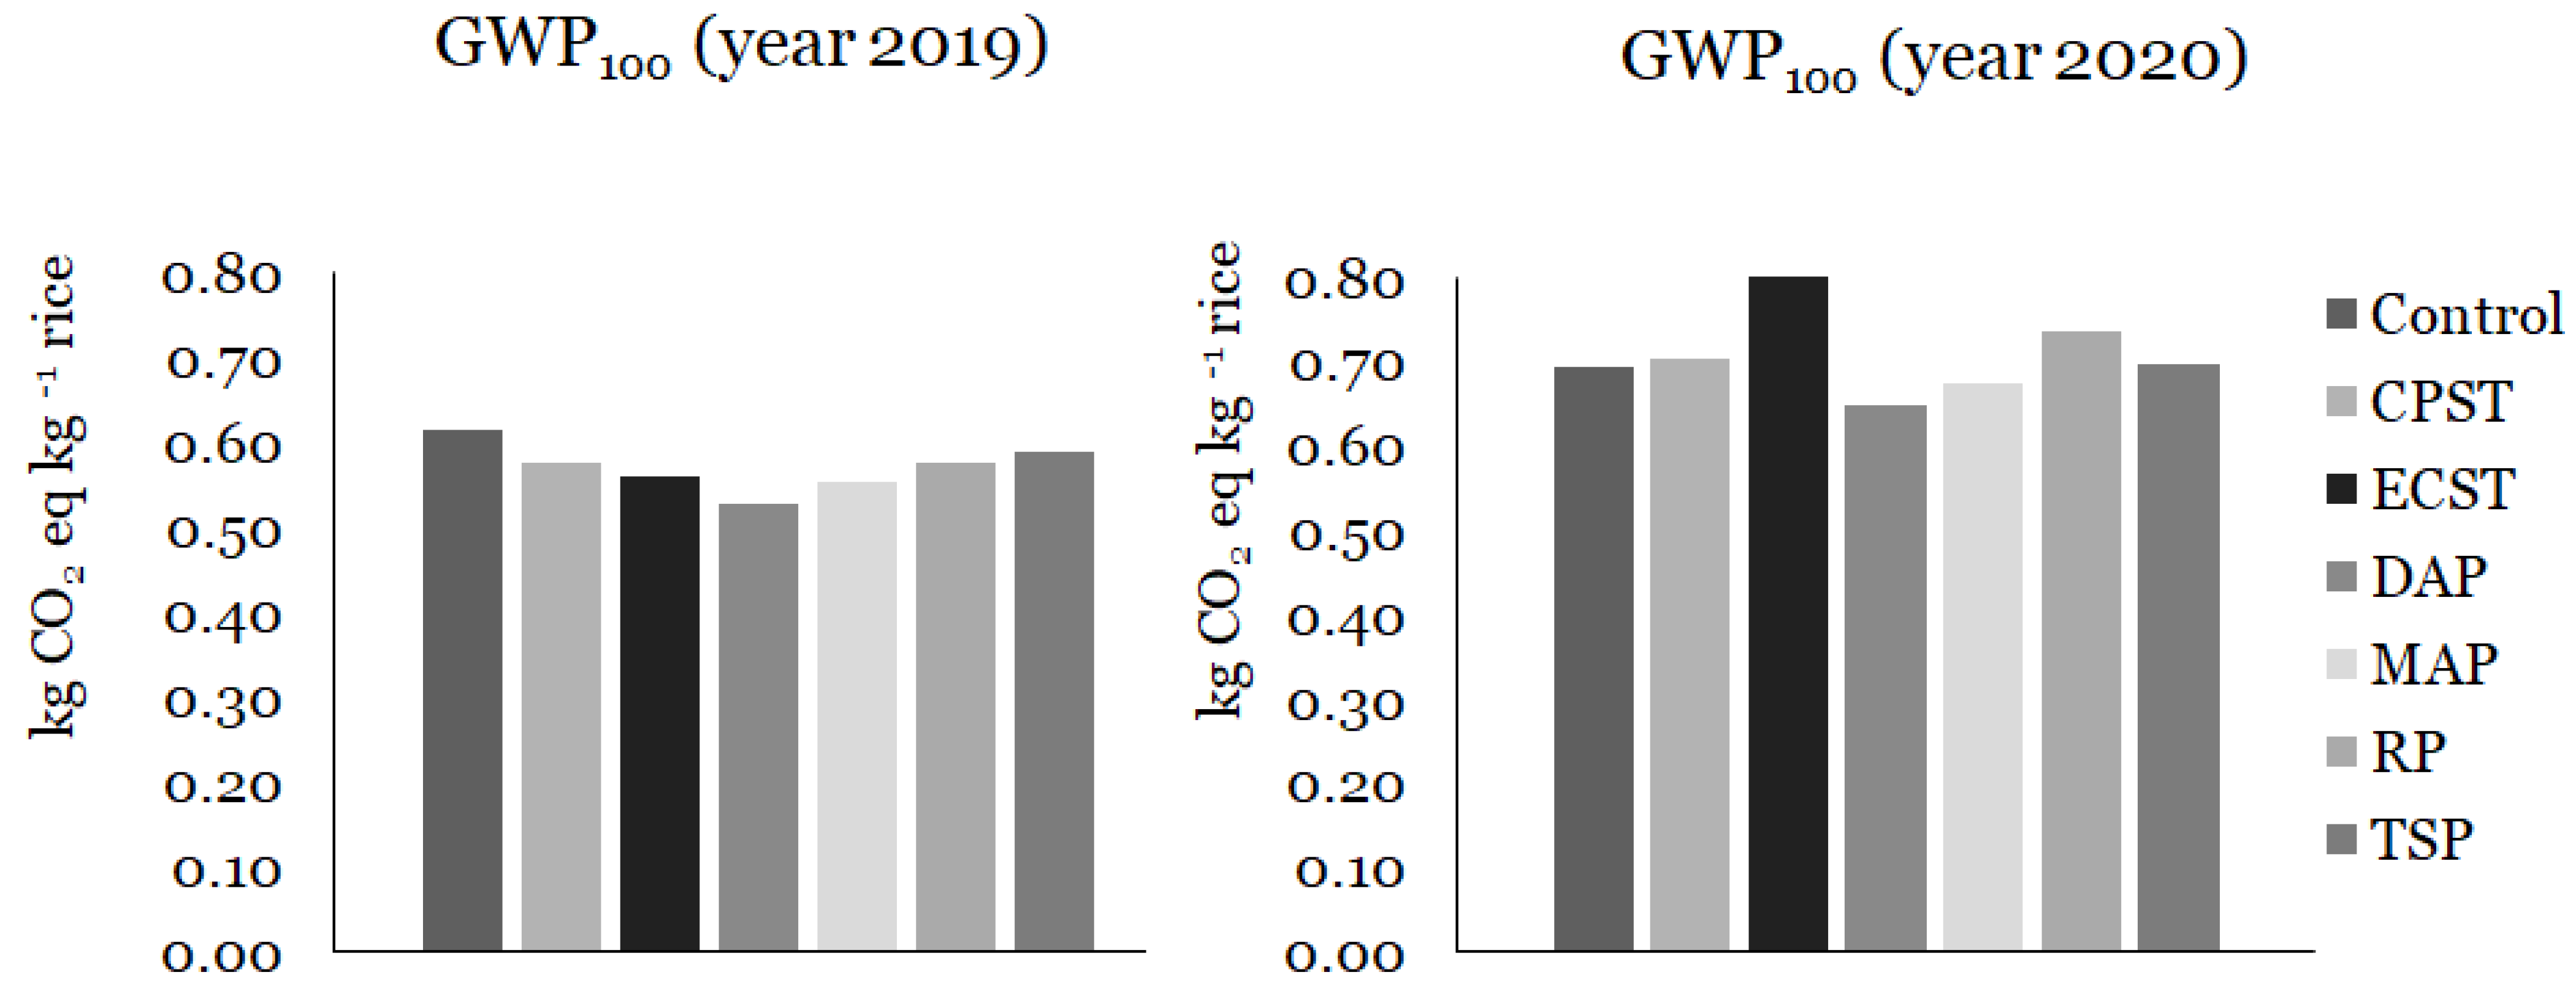
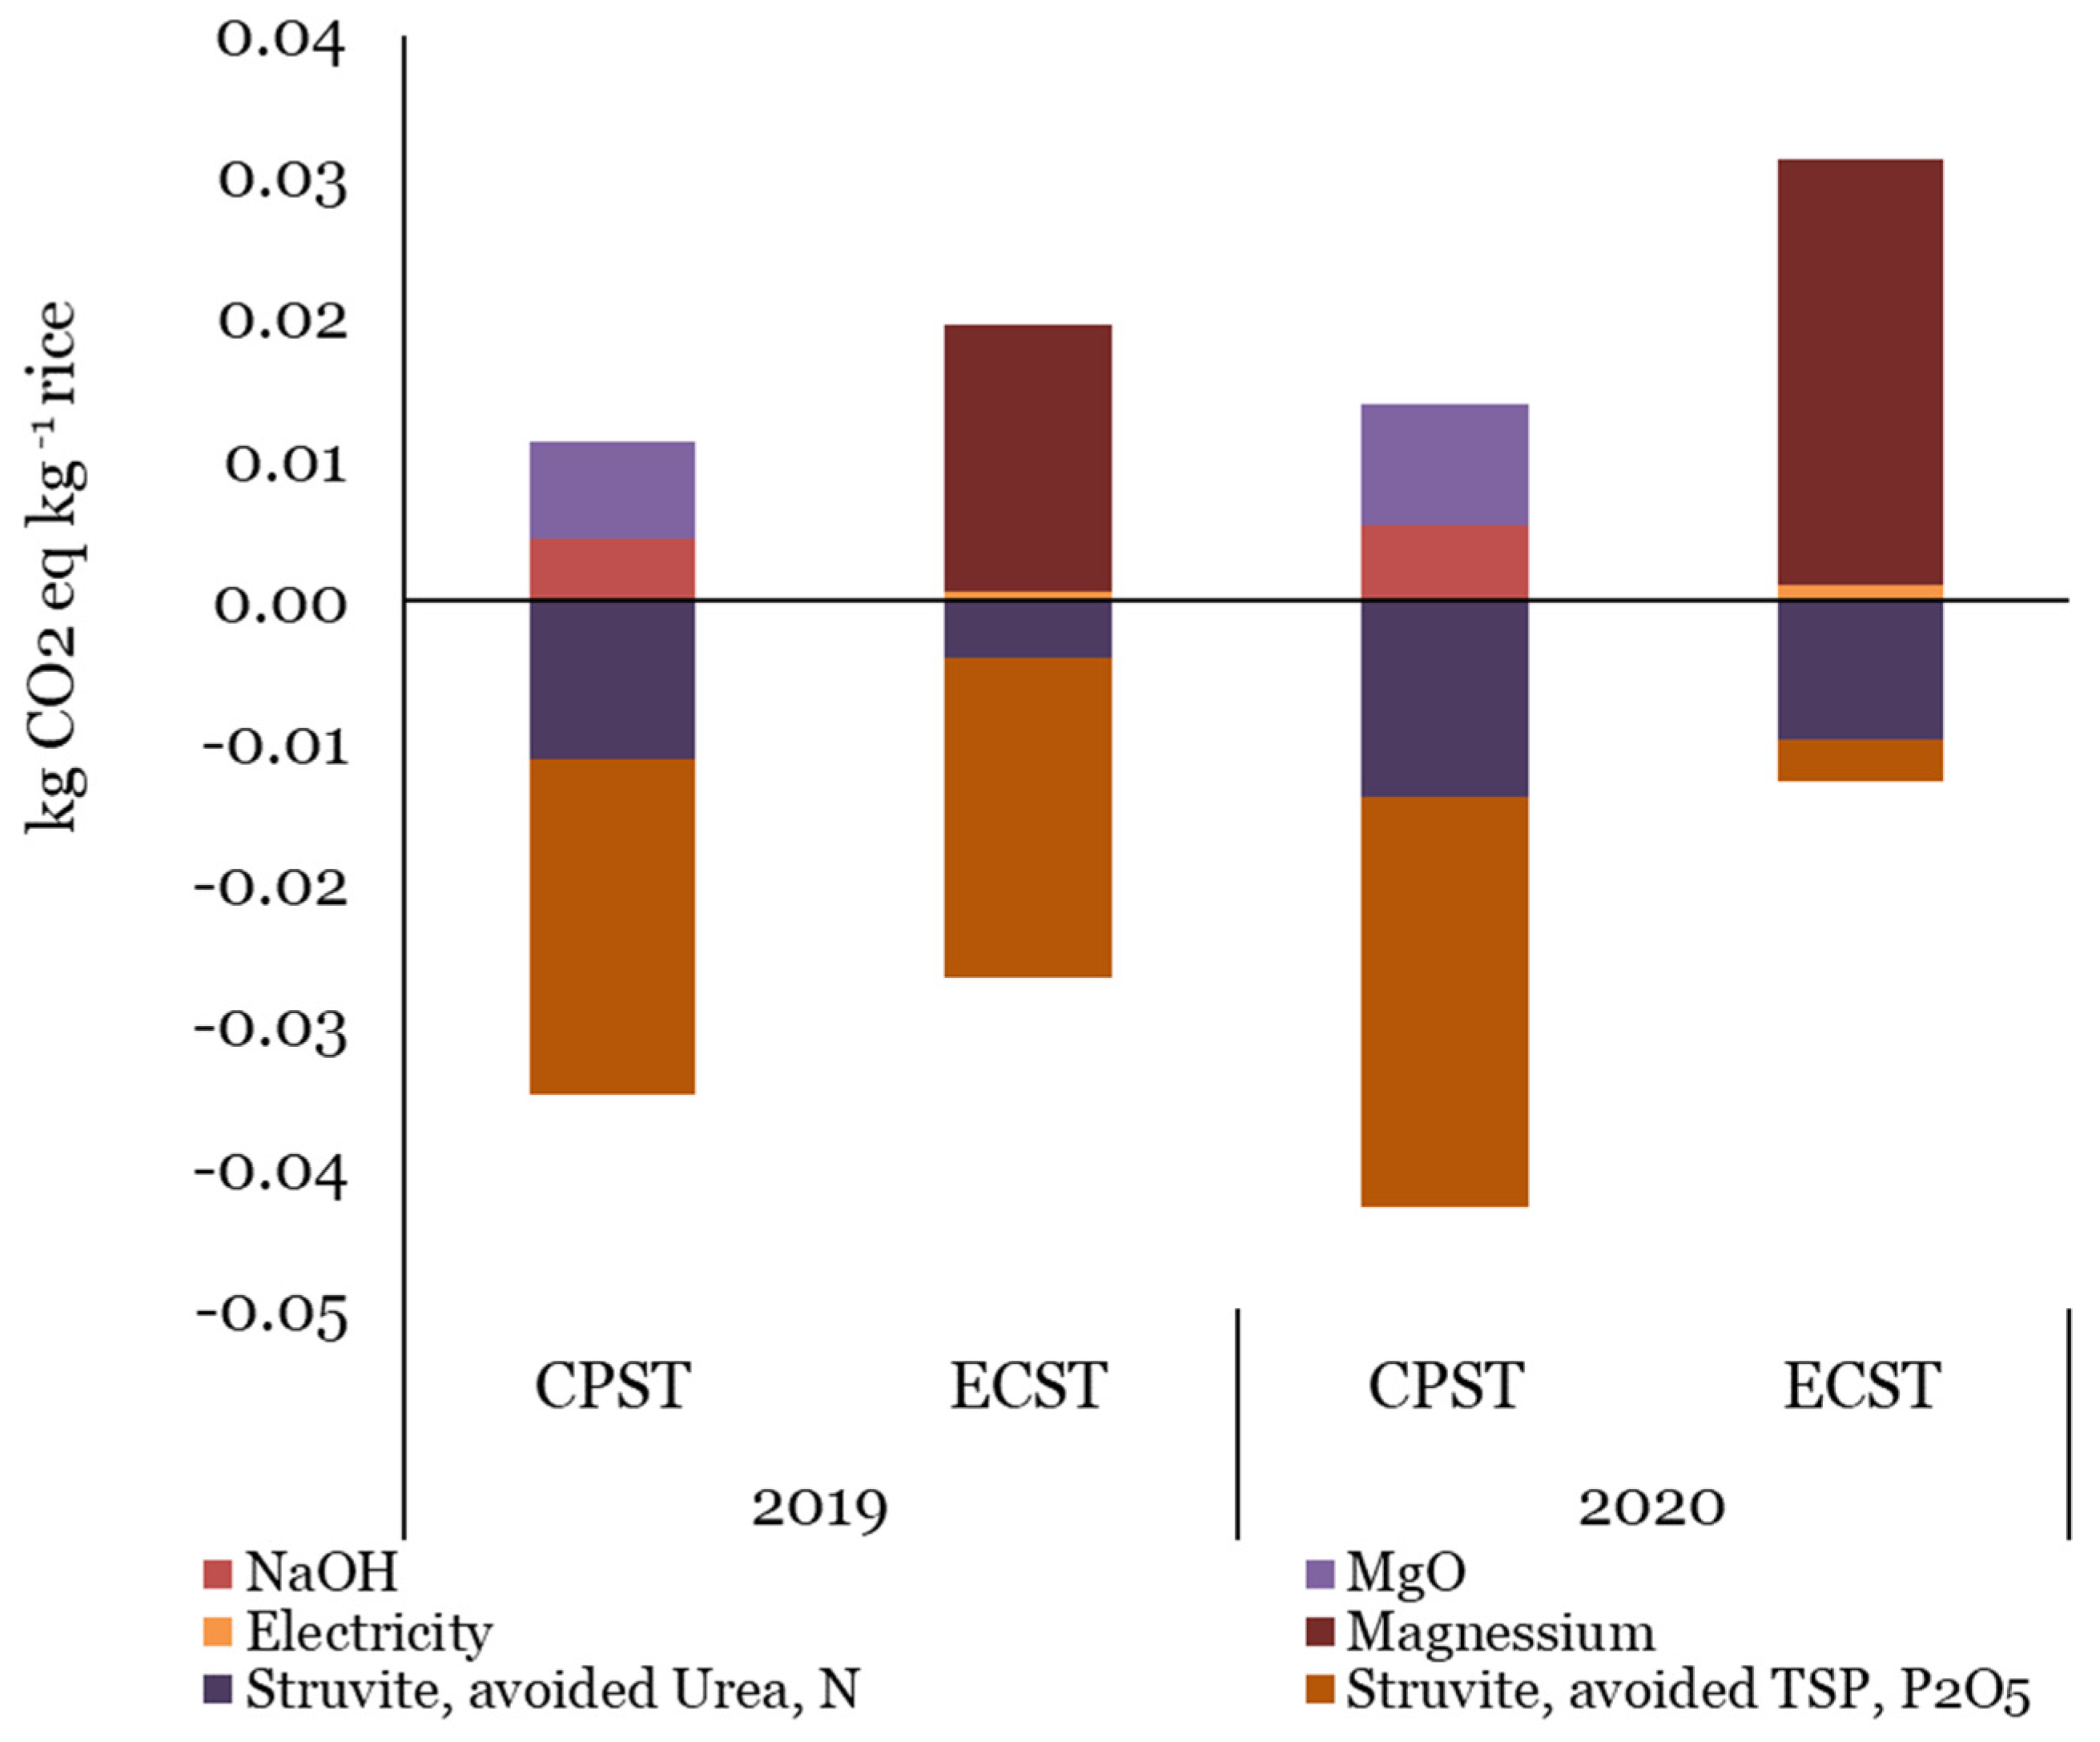
3.3. Global Warming Potential Evaluation

Estimated GWP of rice production using CPST was 0.58 and 0.70 kg CO2 eq kg−1 rice in 2019 and 2020, respectively, whereas estimated GWP using ECST was 0.57 and 0.80 kg CO2 eq kg−1 rice 2019 and 2020, respectively (Figure 2). In 2019, estimated GWP numerically differed between struvite materials by <3%, whereas in 2020, estimated GWP was >15% numerically greater for ECST than CPST. Annual differences in estimated GWP were at least partially related to annual differences in rice yields and the crop nutrient composition from the ECST material between years. Rice yields were similar between CPST and ECST in each year, but yields were 39 and 23% lower in 2020 compared to 2019 from ECST and CPST, respectively (Table 4). Furthermore, in 2020, due to lower P concentrations from the different synthetic wastewater solutions prepared and processed, the amount of ECST applied was 14% greater compared to in 2019. A greater amount of struvite was necessary to provide the consistent fertilizer-P rate across all treatment scenarios (i.e., 67.6 kg P2O5 ha−1). Consequently, the lower rice yields in 2020 compared to 2019 clearly had a substantial effect on the estimated GWP from the flood-irrigated rice production system in eastern Arkansas.
Compared to the other fertilizer-P sources, the estimated GWP for both ECST and CPST in 2019 was lower than from the control, TSP, and RP, but was greater than from DAP and MAP (Figure 2). In 2020, estimated GWP for CPST was lower than RP, but was greater than the control, DAP, MAP, and TSP (Figure 2). For ECST in 2020, estimated GWP was greater than the control and all other conventional fertilizers (Figure 2), at least partially due to the combination of a different nutrient composition and lower rice yields in 2020 than in 2019.
In 2019, there was a small numeric increase in rice yield (58 kg ha−1) for ECST compared to DAP, but estimated GWP was not substantially reduced. Most likely the environmental burdens related to the production of struvite were not sufficient to outrank the impact of producing the DAP, nor decrease ECST’s relative contribution to the estimated GWP footprint. Furthermore, for the DAP and MAP treatments, there were GHG credits (Figure 3), which were due to the co-production of fertilizer-N in the fertilizer-P production process. The multioutput process in the production process of DAP and MAP also delivered the co-product of diammonium phosphate (i.e., 1 kg MAP and DAP each also co-produced 0.211 and 0.391 kg N, respectively), which substituted the use of raw materials involved, mainly nitric acid and energy [51].
A minor reduction (0.01 kg CO2 eq kg−1 rice) in the impact occurred for ECST compared to RP in 2019, even though the rice yield for RP was 191 kg ha−1 greater and the impact for RP was contributed mostly by the production of phosphate rock, which was 1.02 × 10⁻² kg CO2 eq kg−1 rice. Similarly, estimated GWP for ECST in 2019 was greater compared to MAP, which was due to a combination of reduced yield (i.e., lower by 205 kg ha−1) and greater estimated GHG emissions during struvite production compared to the production of MAP (Figure 2, Table 2).
Figure 3 summarizes the relative contributions of numerous inputs and agronomic processes in the rice production system across the different fertilizer-P-source treatments. For CPST, of the total GHG emissions (i.e., GWP) estimated per 1 kg of rice produced for both years, approximately 66% was associated with field emissions, which was the combined effects of N2O, CH4, and CO2 emissions. Nitrous oxide and CO2 emissions accounting for the field emissions were related to the applied urea. For ECST, the contribution due to field emissions was approximately 64% across both years (Figure 3). Similarly, across both years, the contribution due to N2O emissions alone was 6%, whereas the contributions from CH4 emissions was around 88% (Figure 3). Similar ranges for the contributions of N2O and CH4 were estimated for the non-struvite P application scenarios.
Seed production contributed around 1% to the estimated total GHG emissions for all treatment scenarios, including the struvite treatments, whereas the combined contribution from agri-chemicals (i.e., fertilizers, pesticides, and micro-nutrients; Table 2) was approximately 10% for CPST in both years and was 12 and 8% in 2019 and 2020, respectively, for ECST (Figure 3). Fuel consumption contributed about 6% for CPST and ECST in both years. Irrigation contributed approximately 20% for both CPST and ECST in 2019, whereas in 2020, irrigation contributed approximately 21% for CPST and 20% for ECST (Figure 4). The estimated credits towards the GHG emissions due to the substitution of synthetic fertilizer by the struvite material was approximately 4% for CPST across both years (Figure 3). For ECST, the estimated GHG emissions reduction was approximately 2% in 2019, but there was no net GHG emissions reduction for ECST in 2020, as the struvite production process itself had greater GHG emissions than the calculated credit (i.e., about 2% of the total GHG was added due to the struvite production process). For ECST in 2020, the added environmental burden was mainly due to the lower P concentrations compared to the ECST batch used in 2019 (Table 2), and approximately 2% was the added GHG emissions (Figure 3).
The contributions during the production and application of struvite estimated per 1 kg rice are shown in Figure 4. In 2019 and 2020, the added burdens (per 1 kg rice) in the CPST production process were NaOH (0.0044 to 0.0054 kg CO2 eq) and magnesium oxide (0.007 to 0.0085 kg CO2 eq), whereas the credit GHG emissions due to the substitution of equivalent amounts of synthetic fertilizers amounted to −0.03 to −0.04 kg CO2 eq. However, in the case of ECST, the added burdens in 2019 and 2020 were electricity (0.0007 to 0.0011 kg CO2 eq) and magnesium (0.019 to 0.03 kg CO2 eq), whereas the credited GHG emissions due to the substitution of fertilizers were smaller than the added burdens, with a credit of only −0.03 to −0.013 kg CO2 eq per kg rice. The equivalent mass of struvite applied per kg rice was 0.01 and 0.022 kg for ECST, respectively, in 2019 and 2020, whereas for CPST it was 0.02 and 0.03 kg kg−1 rice, respectively, in 2019 and 2020.

3.4. Implications

Because actual market prices for ECST do not exist yet, ECST was assumed to have similar prices to CPST, which is an established struvite product. As such, not only were the fertilization costs for ECST and CPST greater than for the other commonly used, commercially available fertilizer-P sources, but measured yields were also often numerically lower, markedly lower in 2020, than field-measured yields for the other fertilizer-P sources. Improvements in yield response, or struvite prices much lower than those applied in this analysis, are needed before struvite can realistically become an economically viable alternative fertilizer-P source for flood-irrigated rice production. However, the additional economic benefits provided from the use of recycled nutrients—such as P and N load reductions in WWTPs, and P and N load reductions to receiving waters and the environment increasing future resource use efficiency as mineral-P resources are further depleted, among others, which were not accounted for in this study, may, in time, close the economic gap between present commercially available fertilizer-P sources and alternatives, such as the two struvite materials.
From the LCIA, it was also shown that the nutrient concentrations of the wastewater can greatly affect GHG emissions, since total nutrient recovery was the driving parameter for the substitutable amounts of synthetic fertilizers and the related impact of producing them. For example, with the reduced amount of recovered nutrients in 2020 for ECST, more struvite was necessary to apply to provide the consistent fertilizer-P rate across all treatments (i.e., 67.6 kg P2O5 ha−1; Table 2) and, instead of offsetting the GHG emissions, the added impact due to the struvite was 0.019 kg CO2 eq kg−1 rice, given that rice yield did not increase. Furthermore, for the GHG emissions, the added burden due to raw materials used in the struvite production process was greater than the credit (i.e., 0.0312 compared to −0.013 kg CO2 eq kg−1 rice, respectively). In 2019, for ECST, the total impact induced from the struvite system to rice system was instead −0.01 kg CO2 eq kg−1 rice, in which the added burden was 0.0196 kg CO2 eq kg−1 rice and the credit offered by the struvite was −0.03 kg CO2 eq kg−1 rice. Similarly, the lower rice yields in 2020 compared to 2019 across all fertilizer-P sources also affected the estimated GHG emissions per kg rice produced, as lower nutrient removal occurred from harvesting, which left more nutrients in the field potentially contributing to negative environmental consequences. In contrast to ECST, for CPST, the induced impact due to the struvite production process to the rice system was −0.024 and −0.029 kg CO2 eq kg−1 rice in 2019 and 2020, respectively.
Apart from mitigating GHG emissions, which is primarily related to the production of synthetic fertilizer before their use in the field, the benefits of resource recovery from struvite are related to community-scale wastewater treatment facilities, such as with respect to energy recovery, water reuse, and, importantly, nutrient recycling. Considering these prospects, it is imperative that other environmental benefits, such as changes in eutrophication potential (i.e., nutrient enrichment of terrestrial and aquatic ecosystems), fossil fuel resource depletion potential, and acidification potential, be further evaluated. This study is limited to having only addressed these additional environmental impact categories, but other impacts need to be addressed as well. It is also relevant to evaluate struvite recovery from different wastewater streams, including manure management from cattle and swine farms, and to compare various other municipal wastewater treatment technologies with respect to nutrient recovery potential.
Considering only the use of struvite-derived fertilizer-P sources (i.e., CPST or ECST) in the field for crop production, if the struvite materials do indeed dissolve and release P at a slower rate, to better match the timing of the plants’ nutrient needs with the availability of the fertilizer nutrients compared to other commonly used, commercially available fertilizer-P sources, which still requires additional research to confirm, the expected result would be greater nutrient-use efficiency, and hence less potential fertilizer loss, particularly for N from denitrification, consequently reducing GHG emissions. The potential benefit of reduced GHG emissions from the use of struvite-derived, wastewater-recycled fertilizer nutrients in the field would be expected to extend beyond flood-irrigated rice production to other upland crops, such as corn and soybean.
Presently, struvite use in row-crop agriculture is still relatively new, but is developing. Consequently, even preliminary economic and LCA evaluations, such as the current study, are as yet quite limited to non-existent. Furthermore, at the present time, the ECST production process is experimental, and thus the ultimate scaled-up and optimized operations of the ECST process may have lower environmental impacts than predicted in this work. Furthermore, during the ECST process, hydrogen is produced as a byproduct, but potential benefits were not investigated in this study. Hydrogen as a potential fuel source may provide additional environmental benefits to the whole ECST production system. The environmental impact and energy efficiency of hydrogen, however, will depend on how the hydrogen is produced [72,73]. Considering the average CO2 emissions, or energy intensity, of typical fossil fuels is about 70 g CO2 MJ−1 [74], the benefits of capturing hydrogen can be estimated from its potential to substitute equivalent energy/fuel in the market. Likewise, the environmental benefits of recycled nutrients, such as P and N load reductions in WWTPs, and P and N load reductions to receiving waters and the environment, among others, were not quantified in this study, which could further mitigate the estimated negative environmental impacts, such as freshwater eutrophication. A commercial-scale, operational WWTP, integrated with an up-scaled struvite production process, could further guide research and management directions to improve the environmental footprint of WWTP processes.

4. Conclusions

This study aimed to provide a preliminary evaluation of the economic and global warming implications of struvite as a fertilizer-P source for flood-irrigated rice production in Arkansas relative to other commonly used, commercially available fertilizer-P sources. Partial budget analyses supported the hypothesis that ECST and CPST would produce lower net revenues than TSP, MAP, DAP, and RP, in part because the ECST process is still in the experimental phase and robust cost information is not yet available. Economic analyses also revealed that economic returns for TSP exceeded returns to all other fertilizer-P sources over the two study years. Although not unexpected, results suggest that, without substantial yield improvements, fertilizer cost reductions, and/or government policies or subsidies that provide incentives for using struvite products, struvite fertilizers will likely not be adopted in place of the more common fertilizer-P sources because of struvite’s current cost disadvantage; thus, struvite fertilizers are not likely to be widely adopted in the near future for use in Arkansas rice production. Similar results were identified for estimated GWP, particularly for ECST and its production process and when P recovery from the wastewater is relatively low. The estimated GWP of struvite use in a rice production system was greatly influenced by the P and N recovery from the struvite and struvite’s potential to substitute for conventional synthetic fertilizers. The combined implications of lower P concentration and lower rice yields from ECST in 2020 compared to 2019 were clearly manifested in the lower overall environmental footprint for ECST compared across fertilizer-P treatments and between the two years. However, when nutrient concentrations and yields were larger, as occurred in 2019, the GHG emissions from both struvite materials were at least comparable, and at times lower, to those of other commercially available fertilizer-P sources commonly used in rice production. Continued research and refinement of the ECST process may lead to greater efficiencies, hence potentially lowering costs, such that ECST may become an economically competitive fertilizer-P source for use in agricultural crop production beyond just rice. As results indicate competitive yield and environmental outcomes, it is clear that struvite, whether CPST or ECST, has potential to become a sustainable fertilizer-P-source alternative for use in large-scale production agriculture once the costs of ECST production are better understood.

Author Contributions

Conceptualization, K.R.B., G.T., J.P. and L.F.G.; Funding acquisition, K.R.B., J.P., G.T. and L.F.G.; Investigation, N.S.O.; Methodology, K.R.B., N.S.O., T.L.R., L.E., R.P., L.K.-N. and R.S.; Project administration, K.R.B., R.P., J.P., L.K.-N. and G.T.; Writing—original draft, K.R.B., N.S.O., L.E. and R.P.; Writing—review & editing, T.L.R., J.P., G.T. and L.F.G. All authors have read and agreed to the published version of the manuscript.

Funding

This work was supported by a research grant from the National Science Foundation (NSF) INFEWS/T3 Program (Award #1739473).

Acknowledgments

Ryder Anderson and Jonathan Brye are gratefully acknowledged for their assistance in the field.

Conflicts of Interest

The authors declare no conflict of interest.

References

  1. Rouwenhorst, K.H.R.; Krzywda, P.M.; Benes, N.E.; Mul, G.; Lefferts, L. Chapter 4—Ammonia production technologies. In Techno-Economic Challenges of Green Ammonia as an Energy Vector; Valera-Medina, A., Banares-Alcantara, R., Eds.; Academic Press: London, UK, 2020; pp. 41–83. [Google Scholar]
  2. Cordell, D.; Drangert, J.O.; White, S. The story of phosphorus: Global food security and food for thought. Glob. Environ. Chang. 2009, 19, 292–305. [Google Scholar] [CrossRef]
  3. Tiseo, I. Global Key Figures on Wastewater Generation. 2020. Available online: https://www.statista.com/statistics/1124488/key-facts-wastewater-generation-globally/ (accessed on 4 August 2021).
  4. Huang, H.; Song, Q.; Wang, W.; Wu, S.; Dai, J. Treatment of anaerobic digester effluents of nylon wastewater through chemical precipitation and a sequencing batch reactor process. J. Environ. Manag. 2012, 101, 68–74. [Google Scholar] [CrossRef] [PubMed]
  5. Kim, D.; Ryu, H.D.; Kim, M.S.; Kim, J.; Lee, S.I. Enhancing struvite precipitation potential for ammonia nitrogen removal in municipal landfill leachate. J. Hazard. Mater. 2007, 146, 81–85. [Google Scholar] [CrossRef]
  6. Liu, Y.; Kumar, S.; Kwag, J.; Kim, J.H.; Kim, J.D.; Ra, C. Recycle of electrolytically dissolved struvite as an alternative to enhance phosphate and nitrogen recovery from swine wastewater. J. Hazard. Mater. 2011, 195, 175–181. [Google Scholar] [CrossRef] [PubMed]
  7. United Nations Educational, Scientific and Cultural Organization (UNESCO). Managing Water under Uncertainty and Risk. The United Nations World Water Development Report 4. 2012. Available online: https://www.unesco.at/fileadmin/Redaktion/Publikationen/Publikations-Dokumente/2012_WWDR_Executive_Summary_en.pdf (accessed on 4 August 2021).
  8. Doyle, J.D.; Oldring, K.; Churchley, J.; Price, C.; Parsons, S.A. Chemical control of struvite precipitation. J. Environ. Eng. 2003, 129, 419–426. [Google Scholar] [CrossRef]
  9. Forrest, A.L.; Fattah, K.P.; Mavinic, D.S.; Koch, F.A. Optimizing struvite production for phosphate recovery in WWTP. J. Environ. Eng. 2008, 134, 395–402. [Google Scholar] [CrossRef]
  10. Correll, D.L. The role of phosphorus in the eutrophication of receiving waters: A review. J. Environ. Qual. 1998, 27, 261–266. [Google Scholar] [CrossRef] [Green Version]
  11. Dodds, W.K.; Bouska, W.W.; Eitzmann, J.L.; Pilger, T.J.; Pitts, K.L.; Riley, A.J.; Schloesser, J.T.; Thornbrugh, D.J. Eutrophication of U.S. freshwaters: Analysis of potential economic damages. Environ. Sci. Technol. 2009, 43, 12–19. [Google Scholar] [CrossRef] [Green Version]
  12. MacDonald, G.K.; Jarvie, H.P.; Withers, P.J.; Doody, D.G.; Keeler, B.L.; Haygarth, P.M.; Johnson, L.T.; Mcdowell, R.W.; Miyittah, M.K.; Powers, S.M.; et al. Guiding phosphorus stewardship for multiple ecosystem services. Ecosyst. Health Sustain. 2016, 2, e01251. [Google Scholar] [CrossRef] [Green Version]
  13. Kruk, D.J.; Elektorowicz, M.; Oleszkiewicz, J.A. Struvite precipitation and phosphorus removal using magnesium sacrificial anode. Chemosphere 2014, 101, 28–33. [Google Scholar] [CrossRef] [PubMed]
  14. Kékedy-Nagy, L.; Moore, J.P., II; Abolhassani, M.; Attarzadeh, F.; Hestekin, J.A.; Greenlee, L.F. The passivating layer influence on Mg-based anode corrosion and implications for electrochemical struvite precipitation. J. Electrochem. Soc. 2019, 166, E358. [Google Scholar] [CrossRef]
  15. Kékedy-Nagy, L.; Teymouri, A.; Herring, A.M.; Greenlee, L.F. Electrochemical removal and recovery of phosphorus as struvite in an acidic environment using pure magnesium vs. the AZ31 magnesium alloy as the anode. Chem. Eng. J. 2020, 380, 122480. [Google Scholar] [CrossRef]
  16. Kékedy-Nagy, L.; Abolhassani, M.; Perez Bakovic, S.I.; Anari, Z.; Moore, J.P.; Pollet, B.G.; Greenlee, L.F. Electroless production of fertilizer (struvite) and hydrogen from synthetic agricultural wastewaters. J. Am. Chem. Soc. 2020, 142, 18844–18858. [Google Scholar] [CrossRef] [PubMed]
  17. Massey, M.S.; Davis, J.G.; Ippolito, J.A.; Sheffield, R.E. Effectiveness of recovered magnesium phosphates as fertilizers in neutral and slightly alkaline soils. Agron. J. 2009, 101, 323–329. [Google Scholar] [CrossRef]
  18. Kern, J.; Heinzmann, B.; Markus, B.; Kaufmann, A.C.; Soethe, N.; Engels, C. Recycling and assessment of struvite phosphorus from sewage sludge. Agric. Eng. Int. CIGR J. 2008, X, 12–24. [Google Scholar]
  19. Talboys, P.J.; Heppell, J.; Roose, T.; Healey, J.R.; Jones, D.L.; Withers, P.J. Struvite: A slow-release fertilizer for sustainable phosphorus management? Plant Soil 2015, 401, 109–123. [Google Scholar] [CrossRef] [Green Version]
  20. Everaert, M.; Da Silva, R.C.; Degryse, F.; McLaughlin, M.J.; Smolders, E. Limited dissolved phosphorus runoff losses from layered doubled hydroxides and struvite fertilizers in a rainfall simulation study. J. Environ. Qual. 2017, 47, 371–377. [Google Scholar] [CrossRef]
  21. Anderson, R.; Brye, K.; Kekedy-Nagy, L.; Greenlee, L.; Gbur, E.; Roberts, T. Electrochemically precipitated struvite effects on extractable nutrients compared with other fertilizer-phosphorus sources. Agrosyst. Geosci. Environ. 2021, 4, e20183. [Google Scholar] [CrossRef]
  22. Anderson, R.; Brye, K.R.; Greenlee, L.; Roberts, T.L.; Gbur, E. Wastewater-recovered struvite effects on total extractable phosphorus compared with other phosphorus sources. Agrosyst. Geosci. Environ. 2021, 4, e20154. [Google Scholar] [CrossRef]
  23. Anderson, R.; Brye, K.R.; Kekedy-Nagy, L.; Greenlee, L.; Gbur, E.; Roberts, T.L. Total extractable phosphorus in flooded soil as affected by struvite and other fertilizer-phosphorus sources. Soil Sci. Soc. Am. J. 2021, 85, 1157–1173. [Google Scholar] [CrossRef]
  24. Ylagan, S.; Brye, K.R.; Greenlee, L. Corn and Soybean response to wastewater-recovered and other common phosphorus fertilizers. Agrosyst. Geosci. Environ. 2020, 3, e20086. [Google Scholar] [CrossRef]
  25. Omidire, N.S.; Brye, K.R.; Kekedy-Nagy, L.; Greenlee, L.; Roberts, T.L.; Gbur, E.E.; Mozzoni, L. Evaluation of electrochemically precipitated struvite as a fertilizer-phosphorus source in flood-irrigated rice. Agron. J. 2022, 114, 739–755. [Google Scholar] [CrossRef]
  26. Peng, P.H.; Ernst, W.R.; Bridger, G.L.; Hartley, E.M. Slow release fertilizer materials based on magnesium ammonium phosphate. Pilot-plant granulation studies. Ind. Eng. Chem. Process Des. Dev. 1979, 18, 453–458. [Google Scholar] [CrossRef]
  27. Muhmood, A.; Lu, J.; Dong, R.; Wu, S. Formation of struvite from agricultural wastewaters and its reuse on farmlands: Status and hindrances to closing the nutrient loop. J. Environ. Manag. 2019, 230, 1–13. [Google Scholar] [CrossRef]
  28. Ostara Nutrient Recovery Technologies, Inc. Game-Changing Technology: Leading Nutrient Management Solutions. 2021. Available online: https://ostara.com/nutrient-management-solutions/ (accessed on 20 August 2021).
  29. Ostara Nutrient Recovery Technologies, Inc. Agriculture: Crystal Green Provides Phosphorus When Roots Need It. 2021. Available online: https://crystalgreen.com/agriculture/ (accessed on 20 August 2021).
  30. Lyseng, R. Trials Testing Efficacy of New Fertilizer. The Western Producer. 2014. Available online: https://www.producer.com/crops/trials-testing-efficacy-of-new-fertilizer/ (accessed on 20 August 2021).
  31. Omidire, N.S.; English, L.; Brye, K.R.; Popp, J.; Greenlee, L. Struvite: Definition, Benefits, and Potential Application in Arkansas Agriculture; Factsheet FSA9542; University of Arkansas Cooperative Extension Service Printing Services: Little Rock, AR, USA, 2020. [Google Scholar]
  32. West Central Ag Services (WCAS). Fertilizer Pricing. 2020. Available online: https://storcoopmediafilesprd.blob.core.windows.net/atlasportals/all-media/wcas/west-central-ag-services/pdfs/fertilizer-price-guide-01-27-20.pdf (accessed on 30 July 2021).
  33. University of Arkansas Division of Agriculture (UADA), Cooperative Extension Service. Crop Enterprise Budgets for Arkansas Field Crops Planted in 2019; UADA: Little Rock, AR, USA, 2019. [Google Scholar]
  34. Durand-Morata, A.; Nalley, L.L.; Thoma, G. The implications of red rice on food security. Glob. Food Secur. 2018, 18, 62–75. [Google Scholar] [CrossRef]
  35. Shew, A.M.; Nalley, L.L.; Durand-Morat, A.; Meredith, K.; Parajuli, R.; Thoma, G.; Henry, C.G. Holistically valuing public investments in agricultural water conservation. Agric. Water Manag. 2021, 252, 106900. [Google Scholar] [CrossRef]
  36. Barak, P.; Stafford, A. Struvite: A recovered and recycled phosphorus fertilizer. In Proceedings of the 2006 Wisconsin Fertilizer, Aglime and Pest Management Conference, Madison, WI, USA, 17–19 January 2016; pp. 201–202. [Google Scholar]
  37. Chauhan, C.K.; Vyas, P.M.; Joshi, M.J. Growth and characterization of Struvite-K crystals. Cryst. Res. Technol. 2011, 46, 187–194. [Google Scholar] [CrossRef]
  38. Kataki, S.; West, H.; Clarke, M.; Barauh, D.C. Phosphorus recovery as struvite: Recent concerns for use of seed, alternative Mg source, nitrogen conservation and fertilizer potential. Resour. Conserv. Recycl. 2016, 107, 142–156. [Google Scholar] [CrossRef]
  39. United States Department of Agriculture (USDA), Environmental Resources Service (ERS). Rice Yearbook: Arkansas. USDA-ERS, 2021. Available online: https://www.ers.usda.gov/data-products/rice-yearbook/ (accessed on 28 May 2021).
  40. Soil Survey Staff, Natural Resources Conservation Service, United States Department of Agriculture. Web Soil Survey. 2015. Available online: https://websoilsurvey.sc.egov.usda.gov/App/WebSoilSurvey.aspx (accessed on 5 March 2021).
  41. Roberts, T.; Slaton, N.; Wilson, J.C.; Norman, R. Soil fertility. In Arkansas Rice Production Handbook; Cooperative Extension Service, Division of Agriculture, University of Arkansas: Little Rock, AR, USA, 2016; pp. 69–102. [Google Scholar]
  42. National Oceanic and Atmospheric Administration (NOAA). Data Tools: 1981–2010 Normals, Arkansas. 2020. Available online: https://www.ncdc.noaa.gov/data-access/land-basedstation-data/land-based-datasets/climate-normals/1981-2010-normals-data (accessed on 4 March 2021).
  43. United States Environmental Protection Agency (USEPA). Method 3050B: Acid Digestion of Sludges, Sediments, and Soils; USEPA: Washington, DC, USA, 1996. Available online: https://www.epa.gov/sites/production/files/2015-06/documents/epa-3050b.pdf (accessed on 30 July 2021).
  44. Provin, T. Total carbon and nitrogen and organic carbon via thermal combustion analyses. Soil test methods from the southeastern United States. South. Coop. Ser. Bull. 2014, 419, 149–154. [Google Scholar]
  45. Hardke, J.T. (Ed.) Arkansas Rice Production Handbook; Cooperative Extension Service, Division of Agriculture, University of Arkansas: Little Rock, AR, USA, 2021; Available online: https://www.uaex.edu/publications/pdf/mp192/mp192.pdf (accessed on 30 July 2021).
  46. Hardke, J.; Stiles, S. Arkansas Rice Update; No. 2020-25; University of Arkansas Division of Agriculture, Cooperative Extension Service: Little Rock, AR, USA, 2020; Available online: https://www.uaex.edu/farm-ranch/crops-commercial-horticulture/rice/Arkansas%20Rice%20Update%209-11-20.pdf (accessed on 30 July 2021).
  47. Department of Agricultural Economics, Mississippi State University (MSU). Rice 2019 Planning Budgets. Budget Report 2018-04. 2018. Available online: https://www.agecon.msstate.edu/whatwedo/budgets/docs/19/MSURICE19_11_14_18.pdf (accessed on 30 July 2021).
  48. Department of Agricultural Economics, Mississippi State University (MSU). Rice 2020 Planning Budgets. Budget Report 2019-04. 2019. Available online: https://www.agecon.msstate.edu/whatwedo/budgets/docs/20/MSURICE20.pdf (accessed on 30 July 2021).
  49. Quinn, R. DTN Retail Fertilizer Trends. Progressive Farmer. 2020. Available online: https://www.dtnpf.com/agriculture/web/ag/crops/article/2020/03/25/tfi-fertilizer-industry-essential-3 (accessed on 30 July 2021).
  50. ISO-14040; Environmental Management–Life Cycle Assessment–Principles and Framework. International Organization for Standardization: Geneva, Switzerland, 2006; pp. 652–668.
  51. Wernet, G.; Bauer, C.; Steubing, B.; Reinhard, J.; Moreno-Ruiz, E.; Weidema, B. The ecoinvent database version 3 (part I): Overview and methodology. Int. J. Life Cycle Assess. 2016, 21, 1218–1230. [Google Scholar] [CrossRef]
  52. Rogers, C.W.; Smartt, A.D.; Brye, K.R.; Norman, R.J. Nitrogen source effects on methane emissions from drill-seeded, delayed-flood rice production. Soil Sci. 2017, 182, 9–17. [Google Scholar] [CrossRef]
  53. Brye, K.R.; Rogers, C.W.; Smartt, A.D.; Norman, R.J.; Hardke, J.T.; Gbur, E.E. Methane emissions as affected by crop rotation and rice cultivar in the Lower Mississippi River Valley, USA. Geoderma Reg. 2017, 11, 8–17. [Google Scholar] [CrossRef]
  54. Humphreys, J.; Brye, K.R.; Rector, C.; Gbur, E.E.; Hardke, J.T. Water management and cultivar effects on methane emissions from direct-seeded, delayed-flood rice production in Arkansas. J. Rice Res. Dev. 2018, 1, 14–24. [Google Scholar]
  55. Tabatabai, M.A.; Burwell, R.E.; Ellis, B.G.; Keeney, D.R.; Logan, T.J.; Nelson, D.W.; Olson, R.A.; Randall, G.W.; Timmons, D.R.; Verry, E.S.; et al. Nutrient Concentrations and Accumulations in Precipitation over the North-Central Region; North-Central Region Research Publication 282; Iowa State University: Ames, IA, USA, 1981. [Google Scholar]
  56. National Research Council. Soil and Water Quality: An Agenda for Agriculture; The National Academies Press: Washington, DC, USA, 1993. [Google Scholar]
  57. Mayamulla, S.L.; Weerarathne, V.Y.; Marambe, B.; Sirisena, D.N.; Suriyagoda, L.D.B. Variation in seed nutrient content, seedling growth and yield of rice varieties grown in a paddy field without application of fertilisers for forty years. Crop Pasture Sci. 2017, 68, 337–348. [Google Scholar] [CrossRef]
  58. Rector, C.; Brye, K.R.; Humphreys, J.; Norman, R.J.; Gbur, E.E.; Hardke, J.T.; Willett, C.; Evans-White, M.A. N2O emissions and global warming potential as affected by water management and rice cultivar on an Alfisol in Arkansas, USA. Geoderma Reg. 2018, 14, e00170. [Google Scholar] [CrossRef]
  59. Rector, C.; Brye, K.R.; Humphreys, J.; Norman, R.J.; Slaton, N.A.; Gbur, E.E.; Willett, C.; Evans-White, M.A. Tillage and coated-urea effects on nitrous oxide emissions from direct-Seeded, delayed-flood rice production in Arkansas. J. Rice Res. Dev. 2018, 1, 25–37. [Google Scholar]
  60. Brentrup, F.; Küsters, J.; Lammel, J.; Kuhlmann, H. Methods to estimate on-field nitrogen emissions from crop production as an input to LCA studies in the agricultural sector. Int. J. Life Cycle Assess. 2000, 5, 349–357. [Google Scholar] [CrossRef]
  61. Nemecek, T.; Kägi, T.; Blaser, S. Life Cycle Inventories of Agricultural Production Systems. Ecoinvent Report Version 2: No. 15. 2007. Available online: https://db.ecoinvent.org/reports/15_Agriculture.pdf (accessed on 24 September 2021).
  62. Nemecek, T.; Bengoa, X.; Lansche, J.; Mouron, P.; Riedener, E.; Rossi, V.; Humbert, S. World Food LCA Database: Methodological Guidelines for the Life Cycle Inventory of Agricultural Products; Version 3.0; World Food LCA Database (WFLDB): Lausanne, Switzerland; Zurich, Switzerland, 2015. [Google Scholar]
  63. Gysin, A.; Lycke, D.; Wirtel, S. The Pearl® and WASSTRIP® Processes (Canada). In Phosphorus: Polluter and Resource of the Future; Schaum, C., Ed.; IWA Publishing: London, UK, 2018; pp. 359–366. [Google Scholar]
  64. Theregowda, R.B.; González-Mejía, A.M.; Ma, X.; Garland, J. Nutrient recovery from municipal wastewater for sustainable food production systems: An alternative to traditional fertilizers. Environ. Eng. Sci. 2019, 36, 833–842. [Google Scholar] [CrossRef] [PubMed]
  65. Kékedy-Nagy, L.; Abolhassani, M.; Sultana, R.; Anari, Z.; Brye, K.R.; Pollet, B.G.; Greenlee, L.F. The effect of anode degradation on energy demand and production efficiency of electrochemically precipitated struvite. J. Appl. Electrochem. 2022, 52, 205–215. [Google Scholar] [CrossRef]
  66. Mamakoa, E.; Fosso-Kankeu, E.; Masindi, V.; Neomagus, H.W.J.P. Sources of magnesium used in the synthesis of struvite from wastewater: A review. In Proceedings of the 17th Johannesburg International Conference on Science, Engineering, Technology & Waste Management (SETWM-19), Johannesburg, South Africa, 18–19 November 2019; pp. 75–78. [Google Scholar]
  67. Parajuli, R.; Løkke, S.; Østergaard, P.A.; Knudsen, M.T.; Schmidt, J.H.; Dalgaard, T. Life cycle assessment of district heat production in a straw fired CHP plant. Biomass Bioenergy 2014, 68, 115–134. [Google Scholar] [CrossRef]
  68. Intergovernmental Panel on Climate Change (IPCC). 2006 IPCC Guidelines for National Greenhouse Gas Inventories. 2006. Available online: https://www.ipcc.ch/report/2019-refinement-to-the-2006-ipcc-guidelines-for-national-greenhouse-gas-inventories/ (accessed on 5 September 2021).
  69. Amman, A.; Zoboli, O.; Krampe, J.; Rechberger, H.; Zessner, M.; Egle, L. Environmental impacts of phosphorus recovery from municipal wastewater. Resour. Conserv. Recycl. 2018, 130, 127–139. [Google Scholar] [CrossRef]
  70. Huijbregts, M.A.; Steinmann, Z.J.; Elshout, P.M.; Stam, G.; Verones, F.; Vieira, M.; Zijp, M.; Hollander, A.; Van Zelm, R. ReCiPe2016: A harmonised life cycle impact assessment method at midpoint and endpoint level. Int. J. Life Cycle Assess. 2017, 22, 138–147. [Google Scholar] [CrossRef]
  71. Myhre, G.; Shindell, D.; Bréon, F.-M.; Collins, W.; Fuglestvedt, J.; Huang, J.; Koch, D.; Lamarque, J.-F.; Lee, D.; Mendoza, B.; et al. 2013: Anthropogenic and Natural Radiative Forcing. In Climate Change 2013: The Physical Science Basis. Contribution of Working Group I to the Fifth Assessment Report of the Intergovernmental Panel on Climate Change; Stocker, T.F., Qin, D., Plattner, G.-K., Tignor, M., Allen, S.K., Boschung, J., Nauels, A., Xia, Y., Bex, V., Midgley, P.M., Eds.; Cambridge University Press: Cambridge, UK; New York, NY, USA, 2013. [Google Scholar]
  72. Rozzi, E.; Minuto, F.D.; Lanzini, A.; Leone, P. Green synthetic fuels: Renewable routes for the conversion of non-fossil feedstocks into gaseous fuels and their end uses. Energies 2020, 13, 420. [Google Scholar] [CrossRef] [Green Version]
  73. United States Department of Energy (USDOE). Hydrogen Production and Distribution. 2021. Available online: https://afdc.energy.gov/fuels/hydrogen_production.html (accessed on 8 September 2021).
  74. Patterson, B.D.; Mo, F.; Borgschulte, A.; Hillestad, M.; Joos, F.; Kristiansen, T.; Sunde, S.; Van Bokhoven, J.A. Renewable CO2 recycling and synthetic fuel production in a marine environment. Proc. Natl. Acad. Sci. USA 2019, 116, 12212–12219. [Google Scholar] [CrossRef] [PubMed] [Green Version]
Figure 1. System boundary considered for the life cycle impact evaluation for rice production using struvite. For non-struvite scenarios, there is no inflow of struvite from the struvite production systems to the rice production system.
Sustainability 14 09621 g001
Figure 2. Estimated 100-year global warming potential, per 1 kg rice, associated with a two-year field study (2019 and 2020) assessing the effects of various fertilizer-phosphorus sources (i.e., chemically precipitated struvite (CPST), electrochemically precipitated struvite (ECST), diammonium phosphate (DAP), monoammonium phosphate (MAP), rock phosphate (RP), triple superphosphate (TSP), and a control) on flood-irrigated rice production.
Sustainability 14 09621 g002
Figure 3. Contributions of various inputs to the estimated global warming potential associated with a two-year field study (2019 and 2020) assessing the effects of various fertilizer-phosphorus sources (i.e., chemically precipitated struvite (CPST), electrochemically precipitated struvite (ECST), diammonium phosphate (DAP), monoammonium phosphate (MAP), rock phosphate (RP), triple superphosphate (TSP), and a control) on flood-irrigated rice production. Dots represent the rice yields for comparison.
Sustainability 14 09621 g003
Figure 4. Contributions to the global warming potential of various components of the struvite production process for chemically precipitated struvite (CPST) and electrochemically precipitated struvite (ECST) for two rice-growing seasons (2019 and 2020) in eastern Arkansas.
Sustainability 14 09621 g004
Table 1. Summary of the total magnesium (Mg), nitrogen (N), phosphorus (P), and carbon (C) concentrations and resulting laboratory-measured fertilizer grade for the triple superphosphate (TSP), rock phosphate (RP), monoammonium phosphate (MAP), diammonium phosphate (DAP), chemically precipitated struvite (CPST), and the two batches of electrochemically precipitated struvite (ECST) used each year. Means (±standard error) are reported (n = 5). This table was adapted from Omidire et al. [25].
Fertilizer-P SourceNutrient Concentration (%)Measured Fertilizer Grade
MgNPC
TSP0.6 (<0.1)<0.1 (<0.1)18.2 (0.4)0.3 (<0.1)0-42-0
RP0.3 (<0.1)<0.1 (<0.1)7.6 (0.1)0.4 (<0.1)0-17-0
MAP1.5 (<0.1)10.7 (0.1)20.9 (0.2)0.3 (<0.1)11-48-0
DAP0.7 (<0.1)18.1 (0.1)18.3 (0.1)0.5 (<0.1)18-42-0
CPST8.3 (0.2)5.7 (0.2)11.7 (0.2)0.2 (<0.1)6-27-0
ECST 201913.3 (0.1)3.3 (0.2)18.5 (0.1)0.1 (<0.1)3-42-0
ECST 202012.7 (0.3)5.1 (0.2)16.1 (0.3)-5-37-0
Fertilizer grade is reported as N-P2O5-K2O.
Table 2. Life cycle inventory of rice production inputs and outputs for various fertilizer-phosphorus sources. All data are per 1 ha of rice produced across the treatment scenarios.
Inputs/Outputs for Field StudyUnit20192020
Con ECSTCPSTTSPMAPDAPRPConECSTCPSTTSPMAPDAPRP
Farm outputs
Rice yield 1Mg ha−110.7811.4710.9311.6911.6711.4111.669.528.228.909.849.539.259.14
Crop residue 1 Mg ha−110.7811.4710.9311.6911.6711.4111.669.528.228.909.849.539.259.14
Farm inputs
Rice seeds 1kg ha−18080808080808080808080808080
Struvite applied 1kg ha−1-159.7251.9-----182.5251.9----
Total N input 1kg N ha−1174.8178.1174.8174.8174.8174.8174.8174.8174.8174.8174.8174.8174.8174.8
Ureakg N ha−1174.8172.8160.4174.8174.8174.8174.8174.8165.5160.4174.8174.8174.8174.8
Struvitekg N ha−1-5.314.4-----9.314.4----
Total P input 1kg P2O5 ha−1-159.7251.9161.3140.6160.6386.5-182.5251.9161.3140.6160.6386.5
P fertilizerkg P2O5 ha−1---67.667.667.667.6---67.667.667.667.6
Struvitekg P2O5 ha−1-67.667.6-----67.667.6----
Total K input 1kg K2O ha−1100.4100.4100.4100.4100.4100.4100.4100.4100.4100.4100.4100.4100.4100.4
KClkg K2O ha−1100.4100.4100.4100.4100.4100.4100.4100.4100.4100.4100.4100.4100.4100.4
Fuel (Diesel) 1L ha−174.474.474.474.474.474.474.469.669.669.669.669.669.669.6
Irrigation H2O 1m3 ha−176207620762076207620762076207620762076207620762076207620
Herbicides 1kg ha−11.51.51.51.51.51.51.50.030.030.030.030.030.030.03
Glyphosate Nkg ha−11.51.51.51.51.51.51.5-------
Pendimethalinkg ha−12.5 × 10−32.5 × 10−32.5 × 10−32.5 × 10−32.5 × 10−32.5 × 10−32.5 × 10−32.5 × 10−32.5 × 10−32.5 × 10−32.5 × 10−32.5 × 10−32.5 × 10−32.5 × 10−3
Quinclorackg ha−12.4 × 10−22.4 × 10−22.4 × 10−22.4 × 10−22.4 × 10−22.4 × 10−22.4 × 10−22.4 × 10−22.4 × 10−22.4 × 10−22.4 × 10−22.4 × 10−22.4 × 10−22.4 × 10−2
Thibencarbkg ha−13.0 × 10−33.0 × 10−33.0 × 10−33.0 × 10−33.0 × 10−33.0 × 10−33.0 × 10⁻³-------
Propanilkg ha−13.0 × 10−33.0 × 10−33.0 × 10−33.0 × 10−33.0 × 10−33.0 × 10−33.0 × 10⁻³-------
Halosulfuron-methylkg ha−11.3 × 10−41.3 × 10−41.3 × 10−41.3 × 10−41.3 × 10−41.3 × 10−41.3 × 10−41.3 × 10−41.3 × 10−41.3 × 10−41.3 × 10−41.3 × 10−41.3 × 10−41.3 × 10−4
Thifensulfuron-methylkg ha−11.5 × 10−51.5 × 10−51.5 × 10−51.5 × 10−51.5 × 10−51.5 × 10−51.5 × 10−51.5 × 10−51.5 × 10−51.5 × 10−51.5 × 10−51.5 × 10−51.5 × 10−51.5 × 10−5
Bentazonkg ha−1-------2.5 × 10−32.5 × 10−32.5 × 10−32.5 × 10−32.5 × 10−32.5 × 10−32.5 × 10⁻³
Propanilkg ha−1-------4.0 × 10−34.0 × 10−34.0 × 10−34.0 × 10−34.0 × 10−34.0 × 10−34.0 × 10⁻³
Other chemicals 1
Zn-EDTAkg ha−11.11.11.11.11.11.11.11.11.11.11.11.11.11.1
Emissions to air 2
NH3kg ha−114.5914.8714.5914.5914.5914.5914.5914.5914.5914.5914.5914.5914.5914.59
NOxkg ha−14.184.264.184.184.184.184.184.184.184.184.184.184.184.18
N2Okg ha−10.940.940.940.940.940.940.940.940.940.940.940.940.940.94
CH4kg ha−1131.3131.3131.3131.3131.3131.3131.3131.3131.3131.3131.3131.3131.3131.3
N-emissions calculations 2
Total N inputkg ha−1183.0186.3183.0183.0183.0183.0183.0183.0183.0183.0183.0183.0183.0183.0
N uptake 2,akg ha−1132132130144141136142132132130144141136142
Field balance 2,bkg ha−15154533942474151515339424741
Total losses 2,ckg ha−114.614.914.614.614.614.614.614.614.614.614.614.614.614.6
NH3-Nkg ha−112.0612.2912.0612.0612.0612.0612.0612.0612.0612.0612.0612.0612.0612.06
NOx-Nkg ha−11.951.991.951.951.951.951.951.951.951.951.951.951.951.95
N2O-Nkg ha−10.600.600.600.600.600.600.600.600.600.600.600.600.600.60
NO3-N 2,dkg ha−136.3439.3838.3424.3427.3432.3426.3436.3436.3438.3424.3427.3432.3426.34
Water losses 2
NO3 2,dkg ha−1160.9174.3169.8107.8121.1143.2116.6160.9160.9169.8107.8121.1143.2116.6
Residue incorporationMg ha−110.7811.4710.9311.6911.6711.4111.669.528.228.909.849.539.259.14
Control (Con), electrochemically precipitated struvite (ECST), chemically precipitated struvite (CPST), triple superphosphate (TSP), monoammonium phosphate (MAP), diammonium phosphate (DAP), and rock phosphate (RP). Assumptions: Calculations for specific raw materials and assumptions are also explained in Section 2.6.1. Other details follow as below: 1 Rice yields from the field data [25]; crop residue assumed to equal the rice yield. 2 Total N = N from fertilizers + N deposition (8.15 kg N ha−1) [55,56] plus N from seeds (0.0084 kg N ha−1) [57]. 2,a Crop N uptakes, calculated and assumed after N uptake measured in field trials [25]. 2,b Field balance = total N inputs minus N losses 2,c Total N-losses = loss due to NH3, NOx, N2O-N. N2O emissions ranged from 0.4 to 0.8 kg N2O-N ha−1 year−1 based on two field studies conducted in two different years [58,59]; NH3 emission = emissions factor for NH3-N × kg N applied × NH3-N to N = 0.15 × N input × 1.21 from Nemecek et al. [61,62]; NOX emission = emissions factor for NO-N × (kg N applied minus NH3-N) × NOx-N to NOX = 0.012 × (N input) × 2.143 from Nemecek et al. [61,62]; CH4 emissions ranged from 76.4 to 161.6 kg CH4 ha−1 year−1 (76.4, 143.2, 144.1, and 161.6 kg CH4 ha−1 year−1 based on three field studies [52,53,54]; 2,d NO3 = field balance minus N losses (kg NO3-N) × NO3-N to NO3 = kg NO3-N × 4.43.
Table 3. Inputs and outputs for the struvite precipitation process for chemically precipitated struvite (CPST) and electrochemically precipitated struvite (ECST) production and field application in the 2-year field study.
Struvite Precipitation
Process Components
UnitsAmount
CPSTECST 1
2019/202020192020
Inputs
Sodium hydroxidekg kg−1 struvite0.13
Magnesium oxidekg kg−1 struvite0.3
Pure Mg plate (Mg 99.9%) 0.310.31
ElectricitykW kg−1 struvite 0.350.35
Outputs
Struvitekg kg−1 struvite1.01.01.0
Avoided fertilizers 2,3
N fertilizerkg N kg−1 struvite0.120.070.11
Phosphate fertilizerkg P2O5 kg−1 struvite0.641.020.08
Assumptions: 1 Field data: ECST production based on pulsating DC current, usage of 0.124 to 0.22 kW g−1 struvite. Treatment process handling 330 to 661.5 L wastewater kg−1 struvite produced. Pure Mg plate usage ranged from 180 to 310 g kg−1 struvite (upper range selected as the basic assumption). Struvite production 0.65 to 1.3 g L−1 wastewater. 2 Calculated and assumed raw material inputs and outputs for CPST based on Omidire et al. [25], Gysin et al. [63], and Theregowda et al. [64]. 3 Nutrient concentrations in CPST and ECST: In 2019 and 2020, CPST contained 5.7% N and urea contained 46% N—thus, 1 kg of CPST = 0.057 kg N = 0.124 kg urea; CPST contained 11.7% P or 26.9% P2O5 and triple superphosphate (TSP) contained 41.86% P2O5—thus, 1 kg of CPST = 0.269 kg P2O5 = 0.643 kg TSP. In 2019, ECST contained 3.3% N—thus, 1 kg of ECST = 0.033 kg N = 0.072 kg urea; ECST contained 18.5% P or 42.6% P2O5—thus, 1 kg ECST = 0.426 kg P2O5 = 1.018 kg TSP. In 2020, ECST contained 5.1% N—thus, 1 kg of ECST = 0.051 kg N = 0.111 kg urea; ECST contained 16.1% P or 37.0% P2O5—thus, 1 kg CPST = 0.37 kg P2O5 = 0.884 kg TSP.
Table 4. Summary of mean (± standard error) yields (n = 4 per treatment per year) among fertilizer-phosphorus (P) sources in the 2019 and 2020 rice-growing seasons in a P-deficient, silt–loam soil in eastern Arkansas. Yields are reported at 12% moisture [25].
Fertilizer-P SourceYield (Mg ha−1)
20192020
Triple superphosphate11.7 (0.14) a 9.8 (0.29) bc
Electrochemically precipitated struvite11.5 (0.17) a8.2 (0.34) e
Chemically precipitated struvite10.9 (0.34) a8.9 (0.53) de
Monoammonium phosphate11.7 (0.22) a9.5 (0.41) cd
Diammonium phosphate11.4 (0.30) a9.2 (0.73) cd
Rock phosphate11.7 (0.06) a9.1 (0.10) cd
Control10.8 (0.12) ab9.5 (0.32) cd
Means with different letters are different at p < 0.05 [25].
Table 5. Estimated total revenues, total treatment costs, and net revenues ($ ha−1) from various fertilizer-phosphorus (P) source treatments.
Fertilizer-P Source Total RevenuesTotal Treatment CostsNet Revenues
201920202019202020192020
TSPUSD 2951USD 2688USD 227USD 210USD 2724USD 2478
MAPUSD 2947USD 2603USD 197USD 198USD 2750USD 2405
ControlUSD 2721USD 2600USD 142USD 142USD 2578USD 2458
DAPUSD 2881USD 2526USD 198USD 194USD 2682USD 2332
RPUSD 2944USD 2497USD 294USD 294USD 2650USD 2203
ECSTUSD 2895USD 2246USD 282USD 292USD 2614USD 1954
CPSTUSD 2759USD 2431USD 353USD 347USD 2406USD 2084
TSP, triple superphosphate; MAP, monoammonium phosphate; DAP, diammonium phosphate; RP, rock phosphate; ECST, electrochemically precipitated struvite; CPST, chemically precipitated struvite.
Table 6. Comparison of annual and two-year total and two-year average annual net revenues (USD ha−1) by fertilizer-phosphorus (P) source treatment.
Fertilizer-P SourceAnnual Net RevenuesTwo-Year Net Returns
20192020TotalAverage
Triple superphosphateUSD 2724USD 2478USD 5202USD 2601
Monoammonium phosphateUSD 2750USD 2405USD 5155USD 2577
ControlUSD 2578USD 2458USD 5036USD 2518
Diammonium phosphateUSD 2682USD 2332USD 5014USD 2507
Rock phosphateUSD 2650USD 2203USD 4853USD 2426
Electrochemically precipitated struviteUSD 2614USD 1954USD 4568USD 2284
Chemically precipitated struviteUSD 2406USD 2084USD 4490USD 2245
Table 7. Estimated differences in net revenues and percent change per hectare per year from various fertilizer-phosphorus (P) sources compared to triple superphosphate.
Fertilizer-P Source20192020
$ ha−1% Change$ ha−1% Change
Triple superphosphate--------
Monoammonium phosphate260.9−73−2.9
Control−146−5.3−20−0.8
Diammonium phosphate−42−1.5−146−5.9
Rock phosphate−74−2.7−275−11.1
Electrochemically precipitated struvite−110−4.0−524−21.1
Chemically precipitated struvite−318−11.7−394−15.9
Publisher’s Note: MDPI stays neutral with regard to jurisdictional claims in published maps and institutional affiliations.

