Article

A Lifecycle Assessment of Meat Processing Products Made from Protein-Based Thermoplastics

by
Casparus J. R. Verbeek
1,*,
De Wet Van der Merwe
2 and
James M. Bier
2
1
Centre for Advanced Materials Manufacturing and Design, Faculty of Engineering, University of Auckland, Auckland 1023, New Zealand
2
School of Engineering, University of Waikato, Hamilton 3240, New Zealand
*
Author to whom correspondence should be addressed.
Sustainability 2023, 15(4), 3455; https://doi.org/10.3390/su15043455
Submission received: 6 December 2022 / Revised: 12 February 2023 / Accepted: 13 February 2023 / Published: 14 February 2023

Abstract

:
Hygiene during slaughtering is paramount for meat processors and plugs are often used during slaughtering to reduce contamination from fecal matter. These products are rendered along with other waste and are considered a serious contaminant to rendering products. A life cycle assessment (LCA) was used to determine and compare the environmental impacts of plugs made from polypropylene to a protein-based thermoplastic (Novatein). For Novatein plugs, resin production dominated the non-renewable primary energy (NRPE) use and global warming potential (GWP), whereas the impacts from injection molding and packaging dominated downstream production. Novatein plugs had a higher GWP than the PP plug, but required less NRPE. Two important conclusions were drawn: a bio-based material does not necessarily present an overall reduced environmental impact in comparison to other products, and results can easily be skewed based on allocation methods used for impacts from upstream processes, especially considering waste products. However, not evident from this LCA is the advantage that Novatein breaks down during rendering, safely becoming part of part of the rendering products.

1. Introduction

The New Zealand meat industry processed between 18 and 22 million lambs per annum between 2010 and 2022 [1]. Slaughtering is performed at a very fast pace and must adhere to stringent food safety requirements, such as preventing fecal contamination [2,3]. Contaminated meat must be disposed of and represents a serious cost to meat processors. Several types of plugs are available to seal the intestinal track during slaughtering, originally based on the concept of a re-usable stainless-steel plug that would expand when inserted [4]. Modern solutions are typically single use products made from, e.g., polypropylene (PP), and have been shown to be very effective in preventing contamination [5]. It is impractical to separate these products from the entrails and they are consequently rendered with the offal, leading to meat-and-bone meal (product from rendering) contamination. A possible solution is a plug produced from Novatein, a bio-based plastic derived from blood meal, which can be rendered along with other waste from meat processing [6,7], thus avoids using petroleum-based plastics.
Using Novatein presents a unique life cycle situation, starting with farming for animal rearing. Slaughtering produces meat, blood, offal, and other waste as by-products. Blood and offal (carcasses and intestines) are disposed of by rendering into blood and meat-and-bone meal, respectively. Blood meal can be further converted into Novatein [6], injection molded into plugs, and used during slaughtering (Figure 1). This implies that a full life cycle of Novatein should consider farming, meat processing, blood meal production, and the chemical processes required for making the additives used in Novatein manufacture, as well as product disposal, which, in this case, is also rendering.
It has been well established that single-use plastics have significant negative impacts on the environment [8]. These products are used once and then discarded, often ending up in landfills or as litter in natural habitats. Plastic pollution harms wildlife and can have detrimental effects on ecosystems. Additionally, single-use plastics take hundreds of years to degrade and release toxic chemicals into the environment. Products from bio-based materials are often thought of as more environmentally friendly, presenting new opportunities to reduce resource depletion and plastic pollution [9,10]. However, they should be compared over the entire life cycle. For example, comparing starch-based biopolymers to polyethylene (PE) revealed they consumed fewer fossil fuels, but had a higher impact on the ecosystem and human health. However, in terms of disposal, they had a higher impact if land filled, with recycled PE having the lowest impact [11]. Similarly, bio-based PET performed better in terms of greenhouse gas emissions and fossil energy use, but not for human health and ecosystem quality [12]. In other studies, recycled petroleum and bio-based PET were compared to PLA. PLA had lower impacts than either source of PET [13]. For PET only, recycling had the lowest GHG emissions and NRPE, followed by recycled fossil fuel-based PET, although the results were strongly affected by allocation [13,14]. The importance of an appropriate waste management strategy was also highlighted in a study comparing conventional and bio-based garbage bags [15]. It was shown that incineration with energy recovery is the best strategy for both PE and bio-PE bags, while composting is best for PBAT/starch-based bags [15].
Biopolymers, in general, are fairly new and often have similar impacts to petroleum-based polymers. It has been shown that some biopolymers perform well considering green design, but their production has reasonably large environmental impacts compared to petrochemical plastics [16]. Additionally, there is still little end-of-life data for biopolymers, and each study requires thorough research into their disposal [9,17]. It is suggested that claims that bioplastics have less environmental impact lack sufficient evidence [9]. It is has become apparent that inferences about environmental impacts of a new product, produced from a new material, cannot be assumed from previous literature or other materials and systems.
The aim of this study was to compare the product life cycle of a functional unit of one plug produced from Novatein and polypropylene. Previous work has only considered the environmental impact of Novatein production and excluded any products or use-phase [18,19]. The results of this work can be used to identify which portions of the product life cycle have the greatest contribution to non-renewable primary energy use (NRPE) and global warming potential (GWP) and highlight the complexity of substituting single use petroleum-based plastics with biopolymers.

2. Methods

2.1. The LCA Methodology

Life cycle assessment (LCA) is a standardized method designed to quantify the potential impacts of products/processes on the environment [20]. By considering the entire process, the impact of material or process choices can be considered. LCAs are commonly presented as either, (1) cradle-to-gate, which includes upstream operations to the point of a product leaving the manufacturer, or (2) cradle-to-grave, which includes use and end-of-life. According to ISO 14040:2006, an LCA is performed in four phases: (1) the goal and scope definition, including defining the functional unit (FU) and system boundaries; (2) input and output data are collected during the inventory analysis phase (LCI); (3) impact assessment (LCIA) uses the gathered data to estimate the environmental importance of specific impacts; and (4) the interpretation phase, where the results are discussed and conclusions and recommendations are formed relative to the goal and scope.
The accuracy of an LCA depends on the detail to which up- and downstream processes are considered, the allocation of impacts from sub-products or processes, and the way the data are converted to quantified impacts. A wide range of impact assessment categories exist; most commonly energy use and greenhouse gas emissions are considered, but land or water use, acidification, eutrophication, and further social or economic indicators should also be considered. A range of international standards exist for LCA, but are not prescriptive to the scope, data quality, assessment method or impact categories selected.

2.2. Goal and Scope

The objective of this study was to compare the non-renewable primary energy use (NRPE) and global warming potential (GWP) of plugs produced from Novatein to that of polypropylene equivalents. Although many other impact categories are part of the ISO standard, these were excluded from the current study because data were not available for Novatein production and the frequency with which those forementioned categories have been used in other bio-polymer studies [17]. The importance of the other categories cannot be underestimated and should be considered in future studies.
The studied system covered the full cradle-to-grave scenario for plugs. The system boundaries for the current study are shown in Figure 1. The life cycle was grouped into three main stages: production of blood, Novatein production, and plug production, use, and disposal. For the current study, LCI data were obtained from previous work that described the cradle-to-gate LCA for Novatein (represented by the combined boundaries A and B in Figure 1) [18,19]. The current study extends this work to include the production, use, and disposal of plugs made from Novatein, where the system boundary is now the combined system (A–C in Figure 1).

2.2.1. Novatein Production

Blood is a by-product produced during farming and meat processing which is typically transported to another location where it is dried into blood meal. It was assumed that that blood production is independent of the demand for bioplastic production. Therefore, the inputs into this stage, relevant to this assessment, were blood and energy from electricity and natural gas (NG). The outputs were blood meal and emissions to atmosphere. This assumption was compared with alternative allocation scenarios where impacts from upstream inputs and outputs of farming and meat processing were included in a sensitivity analysis.
Novatein is produced by extruding blood meal with additives including sodium dodecyl sulphate, sodium sulfite, triethylene glycol, urea, and water to produce a material suitable for injection molding. The modelled system assumed granulated pellets were packaged and transported in polyethylene bags. Inputs included the ingredients used to produce Novatein, along with the bags used for packaging and electricity required to heat, blend, and extrude. The outputs from resin production included packaged resin and emissions to atmosphere.

2.2.2. Plug Production

Proteins are hydrophilic and considerable water is used as a plasticizer during processing. Novatein is injection molded, but is still soft and flexible after molding and must be partially dried to obtain the physical properties required (the conditioning step in Figure 1). The modelled system assumed that parts were conditioned at 23 °C and 50% relative humidity for seven days, equilibrating to the required moisture content for use before packaging. Conditioned plugs were assumed to be packaged in airtight PE bags inside cardboard boxes then transported back to a meat processing facility. The inputs into this stage included resin, fuel for transport, cardboard boxes, PE bags, and electricity. The outputs included packaged plugs, PE bags, and emissions to atmosphere.

2.2.3. Use and End-of-Life

During meat processing, plugs are inserted individually shortly after slaughter (one per sheep). The part is effectively only in use until the carcass is dressed and the intestines and organs are removed; after this point, the plug passes through the rendering process along with the intestines. During the rendering process, plugs made from Novatein will break down, this time with the dried protein becoming part of the meat-and-bone meal stream rather than being reincorporated into blood meal (although the process for making blood meal is identical to meat-and-bone meal). This is the end-of-life (EOL) phase, and it is also the final stage of this LCA. The inputs were packaged plugs, electricity, and natural gas, while outputs included PE bags, cardboard, meat-and-bone meal, and emissions to atmosphere.

2.2.4. Functional Unit

The functional unit was the use of a single plug (7.8 g) for the purpose of preventing fecal matter from escaping a single carcass after slaughter. The system was assumed to require a volume of 2.31 million plugs per year, based on a 10% fraction of sheep processed in New Zealand. The large volume was assumed to reduce errors from capital emissions (such as the base weight of transport trucks), and then scaled to represent the inventory and impact of a single plug. Data for the impacts from Novatein production have been reported based on one kilogram of Novatein produced, which was the functional unit used in those studies [18,19]. These were scaled to the correct FU in the LCI phase of the current work.

2.2.5. Impact Categories

Two impact categories were considered: non-renewable primary energy use (NRPE, measured as MJ) and global warming potential (GWP, measured as kg CO2eq). Although many other impact categories are part of the ISO standard, these were excluded from the current study because data were not available for Novatein production or the frequency with which those forementioned categories have been used in other bio-polymer studies [17], where the primary goal of their development was a reduction in CO2 emissions [21]. The importance of the other categories cannot be underestimated and should be considered in future studies.

2.2.6. Polypropylene Plugs

Although the physical design of the PP plugs is different to that of Novatein, their life cycles are similar, excluding the polymer production phase (A and B in Figure 1). PP plugs do not require polyethylene bags for packaging, but are packaged into cardboard boxes, and it was assumed the same number would fit into one box. From this point, the transport, use, and rendering processes were assumed to be identical, with one exception. PP plugs will not cause direct GHG emissions like the Novatein, as they will not degrade during rendering.

3. Results and Discussion

3.1. Inventory Analysis

Data for blood meal production and Novatein production were taken from a previously published assessment that was only performed on a cradle-to-gate basis [16,17]. The downstream processes to extend this to a full product life cycle were modelled using GaBi6 Education (PE International, now Thinkstep). The life cycle of a PP plug was also modelled in GaBi using a pre-existing database for PP pellets entering an injection molding unit operation.
Figure 2 shows the full process flow diagram including mass and energy flows where the cradle-to-gate portion (blood collection, drying, and Novatein production) has been grouped, as has been presented previously [18,19]. The modelled stage groupings were cradle-to-gate (including both blood meal and resin production), packaging, transport, plug production, and use and end-of-life, and were separated in this fashion to provide more detail on the additional downstream processes extending the previous cradle-to-gate assessment to a full cradle-to-grave system.
Figure 2. Overall process flow diagram used for producing plugs, as used for the LCI. Numbers indicate either mass or energy streams, with their numerical values presented in Table 1.
Sustainability 15 03455 g002
Table 1. Life cycle inventory (LCI); mass and energy flow per 1000 plugs according to Figure 2.
Mass FlowsEnergy Flows
#NameValue#NameValue
(kg/1000 Plugs) MJ/1000 Plugs
1Novatein raw materials *10.142NRPE238
3CO2eg12.95NRPE2.36
4Resin10.078Fuel0.9
5PE bags0.03312Electricity22.3
6CO2eg0.78915Electricity7.3
7Packaged resin10.118PE bags NRPE9.83
9CO2eg0.063 Cardboard NRPE22.6
10Packaged resin10.120Fuel0.81
11Cold water0.000825Electricity2.5
13Plugs9.36 Natural gas17.7
14CO2eg1.42
PE bags to waste0.033
Waste0.187
16Conditioned plugs7.81
17CO2eg0.484
18PE Bags0.136
Cardboard boxes1.06
19Packaged plugs9.01
21Packaged plugs9.01
22CO2eg0.056
23Plugs7.81
24Cardboard waste1.06
PE bags waste0.136
26Wastewater-
27Meat and bone meal7.75
28CO2eg1.12
29CO2eg0.061
* Taken from [11], including water loss.

3.2. Impact Assessment

Mass and energy flows from the inventory analysis were used to calculate aggregated impact results in terms of mega joules of non-renewable primary energy utilized (MJNRPE) and greenhouse gas emissions relative to carbon dioxide over a 100-year period (kg CO2eq). A New Zealand electricity mix was assumed, with the same 58% to 42% split between cumulative energy demand for production from renewable and non-renewable sources used in the earlier cradle-to-gate study [18,19,22,23].

3.3. Novatein Production (Cradle-to-Gate)

Although the cradle-to-gate assessment of Novatein production has been reported previously [18,19], it is the primary feedstock for this product system, and the most important findings have been included here to provide context for its contribution to the life cycle of the overall system. The cradle-to-grave system assumed that low value by-products have no allocation of impacts from upstream processes, and thus blood has no impacts allocated to it until it is collected for drying (base case for the cradle-to-grave LCA). A discussion on the effect of different allocation methods for dividing farming impacts on the production of Novatein has previously been published [18,19]. The effects of alternate allocation scenarios on the overall cradle-to-grave system were considered in the sensitivity analysis for this study.
Blood meal production had four major unit processes that can contribute to GWP and NRPE use; farming, transport of animals, meat processing, and blood drying. Farming had by far the largest amount of GHG emissions associated with it due to methane production in livestock, and the proportion of this attributed to blood meal (rather than other animal products) depends on the allocation scenario chosen.
The allocation scenarios that were investigated included [18]:
  • A simple mass-based allocation on fractions of a live animal.
  • An alternative mass-based allocation considered blood meal as a fraction of other animal products, which excluded wastes and losses (e.g., paunch, manure, and losses during slaughtering).
  • An economic allocation based on the price of blood meal as a fraction of the price of a carcass.
  • A mass-based allocation considering blood as a waste product, with no impacts upstream of blood collection attributed to it, but still including the energy used for blood drying to produce blood meal.
Figure 3 shows the contributions from different processes associated with the production of Novatein, under these different allocation assumptions. The production of other additives required to produce Novatein contributed 8.89 MJNRPE/kg Novatein and 0.4 kg CO2eq/kg Novatein. Additionally, compounding additives with blood meal required to produce Novatein contributed 1.16 MJNRPE/kg Novatein and 0.084 CO2eq/kg Novatein [19].
It was concluded that blood meal production had much higher impacts than the rest of the cradle-to-gate system when the simple mass-based allocation was considered. However, for all the other cases, blood drying had the largest impact. Because of the large impact of blood production and drying, assumptions about impacts that were significant when looking solely at the processing of received blood meal had little effect in the overall cradle-to-gate. The final conclusion drawn was that Novatein production is justified if viewed from the point of turning waste into a product [19], under the assumption that meat production will continue regardless of what blood meal is used for.

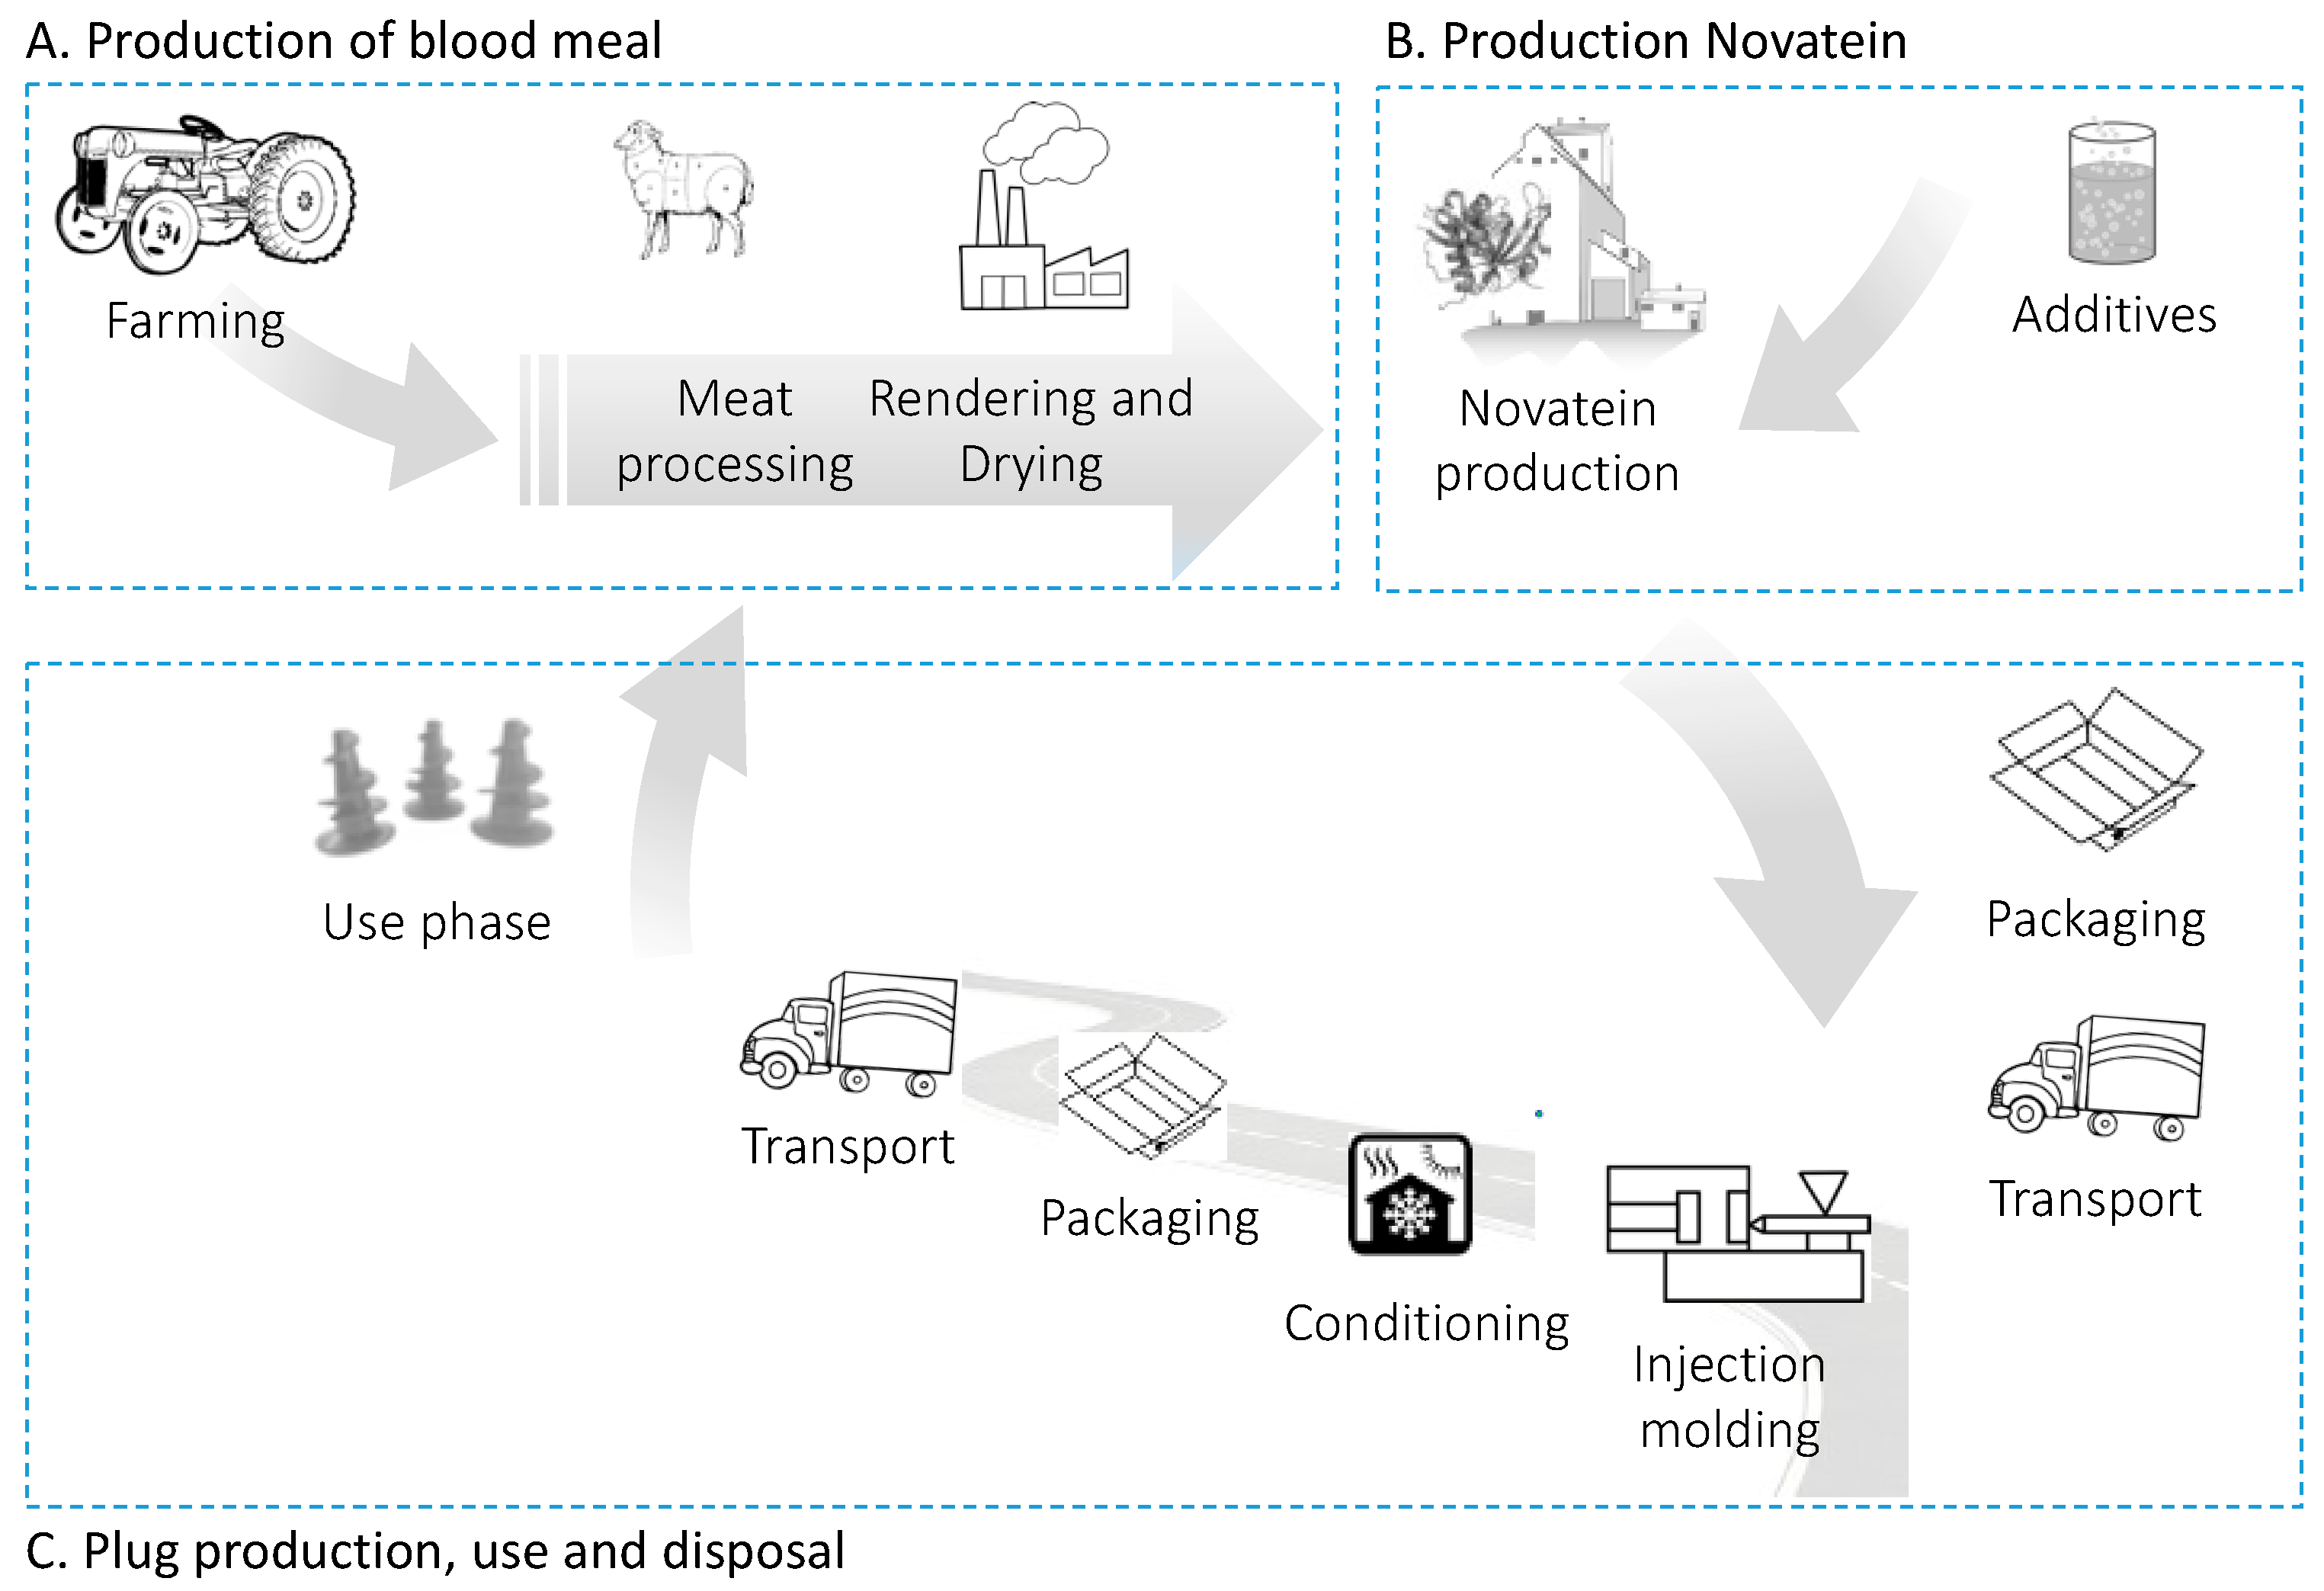
3.4. Plug Production, Use, and Disposal (Cradle-to-Grave)

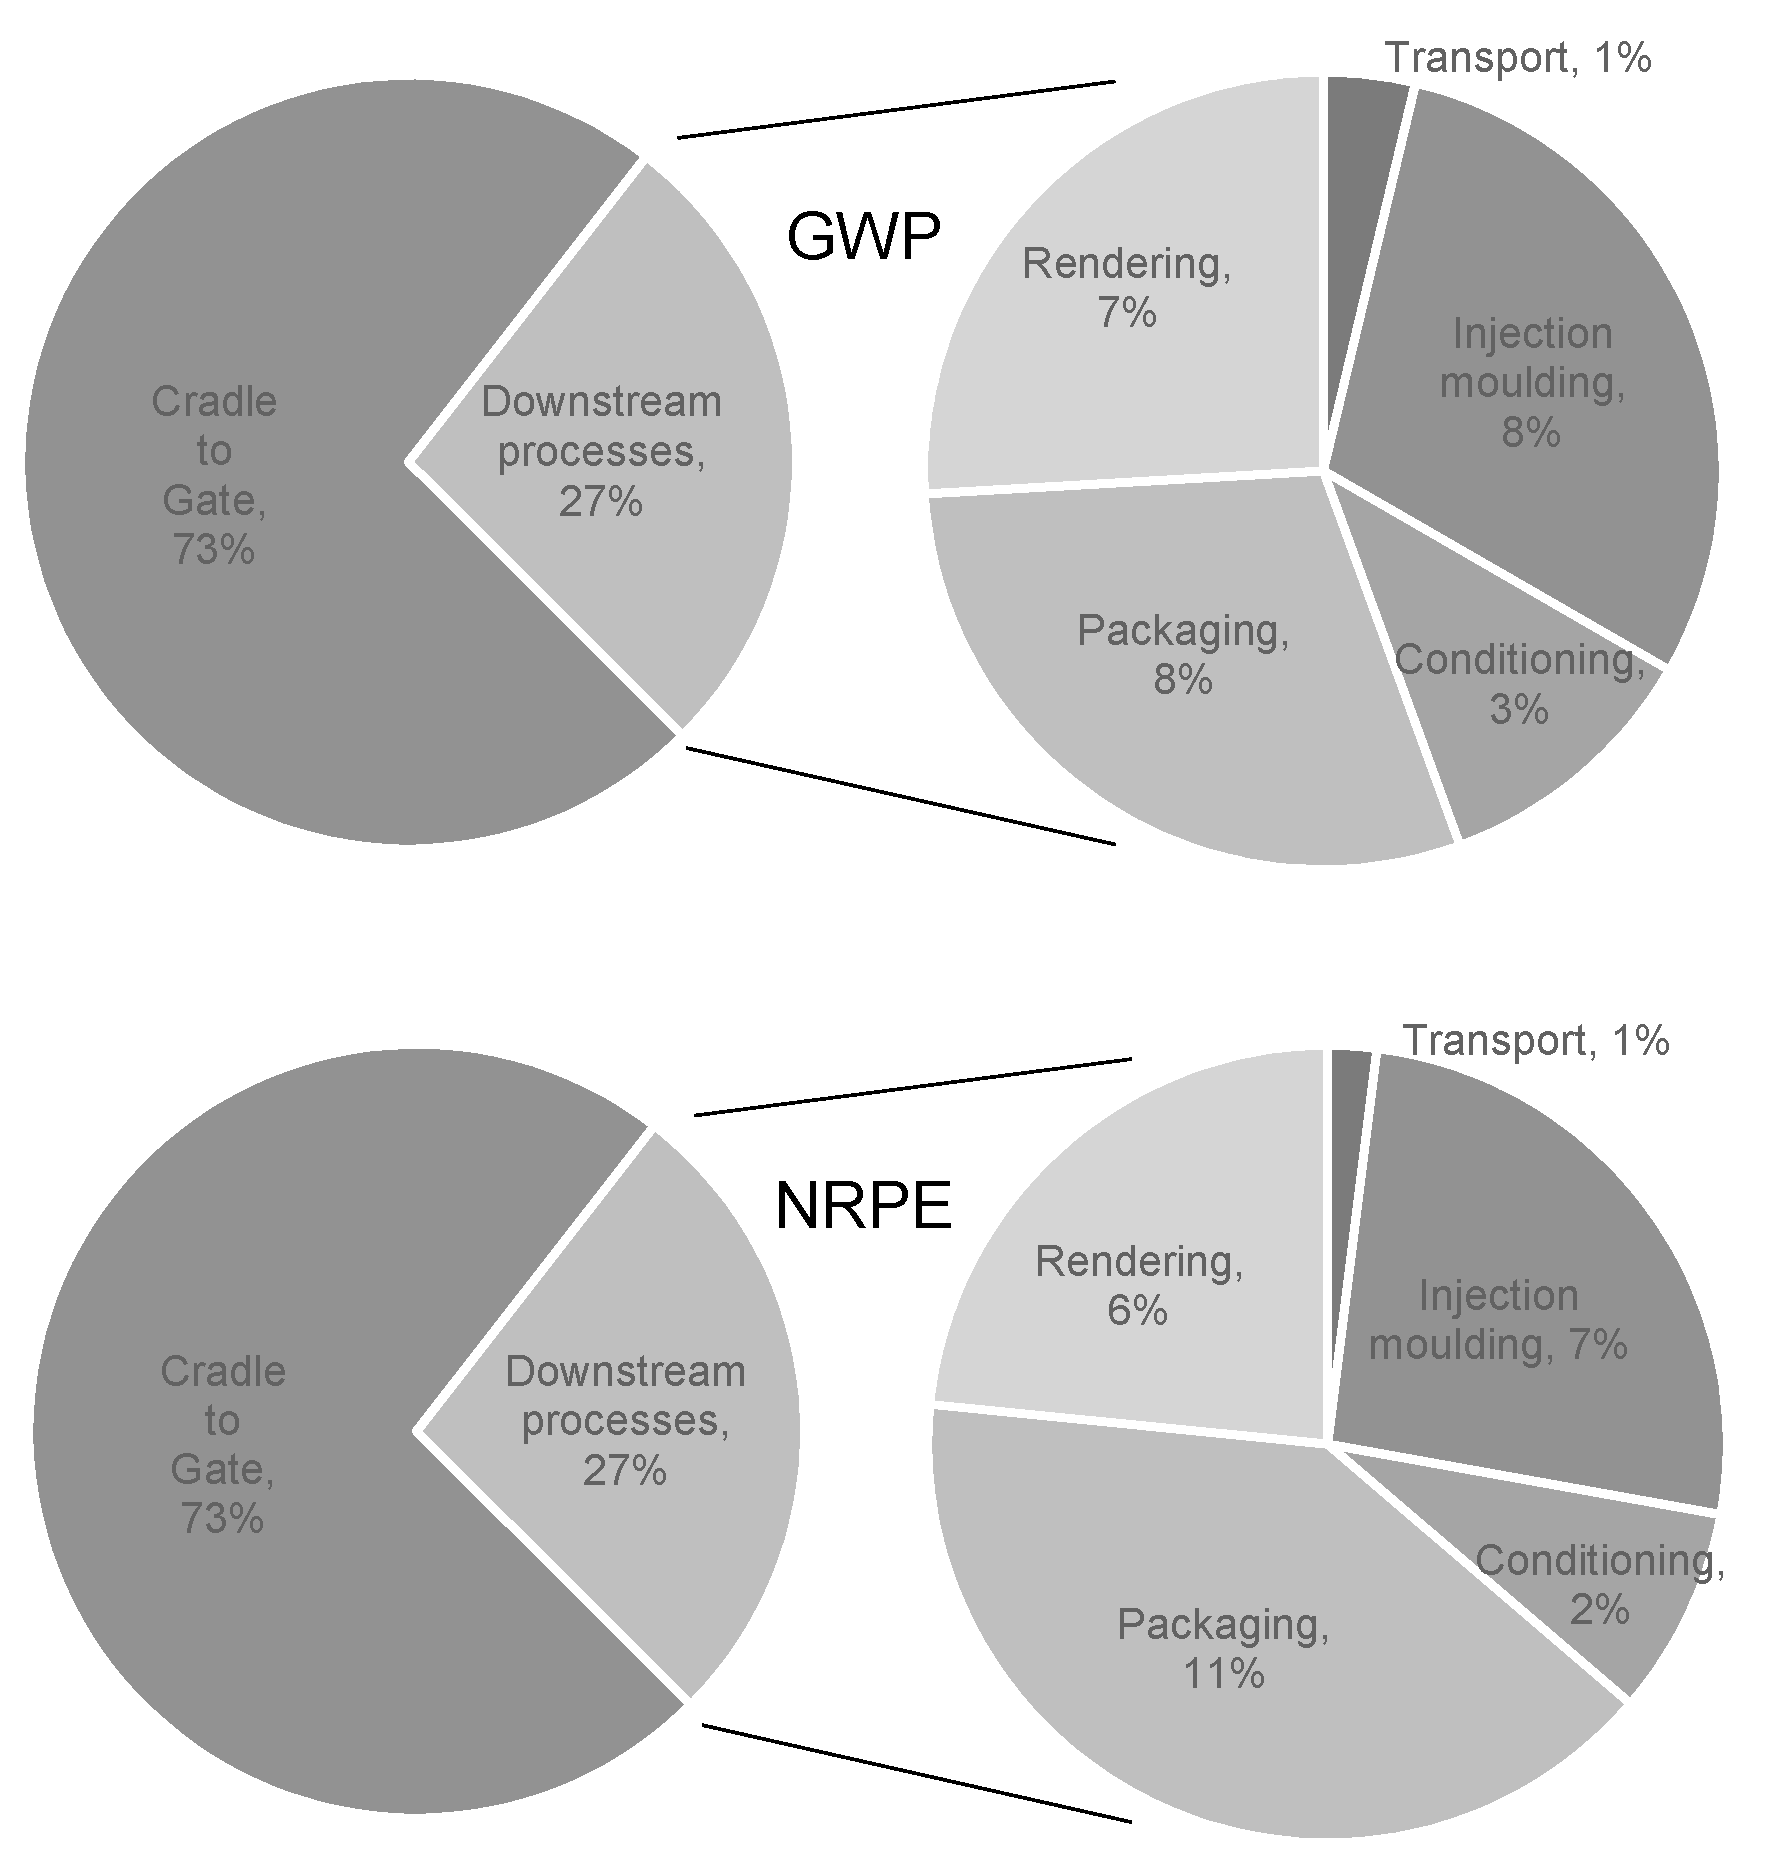
When the entire product life cycle was assessed, it was found that none of the downstream processes were as significant as the cradle-to-gate portion (Figure 4). The sum of all stages within the downstream processes emitted only 27% of the total NRPE and GWP of the full system. Within the downstream processes, injection molding and packaging showed the largest contributions to GWP impact, each comprising 31% of the total downstream impact, but only 8% of the full cradle-to-grave system (Figure 4). The next highest impact was rendering, with conditioning and transport having the lowest impacts. Actual plug insertion and the short use-phase during carcass dressing were assumed to have a negligible impact in either category; they were therefore not included in the results.
Downstream from resin production, packaging used the next greatest amount of non-renewable primary energy (Figure 4). However, this was still only about 15% of the NRPE used for the cradle-to-gate production of resin. Although injection molding is perceived as energy intensive, it required less NRPE than packaging. The plastic pellets are packaged in polyethylene bags and plugs are packaged inside cardboard boxes. If a human operator packs the plugs, there will be no additional electrical power required for this step of the operation, therefore PE bags produced 0.4 g CO2eq per plug, and adding the emissions associated with cardboard, the net CO2eq emission per plug for these two factors was 1.48 g CO2eq.
The energy required by resin packaging is 0.00236 MJ and the combined energy requirements of the polyethylene film and cardboard was 0.0324 MJ; this provided a total NRPE input of 0.0348 MJ per plug. Packaging produced 31% of the gate-to-grave’s emissions and utilized 40% of the NRPE. Due to the packaging’s high emissions, whilst also having the highest NRPE use of any operation in the gate-to-grave section of the study, packing was included in the sensitivity analysis.
The impacts from transport were solely from the production and combustion of diesel fuel. It was assumed the trucks will operate efficiently, by organizing cargo loads to avoid empty trips (a 0.85 utilization factor was chosen for modeling purposes). The distance travelled is relatively small, and thus by combining the distance travelled with the high utilization factor, the impact from transportation was low. Resin and plug transportation required a total of 0.00171 MJ of NRPE per plug, while the GWP was estimated to be 1.19 × 10⁻⁴ kg CO2eq per plug. This equated to only 0.53% of the NRPE use and 0.68% of the GWP of the entire cradle-to-grave LCA.
Although transport has a low impact, it could also vary significantly. There are several factors that can contribute to increased impact. By decreasing non-related cargo (leaving empty space in the truck), the impact from transport can be doubled. Similarly, the utilization factor could be as low as 0.5 (instead of 0.85 assumed here). This would increase the impact by 70%. In addition, the transportation distance could increase greatly if the plugs were to be produced at different locations.
Injection molding required 2.23 MJ of electrical energy to produce 1 kg of injection molded product, a delivered energy requirement of 0.0224 MJ per plug. However, the production of each plug required a runner that had a weight equal to the plug itself. Half the energy was used during production of the runners and sprue, and half was used to produce the plug. Unfortunately, it is not possible to produce the plugs without the additional material required for the runners. Since the runners will be reground for reuse, all energy used during the process was attributed to the plug. The NRPE demand of each plug was 0.0223 MJ/plug, while the GWP was estimated at 1.48 g CO2eq/plug.
The generic injection molding model is based on commodity plastics such as PE. PE tends to have a melting point between 190–240 °C when injection molding, while Novatein is molded between 120–140 °C. From this, it can be assumed that the energy required for Novatein production was overestimated. However, it is unlikely that the delivered energy required to produce Novatein would be twice as high. Novatein requires a longer cycle time than most common polymers (40 s compared to 10 s for the PP plug), in other words, it is heated for longer.
Conditioning (Figure 4) plays an important role in the production process. For the plugs to function correctly, they must be conditioned for a week at 23 °C and 50% relative humidity, decreasing the total moisture content to 8.4 wt%. It was assumed that the humidifier is constantly running at full capacity, using the maximum amount of electricity to function, resulting in 0.00730 MJ NRPE and 0.5 g CO2eq/plug CO2eq per plug. Conditioning was considered a minor impact, although if eliminated, it may simplify the production process substantially.
During use, packaging is removed as discarded. The emissions from the cardboard and PE film have been considered during the packaging phase, so no impacts from packaging are allocated to this phase. After the intestines are removed during dressing, the plugs are entered into the rendering system along with the entrails. The rendering process utilizes energy from the electrical grid and natural gas (burned to turn water into steam). The impact from disposal via rendering was estimated to be 0.02 MJ and 1.2 g CO2eq per plug. Rendering contributed 25% and 23% to GWP and NRPE (Figure 4). This means that the rendering operating was the third highest contributor and had a significant effect on the LCA. This highlights some of the unforeseen drawback of bioplastics, even if their apparent benefits seem obvious.
Only NRPE has been reported, not any renewable components of energy production. A significant portion of New Zealand’s electricity is obtained from renewable hydro-electric sources. If alternative assumptions about energy are made, for example 100% coal or gas-fired electricity production, calculated impacts for both NRPE and GWP would be higher. As most of the impacts for injection molding come from electricity usage, this would be the unit process most greatly affected by such assumptions, and was included in the sensitivity analysis.
It should also be mentioned that the properties of Novatein can be varied by adjusting the formulation. A reduced moisture Novatein formula could reduce or eliminate the need for the conditioning step, having the desired mechanical properties to function with the as molded moisture content. However, such formulation tweaks may require a larger amount of blood meal per kg extruded resin, and hence, while reducing impacts from conditioning, may increase impacts from resin production per plug.

3.5. Comparison to Polypropylne

Compared to PP plugs, Novatein resulted in 40% more CO2eq, but required only 70.2% of the NRPE. This discrepancy between the two impact categories comes partly due to approximately two thirds of the PP plug’s non-renewable energy use accounting for the fossil fuels used as feed stock, rather than for energy (electricity). It is interesting to note that this biopolymer resulted in higher GWP potential. It is often assumed that anything bio-based must inherently have a lower GWP, however extensive up and downstream processing is often required for bio-based materials, which drastically alters the situation.
In the modelled LCA, Novatein plugs had greater GWG emissions compared to PP, which highlights the implicit deficiency of an attributional LCA, already shown in the cradle-to-gate study of Novatein. Novatein is produced from an existing agricultural by-product, and it could be argued that no emissions should be attributed to the raw material (blood meal only). Including different allocation scenarios in a sensitivity analysis has shown considerable variance and was further explored in the current cradle-to-grave study.
Petrochemical plastics such as PP do offer advantages in terms of good mechanical properties for their weight and ease of processing, which enable efficient processing into a lightweight part. The biggest advantage of the Novatein plug, however, is the fact that it breaks down during rendering to become a non-toxic part of meat-and-bone meal, which is often used in pet food. When PP plugs go through rendering, they consume energy, but do not break down, and become pollutants in the meat-and-bone meal. This increases the toxicity of the meal, reducing the number of applications for this product. Although this factor does not directly come across in this LCA, it could be investigated further if the goal and scope of this study were broadened to include human or animal toxicity.

3.6. Sensitivity Analysis

The largest variances in this study were the allocation methods of farming impacts, how electricity is generated and distributed, and using cardboard boxes for packaging and formed the basis of the sensitivity analysis. Four different cases were considered and compared to PP and the base case (assuming blood is a waste product, but attributing the impact of drying):
  • Simple mass-based allocation for Novatein production.
  • Economic allocation for Novatein production.
  • Excluding cardboard from packaging.
  • Coal fired electricity.
The allocation methods for Novatein production were included because Novatein production had such an overwhelming impact on the cradle-to-gate impact categories, and it has been shown to be sensitive to allocation methods [18]. Packaging also had a significant impact and was included in the analysis as producers can control their packaging choices. Lastly, electricity production varies significantly around the world and since the current process relies heavily on electricity, comparing the current situation with the worst case, was seen as a useful measure. The results for the sensitivity analysis are summarized in Figure 5.

3.6.1. Allocation Methods for Blood Meal Production

Two allocation methods for farming impacts have been considered for comparison; these were using either a mass or economic allocation method, as well as treating blood as a low value by-product, which is therefore considered to have no impacts prior to blood drying. By allocating some impacts from farming to blood meal, the results from the cradle-to-gate do change quite significantly; therefore, the selected allocation method must be justified.
If blood production were to have impacts allocated from farming on a simple mass basis, where allocation is based on blood being a fraction of the live animal weight, it greatly increases the GWP and NRPE. The impact from Novatein production increased from 1.28 to 14.97 CO2eq/kg Novatein, and NRPE use increased from 23.73 to 47.98 MJ/kg Novatein [1]. However, a more suitable method is to apply mass-based allocation where waste and losses are excluded and blood is allocated as a fraction of all animal products, bringing the total impact to 3.76 CO2eq/kg Novatein, and results in NRPE consumption dropping to 28.11 MJ/kg Novatein produced. These data represent the impacts of blood production, blood drying, and resin production. When implementing this advanced mass-based allocation, not only did the NRPE use increase by 18.5% for resin production, but the CO2eq emissions increased by 193.0%. When these results were compared to the entire cradle-to-grave analyses, the total impact per plug increased to 0.0425 kg CO2eq/plug, a 141% increase for a single plug. The NRPE increase was then 13.6% over the initial case.
If blood production were to have impacts allocated to it from the farming process on an economic basis, it would also increase the CO2eq emissions and energy attributed to Novatein. The impact from Novatein production in the cradle-to-gate phase increased from 1.28 to 2.18 CO2eq/kg Novatein, and NRPE use increased from 23.73 to 25.27 MJ/kg Novatein resin produced [19]. NRPE use increased by 6.49% per plug, but again there was a large increase in the CO2eq emissions at 32.6% over the cradle-to-gate. When these results are compared to the entire cradle-to-grave analyses, the total impact per plug increased to 0.0218 kg CO2eq, a 23.8% increase for a single plug. The total NRPE increase was then 4.93% over the initial case.
None of the allocation scenarios examined change the technological scope of the system, or the total emissions and energy use of the NZ sheep and beef sector. Rather, they are different ways of attributing existing impacts between existing co-product streams.

3.6.2. Removing Cardboard

One of the unit operations that can be drastically altered in this LCA is the packaging phase, which would lead to a decrease in both CO2eq emissions and energy use. Packaging required the highest amount of energy in the gate-to-grave phase (Figure 4) and emitted the same amount of CO2eq emissions as injection molding (Figure 4). Therefore, a plausible way to decrease the impact of the plug’s life cycle is to remove unnecessary packaging.
Another possibility is to further reduce the impacts by maximizing the number of plugs in each bag before moisture sorption becomes a problem after the bags are opened. This means considering how long the plugs can be exposed to humid conditions before the moisture content will affect the physical properties too much, and then sizing the packaging so that the plugs are used before the plugs lose their effectiveness. This results in a reduction of the total amount of PE film that is required. However, for the purpose of this sensitivity, the plastic bags were kept the same size, and only the elimination of cardboard was inspected.
CO2eq emissions from cardboard boxes equated to 22.6% of the gate-to-grave, and 6.07% of the entire LCA. The NRPE used by the cardboard packaging equated to 26.1% of the gate-to-grave and 6.95% of the total LCA. By removing the use of cardboard packaging all together, not only did the NRPE use and CO2eq emissions decrease, but the impact from transport decreased as well. Although transport had a negligible emission of 0.68% CO2eq of the entire LCA, and only utilized 0.53% of the NRPE, if the locations of the resin and production plants changed drastically, removing cardboard could well help to decrease transport impacts significantly.

3.6.3. Coal-Based Electricity

It is useful to consider the data for delivered energy (Table 2) in case the study needs to be adapted for different regions or countries that produce their electricity in different ways. For resin production, one of the sensitivity cases investigated was using 100% coal-based electricity to produce Novatein. For the delivered energy to be converted to cumulative energy demand (CED) for New Zealand electricity, it must be multiplied by a factor of 2.36, of which, 42.8% of the CED is non-renewable. On top of this, the CO2eq emissions for the grid mix come to just 0.02797 kg CO2eq/MJ CED. However, for coal-based electricity, the conversion is 2.77, and 100% is non-renewable. Additionally, the CO2eq emission for coal-based electricity is 0.09788 CO2eq/MJ CED. In other words, not only is the CED higher for coal-based electricity, but 100% of the CED is non-renewable, and the impact per MJ is also much higher.
For this sensitivity analysis, it was assumed that transport and packaging production are outside of the control of our system and would remain at their original values. However, resin production, injection molding, conditioning, and rendering were calculated using the NZ grid mix, and therefore their impacts would be altered by assumptions about electricity generation.
The most striking observation was that injection molding now has a larger NRPE use and GWP than the rest of the operations in the gate-to-grave (Figure 6). Similarly, the conditioning chamber had a GWP increase of 178% and an NRPE use increase of 311%. This can be expected, as both operations had NRPE and GWP impacts based purely on electricity consumption (Table 2); therefore, it makes sense that their values should increase by the exact the same ratio.
The resin production and rendering processes both included the use of natural gas for blood drying and to process the plugs at the end of their lives. The cradle-to-gate had an NRPE use increase of only 20.6%, with GWP increasing by just 39.5%. The rendering process had an NRPE increase of 22.3%, with GWP increasing by 38.9%. They did not show the same increase, as rendering was a unit operation on its own, and resin production included several process steps which do not utilize natural gas. As this sensitivity case only affected electrical energy supply, this is expected. Additionally, both processes had emissions that do not stem from energy use but are related to vapor mass streams that are released into the atmosphere.

4. Conclusions

From this study, two important conclusions can be drawn: firstly, a bio-based material does not necessarily present an overall reduced environmental impact compared to petrochemical equivalents. It was found that the production of Novatein plugs used less NRPE but contributed more to GWP than the existing polypropylene equivalent. Secondly, results can easily be skewed based on allocation methods used for impacts from upstream processes, especially considering waste products.
Within the overall product life cycle of Novatein plugs, the production of resin had the greatest impact by far, with downstream manufacturing, use, and disposal having a much smaller contribution. GWP was more variable across the considered sensitivity scenarios compared to NRPE. This is mainly because allocation methods do not incur such a large increase in the overall NRPE consumption, however, GWP can change quite significantly with just a minor change to allocation, process alteration, or energy generation methods.
Although some suggestions can be made regarding reducing GWP and NRPE use based on the sensitivity analysis, these changes are still minor compared to possible changes based on the allocation methods. However, the main feedstock for Novatein is blood meal, which is a low value by-product of the meat industry, therefore it does not directly require the extraction of large amounts of raw material from the ground. Blood meal is collected from an existing industry, as such, it is only burdened with GWP and NRPE use due to the allocation methods implicit with LCA; however, the energy use to transform blood meal into Novatein still contributes to emissions.
Lastly, not considered as part of the LCA is the benefit that Novatein plugs can be rendered, therefore not contaminating downstream products. It would therefore be important to consider other impacts of categories such as animal toxicity and abiotic depletion of resources for a more comprehensive comparison.

Author Contributions

Conceptualization, C.J.R.V. and J.M.B.; Methodology, D.W.V.d.M.; Software, D.W.V.d.M.; Validation, C.J.R.V., D.W.V.d.M. and J.M.B.; Formal analysis, D.W.V.d.M.; Resources, C.J.R.V.; Writing—original draft, C.J.R.V.; Writing—review & editing, C.J.R.V. and J.M.B.; Supervision, C.J.R.V.; Project administration, C.J.R.V. All authors have read and agreed to the published version of the manuscript.

Funding

This research received no external funding.

Conflicts of Interest

The authors declare no conflict of interest.

References

  1. Beef and Lamb New Zealand.Annual Slaughter Statistics, Lamb Slaughter Trend. 2023. Available online: https://beeflambnz.com/data-tools/industry-production-trends (accessed on 1 November 2022).
  2. MAF Food Animal Products Group. Slaughter and Dressing. In Amendment 3: Industry Standard/Industry Agreed Standard 5; 2002. Available online: www.maf.govt.nz (accessed on 1 November 2022).
  3. Sharing Good Practices in Slaughter Hygience. 2023. Available online: http://uecbv.eu/ (accessed on 1 November 2022).
  4. Borch, E.; Nesbakken, T.; Christensen, H. Hazard identification in swine slaughter with respect to foodborne bacteria. Int. J. Food Microbiol. 1996, 30, 9–25. [Google Scholar] [CrossRef] [PubMed]
  5. Purnell, G.; James, C.; Wilkin, C.-A.; James, S.J. An Evaluation of Improvements in Carcass Hygiene through the Use of Anal Plugging of Pig Carcasses Prior to Scalding and Dehairing. J. Food Prot. 2010, 73, 1108–1110. [Google Scholar] [CrossRef] [PubMed]
  6. Verbeek, C.J.R.; Van Den Berg, L.E. Development of Proteinous Bioplastics Using Bloodmeal. J. Polym. Environ. 2011, 19, 1–10. [Google Scholar] [CrossRef]
  7. Verbeek, C.J.R. Closing the Loop, Adding Value. In The Chemical Engineer; The Institution of Chemical Engineers: Rugby, UK, 2015; pp. 34–36. [Google Scholar]
  8. Chen, Y.; Awasthi, A.K.; Wei, F.; Tan, Q.; Li, J. Single-use plastics: Production, usage, disposal, and adverse impacts. Sci. Total Environ. 2021, 752, 141772. [Google Scholar] [CrossRef] [PubMed]
  9. Walker, S.; Rothman, R. Life cycle assessment of bio-based and fossil-based plastic: A review. J. Clean. Prod. 2020, 261, 121158. [Google Scholar] [CrossRef]
  10. RameshKumar, S.; Shaiju, P.; O’Connor, K.E.; Ramesh Babu, P. Bio-based and biodegradable polymers—State-of-the-art, challenges and emerging trends. Curr. Opin. Green Sustain. Chem. 2020, 21, 75–81. [Google Scholar] [CrossRef]
  11. Shen, L.; Worrell, E.; Patel, M.K. Comparing life cycle energy and GHG emissions of bio-based PET, recycled PET, PLA, and man-made cellulosics. Biofuels Bioprod. Biorefin. 2012, 6, 625–639. [Google Scholar] [CrossRef]
  12. Tsiropoulos, I.; Faaij, A.P.C.; Lundquist, L.; Schenker, U.; Briois, J.F.; Patel, M.K. Life cycle impact assessment of bio-based plastics from sugarcane ethanol. J. Clean. Prod. 2015, 90, 114–127. [Google Scholar] [CrossRef]
  13. Papong, S.; Malakul, P.; Trungkavashirakun, R.; Wenunun, P.; Chom-In, T.; Nithitanakul, M.; Sarobol, E. Comparative assessment of the environmental profile of PLA and PET drinking water bottles from a life cycle perspective. J. Clean. Prod. 2014, 65, 539–550. [Google Scholar] [CrossRef]
  14. Hermann, B.G.; Blok, K.; Patel, M.K. Twisting biomaterials around your little finger: Environmental impacts of bio-based wrappings. Int. J. Life Cycle Assess. 2010, 15, 346–358. [Google Scholar] [CrossRef] [Green Version]
  15. Saibuatrong, W.; Cheroennet, N.; Suwanmanee, U. Life cycle assessment focusing on the waste management of conventional and bio-based garbage bags. J. Clean. Prod. 2017, 158, 319–334. [Google Scholar] [CrossRef]
  16. Tabone, M.D.; Cregg, J.J.; Beckman, E.J.; Landis, A.E. Sustainability Metrics: Life Cycle Assessment and Green Design in Polymers. Environ. Sci. Technol. 2010, 44, 8264–8269. [Google Scholar] [CrossRef] [PubMed]
  17. Hottle, T.A.; Bilec, M.M.; Landis, A.E. Sustainability assessments of bio-based polymers. Polym. Degrad. Stab. 2013, 98, 1898–1907. [Google Scholar] [CrossRef]
  18. Bier, J.M.; Verbeek, C.J.R.; Lay, M.C. An eco-profile of thermoplastic protein derived from blood meal Part 1: Allocation issues. Int. J. Life Cycle Assess. 2012, 17, 208–219. [Google Scholar] [CrossRef]
  19. Bier, J.M.; Verbeek, C.J.R.; Lay, M.C. An ecoprofile of thermoplastic protein derived from blood meal Part 2: Thermoplastic processing. Int. J. Life Cycle Assess. 2012, 17, 314–324. [Google Scholar] [CrossRef]
  20. International Organization for Standardization. Environmental Management: Life Cycle Assessment; Principles and Framework. (ISO Standard No. 14040:2006); 2006. Available online: https://www.iso.org/standard/37456.html (accessed on 1 November 2022).
  21. Harding, K.; Dennis, J.; von Blottnitz, H.; Harrison, S. Environmental analysis of plastic production processes: Comparing petroleum-based polypropylene and polyethylene with biologically-based poly-β-hydroxybutyric acid using life cycle analysis. J. Biotechnol. 2007, 130, 57–66. [Google Scholar] [CrossRef] [PubMed]
  22. Ministry of Economic Development. New Zealand Energy Data File 09 2008 Calendar Year Edition. In New Zealand Energy Data File; Dang, H., Ed.; Ministry of Economic Development: Wellington, New Zealand, 2009; p. 168. [Google Scholar]
  23. Barber, A. NZ Fuel and Electricity—Total Primary Energy Use, Carbon Dioxide and GHG Emission Factors. AgriLINK NZ Ltd (The AgriBusiness Group), 2009; p. 9. Available online: http://agrilink.co.nz/ (accessed on 1 November 2022).
Figure 1. System boundaries for the life cycle of plugs made from Novatein. (A) Blood meal production, (B) Novatein production, (C) Plug production, use, and disposal.
Sustainability 15 03455 g001
Figure 3. (a): NRPE and (b): GWP for producing blood meal used in Novatein. Data extracted from [19].
Sustainability 15 03455 g003
Figure 4. GWP and NRPE for Novatein plugs, for a full cradle-to-grave analysis.
Sustainability 15 03455 g004
Figure 5. Sensitivity analysis. (a): GHG, (b): NRPE.
Sustainability 15 03455 g005
Figure 6. Assuming energy production as 100% coal-based. (A): GWP; (B): NRPE.
Sustainability 15 03455 g006
Table 2. Delivered energy for the production of 1000 plugs (MJ).
Delivered Energy (MJ)
ElectricityNatural GasTotal
Injection molding22.4022.4
Conditioning7.3307.33
Rendering2.5315.718.2
Disclaimer/Publisher’s Note: The statements, opinions and data contained in all publications are solely those of the individual author(s) and contributor(s) and not of MDPI and/or the editor(s). MDPI and/or the editor(s) disclaim responsibility for any injury to people or property resulting from any ideas, methods, instructions or products referred to in the content.

