
Analysis of Factors Influencing Mining Damage Based on Engineering Detection and Machine Learning

Abstract
:1. Introduction
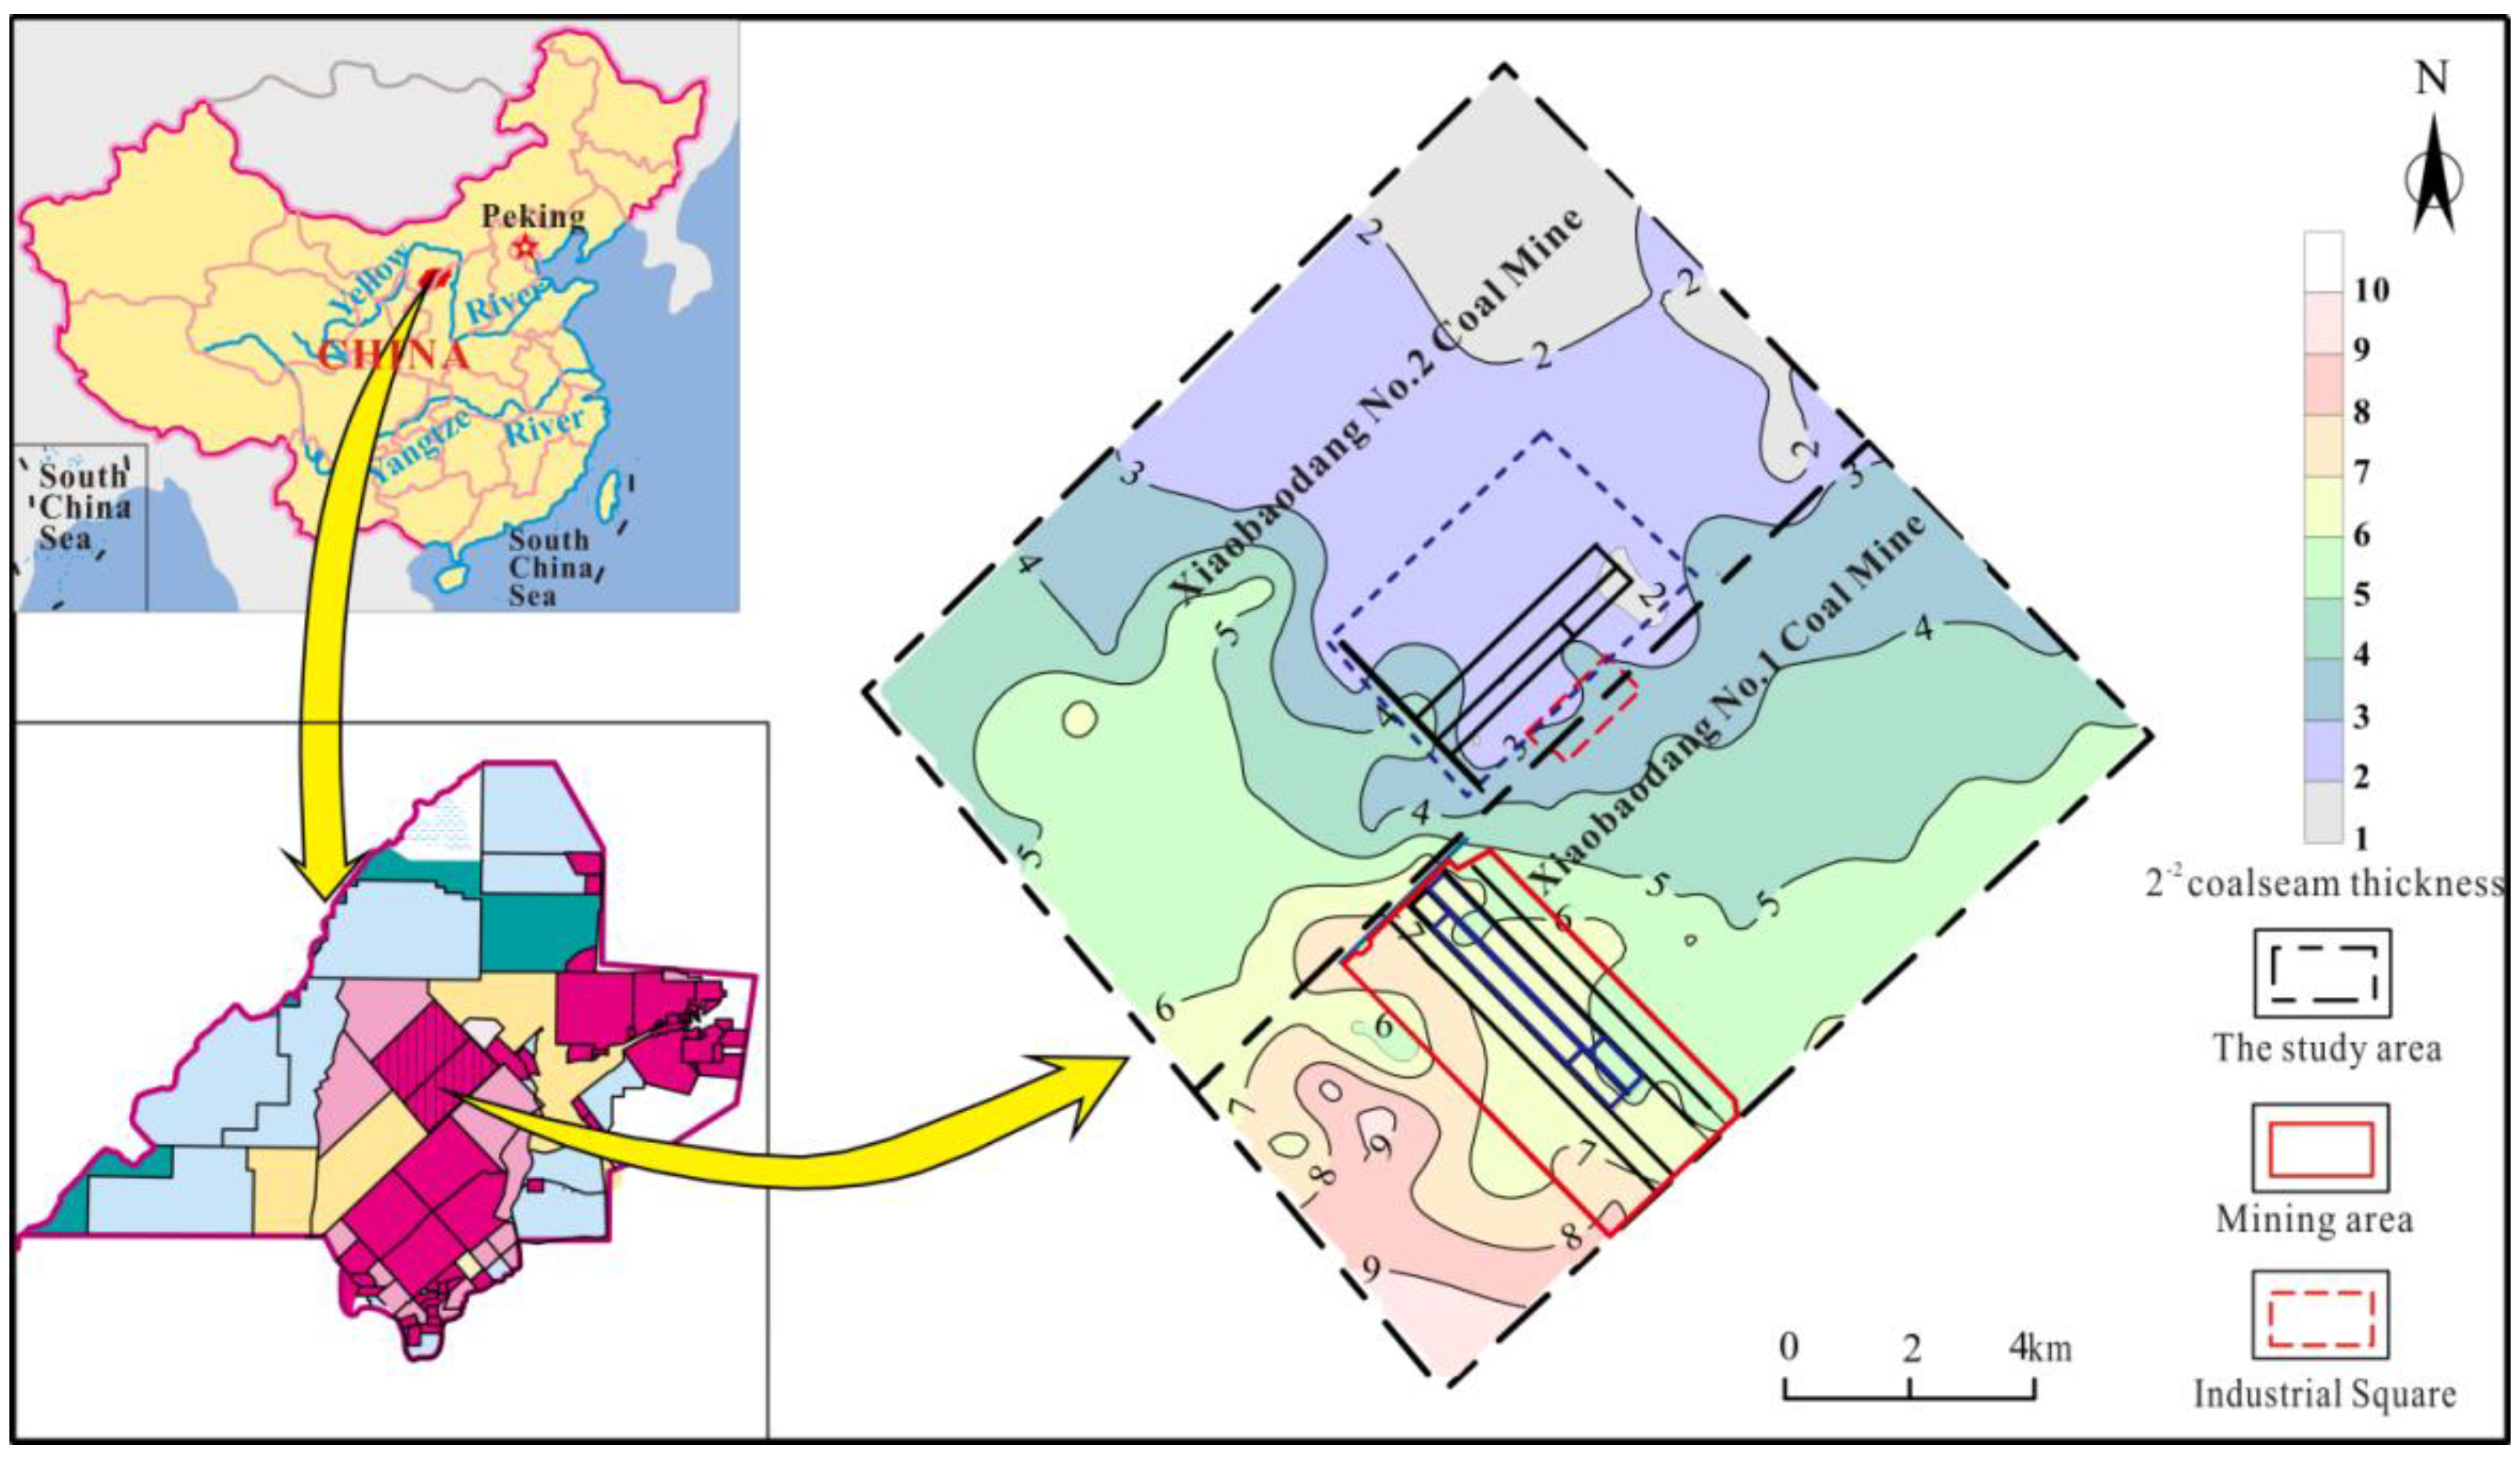
2. Study Area
3. Methods
3.1. Detection Method of FZH
- (1)
- The Loss of Drilling Fluid Method
- (2)
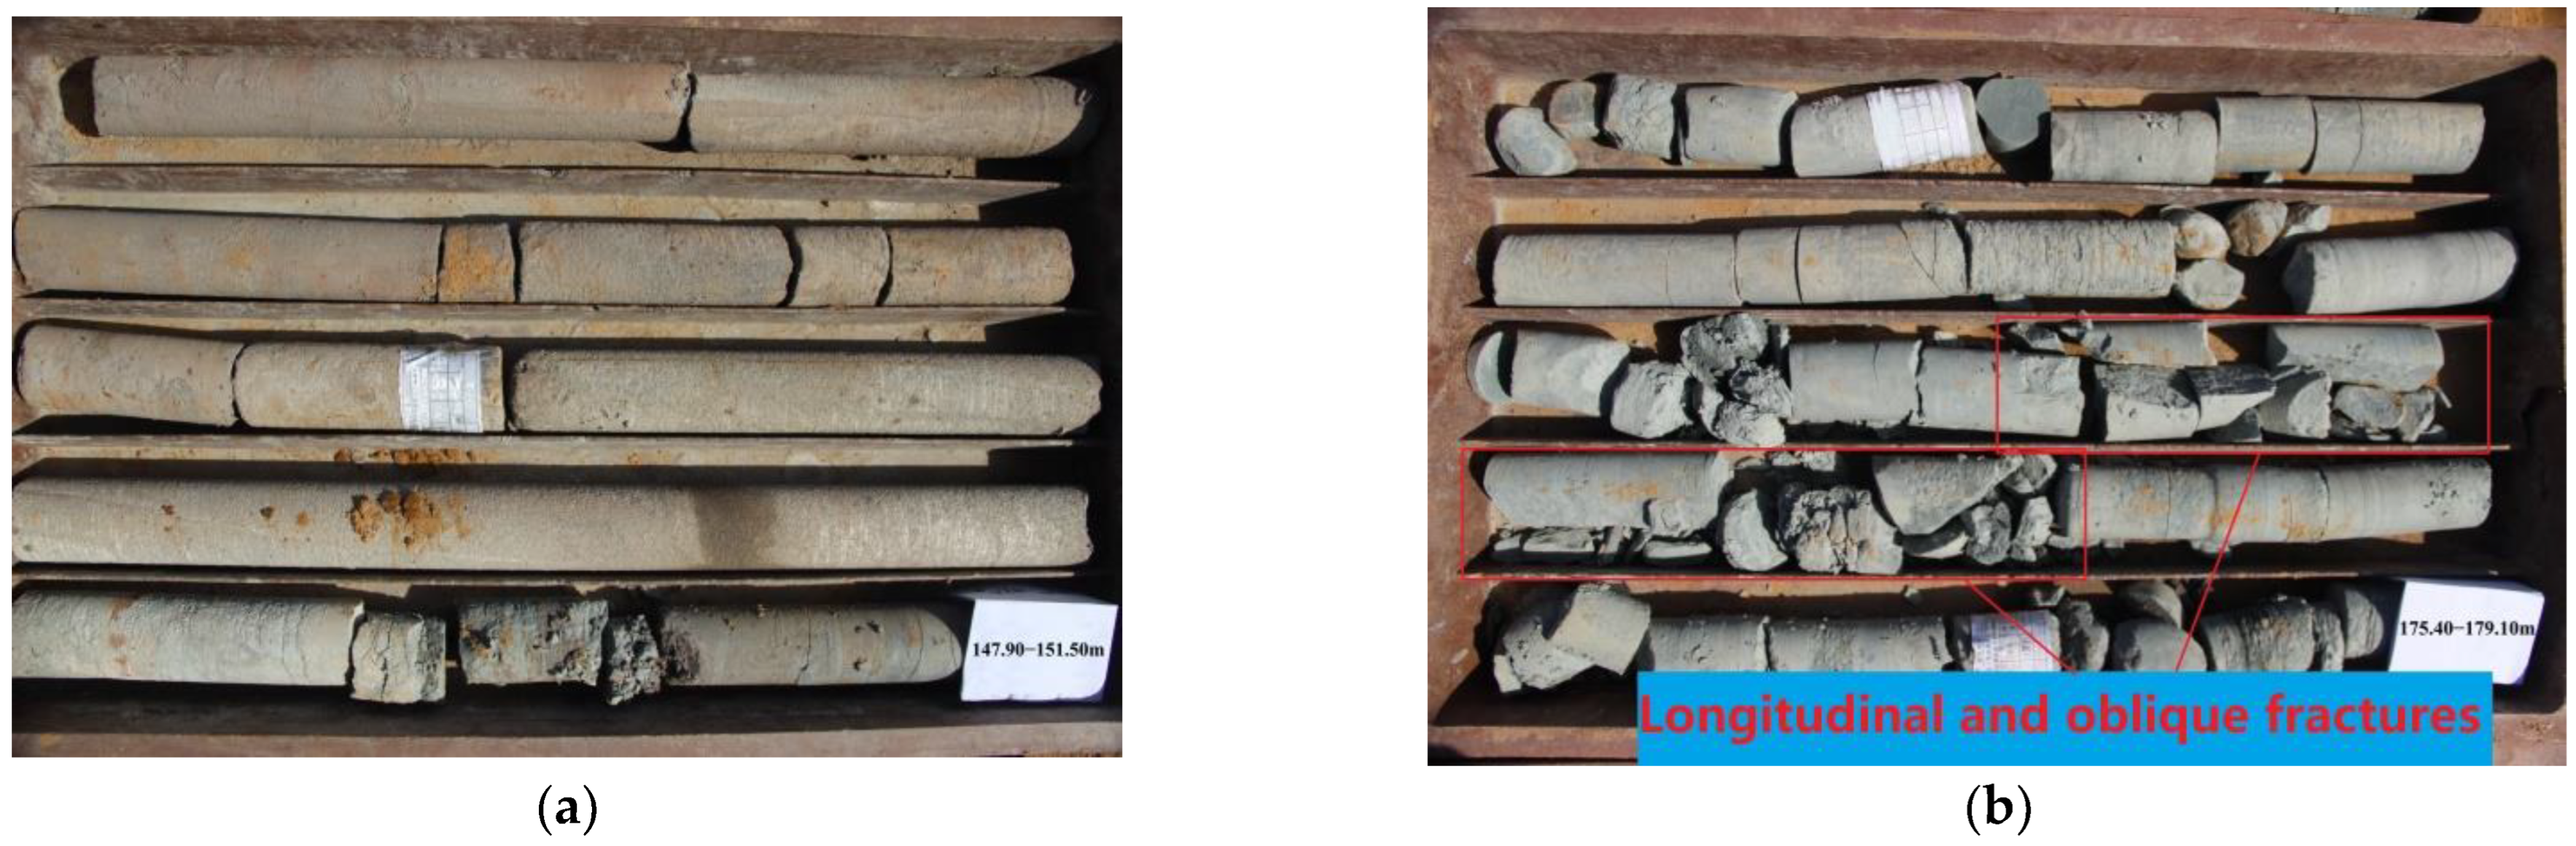
- Core Engineering Geology Catalogue
- (3)
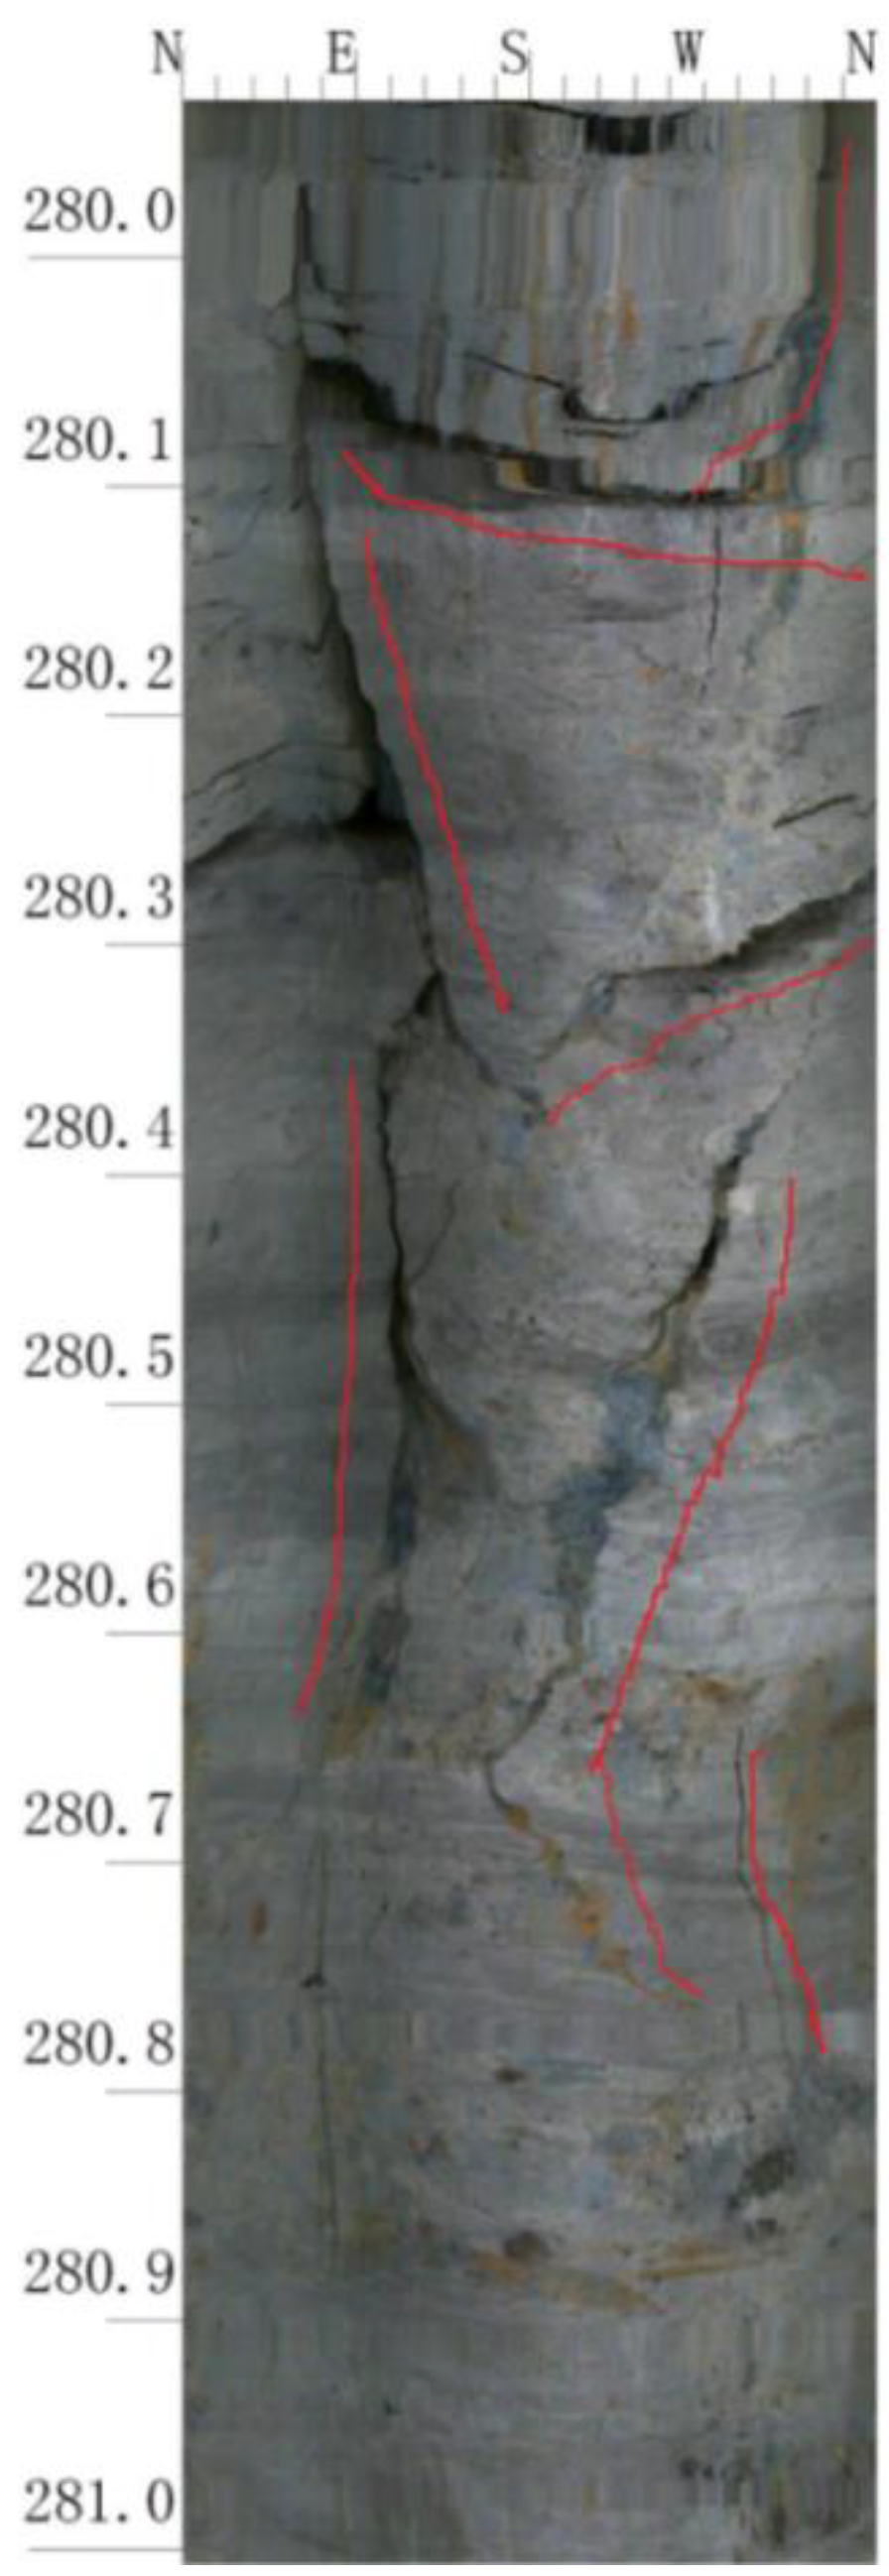
- Image Logging
- (4)
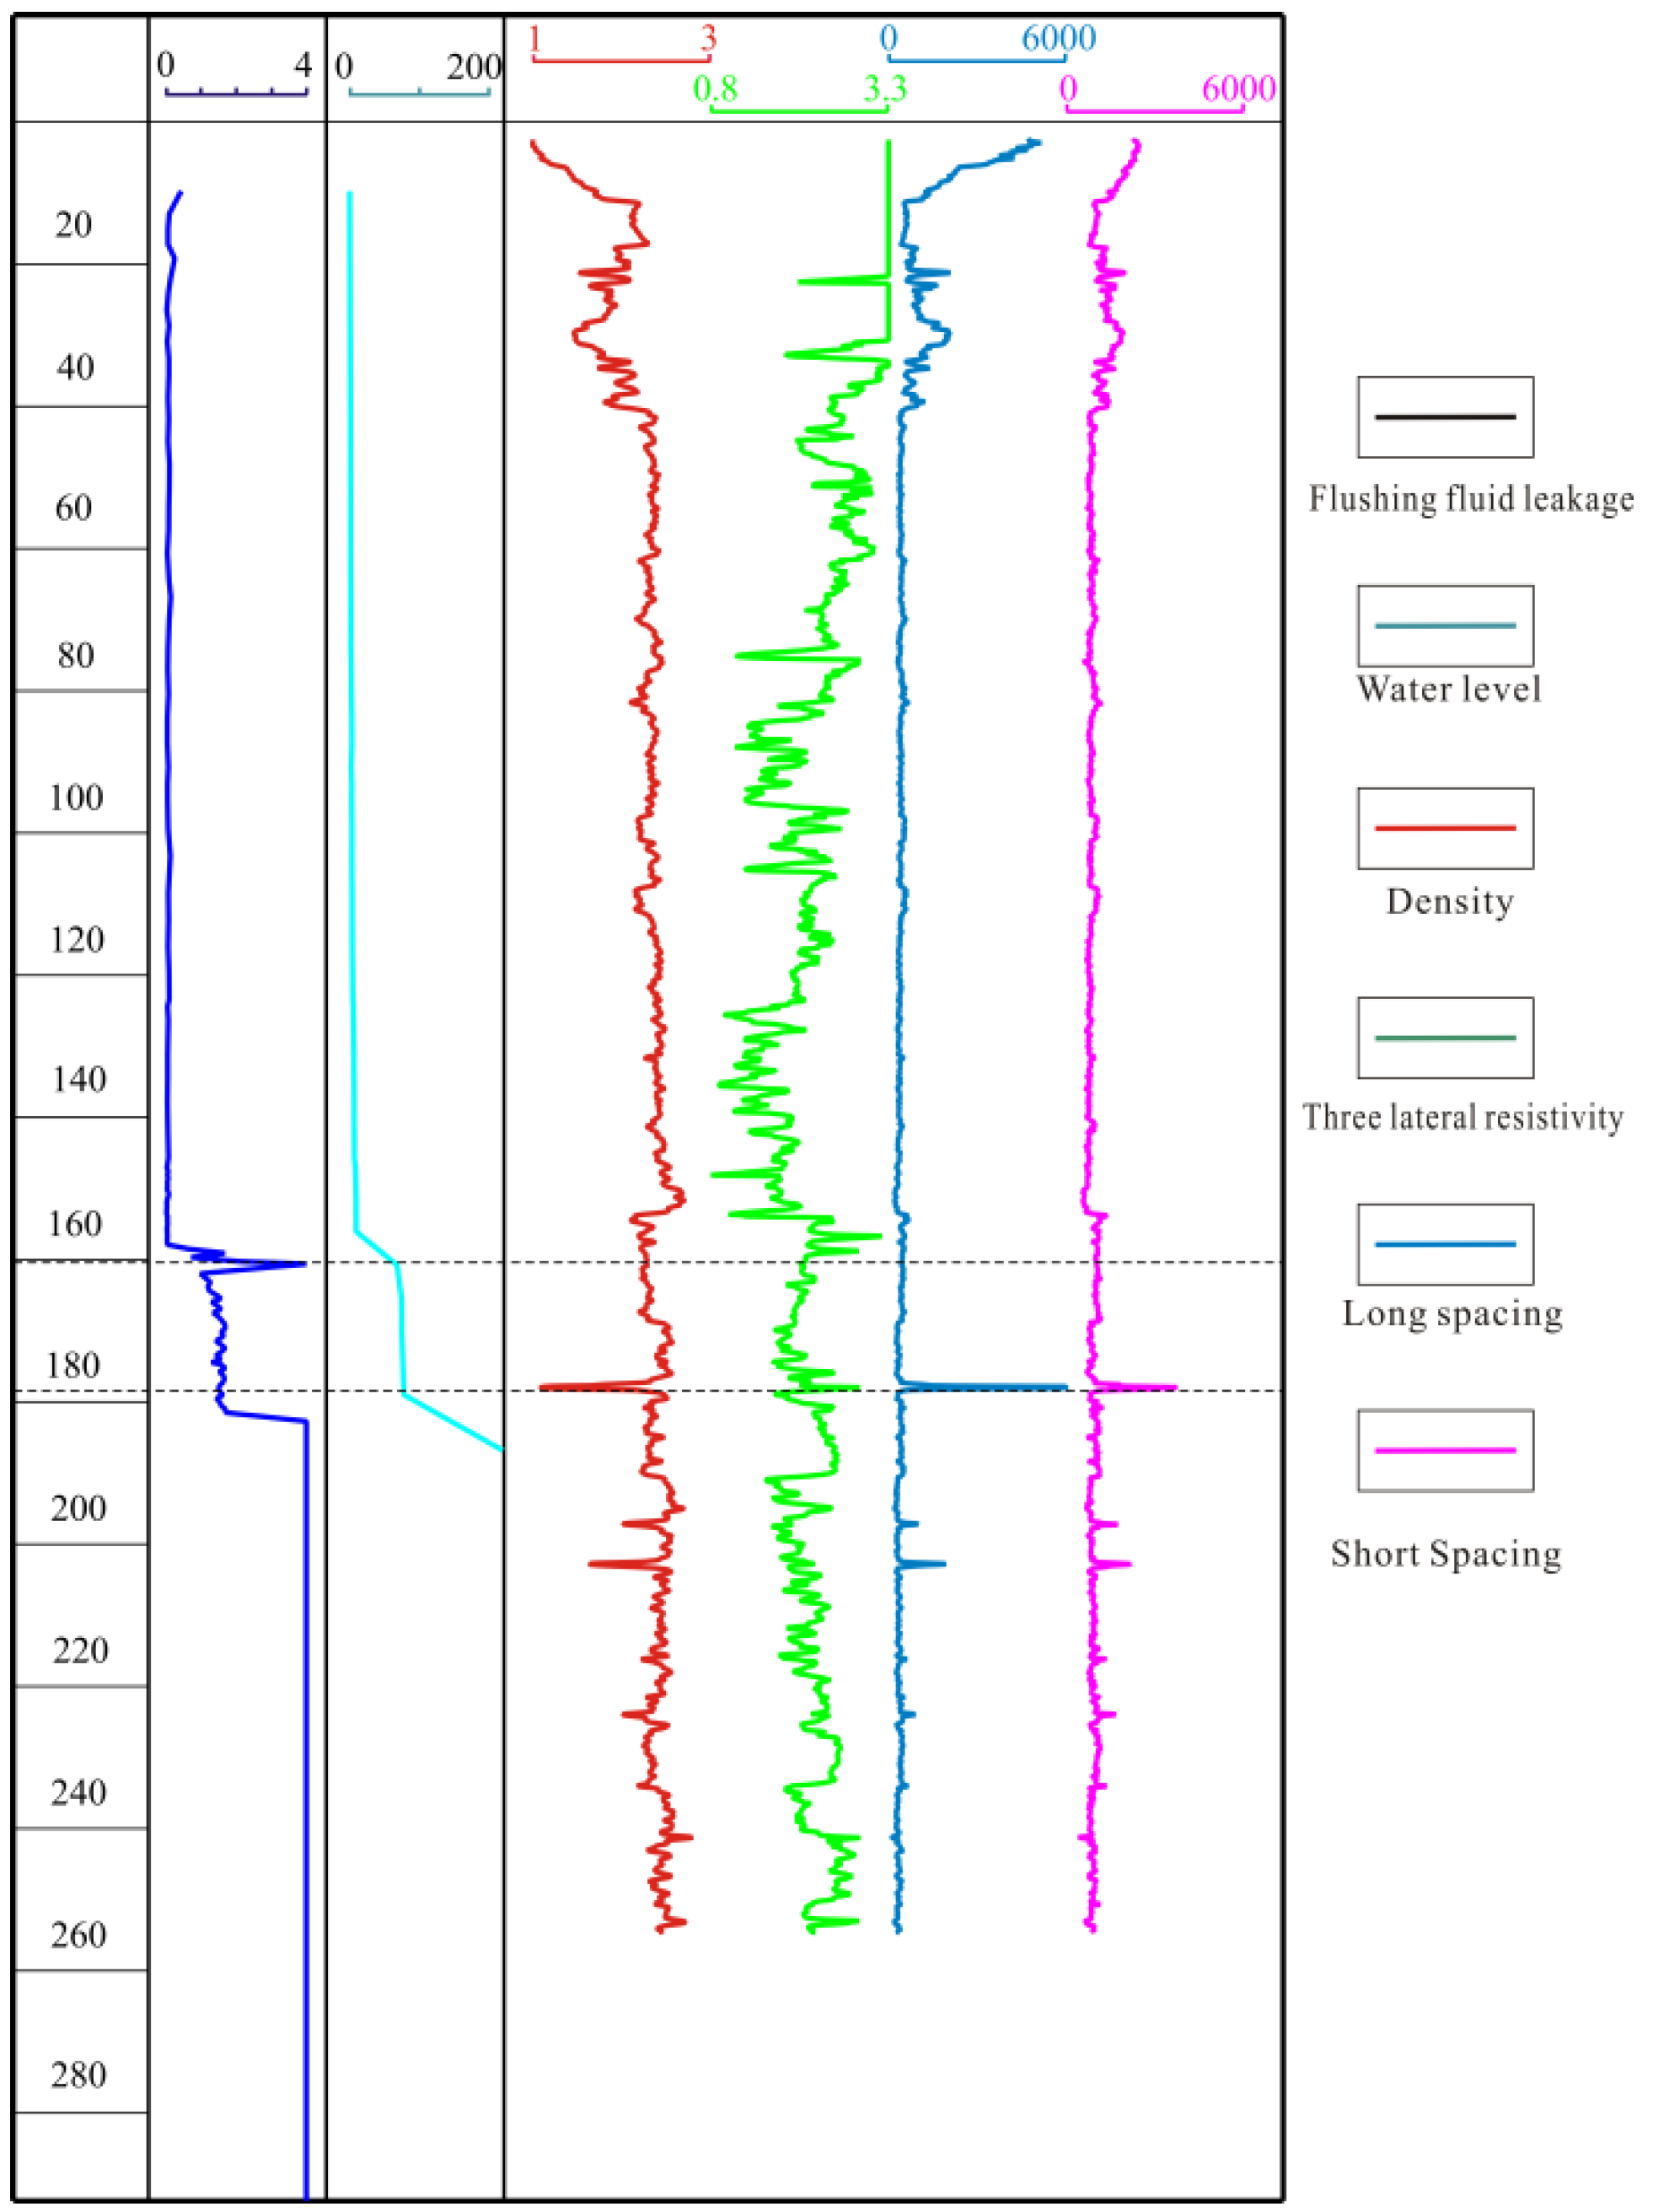
- Geophysical Logging
3.2. Surface Settlement Monitoring
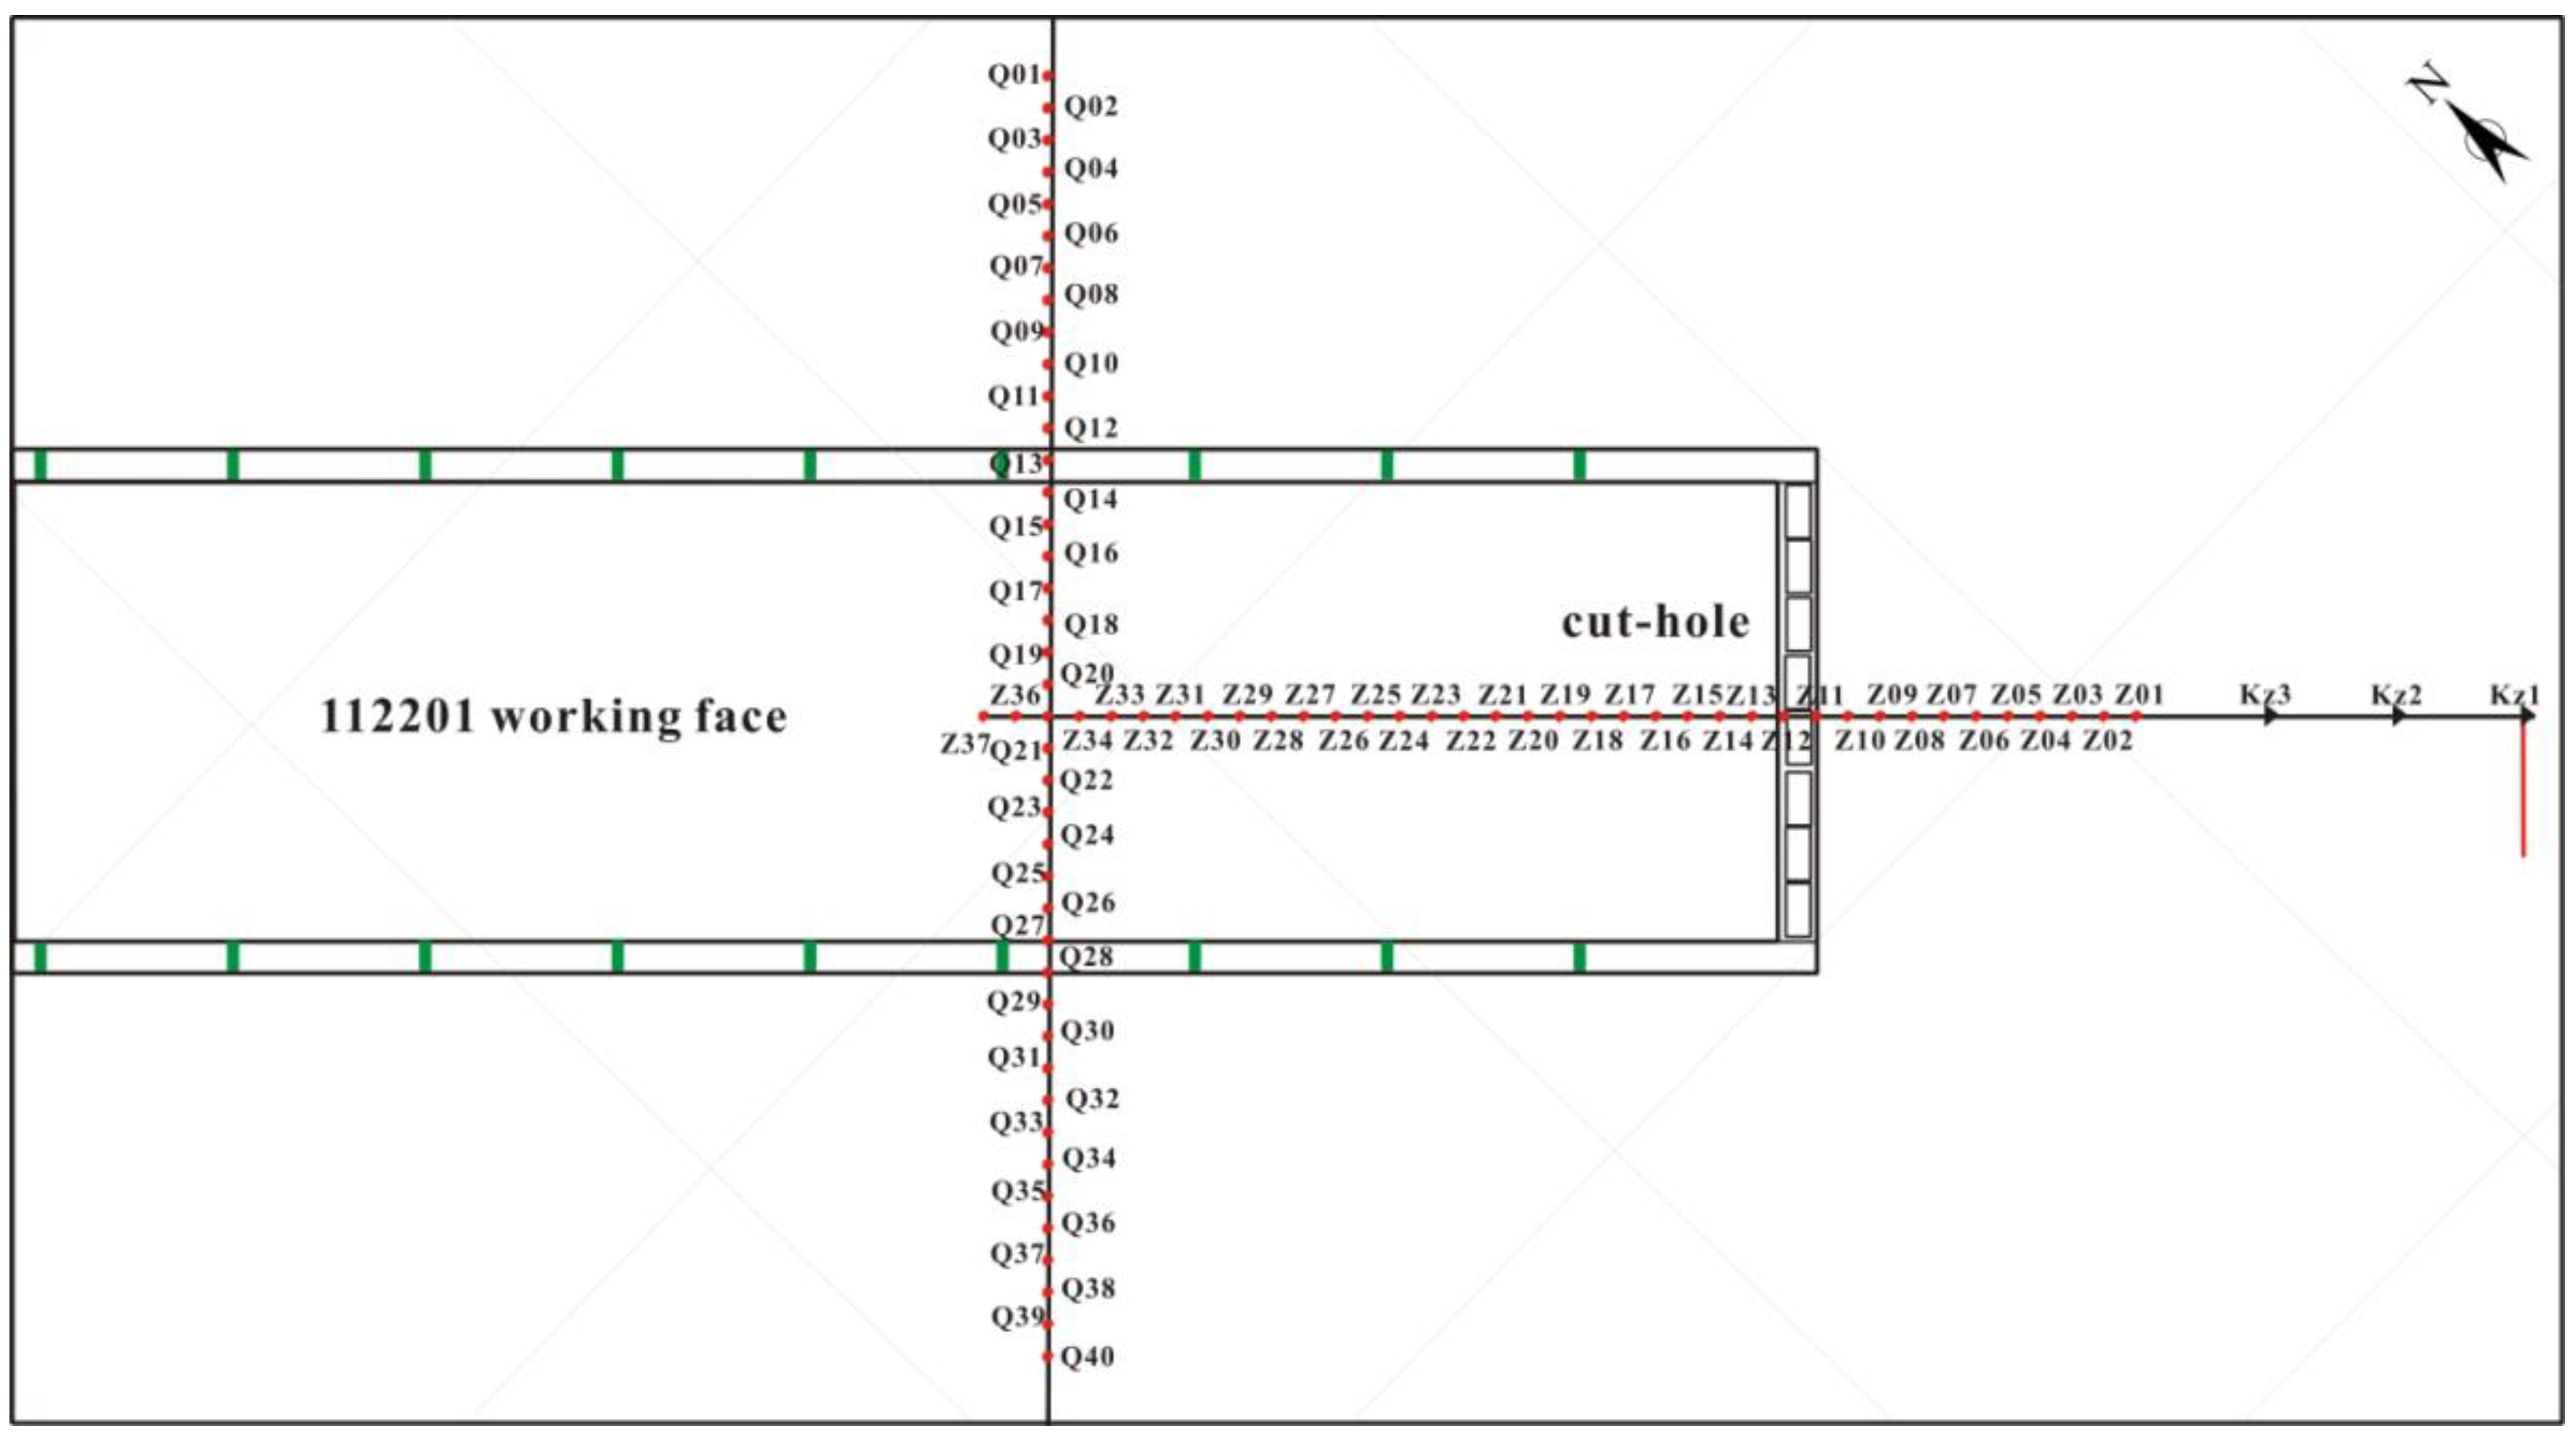
3.2.1. Design of Strike Monitoring Line
- (1)
- Position of Strike Monitoring Line
- (2)
- Length of Strike Monitoring Line
3.2.2. Design of Dip Monitoring Line
- (1)
- Position of Dip Monitoring Line
- (2)
- Length of Dip Monitoring Line
3.3. Test Method of Rock Mechanics Parameters
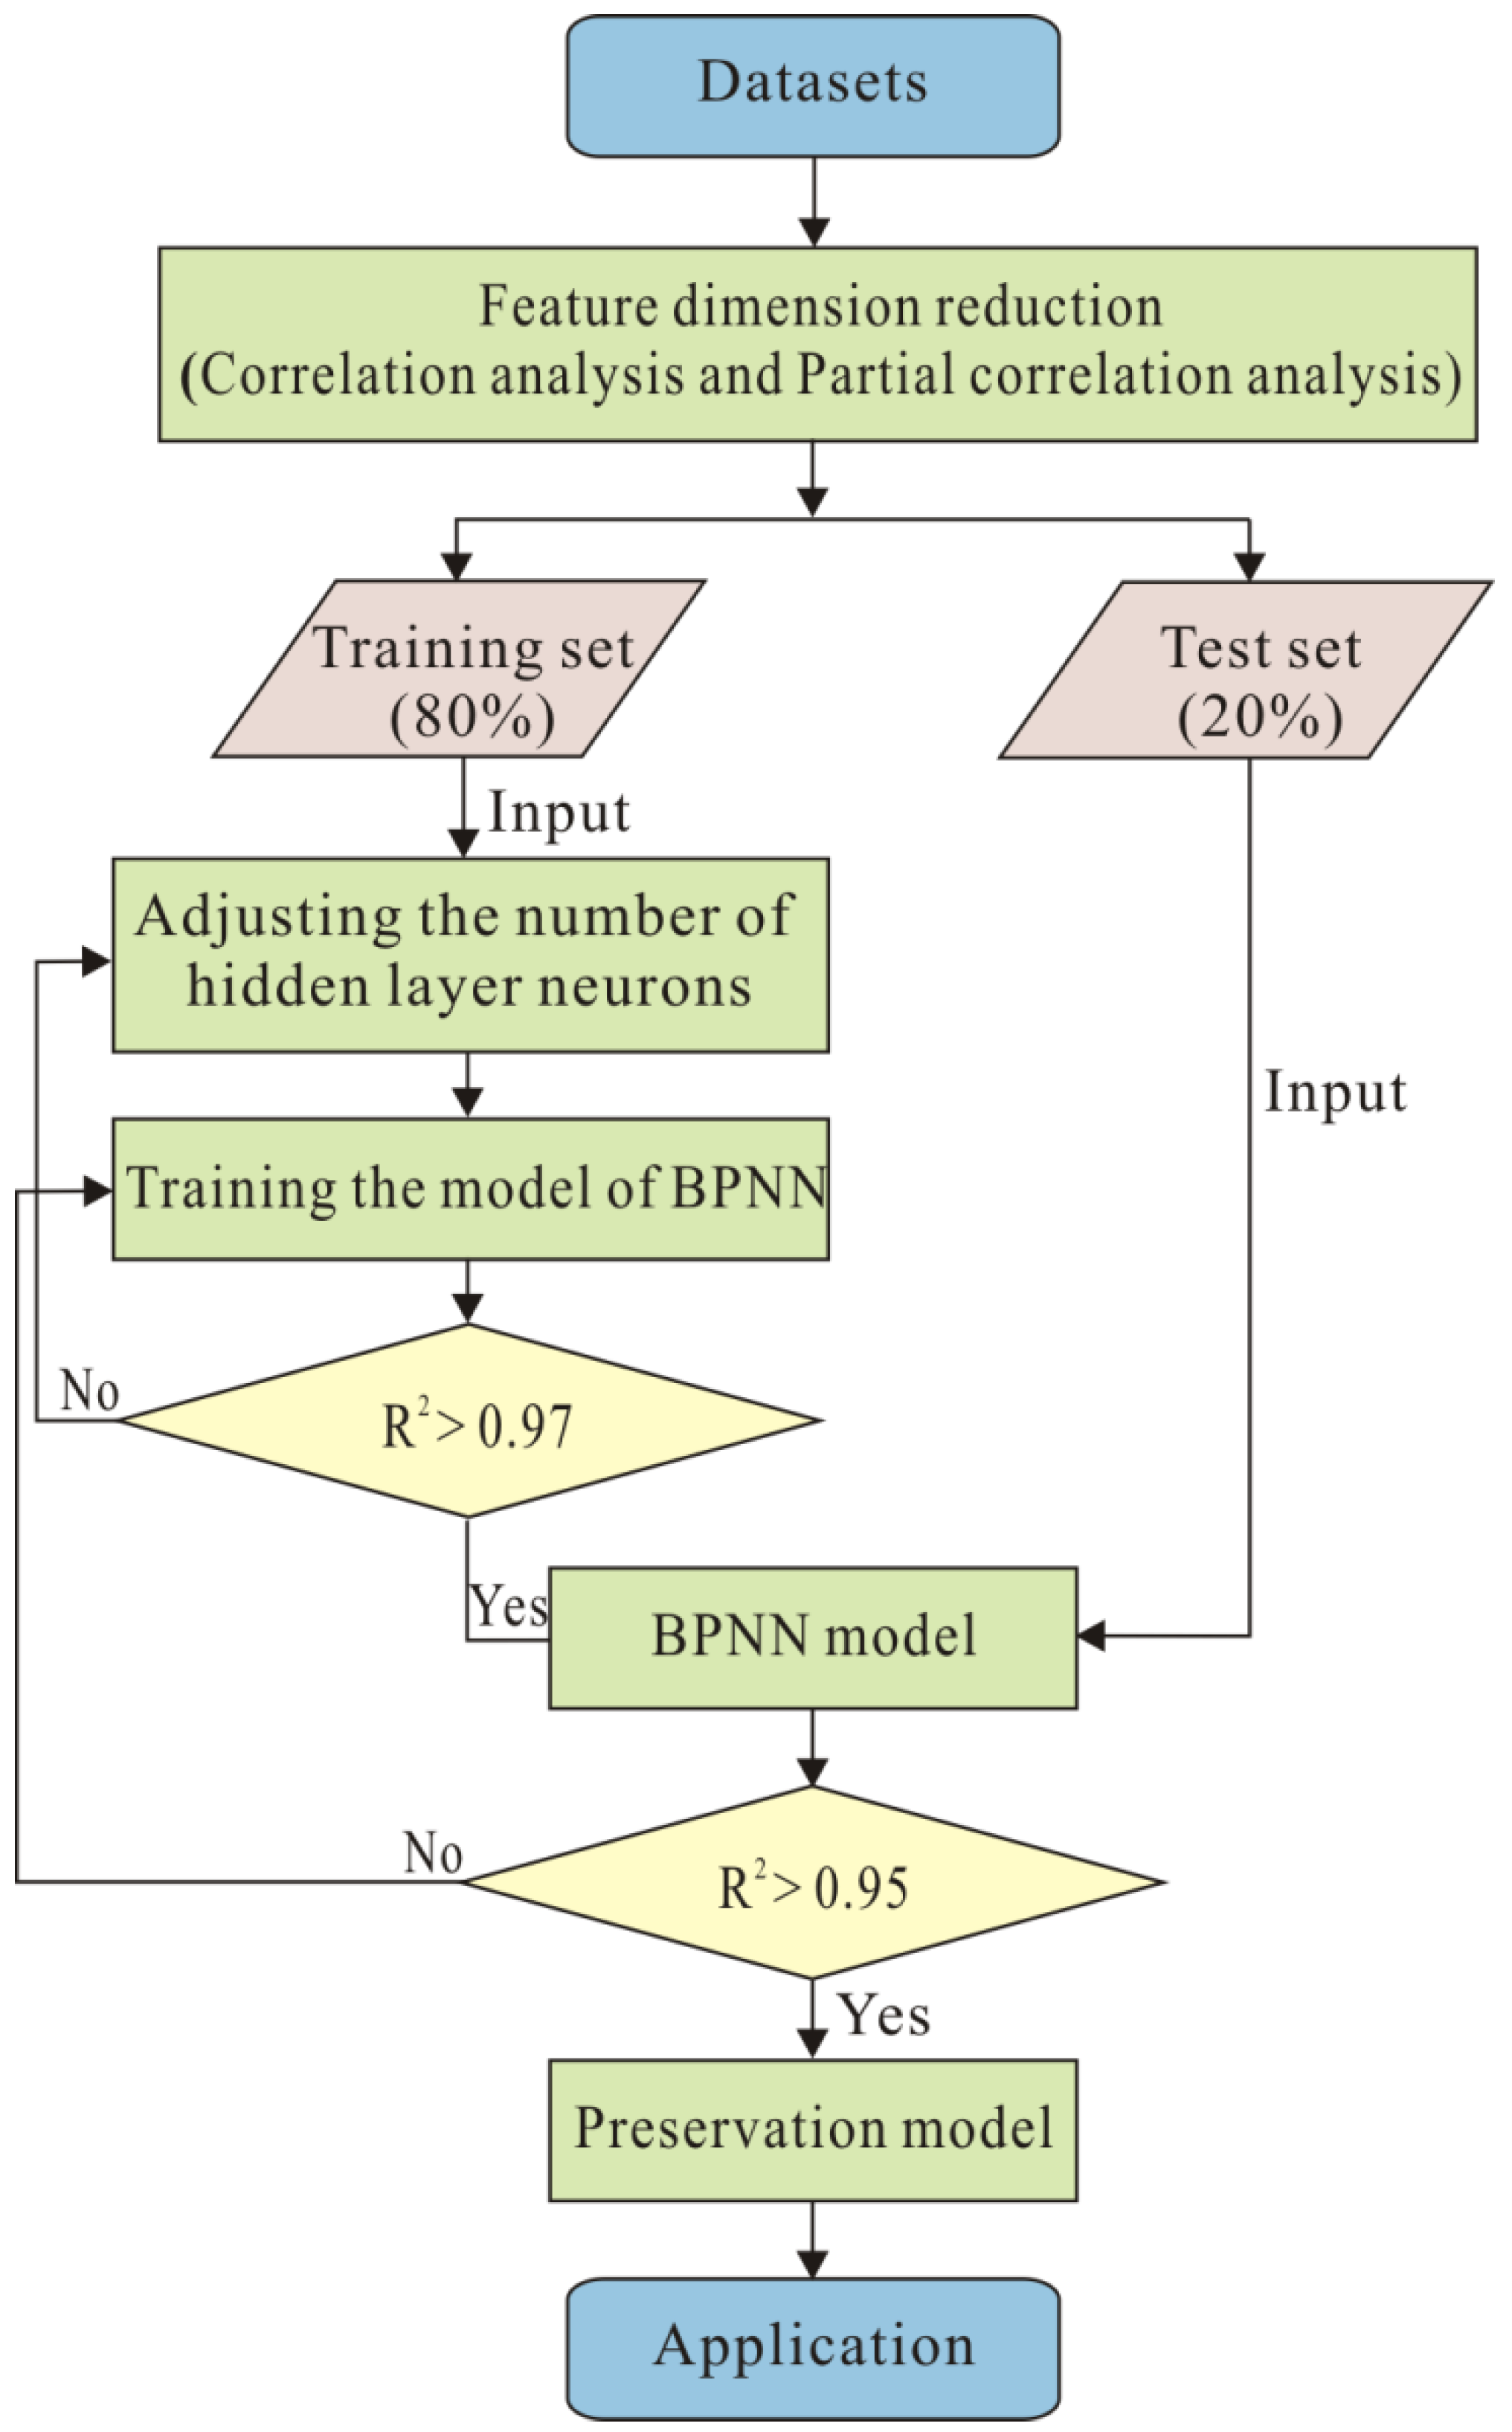
3.4. Machine Learning Modeling of FZH Prediction
3.4.1. Feature Dimension Reduction Method
3.4.2. The Modeling Method
3.5. Numerical Subsidence Experiment
3.5.1. Numerical Model Design and Modeling
3.5.2. Simulated Excavation and Model Testing
4. Results
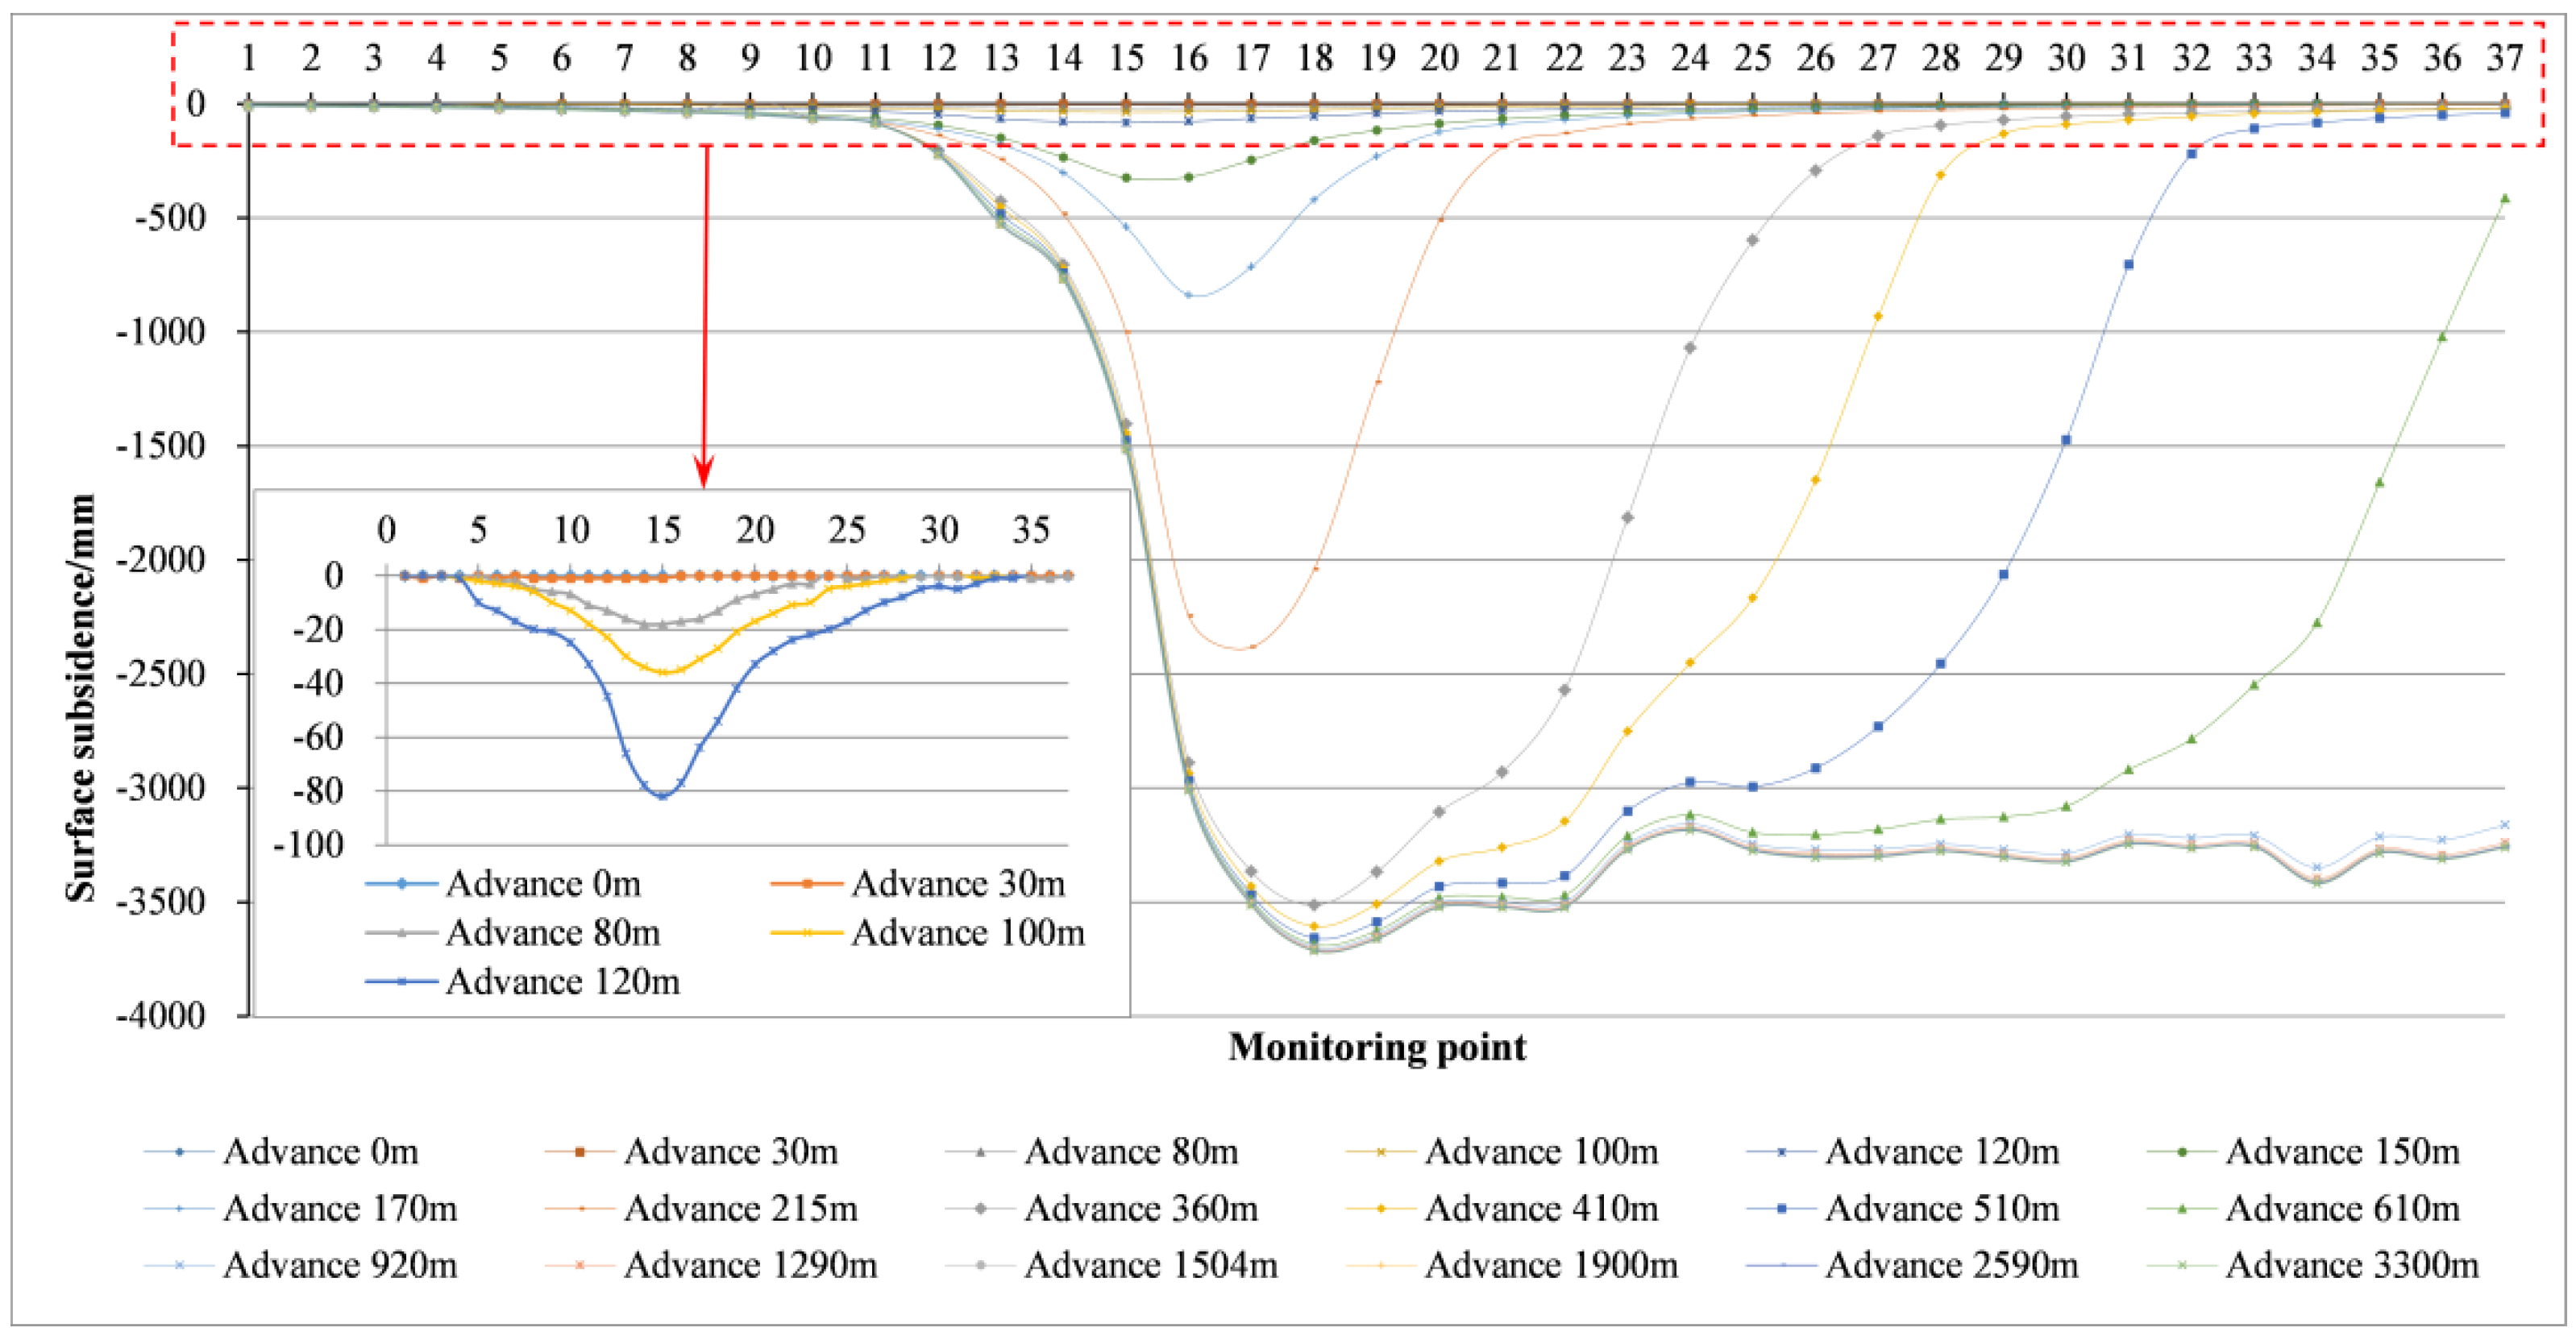
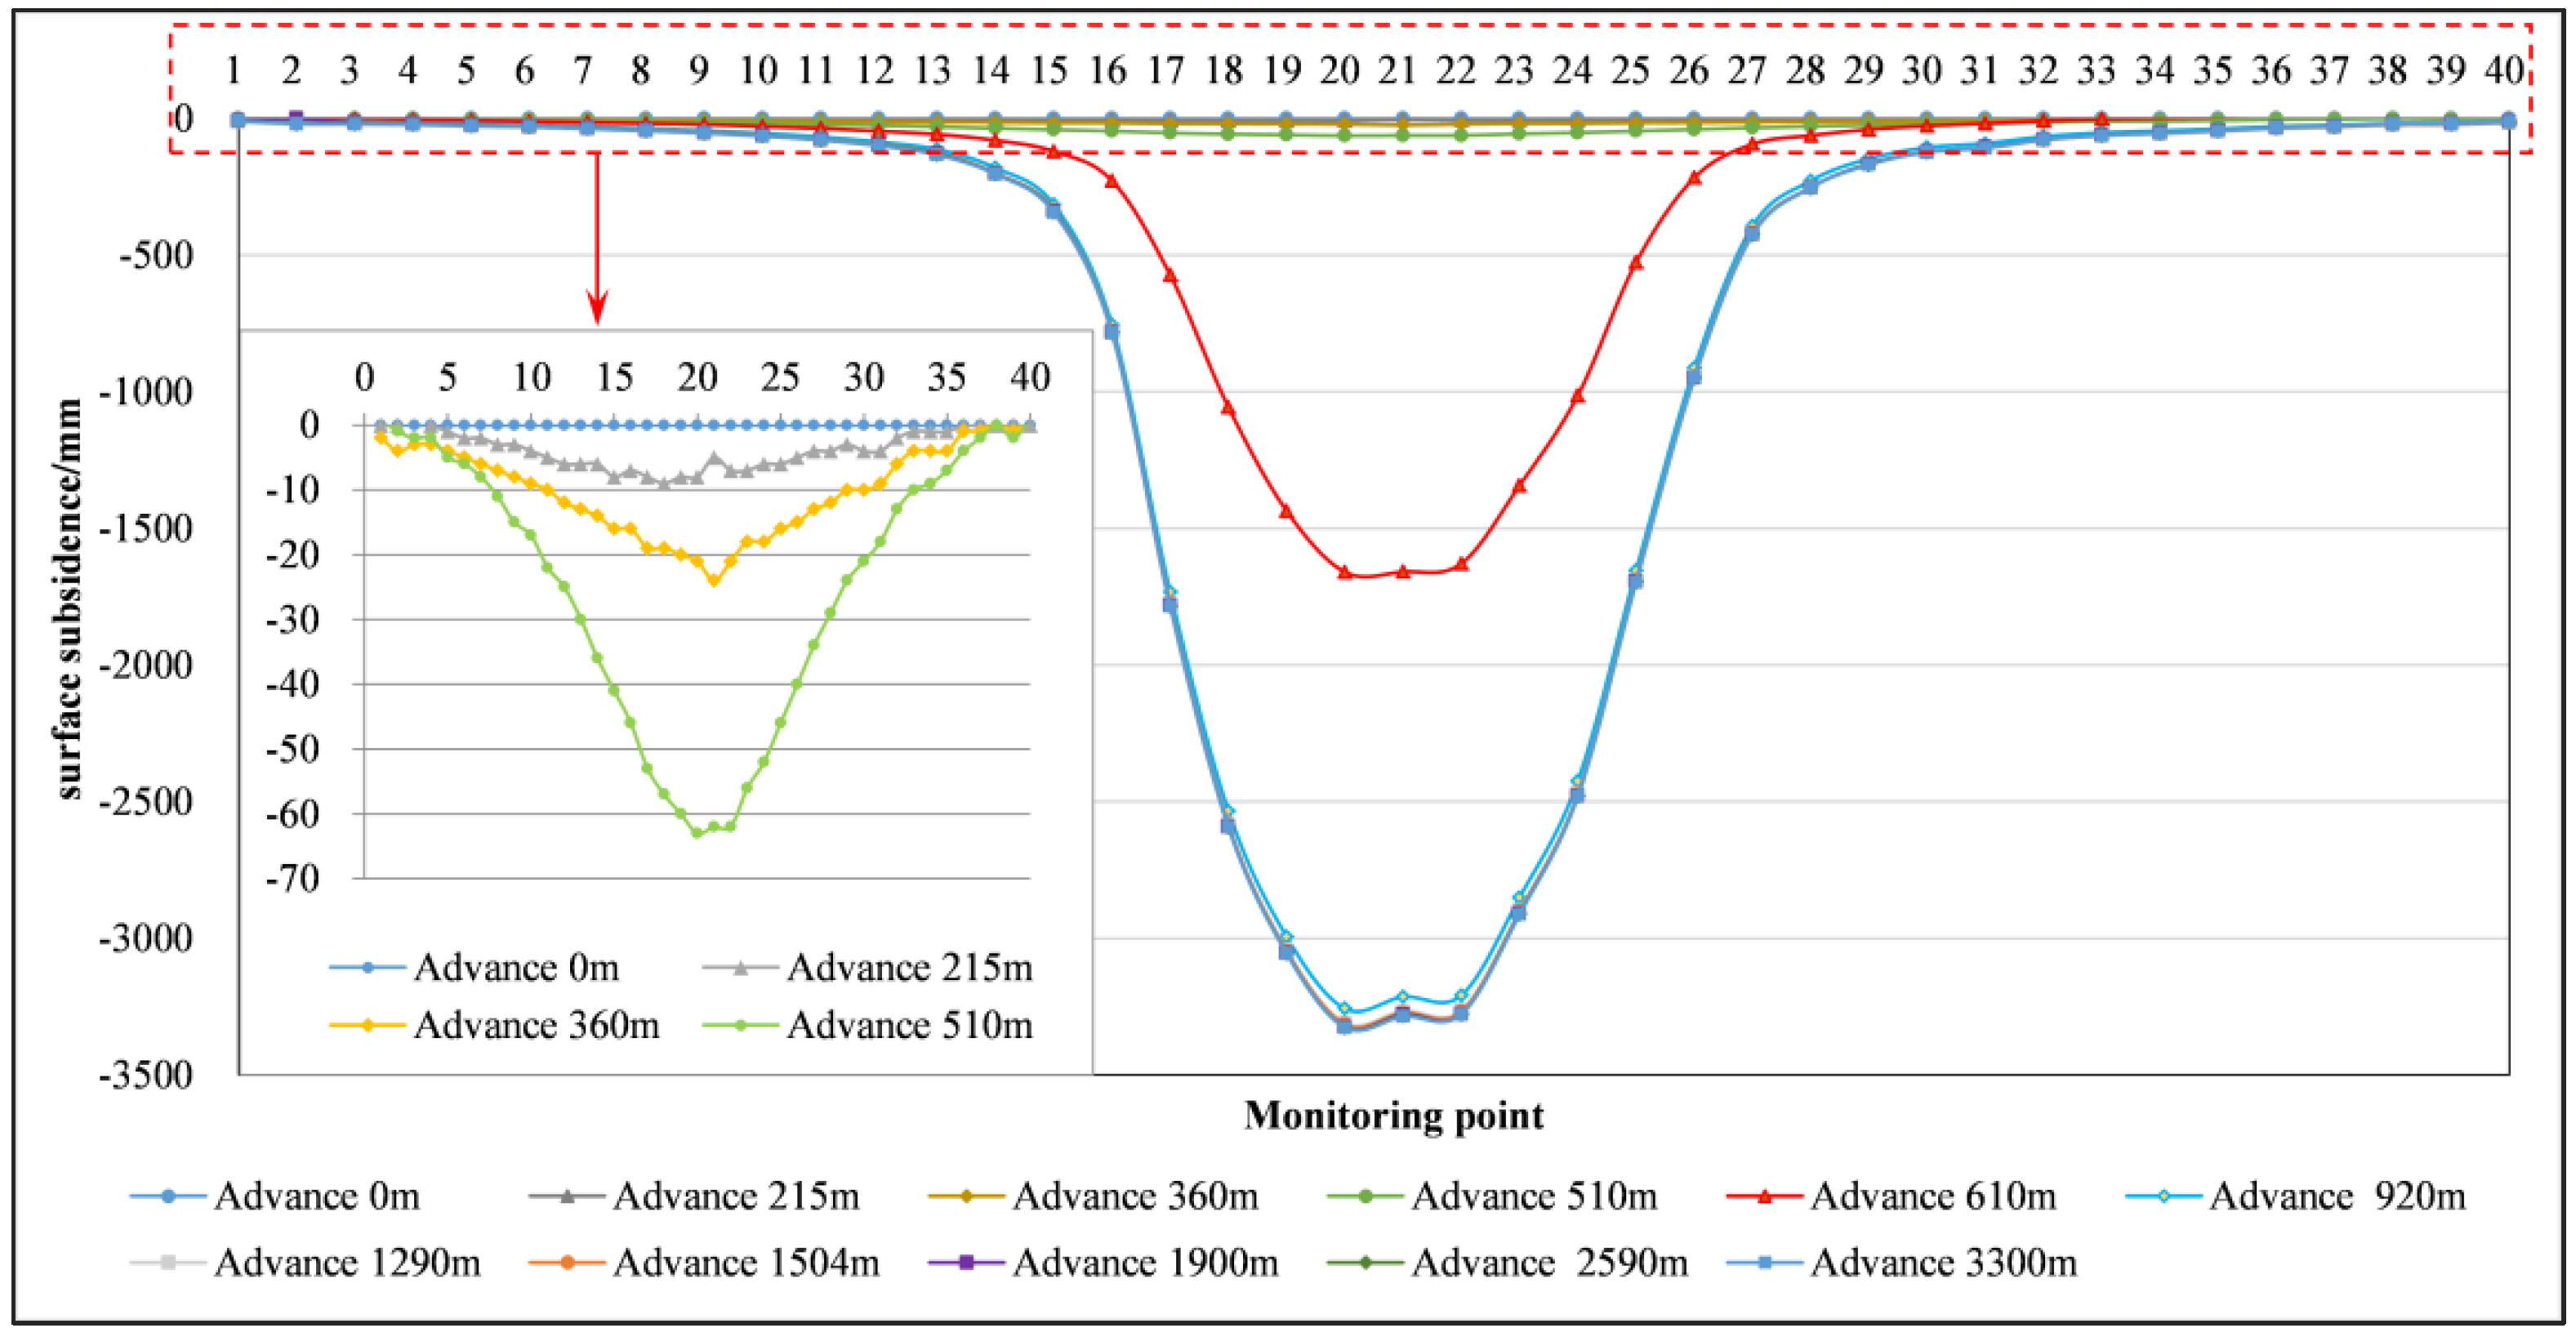
4.1. Monitoring Results of Surface Subsidence
4.2. Weighted Average Value of Rock Mechanical Parameters
4.3. Modeling Index Selection
4.3.1. Feature Dimension Reduction
4.3.2. Model Fitting Results
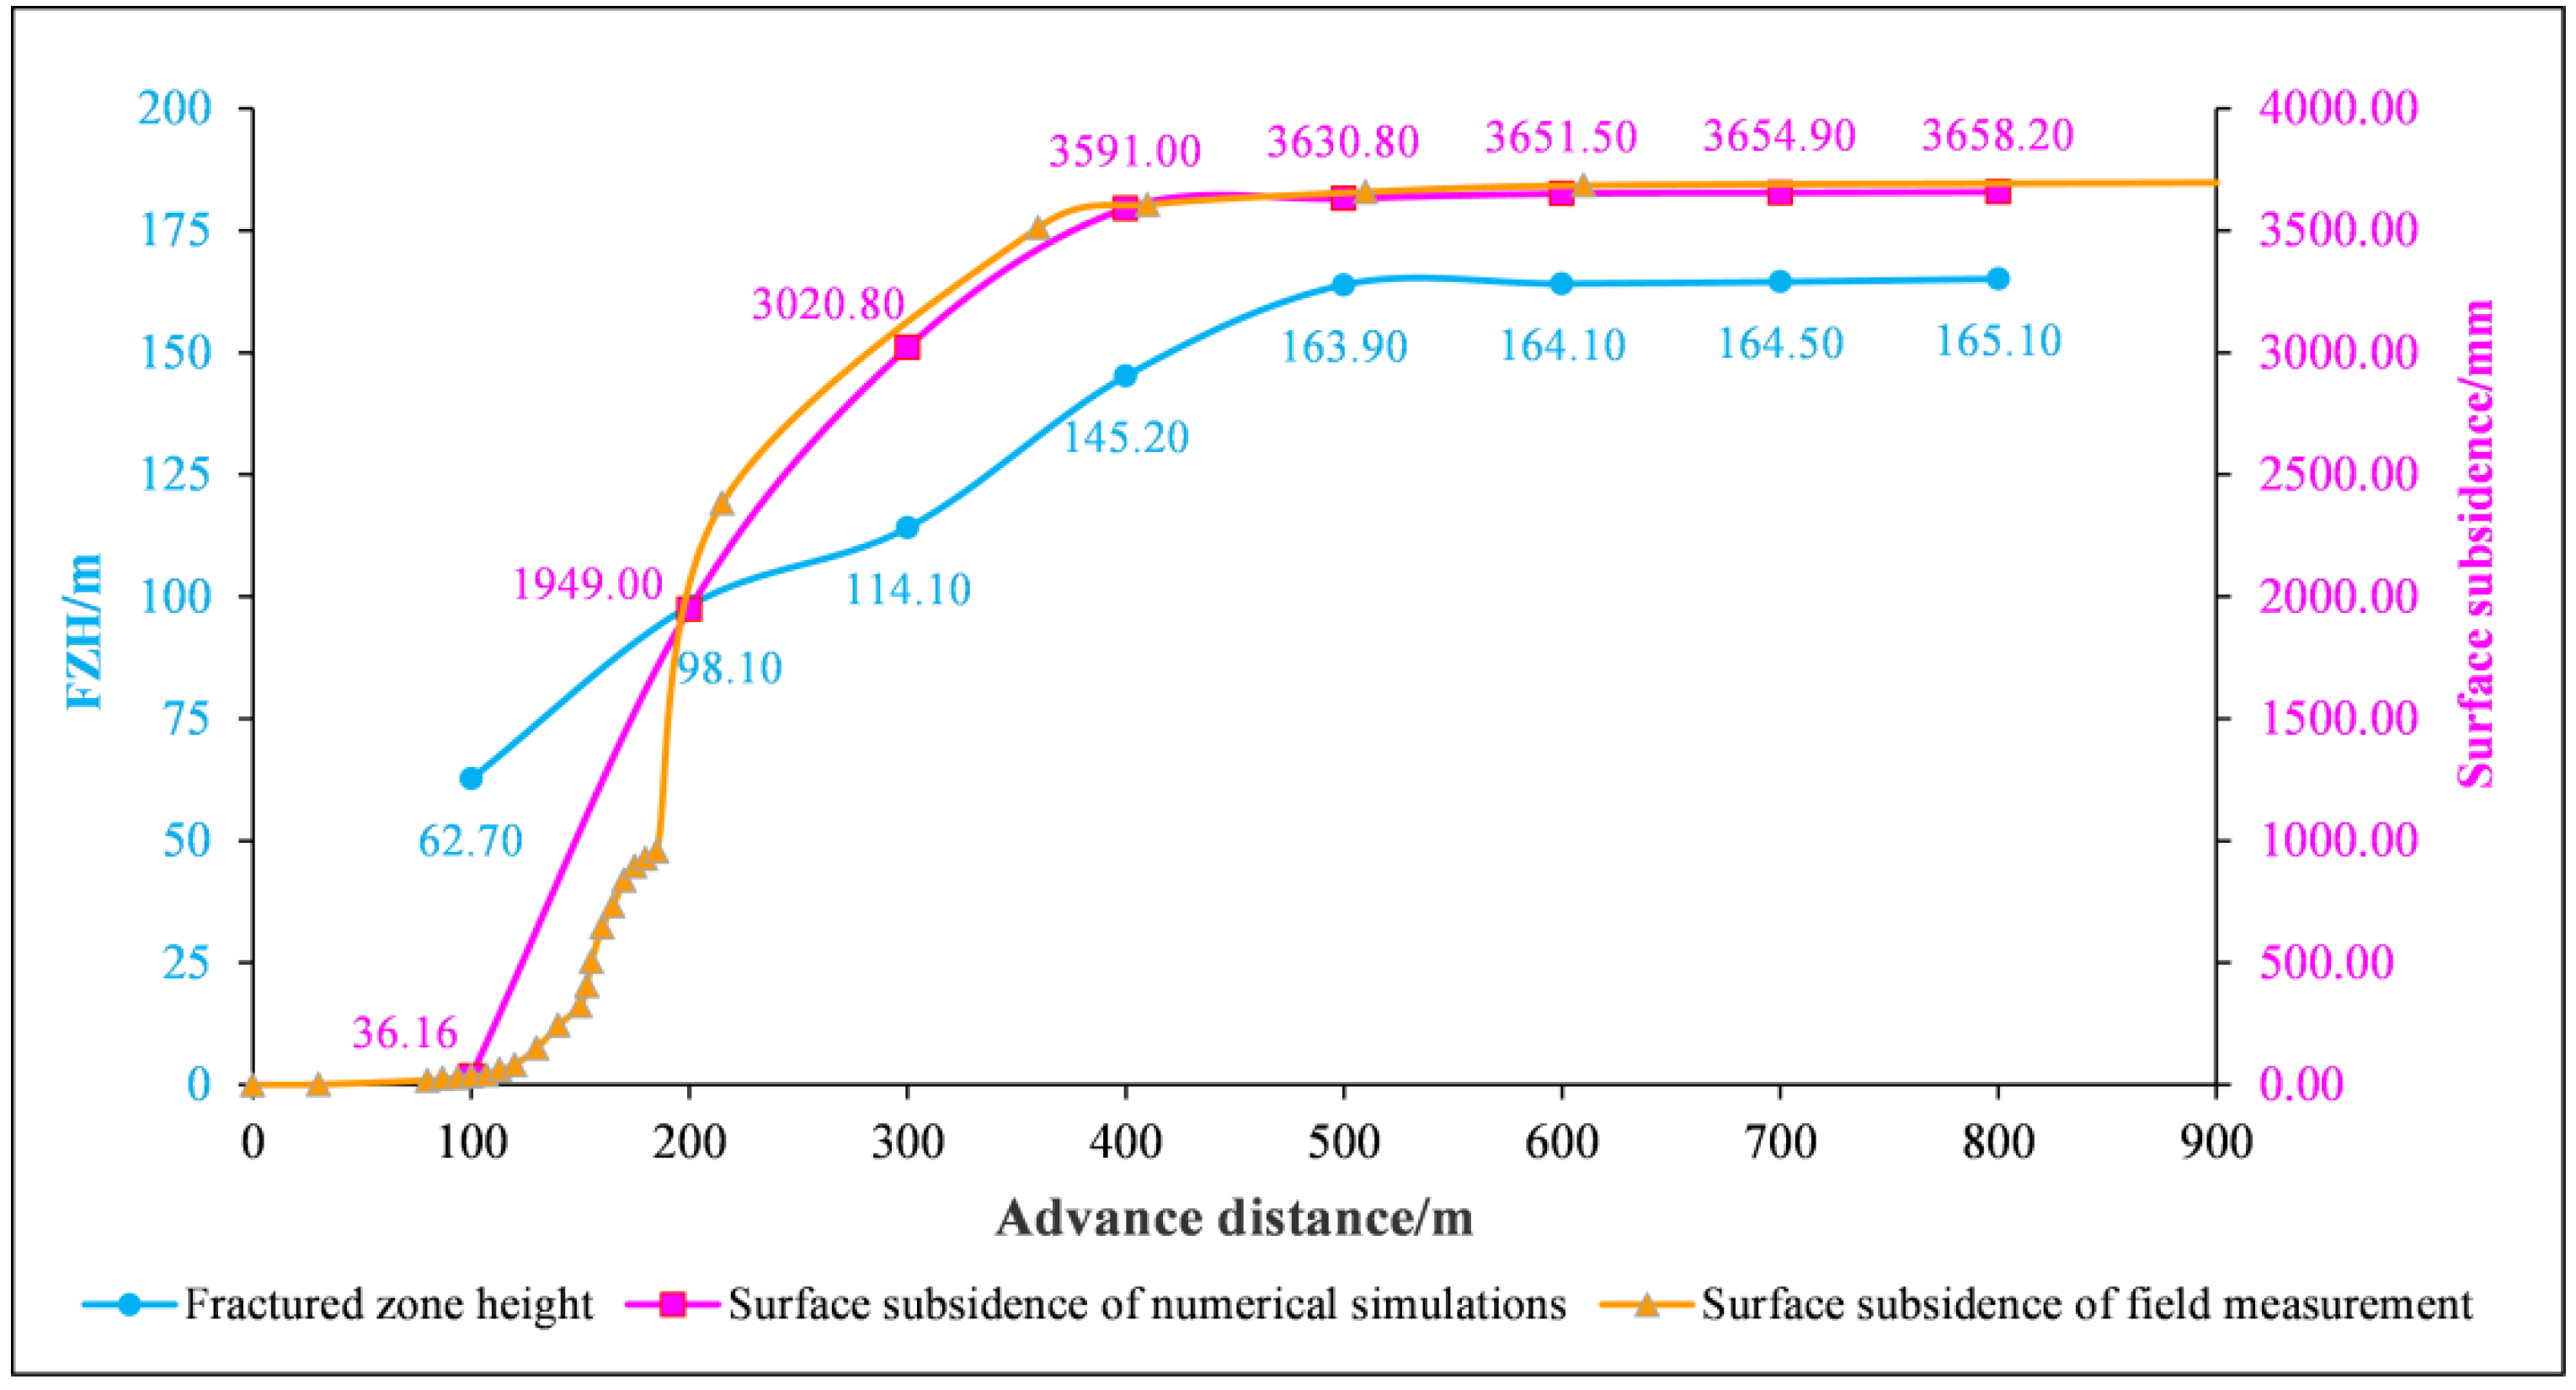
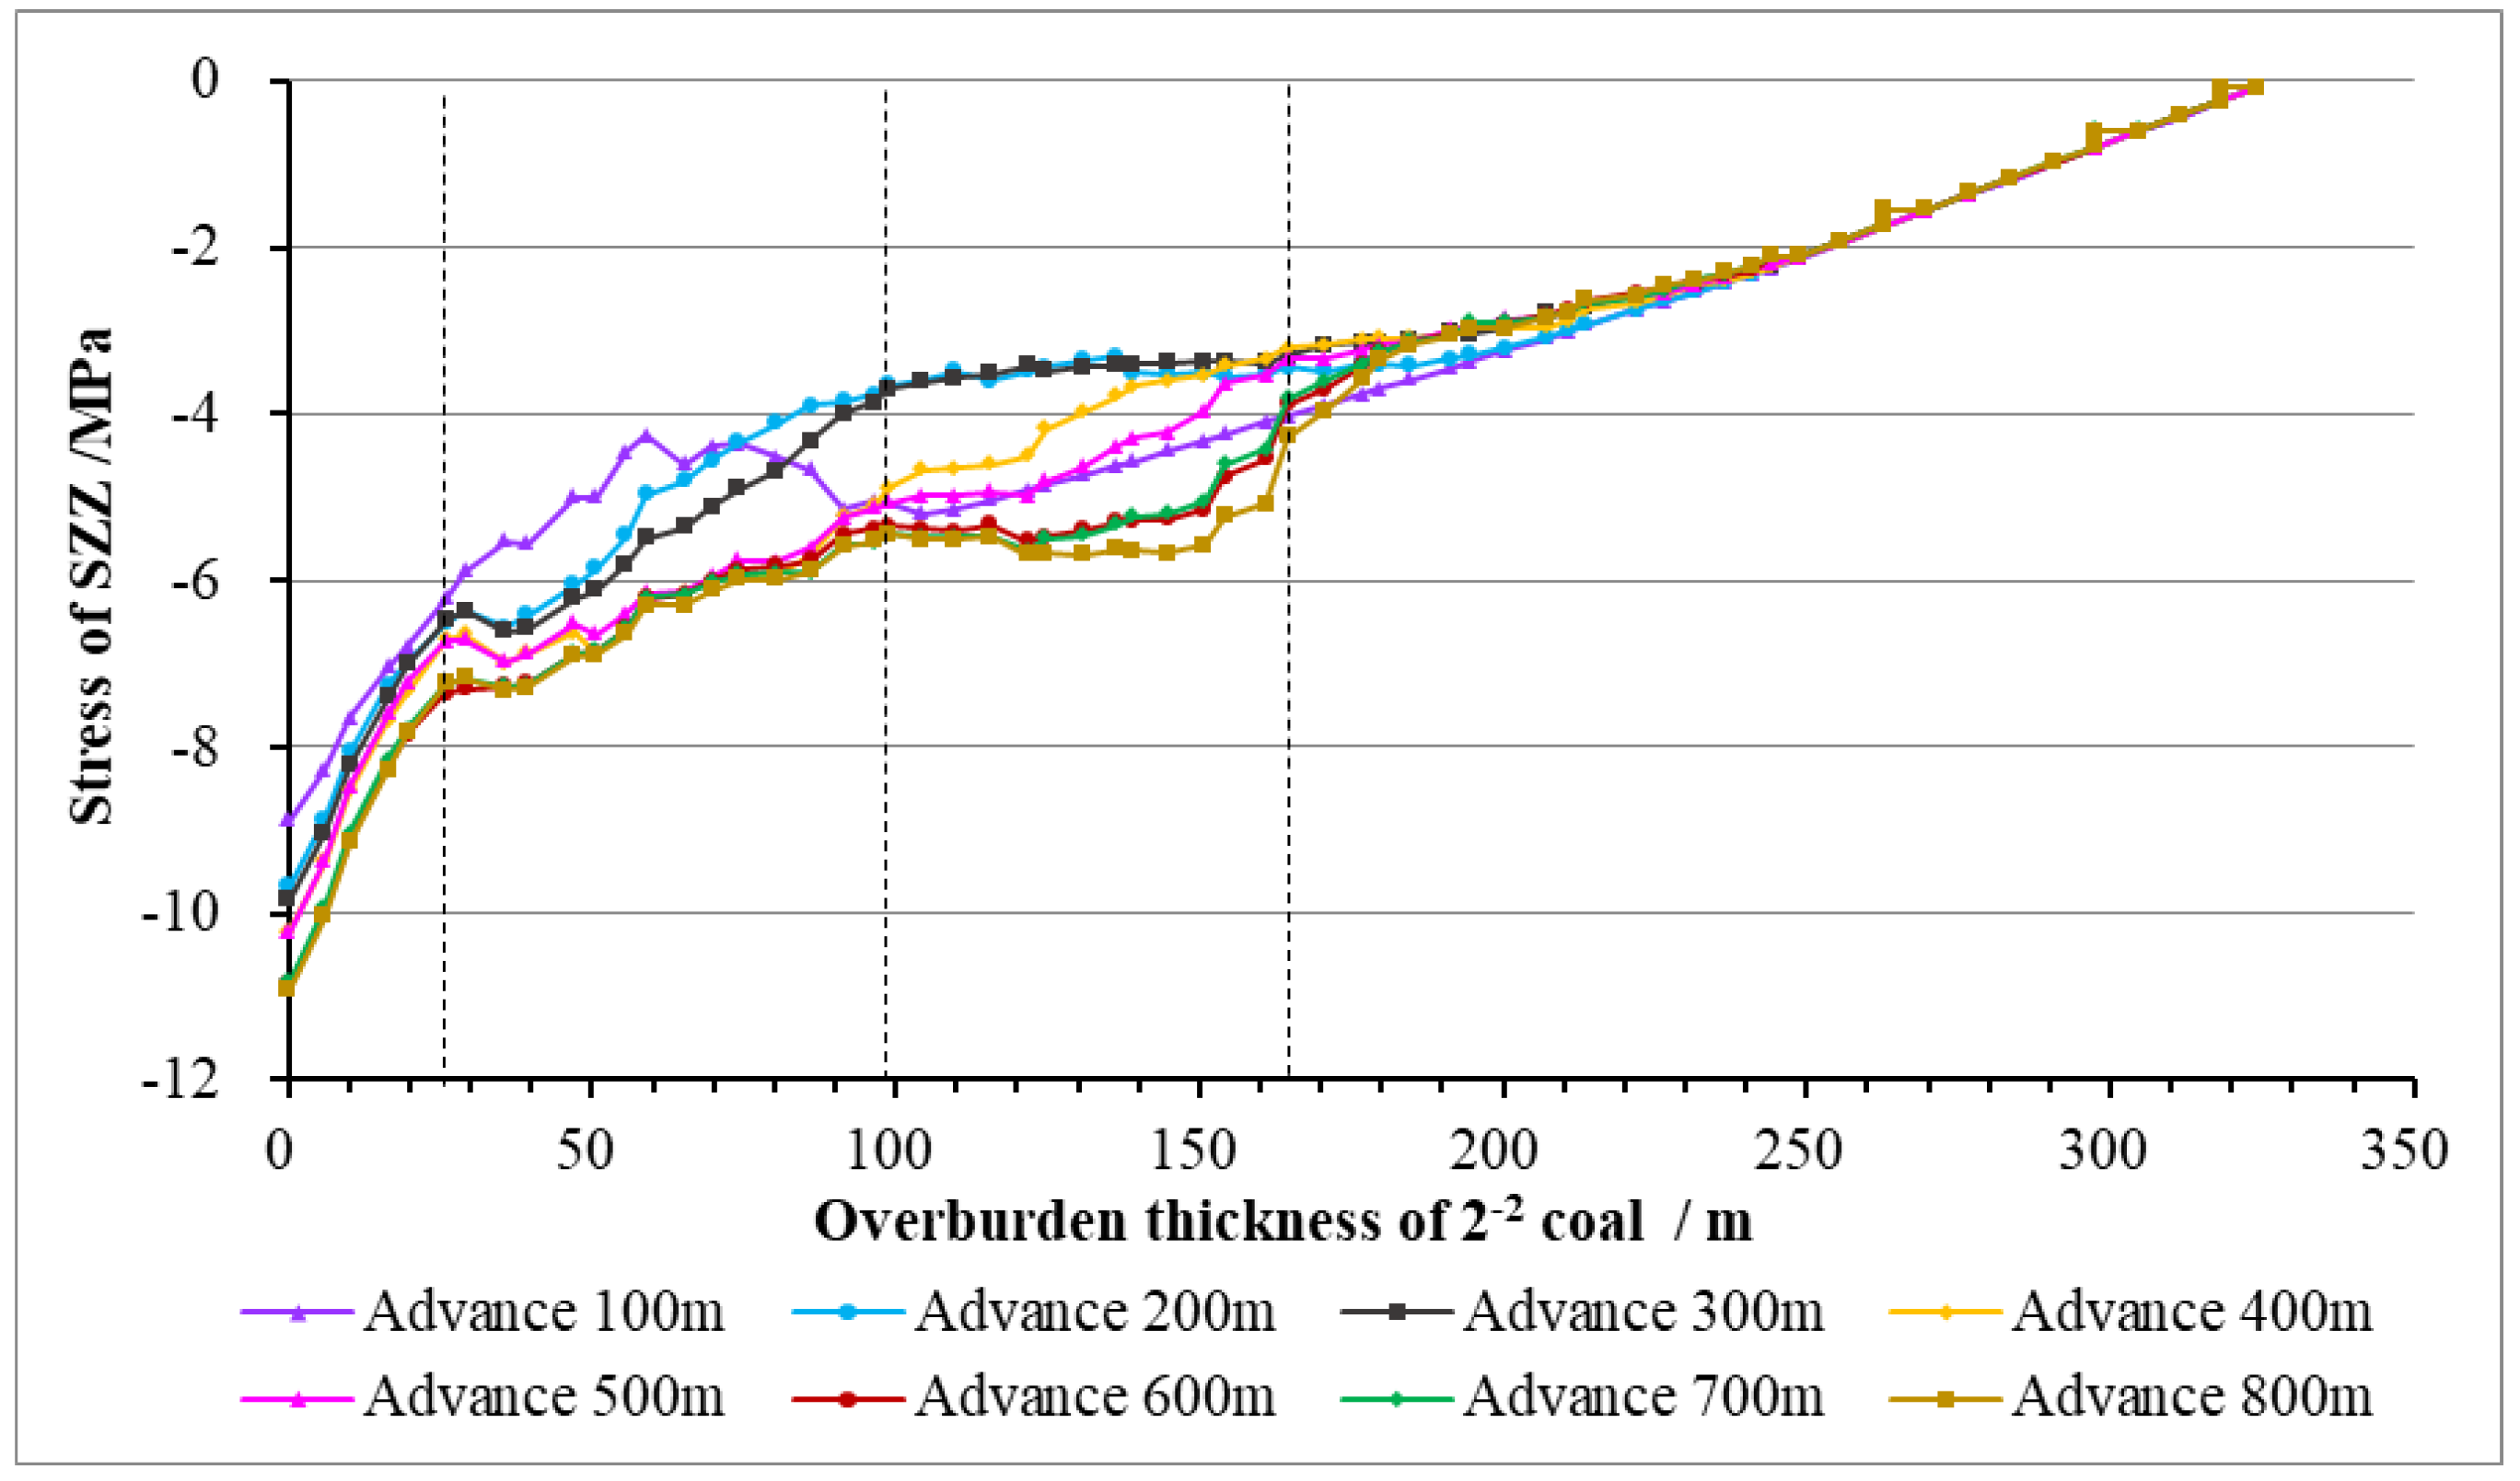
4.4. FLAC3D Numerical Simulation Result
5. Discussion
6. Conclusions and Future Works
Author Contributions
Funding
Data Availability Statement
Acknowledgments
Conflicts of Interest
References
- Jia, Z.J.; Wen, S.Y.; Sun, Z. Current relationship between coal consumption and the economic development and China’s future carbon mitigation policies. Energy Policy 2022, 162, 112812. [Google Scholar] [CrossRef]
- Zhang, Y.; Cao, S.G.; Zhang, N.; Zhao, C.Z. The application of short-wall block back fill mining to preserve surface water resources in northwest China. J. Clean. Prod. 2020, 261, 121232. [Google Scholar] [CrossRef]
- Cui, Z.H.; Zhang, J.J.; Wu, D.; Cai, X.J.; Wang, H.; Zhang, W.S.; Chen, J.J. Hybrid many-objective particle swarm optimization algorithm for green coal production problem. Inform. Sci. 2020, 518, 256–271. [Google Scholar] [CrossRef]
- Liu, Z.G.; Fan, Z.L.; Zhang, Y.J. Fracture characteristics of overlying bedrock and clay aquiclude subjected to shallow coal seam mining. Mine Water Environ. 2019, 38, 136–147. [Google Scholar] [CrossRef]
- Jiang, S.Y.; Fan, G.W. Effect of mining parameters on surface deformation and coal pillar stability under customized shortwall mining of deep extra-thick coal seams. Energy Rep. 2021, 7, 2138–2154. [Google Scholar] [CrossRef]
- Malinowska, A.; Hejmanowski, R. Building damage risk assessment on mining terrains in Poland with GIS application. Int. J. Rock. Mech. Min. Sci. 2010, 47, 238–245. [Google Scholar] [CrossRef]
- Salmi, E.F.; Nazem, M.; Karakus, M. The effect of rock mass gradual deterioration on the mechanism of post-mining subsidence over shallow abandoned coal mines. Int. J. Rock. Mech. Min. Sci. 2017, 91, 59–71. [Google Scholar] [CrossRef]
- Li, X.B.; Ji, D.L.; Han, P.H.; Li, Q.S.; Zhao, H.B.; He, F.L. Study of water-conducting fractured zone development law and assessment method in longwall mining of shallow coal seam. Sci. Rep. 2022, 12, 7994. [Google Scholar] [CrossRef]
- Wan, L.M.; Hou, B.; Muhadasi, Y. Observing the effects of transition zone properties on fracture vertical propagation behavior for coal measure strata. J. Struct. Geol. 2019, 126, 69–82. [Google Scholar] [CrossRef]
- Ning, J.G.; Wang, J.; Xu, Q. Mechanical mechanism of overlying strata breaking and development of fractured zone during close-distance coal seam group mining. Int. J. Min. Sci. Technol. 2020, 30, 207–215. [Google Scholar] [CrossRef]
- Wang, Z.Q.; Li, J.K.; Qin, Z.C.; Su, Y.; Sidikovna, S.S. Height identification of water-permeable fractured zone based on synchronous movement in overlying strata. Sci. Rep. 2022, 12, 7592. [Google Scholar] [CrossRef] [PubMed]
- Zhu, T.G.; Li, W.P.; Wang, Q.Q.; Hu, Y.B.; Fan, K.F.; Du, J.F. Study on the Height of the Mining-Induced Water-Conducting Fracture Zone Under the Q(2l) Loess Cover of the Jurassic Coal Seam in Northern Shaanxi, China. Mine Water Environ. 2020, 39, 57–67. [Google Scholar] [CrossRef]
- Liu, X.S.; Fan, D.Y.; Tan, Y.L.; Ning, J.G.; Song, S.L.; Wang, H.L.; Li, X.B. New Detecting Method on the Connecting Fractured Zone above the Coal Face and a Case Study. Rock. Mech. Rock. Eng. 2021, 54, 4379–4391. [Google Scholar] [CrossRef]
- Tan, Y.; Guo, W.B.; Bai, E.H. The height of fractured zones caused by strip Wongawilli mining in a shallow buried coal seam underlying a hard roof. Curr. Sci. 2018, 115, 1387–1392. [Google Scholar] [CrossRef]
- Guo, W.B.; Zhao, G.B.; Wang, S.R. Height of fractured zone inside overlying strata under high-intensity mining in China. Int. J. Min. Sci. Technol. 2019, 29, 45–49. [Google Scholar] [CrossRef]
- Wu, F.Z.; Wang, Y.N.; Zhu, Z.Q. Height of interconnected fracture zone based on the impact of rock fragmentation and bulking. Energ. Explor. Exploit. 2021, 39, 869–885. [Google Scholar] [CrossRef]
- Liu, Y.; Yuan, S.C.; Ye, Z.Y. Predicting the height of the water-conducting fractured zone using multiple regression analysis and GIS. Environ. Earth. Sci. 2019, 78, 422. [Google Scholar] [CrossRef]
- Zhang, D.S.; Li, W.P.; Lai, X.P.; Fan, G.W.; Liu, W.Q. Development on basic theory of water protection during coal mining in northwest of China. J. China Coal Soc. 2017, 42, 36–43. [Google Scholar]
- Fan, L.M.; Zhang, X.T.; Xiang, M.X.; Zhang, H.Q.; Shen, T. Characteristics of ground fissure development in high intensity mining area of shallow seam in Yushenfu coal field. J. China Coal Soc. 2015, 40, 1442–1447. [Google Scholar]
- Fan, L.M.; Ma, X.D.; Li, Y.H.; Li, C.; Yao, C.W. Geological disasters and control technology in high intensity mining area of western China. J. China Coal Soc. 2017, 42, 276–285. [Google Scholar]
- Li, J.; Wang, L. Mining subsidence monitoring model based on BPM-EKTF and TLS and its application in building mining damage assessment. Environ. Earth Sci. 2021, 80, 396. [Google Scholar] [CrossRef]
- Chen, Q.J.; Li, J.Y.; Hou, E.K. Dynamic simulation for the process of mining subsidence based on cellular automata model. Open Geosc. 2020, 12, 832–839. [Google Scholar] [CrossRef]
- Li, C.; Zhao, L.; Ding, L.; Li, M.; Wang, S.; Jia, P.; He, Y. Collaborative Dynamic Prediction Method for Overlying Strata and Ground Subsidence Induced by Coal Mining, Involves Substituting Main Influence Radius and Subsidence Coefficient into Surface Subsidence under Influence of Mining; Henan Polytechnic University: Jioazuo, China, 2020; p. A11950. [Google Scholar]
- Gong, Y.Q.; Guo, G.L.; Wang, L.P.; Zhang, G.J.; Zhang, G.X.; Fang, Z. Numerical Study on the Surface Movement Regularity of Deep Mining Underlying the Super-Thick and Weak Cementation Overburden: A Case Study in Western China. Sustainability 2022, 14, 1855. [Google Scholar] [CrossRef]
- Huang, Q.X.; He, Y.P.; Cao, J. Experimental investigation on crack development characteristics in shallow coal seam mining in China. Energies 2019, 12, 1302. [Google Scholar] [CrossRef] [Green Version]
- Chen, M.; Yang, S.Q.; Ranjith, P.G.; Yuanchao Zhang, Y.C. Cracking behavior of rock containing non-persistent joints with various joints inclinations. Theor. Appl. Fract. Mech. 2020, 109, 102701. [Google Scholar] [CrossRef]
- Chen, M.; Zang, C.W.; Ding, Z.W.; Zhou, G.L.; Jiang, B.Y.; Zhang, G.C.; Zhang, C.P. Effects of confining pressure on deformation failure behavior of jointed rock. J. Cent. South. Univ. 2022, 29, 1305–1319. [Google Scholar] [CrossRef]
- Moradzadeh, A.; Mohammadi-Ivatloo, B. Heating and cooling loads forecasting for residential buildings based on hybrid machine learning applications: A comprehensive review and comparative analysis. IEEE Access 2022, 10, 2196–2215. [Google Scholar] [CrossRef]
- Xu, H.T.; Chen, C.B.; Zheng, H.W.; Luo, G.P.; Yang, L.; Wang, W.S.; Wu, S.X. Correlation analysis and adaptive genetic algorithm based feature subset and model parameter optimization in salinization monitoring. J. Geo-Inform. Sci. 2020, 22, 1497–1509. [Google Scholar]
- Zhang, J.G.; Li, P.T.; Yin, X.; Wang, S.; Zhu, Y.G. Back analysis of surrounding rock parameters in pingdingshan mine based on bp neural network integrated mind evolutionary algorithm. Mathematics 2022, 10, 1746. [Google Scholar] [CrossRef]
- Zhang, H.; Gui, L.; Wang, T.F.; Yang, S. Prediction of quaternary cover thickness and 3D geological modeling based on bp neural network. Earth Sci. 2022, 1–9. Available online: https://kns.cnki.net/kcms/detail/detail.aspx?dbcode=CAPJ&dbname=CAPJLAST&filename=DQKX2022052500D&uniplatform=NZKPT&v=yvVLpZpX-NRs6NwZd8Gj08bOJrEyMSlLP3ici3QbOVxyLX743cGiblS-7aiElg95 (accessed on 14 July 2022).
- Bai, Y.F.; Li, X.J.; Lv, M.Y. Multiscale analysis of tunnel surrounding rock disturbance: A PFC3D-FLAC3D coupling algorithm with the overlapping domain method. Comput. Geotech. 2022, 147, 104752. [Google Scholar] [CrossRef]
- Hu, X.J.; Li, W.P.; Cao, D.T.; Liu, M.C. Index of multiple factors and expected height of fully mechanized water flowing fractured zone. J. China Coal Soc. 2012, 37, 613–620. [Google Scholar]
- Li, Y.; Yang, T.H.; Hao, N. Mining rate effect of high-intensity working face based on stress release rate and microseismic monitoring. J. Min. Saf. Eng. 2021, 38, 295–303. [Google Scholar]
- Dai, S.; Han, B.; Liu, S.L.; Li, N.B.; Geng, F.; Hou, X.H. Neural network–based prediction methods for height of water-flowing fractured zone caused by underground coal mining. Arab. J. Geosc. 2020, 13, 495. [Google Scholar] [CrossRef]
- Sun, Y.J.; Zuo, J.P.; Karakusb, M.; Wang, J.T. Investigation of movement and damage of integral overburden during shallow coal seam mining. Int. J. Rock Mech. Min. 2018, 117, 63–75. [Google Scholar] [CrossRef]
- Peng, J.B.; Chen, L.W.; Huang, Q.B.; Men, Y.M.; Fan, W.; Yan, J.K.; Li, K.; Ji, Y.S.; Shi, Y.L. Large-scale physical simulative experiment on ground-fissure expansion mechanism. Chin. J. Geophys. 2008, 51, 1826–1834. [Google Scholar]


| Borehole Number | Determination Data of Loss of Drilling Fluid Method | Determination Data of Geophysical Logging | Determination Data of Engineering Geological Catalogue | Determination Data of Image Logging | Average Fractured Zone Height |
|---|---|---|---|---|---|
| Y3 | 130.5 | 127.7 | 127.72 | / | 128.64 |
| Y4 | 137.3 | 136.9 | 140.8 | / | 138.33 |
| Y5 | 138.9 | 129.2 | 135.4 | / | 134.50 |
| Y6 | 117.8 | 118.24 | 118.6 | 118.5 | 118.29 |
| H3 | 108.32 | 85.53 | 110.88 | 108.98 | 109.39 |
| H4 | 114.38 | 136.23 | 114.18 | 113.58 | 114.05 |
| H5 | 107.83 | 135.5 | 108.9 | 109.9 | 108.88 |
| ZP1 | 96.3 | / | / | / | 96.3 |
| ZP2 | 84.8 | / | / | / | 84.8 |
| DZ1 | 136.52 | 139.61 | 133.8 | 136.1 | 136.51 |
| DZ2 | 126.28 | 128.75 | 136.4 | 139.15 | 132.65 |
| XSD1 | 158.159 | 158.909 | 158.779 | 154.009 | 157.46 |
| XSD7 | 146 | 155 | 157.39 | 156.7 | 156.36 |
| XSD2 | 157.083 | 153.463 | 153.263 | 152.013 | 153.96 |
| JT4 | 126.4 | 133.45 | 127.9 | 130.7 | 129.61 |
| JT6 | 120.25 | 109.9 | 118.3 | 119 | 119.18 |
| Strata | Drilling Number | Rock Name | Sampling Depth (M) | USCS (Mpa) | Softening Coefficient | Poisson’s Ratio |
|---|---|---|---|---|---|---|
| J2z | BK2 | Siltstone | 126~145.97 | 18.8 | 0.77 | 0.23 |
| Medium Grained Sandstone | 145.97~156.83 | 18.32 | 0.84 | 0.22 | ||
| Siltstone | 156.83~166.93 | 16.33 | 0.62 | 0.23 | ||
| Fine-Sandstone | 166.93~175.27 | 18.48 | 0.7 | 0.23 | ||
| Coarse Sandstone | 175.27~185.4 | 11.19 | 0.78 | 0.21 | ||
| Siltstone | 185.4~195.3 | 11.99 | 0.49 | 0.23 | ||
| Coarse Sandstone | 195.3~209.1 | 12.57 | 0.61 | 0.22 | ||
| 3# | Sandy Mudstone | 146.10–150.25 | 0.836 | 0.04 | 0.37 | |
| 9# | Sandy Mudstone | 106.58–121.19 | 8.18 | 0.21 | 0.3 | |
| 10# | Sandy Mudstone | 173.6–176.36 | 0.618 | 0.03 | 0.35 | |
| 11# | Sandy Mudstone | 235.10–242.73 | 21.6 | 0.6 | 0.27 | |
| Sandy Mudstone | 282.3–289.41 | 18.2 | 0.57 | 0.28 | ||
| J2y | BK2 | Siltstone | 209.1~212.6 | 15.63 | 0.79 | 0.22 |
| Fine-Sandstone | 212.6~216.5 | 17.1 | 0.81 | 0.22 | ||
| Coarse Sandstone | 216.5~223.5 | 13.97 | 0.7 | 0.22 | ||
| Siltstone | 224.15~229.5 | 0 | 0.23 | |||
| Medium Grained Sandstone | 229.5~237.47 | 16.9 | 0.71 | 0.22 | ||
| Siltstone | 237.47~240.97 | 12.53 | 0.54 | 0.22 | ||
| Siltstone | 244.9~251.81 | 15.77 | 0.71 | 0.22 | ||
| Fine-Sandstone | 251.85~253.45 | 19.27 | 0.82 | 0.23 | ||
| Siltstone | 253.45~261.55 | 23.01 | 0.79 | 0.23 | ||
| Coarse Sandstone | 261.55~263.85 | 16.51 | 0.76 | 0.22 | ||
| Siltstone | 263.85~267.51 | 26.28 | 0.81 | 0.24 | ||
| Coarse Sandstone | 267.51~271.51 | 16.82 | 0.78 | 0.22 | ||
| Siltstone | 271.51~284.08 | 17.18 | 0.57 | 0.23 | ||
| Coarse Sandstone | 284.08~290.1 | 12.55 | 0.38 | 0.24 | ||
| Fine-Sandstone | 292.08~296.12 | 21.3 | 0.78 | 0.23 | ||
| Coal | 296.8~302.7 | 14.86 | 0.69 | 0.22 |
| Lithology | Thickness (m) | Elastic Modulus (×104 Mpa) | Tensile Strength (Mpa) | Volumetric Weight (kg/m3) | Internal Friction Angle (°) | Poisson Ratio | Bond (Mpa) |
|---|---|---|---|---|---|---|---|
| Soil Layer | 12 | 0.168 | 0.20 | 2710 | 39.7 | 0.57 | 0.83 |
| Silty Clay | 70 | 0.503 | 0.16 | 2720 | 43.5 | 0.49 | 0.85 |
| Siltstone | 2 | 0.854 | 0.42 | 2420 | 38.66 | 0.22 | 0.85 |
| Medium-Grained Sandstone | 4 | 0.452 | 0.24 | 2310 | 39.55 | 0.18 | 0.51 |
| Siltstone | 15 | 1.325 | 0.75 | 2390 | 38.58 | 0.21 | 1.42 |
| Fine-Grained Sandstone | 9 | 1.195 | 0.68 | 2310 | 38.66 | 0.23 | 1.26 |
| Medium-Grained Sandstone | 6 | 0.563 | 0.32 | 2350 | 40.22 | 0.18 | 0.51 |
| Siltstone | 8 | 1.795 | 0.95 | 2430 | 37.69 | 0.21 | 1.83 |
| Fine-Grained Sandstone | 2 | 1.598 | 0.81 | 2340 | 38.25 | 0.2 | 1.62 |
| Siltstone | 6 | 1.425 | 0.73 | 2470 | 37.45 | 0.21 | 1.52 |
| Fine-Grained Sandstone | 4 | 1.421 | 0.71 | 2350 | 38.66 | 0.2 | 1.52 |
| Medium-Grained Sandstone | 6 | 1.328 | 0.72 | 2320 | 38.66 | 0.2 | 1.41 |
| Coarse-Grained Sandstone | 5 | 1.214 | 0.63 | 2310 | 41.8 | 0.19 | 1.28 |
| Fine-Grained Sandstone | 12 | 1.758 | 0.97 | 2360 | 35 | 0.23 | 1.82 |
| Siltstone | 17 | 2.214 | 1.17 | 2390 | 38.77 | 0.19 | 2.38 |
| Fine-Grained Sandstone | 3 | 2.318 | 1.22 | 2350 | 39.55 | 0.23 | 2.42 |
| Medium-Grained Sandstone | 14 | 2.425 | 1.35 | 2330 | 39.08 | 0.15 | 2.63 |
| Siltstone | 15 | 2.758 | 1.41 | 2310 | 37.43 | 0.19 | 2.85 |
| Fine-Grained Sandstone | 6 | 1.425 | 0.71 | 2350 | 38.66 | 0.2 | 1.51 |
| Siltstone | 11 | 1.385 | 0.78 | 2410 | 36.27 | 0.23 | 1.59 |
| Fine-Grained Sandstone | 10 | 1.427 | 0.71 | 2380 | 38.19 | 0.24 | 1.54 |
| Medium-Grained Sandstone | 14 | 2.458 | 1.32 | 2410 | 37.75 | 0.22 | 2.65 |
| Siltstone | 4 | 1.569 | 0.85 | 2420 | 38.26 | 0.18 | 1.75 |
| Medium-Grained Sandstone | 9 | 2.587 | 1.36 | 2380 | 36.03 | 0.15 | 2.74 |
| Siltstone | 3 | 1.325 | 0.73 | 2460 | 38.47 | 0.2 | 1.42 |
| Fine-Grained Sandstone | 2 | 2.658 | 1.31 | 2370 | 37.43 | 0.15 | 2.71 |
| Siltstone | 5 | 2.412 | 1.17 | 2410 | 36.3 | 0.17 | 2.49 |
| Fine-Grained Sandstone | 5 | 2.758 | 1.45 | 2320 | 38.05 | 0.15 | 2.86 |
| Medium-Grained Sandstone | 2 | 2.153 | 1.14 | 2360 | 39.45 | 0.2 | 2.24 |
| Fine-Grained Sandstone | 5 | 2.745 | 1.47 | 2380 | 38.66 | 0.17 | 2.86 |
| Siltstone | 7 | 2.135 | 1.15 | 2350 | 39.78 | 0.22 | 2.26 |
| Medium-Grained Sandstone | 32 | 1.247 | 0.67 | 2280 | 37.69 | 0.16 | 1.3 |
| Siltstone | 2 | 2.658 | 1.46 | 2380 | 38.65 | 0.2 | 2.8 |
| 2−2 Coal | 6 | 0.658 | 0.24 | 1360 | 38.48 | 0.17 | 0.61 |
| Siltstone | 58 | 3.421 | 1.74 | 2360 | 38.66 | 0.16 | 3.44 |
| Advance Distance/m | Maximum Surface Subsidence/mm | FZH/m | Advance Distance/m | Maximum Surface Subsidence/mm | FZH/m |
|---|---|---|---|---|---|
| 100 | 36.16 | 62.70 | 500 | 3630.80 | 163.90 |
| 200 | 1949.00 | 98.10 | 600 | 3651.50 | 164.10 |
| 300 | 3020.80 | 114.10 | 700 | 3654.90 | 164.50 |
| 400 | 3591.00 | 145.20 | 800 | 3658.20 | 165.10 |
| Lithological | Average USCS |
|---|---|
| Sandy Mudstone | = (0.836 + 8.18 + 0.618 + 21.6 + 18.2)/5 = 9.89 |
| Siltstone | = (18.8 + 16.33 + 11.19)/3 = 15.71 |
| Fine-Grained Sandstone | = 18.48 |
| Medium-Grained Sandstone | = 18.32 |
| Coarse-Grained Sandstone | = (11.19 + 12.57)/2 = 11.88 |
| Lithological | Average USCS |
|---|---|
| Sandy Mudstone | = x |
| Siltstone | = (15.63 + 12.53 + 15.77 + 23.0 + 26.28 + 17.18)/6 = 18.40 |
| Fine-Grained Sandstone | = (17.1 + 19.27 + 21.3)/3 = 19.22 |
| Medium-Grained Sandstone | = 16.90 |
| Coarse-Grained Sandstone | = (13.97 + 16.51 + 16.82 + 12.55)/4 = 14.96 |
| Sandy Mudstone Thickness (h1) | Siltstone Thickness (h2) | Fine-Grained Sandstone Thickness (h3) | Medium-Grained Sandstone Thickness (h4) | Coarse-Grained Sandstone Thickness (h5) | Strata Thickness (H) | |
|---|---|---|---|---|---|---|
| J2z | 3.58 | 43.92 | 17.88 | 46.01 | 16.73 | 128.12 |
| J2y | 0 | 68.44 | 3.26 | 0 | 0 | 71.7 |
| Independent Variables | Dependent Variable | ||||||||
|---|---|---|---|---|---|---|---|---|---|
| Borehole Number | Mining Thickness (M)/M | Mining Depth (S)/M | Overlying Rock Thickness (H1)/M | Working Face Width (W)/M | Mining Velocity (V)/M/D | Weighted Average of USCS of Overburden ()/Gpa | Softening Factor (K) | Poisson’s Ratio (Μ) | FZH (H)/m |
| Y3 | 5.00 | 278.50 | 157.90 | 255.00 | 14.99 | 29.06 | 0.58 | 0.44 | 128.64 |
| Y4 | 5.00 | 279.30 | 160.44 | 297.00 | 10.81 | 29.92 | 0.56 | 0.50 | 138.33 |
| Y5 | 5.00 | 286.90 | 167.70 | 255.00 | 8.72 | 29.52 | 0.60 | 0.53 | 134.50 |
| Y6 | 5.00 | 275.80 | 129.30 | 255.00 | 15.00 | 34.42 | 0.51 | 0.23 | 118.29 |
| H3 | 4.50 | 243.48 | 158.18 | 300.00 | 5.29 | 27.71 | 0.61 | 0.35 | 109.39 |
| H4 | 4.50 | 242.18 | 158.56 | 300.00 | 5.29 | 26.67 | 0.55 | 0.34 | 114.05 |
| H5 | 4.50 | 242.90 | 156.80 | 300.00 | 5.29 | 27.90 | 0.57 | 0.34 | 108.88 |
| ZP1 | 3.50 | 208.00 | 135.00 | 192.20 | 4.88 | 25.30 | 0.51 | 0.30 | 96.30 |
| ZP2 | 3.50 | 188.00 | 120.00 | 192.20 | 2.77 | 26.90 | 0.53 | 0.28 | 84.80 |
| DZ1 | 6.00 | 269.80 | 175.00 | 350.00 | 11.30 | 20.50 | 0.63 | 0.22 | 136.50 |
| DZ2 | 6.00 | 273.40 | 178.90 | 350.00 | 10.00 | 18.75 | 0.63 | 0.23 | 132.65 |
| XSD1 | 5.80 | 309.96 | 214.50 | 350.00 | 10.50 | 17.11 | 0.49 | 0.18 | 157.46 |
| XSD7 | 5.47 | 310 | 239.60 | 350.00 | 12.00 | 21.12 | 0.70 | 0.20 | 156.36 |
| XSD2 | 5.53 | 294.61 | 211.15 | 350.00 | 10.50 | 16.02 | 0.65 | 0.23 | 153.96 |
| JT4 | 5.50 | 266.20 | 215.26 | 300.00 | 11.50 | 25.11 | 0.58 | 0.26 | 129.61 |
| JT6 | 5.50 | 265.70 | 199.80 | 300.00 | 11.50 | 27.36 | 0.63 | 0.24 | 119.18 |
| Mining Thickness | Mining Depth | Overlying Rock Thickness | Working Face Width | Mining Velocity | Compres-Sive Strength | Softening Factor | Poisson’s Ratio | ||
|---|---|---|---|---|---|---|---|---|---|
| FZH | Pearson Correlation (r) | 0.827 ** | 0.953 ** | 0.800 ** | 0.783 ** | 0.646 ** | −0.552 * | 0.447 | −0.168 |
| p | 0.000 | 0.000 | 0.000 | 0.000 | 0.007 | 0.027 | 0.083 | 0.533 | |
| (a) | |||||
| Control Variables | FZH | Mining Depth | Overlying Rock Thickness | ||
| -none- a | FZH | Correlation | 1.000 | 0.953 | 0.800 |
| p | - | 0.000 | 0.000 | ||
| df | 0 | 14 | 14 | ||
| Mining depth | Correlation | 0.953 | 1.000 | 0.729 | |
| p | 0.000 | - | 0.001 | ||
| df | 14 | 0 | 14 | ||
| Overlying rock thickness | Correlation | 0.800 | 0.729 | 1.000 | |
| p | 0.000 | 0.001 | - | ||
| df | 14 | 14 | 0 | ||
| Overlying rock thickness | FZH | Correlation | 1.000 | 0.900 | |
| p | - | 0.000 | |||
| df | 0 | 13 | |||
| Mining depth | Correlation | 0.900 | 1.000 | ||
| p | 0.000 | - | |||
| df | 13 | 0 | |||
| (b) | |||||
| Control Variables | FZH | Overlying Rock Thickness | Mining Depth | ||
| -none- a | FZH | Correlation | 1.000 | 0.800 | 0.953 |
| p | - | 0.000 | 0.000 | ||
| df | 0 | 14 | 14 | ||
| Overlying rock thickness | Correlation | 0.800 | 1.000 | 0.729 | |
| p | 0.000 | - | 0.001 | ||
| df | 14 | 0 | 14 | ||
| Mining depth | Correlation | 0.953 | 0.729 | 1.000 | |
| p | 0.000 | 0.001 | - | ||
| df | 14 | 14 | 0 | ||
| Mining depth | FZH | Correlation | 1.000 | 0.510 | |
| p | - | 0.052 | |||
| df | 0 | 13 | |||
| Overlying rock thickness | Correlation | 0.510 | 1.000 | ||
| p | 0.052 | - | |||
| df | 13 | 0 | |||
| Borehole No. | Measured | Fitted | Residual | Role | R2 | MSE |
|---|---|---|---|---|---|---|
| Y3 | 128.64 | 128.1314493 | 0.50855066 | training | 0.9722 | 11.1680 |
| Y4 | 138.33 | 130.624154 | 7.70584602 | training | ||
| Y5 | 134.5 | 134.7158739 | −0.21587391 | training | ||
| Y6 | 118.29 | 123.0760406 | −4.78604061 | training | ||
| H3 | 109.39 | 112.4510121 | −3.06101212 | training | ||
| H4 | 114.05 | 112.7202817 | 1.32971826 | training | ||
| H5 | 108.88 | 111.8705876 | −2.9905876 | training | ||
| ZP1 | 96.3 | 96.56931784 | −0.26931784 | training | ||
| ZP2 | 84.8 | 82.87597818 | 1.92402182 | training | ||
| DZ1 | 136.5 | 131.9540331 | 4.54596686 | training | ||
| DZ2 | 132.65 | 136.7946033 | −4.1446033 | training | ||
| XSD1 | 157.46 | 157.7009284 | −0.24092836 | training | ||
| XSD7 | 156.36 | 157.2740274 | −0.91402743 | training | ||
| XSD2 | 153.96 | 153.3356703 | 0.62432974 | test | 0.9505 | 10.2025 |
| JT4 | 129.61 | 126.6320541 | 2.97794593 | test | ||
| JT6 | 119.18 | 123.896958 | −4.71695798 | test |
Publisher’s Note: MDPI stays neutral with regard to jurisdictional claims in published maps and institutional affiliations. |
© 2022 by the authors. Licensee MDPI, Basel, Switzerland. This article is an open access article distributed under the terms and conditions of the Creative Commons Attribution (CC BY) license (https://creativecommons.org/licenses/by/4.0/).
Share and Cite
Miao, L.; Duan, Z.; Xia, Y.; Du, R.; Lv, T.; Sun, X. Analysis of Factors Influencing Mining Damage Based on Engineering Detection and Machine Learning. Sustainability 2022, 14, 9622. https://doi.org/10.3390/su14159622
Miao L, Duan Z, Xia Y, Du R, Lv T, Sun X. Analysis of Factors Influencing Mining Damage Based on Engineering Detection and Machine Learning. Sustainability. 2022; 14(15):9622. https://doi.org/10.3390/su14159622
Chicago/Turabian StyleMiao, Lintian, Zhonghui Duan, Yucheng Xia, Rongjun Du, Tingting Lv, and Xueyang Sun. 2022. "Analysis of Factors Influencing Mining Damage Based on Engineering Detection and Machine Learning" Sustainability 14, no. 15: 9622. https://doi.org/10.3390/su14159622