Abstract
Exploring a scientific and reasonable cross-regional carbon emission reduction path in China is essential to achieving sustainable development and the carbon neutrality target. This study constructs a simulation model of China’s cross-regional carbon emission reduction (CER) system and adopts a multi-agent approach to simulate cross-regional CER scenarios to predict the pathway. The conclusions are as follows: (1) under the national unified CER policy scenarios, carbon emissions are on a continuous growth trend with fast economic growth not matching emission reduction efforts in Scenario I. Scenario II has a lower economic scale, and carbon emissions peak in 2029. Scenario III has smooth economy and reaches the carbon emission peak in 2026. The economy of Scenario IV grows fast, carbon emissions grow slowly, and the peak does not appear in 2030. (2) In three scenarios with provinces as the main agent for CER, if provinces sacrifice the economy to strengthen CER, the peak of carbon emissions will appear in 2020. While the economy of non-synergistic and synergistic CER scenarios in each province is growing steadily, the peak in two modes is reached in 2026 and 2032. The peak is reached four years earlier in 2026 in the synergistic model and 2032 in the non-synergistic model, and the economic growth of some energy-intensive provinces slows down. (3) The synergistic low-carbon model is best for balancing economic development and carbon emission control. Policy recommendations are presented based on the above findings for China’s CER and sustainable development.
1. Introduction
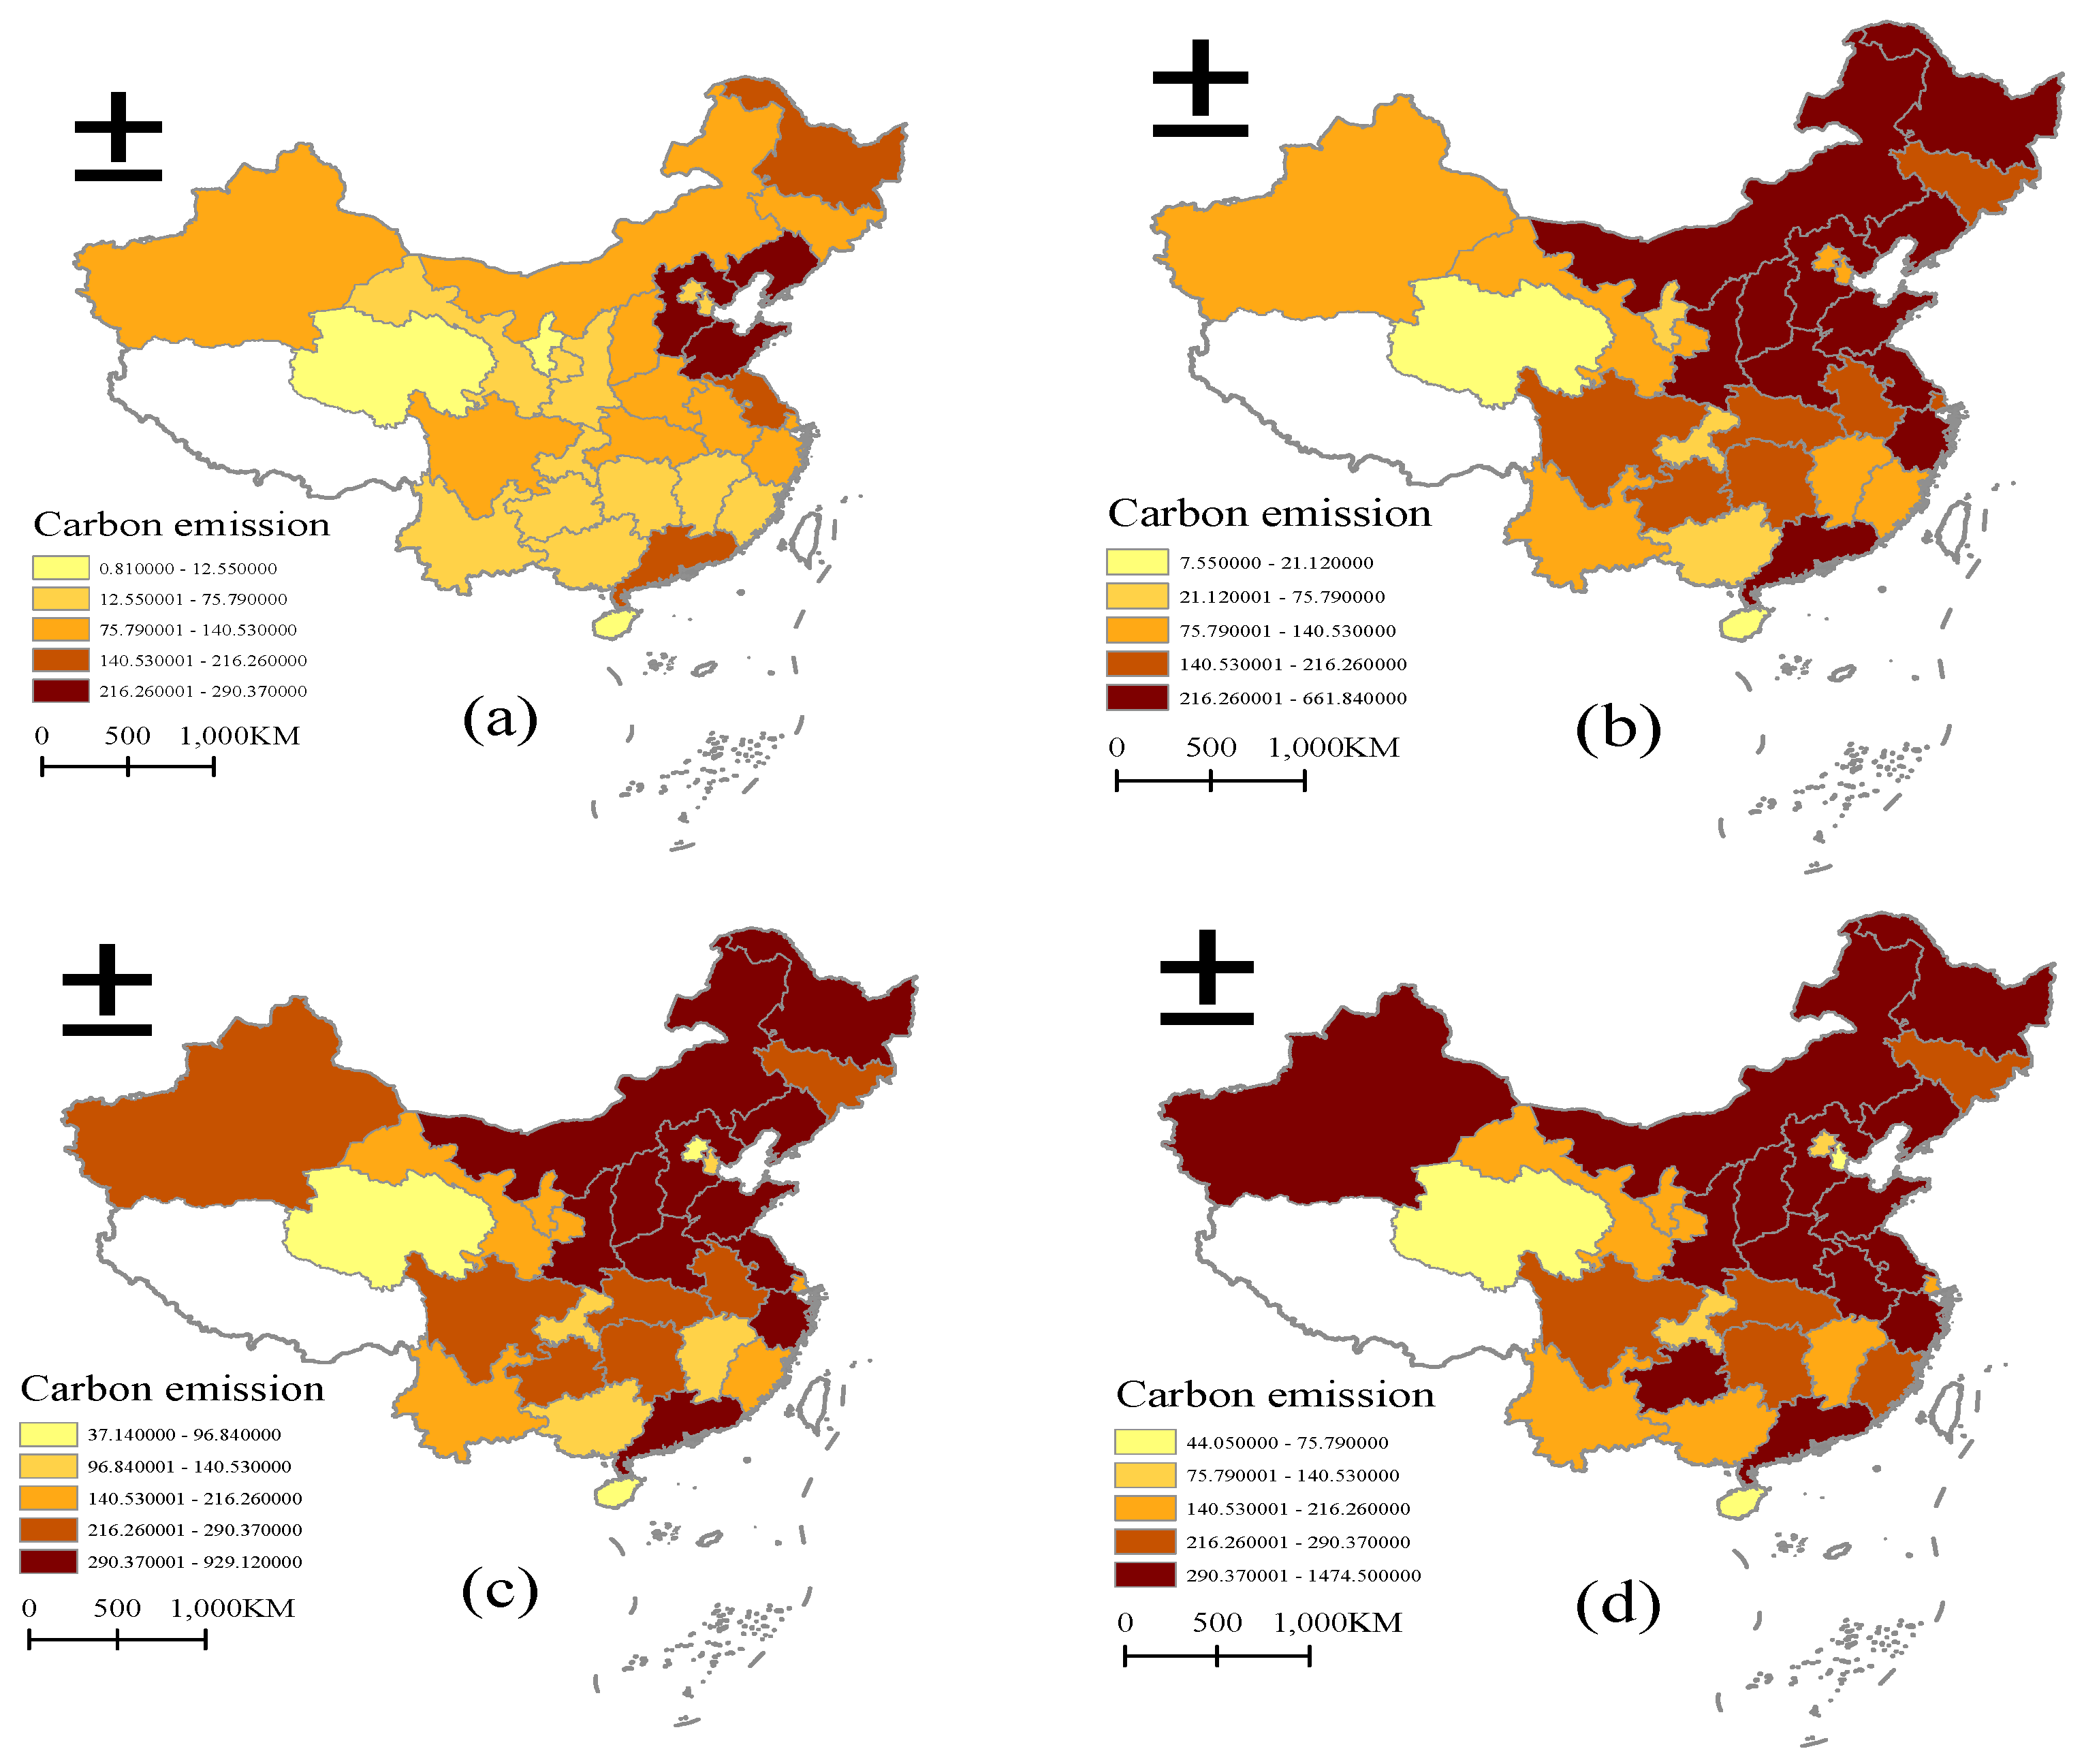
Control of greenhouse gases and attainment of sustainable development have become serious challenges faced by many countries worldwide, especially developing countries [1,2]. China is at a critical stage of rapid urbanization and industrialization, and conducting economic and social construction and ecological and environmental protection in a gentle and coordinated manner has become an urgent issue for China to solve [3]. In September 2020, China proposed to peak CO2 emissions by 2030 and achieve carbon neutrality by 2060. To accomplish the daunting task, the government has set a “30–60” emission reduction target to achieve emission reductions in various areas. It is necessary to promote China’s transition from traditional sloppy economic growth to a green, low-carbon, and sustainable development approach to achieve the “30–60” emission reduction target. As shown in Figure 1, China’s carbon emissions are still climbing extremely fast in the 21st century, and carbon emissions show significant differences between regions [4,5]. Local governments’ control of CO2 emissions is constrained by the dual objectives of environmental protection and economic growth, especially for gaseous pollutants, which have significant regional mobility and lead to significant negative externalities of CO2 emissions. Local governments are unwilling to bear the cost of reduced economic growth in their jurisdictions and are more willing to transfer the cost of pollution control to other jurisdictions in a “beggar-thy-neighbor” mentality. Therefore, for carbon emission reduction (CER), not only should the overall national perspective be considered but also the regional distribution of CER. In addition, CER needs to consider the dual objectives of economic growth and environmental protection and realize the task decomposition of cross-regional emission reduction under the dual objectives. CER also needs to consider the dual-target constraints of economic growth and environmental protection and achieve the task decomposition of cross-regional emission reduction under the dual targets. Therefore, achieving cross-regional decomposition of CER under the dual constraints of environmental protection and economic growth is crucial for achieving the “30–60” emission reduction target [6]. The task decomposition of CER under the dual constraint of environmental protection and economic growth is crucial to achieving the “30–60” emission reduction target as soon as possible [7].
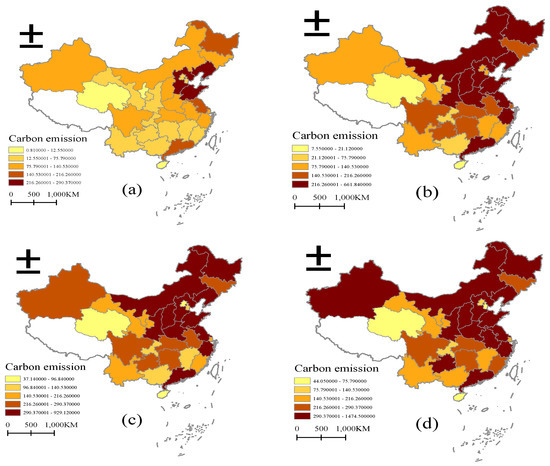
Figure 1.
Spatial distribution of carbon emissions: (a–d) represent the carbon emissions of each province in China in 2000, 2005, 2010, and 2015; darker color means higher carbon emissions.
As important bearers of emission reduction, regional subjects gradually free economic development from dependence on fossil energy by continuously increasing carbon and renewable energy utilization rates, thus reducing greenhouse gas emissions. Regional economic development is uneven in all economies, and differentiated development inevitably leads to emerging early- and late-developing regions [8]. Regional development unevenness is reflected in both the economic development and the industrial structure, energy consumption patterns, and other factor endowments. At the same time, regional carbon emissions also have strong spatial convergence and spatial correlation characteristics, and the existing gradient development pattern also strengthens the spatial agglomeration effect. Regional cooperation in emission reduction realizes the complementary advantages among regional subjects and activates the synergistic effect of emission reduction. On the one hand, regional cooperation in emission reduction reduces information asymmetry among local regional governments and increases each region’s willingness to invest in emission reduction [9]. Regional cooperation reduces the transaction cost of CO2 and increases the benefits of inter-regional cooperation in emission reduction. On the other hand, because “air basins” boundaries differ from regional administrative boundaries, regional cooperation in emission reduction is a more effective mechanism to deal with air pollution dispersion and transboundary pollution control. For this reason, effective coordination of the benefits of each subject in the agglomeration space and promoting interregional cooperation in emission reduction can reduce the negative externalities of CO2 emissions [10].
In the existing literature, studies on synergistic CER have mainly focused on the national and industry levels. At the same time, considering the mobility and “negative externalities” of CO2, studies on cross-regional synergistic CR at the provincial level still exhibit a research gap. Therefore, this study simulated multi-scenario and cross-regional CER situations, use relevant energy data of provinces in China, and build a cross-regional CER compliance system. Furthermore, we used multi-agent models to simulate CER situations under different scenarios, predict cross-regional CER patterns and conduct corresponding simulations, and seek ideal patterns and optimization paths for cross-regional CER. The contributions of this study are as follows: first, the multi-agent model was used to simulate the emission reduction situation in each Scenario to select a future emission reduction path; second, past studies on CER mostly focus on the national level, but this paper tries to predict CER results from the inter-provincial level and then find the most effective emission reduction path. Third, this study selects multiple future scenarios for simulation, which is more comprehensive than the simulation of a single scenario and provides more options for selecting future emission reduction paths.
The research framework is as follows: Section 2 is a review and summary of relevant literature on cross-regional CER synergistic mechanisms; Section 3 is a description of the research methodology and the sources of data; Section 4 is an analysis of the system simulation process and results, including the simulation of the emission reduction system under unified policies, the simulation of the multi-entity synergistic and non-synergistic emission reduction system, the simulation of the CER system under the multi-entity enhanced low-carbon model, and the carbon emission under different contexts; Section 5 presents conclusions and makes relevant policy recommendations based on the analysis and discussion in the preceding sections.
2. Literature Review
Since the goal of carbon neutrality was proposed in the United Nations General Assembly in 2020, China, as the largest energy producer and consumer, has become a flashpoint in discussions at all levels of society, while the academic community has been conducting research on carbon emissions from various perspectives. This section summarizes and reviews the international research results on CER and multi-agent theory.
2.1. Literature on Carbon Emission Reduction
In recent years, the research directions in the international literature related to CR have mostly focused on the pathways of [11,12], modalities and methods regarding [13], and factors influencing CER [14]. Table 1 shows the relevant literature on carbon reduction.
In the study of CER pathways, Yong (2018) evaluated the carbon emission effects of industrial enterprises in 30 provinces, identified 11 lagging regions that did not meet the reduction targets, and noted that the reduction targets could be set flexibly based on maintaining feasibility and equity [15]. Zhong (2018) used the method of great likelihood estimation to evaluate energy efficiency in 84 countries and simulated the combination of influencing factors [16]. The results indicated that the energy and economic structures must be further optimized to achieve carbon emission reduction targets while maintaining a stable growth of human capital and capital stock.
The ways and methods of carbon emission reduction can be divided into many categories; the first concerns policies related to low carbon development. Jia and Lin (2020) analyzed the differences between carbon trading and carbon tax policies and their effects on the economy, environment, and energy through a recursive dynamic computable general equilibrium model and report that both have strong emission reduction effects [17]. In addition, Li and Peng (2020) compared two types of carbon tax policies, incentive-based and penalty-based, using the DSGE framework, and showed that incentive-based CER policies are more conducive to harmonizing economic and environmental development [18]. For example, Li (2019) used a spatial econometric model to analyze the impact of green technology innovation on carbon efficiency in 32 developed countries and concluded that green technology innovation indirectly affects carbon efficiency through economic development and urbanization [19]. Xiong and Sun (2022) analyzed the mixed effect of green finance and carbon dioxide emissions using fuzzy set qualitative analysis and concluded that green finance has a suppressive effect on carbon emissions. Finally, other related emission reduction approaches [20]. Toptal (2013) used an economical subscription model to analyze the effectiveness of CER investment [21]. The consequences showed that CER investment could further reduce CO2 emissions and associated costs. Yu (2017) constructed a potential model based on a dynamic system when studying the carbon emissions of China’s power industry [22]. Via operation of the model, it was found that the carbon dioxide emission can be controlled to some extent and that the adjustment of the power structure and the improvement of technical levels can effectively reduce carbon dioxide emission.
In research on the relevant influencing factors of carbon emission reduction, Zhang (2017) used SGMM technology to evaluate the impact of environmental innovation on carbon emission reduction [23]. According to the research results, among many environmental innovation measures, innovation in energy efficiency has the most obvious inhibitory effect on carbon dioxide emission, while innovative resources and knowledge innovation also play a large role in the process of carbon emission reduction. Cai et al. (2021) used the spatial panel econometric model based on the STIRPAT equation to explore whether the development of green technology innovation will impact carbon dioxide emissions [24]. The results show that green technology innovation affects carbon emission reduction in the central and eastern regions but can promote the western region. Li (2020) explored the impact of innovation R&D investment on carbon emission mitigation using a dataset of 52 state-owned enterprises and showed that innovation R&D investment is one of the most important factors for carbon emission mitigation [25]. However, the marginal effect of carbon emission mitigation decreases with increasing innovation R&D investment and technological progress.
2.2. Literature on Cross-Regional Carbon Emission Reduction
The national goal of carbon emission reduction at the macro level ultimately needs to be implemented at the regional level. China’s urbanization is at an important stage of strategic transformation and is still facing “unbalanced, uncoordinated and unsustainable development”, with urbanization and industrialization, as well as the imbalance between various regions [26]. Promoting urbanization requires exploring a balanced, coordinated, and sustainable development path. Low-carbon development and balanced and coordinated regional developments are both challenges and opportunities. In this context, regional carbon emission reduction research is increasing and has become a hot issue.
Regional entities with clear boundaries are important players in CO2 emission reduction. They are gradually reducing their dependence on fossil energy for economic development by increasing the utilization of carbon and the share of renewable energy, thus reducing greenhouse gas emissions. There are great differences in CO2 emissions between regions. At the same time, regional carbon emissions also have strong spatial convergence and spatial correlation characteristics, and the existing gradient development pattern also strengthens the spatial agglomeration effect. As a kind of public good, the carbon emissions space is non-competitive and non-exclusive, and under the condition of non-cooperative emission reduction, the phenomenon of freeriding often occurs, which leads to the “tragedy of the commons”. Therefore, coordinating the interests of various actors in the agglomeration space and promoting inter-regional cooperation in emissions reduction can effectively reduce the negative externalities of carbon emissions. For example, Bahn found that cross-regional carbon trading is an important emission reduction path, and regional synergistic emission reduction realizes the complementary advantages of the domain subjects and activates the synergistic effect of emission reduction [27]. Zhang suggest that some cooperative carbon reduction practices can generate significant environmental benefits in the Chinese steel industry, but the impact on improving economic benefits is unclear [28]. Zakeri studied the emission reduction strategies of upstream and downstream firms in the supply chain in the face of environmental regulations [29]. The study found that under the condition of full cooperation, the profit and emission reduction efficiency of enterprises are optimal.
2.3. Literature on Muti-Agent Model and Carbon Reduction
The synergy of the system as a whole is an important reference for the distribution of emission reduction benefits and the assessment of emission reduction performance. The development of a scientific and reasonable method for measuring synergy is an effective prerequisite.
Multi-agent models can be used to deal with complex systems and have more applications in the process of CER. For example, Tang (2015) used a multi-agent model to investigate the effect and impact of carbon emissions trading on CER in China, and the simulation showed that the carbon emissions trading mechanism could effectively reduce CO2 emissions [30]. However, it will have a certain hindering effect on economic development. Similarly, Yu (2020) also used a multi-agent model to predict the effect of carbon trading policies and found that setting emission reduction targets leads to uncertainty in the price of allowances and affects the output [31]. Hwab (2020) used a multi-agent model and a system dynamics model to simulate the effect of a single policy to reduce carbon emissions in transportation without peaks [32]. However, multiple scenarios showed that the combination was more effective and had greater economic benefits than a single policy. Bouziane (2021) used a hybrid artificial neural network (ANN) and agent-based approach to simulate CO2 emissions from different energy sources in Annaba and predicted that renewable energy sources could help reduce CO2 emissions by 369 tons per day (3%) [33]. Xu (2021) introduced a nonlinear multi-intelligence inter-temporal optimization model to predict CO2 emissions over some time [34]. They showed that the 2030 carbon peak target could not be reached in either of the U.S. and Japanese preference scenarios and that technological advances and innovation are the main ways to reduce CO2 emissions in all stages of the reduction process.

Table 1.
Sample of the current literature on carbon reduction.
Table 1.
Sample of the current literature on carbon reduction.
| Authors | Period | Data | Method | Results |
|---|---|---|---|---|
| Wang et al. [8] | 2005–2017 | Panel data | Super-efficiency SBM | PO-CO2 ↓ |
| Li and Peng [18] | 1996–2018 | Panel data | DSGE framework | CT ↑-CO2 ↓ |
| Xiong [20] | 2003–2017 | Panel data | fsQCA | GF ↑-CO2 ↓ |
| Yu et al. [31] | 2003–2011 | Panel data | Potential model based on dynamic system | PS ↑, TL ↑-CO2 ↓ |
| Zhang [23] | 2006–2013 | Panel data | SGMM, PSM-DID | EI ↑-CO2 ↓ |
| Xu et al. [34] | 2015 | Statistical data | NL-MIOM | TL ↑-CO2 ↓ |
| Cai et al. [24] | 2006–2019 | Panel data | Space panel econometric model | GI ↑-CO2 ↓ |
| Tang et al. [30] | 2007 | Statistical data | Multi-agent model | CET-CO2 ↓ |
| Wang and Li [14] | 1996–2010 | Panel data | Financial expenditure | FE ↑-CO2↓ |
2.4. Literature Gap
In summary, the CR issue has become the focus of international academic circles, and scholars have studied it from multiple dimensions and obtained great research results. Due to the mobility of CO2 and the obvious “negative externality”, the research progress of cross-regional synergistic emission reduction has been hindered. In addition, the research on synergistic emission reduction is mainly focused on the national, industry, and enterprise levels, and the research on regional synergistic emission reduction is still rare. Based on this, the contributions of this study are as follows: first, this paper analyzes the cross-regional CR problem through a multi-agent model by treating provinces as independent individuals so as to find effective emission reduction paths and mechanisms that satisfy both economic development and environmental protection and contribute to the enrichment of CR-related theories. Second, this study selects multiple future scenarios for simulation, which is more comprehensive than the simulation of a single scenario and provides more options for the selection of future emission reduction paths.
3. Method and Data
3.1. Method
According to theory related to the coordinated development of energy–economy–environment systems, this study designed a cross-regional CER composite system of China as a dynamic and complex system with provinces and cities as heterogeneous independent subjects [35,36]. Each subject is interrelated and interacts with each other, analyzing the exchange relationship between various influencing variables in the system, constructing a cross-regional CER composite system model, and adjusting decision variables [37,38]. Furthermore, we set predicted cross-regional CER models and conducted corresponding simulations to seek the ideal model and optimization path of cross-regional CER.
3.1.1. Energy Subsystem
In the energy subsystem, total energy consumption, energy consumption per unit of GDP, and energy consumption per capita were taken as decision variables, and carbon emission per unit of GDP, energy consumption per capita, and energy intensity of GDP were prompted to establish correlations with economic development, population, and carbon emission systems.
In Equation (1), Energyi denotes the scale of provincial energy consumption; ECi denotes the total amount of energy consumed in category i; ηi denotes the energy conversion factor in category i into standard coal. As the consumption of various energy sources in the original statistics are physical, they must be converted into standard statistics when measured. According to the China Energy Statistical Yearbook caliber, the final energy consumption types are divided into nine categories (Raw Coal, Coke, Crude Oil, Gasoline, Kerosene, Diesel, Fuel Oil, Liquefied Petroleum Gas, Natural Gas). The conversion coefficients of the nine categories of energy are shown in Table 2. After calculating the energy consumption of each province, we built the energy system model. Table 3 shows the equations of the model.
Table 2.
Energy conversion factor.
Table 3.
Energy subsystem.
3.1.2. Carbon Emissions Subsystem
This report constructs a carbon emissions subsystem with CO2 emissions as the level variable (flow rate variable), CO2 emission changes as the rate variable (flow rate variable), and auxiliary variables including energy intensity per unit of GDP and carbon emission intensity.
In Equation (2), represents the carbon emissions of province i in t year, is the j energy consumption in province i in t year, and 𝜂𝑗 is the carbon emission factor of the j energy consumption (Table 2). We then built the carbon emission system; Table 4 shows the equations used to construct the carbon emission system model.
Table 4.
Carbon emission subsystem.
3.1.3. Population System
During the construction of the population system, the total population is used as the rate variable (flow rate variable), the flow rate variable (rate variable) is the annual natural growth population and the annual net migration population of the region, and the auxiliary variables include the natural growth rate and the net migration rate of the population. Table 5 shows the equations used to construct the population system model.
Table 5.
Population subsystem.
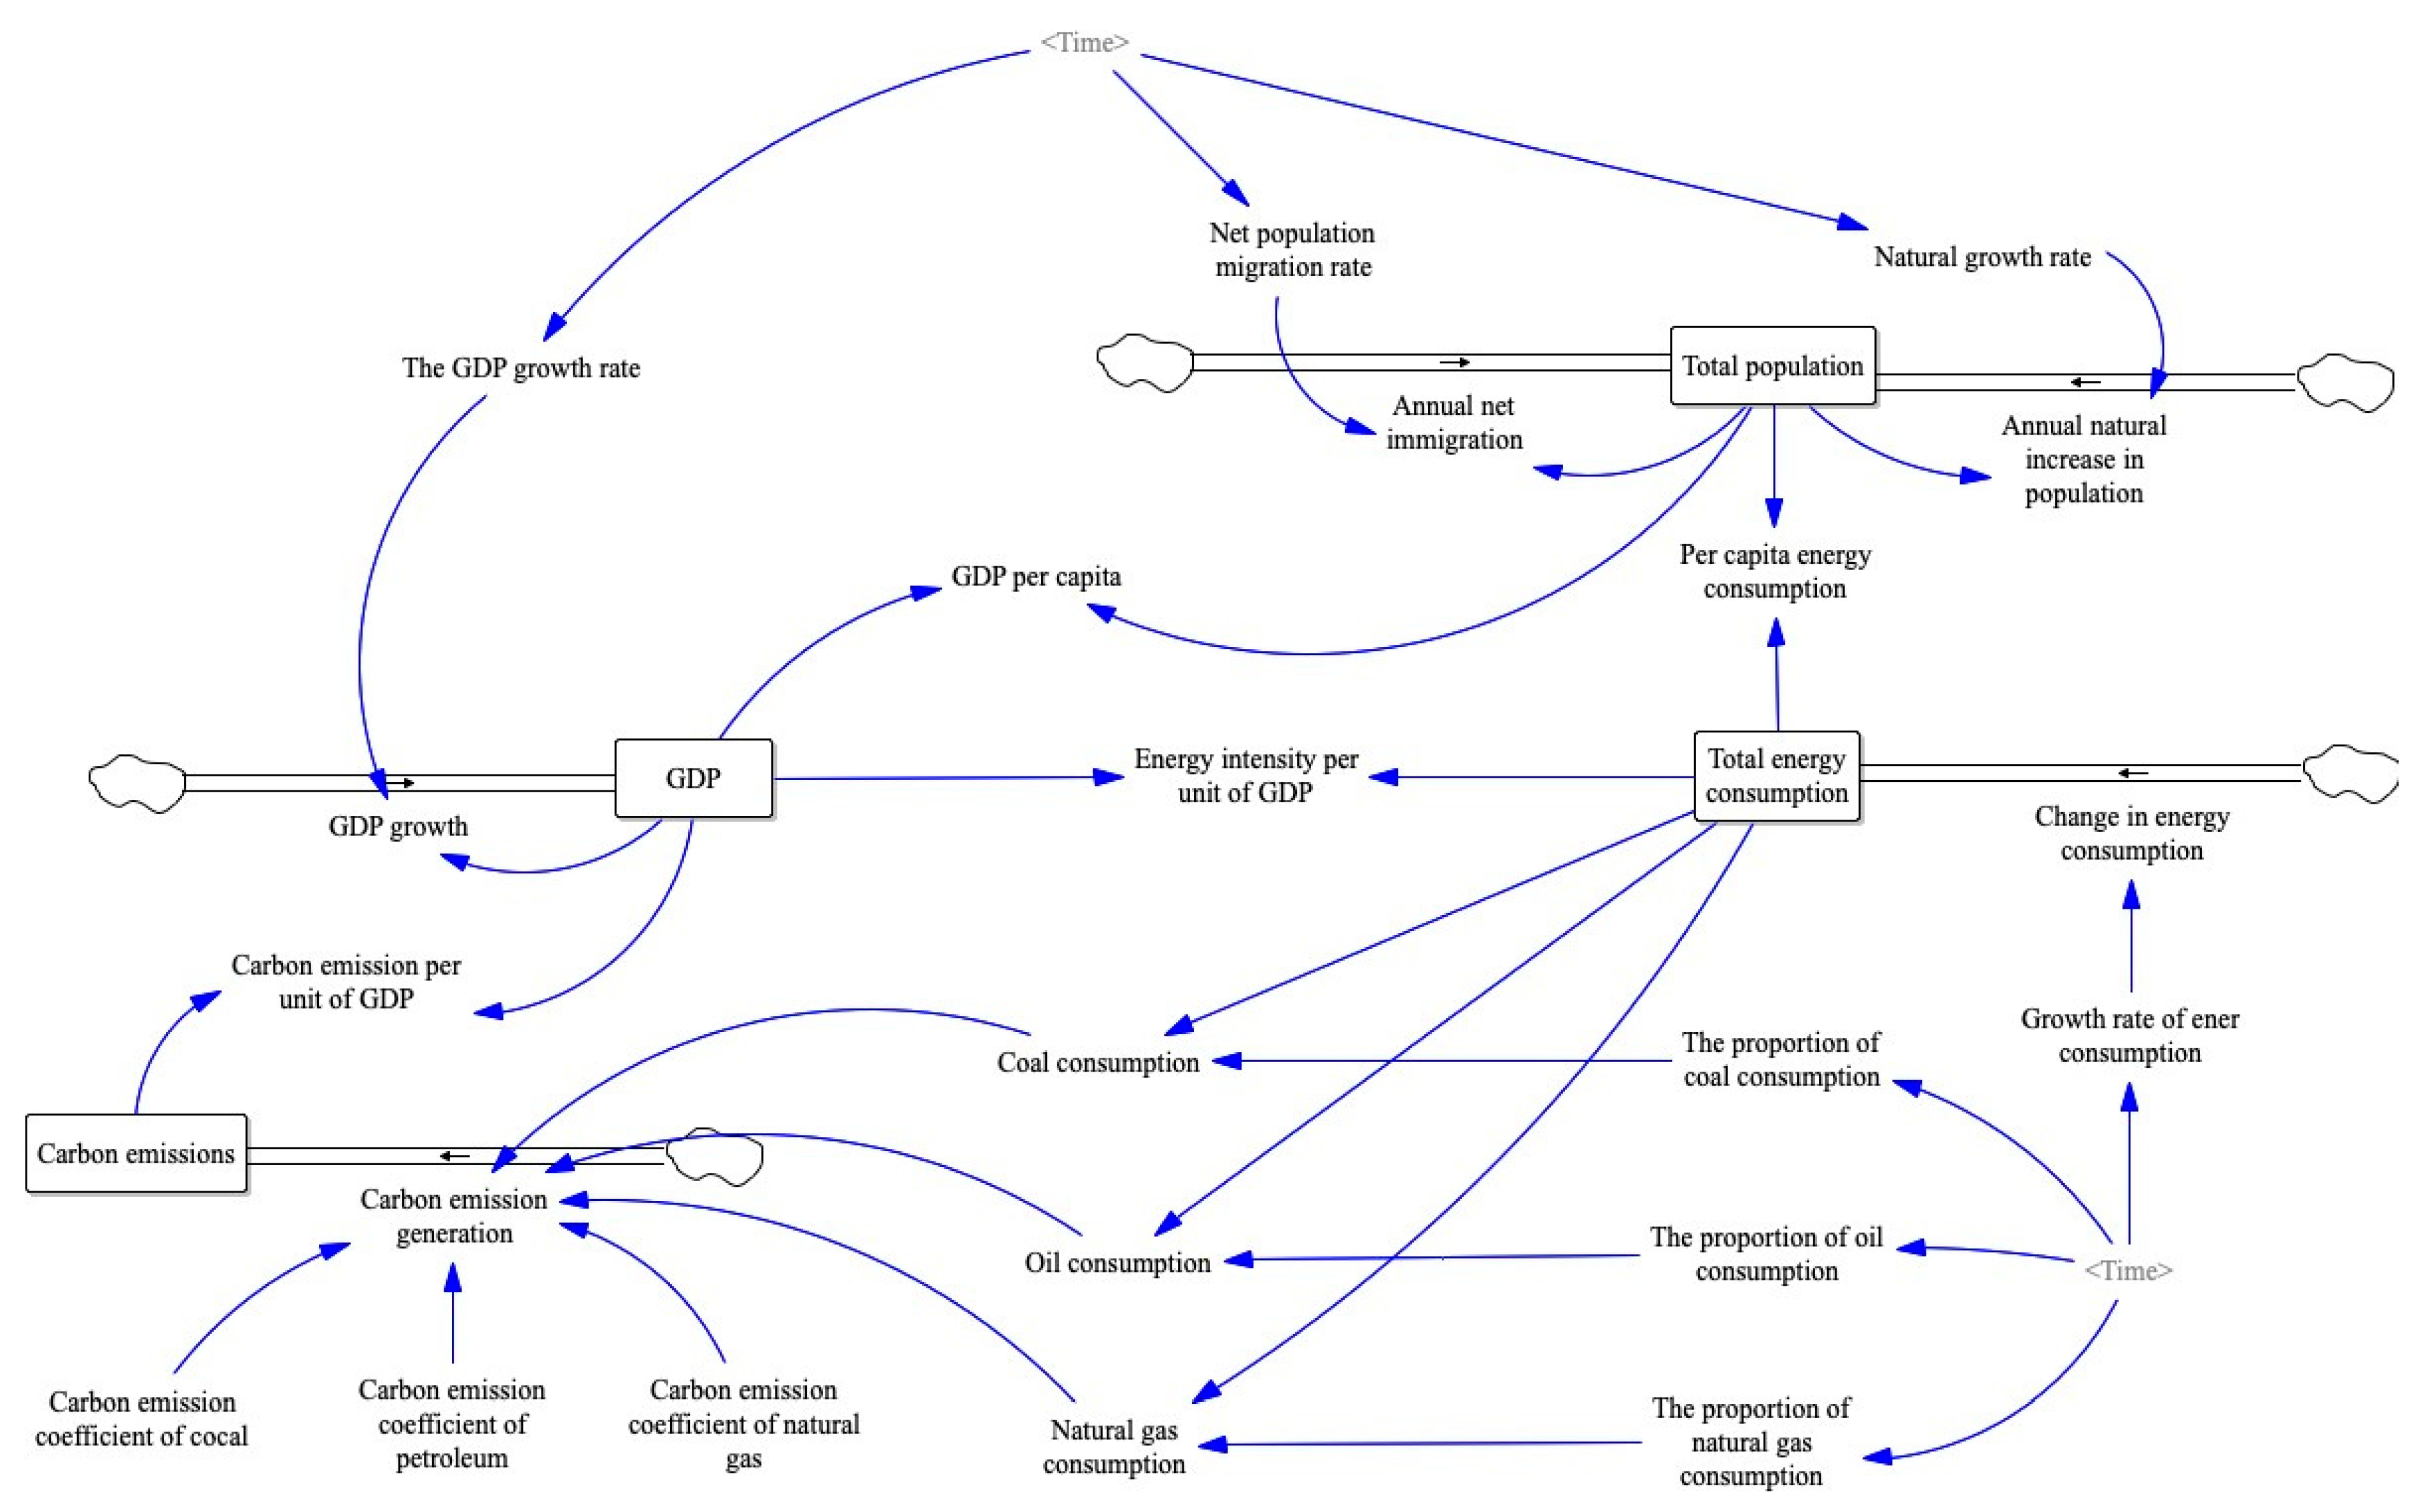
This study develops simulation models covering composite systems such as energy, carbon emission, and population systems, and UML language is introduced into the model simulation domain (Figure 2).
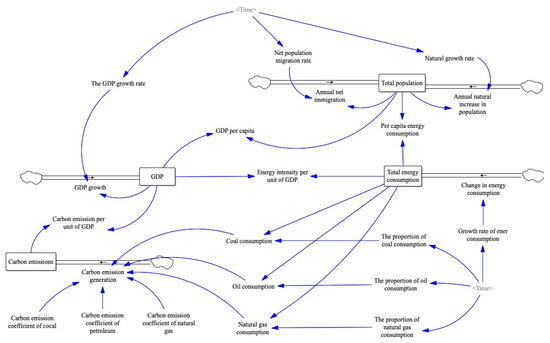
Figure 2.
Simulation model of cross-regional CER composite system.
3.2. Scenario Setting
3.2.1. Harmonization of CER Policy Scenarios
We set 2016 as the base year, and different decision variables were set to uniformly regulate the national cross-regional CER model between 2017 and 2035. The gross regional product growth rate was chosen as the decision variable affecting economic growth because energy consumption is the material basis of economic growth. Large energy consumption increases regional carbon emissions, closely related to economic growth and energy dependence. Using the natural population growth rate as a decision variable allows the population size to be adjusted. Especially now that China’s two-child policy is fully liberalized, the population is one of the main factors responsible for carbon emissions.
Consequently, the natural population growth rate of the region will change, which will affect the population size, which in turn will affect carbon emissions. Energy structure is one of the main factors affecting carbon dioxide emissions, and the great potential of regional CER often comes from the optimization of regional energy structure. Since China’s energy consumption structure is dominated by high-energy fossil fuels such as coal and oil, the proportion of coal, oil, natural gas, and non-fossil energy in total energy consumption is the decision variable for adjusting energy structure. The decision variables selected in this study can all have different degrees of impact on carbon emissions and energy consumption at the direct or indirect level, so the strategy of optimizing the energy structure was adopted by increasing the share of natural gas and non-fossil energy and decreasing the share of coal and oil to different degrees. Then, four development model scenarios were set, as shown in Table 6.
Table 6.
National system decision variable value setting.
Scenario I (economic light emission reduction model): this model attaches importance to rapid economic development, and although a relatively high CER intensity is set, if rapid economic development is blindly pursued, it is easy to ignore the high energy consumption and carbon emissions that come with it, leading to an energy crisis. The model sets China’s economy at a high growth rate and GDP growth rate to a large value. Along with the economic development, the annual population growth rate is high. In terms of energy structure, the proportion of coal is continuously reduced, and the proportion of non-fossil energy is increased. The proportion of coal in this scenario is relatively high compared to other scenarios, reducing the proportion of other renewable energy sources. In terms of the energy mix, the share of coal decreases, and the share of non-fossil energy increases.
Scenario II (low-carbon model): this model pursues energy conservation and consumption, with the main objective of reducing carbon emissions and achieving a low-carbon transition. This model sets China’s economy to develop at a relatively low growth rate, setting the range of GDP growth rate in each region to relatively small values. Despite this, China’s government has liberalized the two-child policy because of the large base of China’s population. From a conservative perspective, this scenario assumes that the natural population growth rate will increase smoothly at a relatively low rate, environmental policy is strong, and the energy structure continuously adjusts the proportion of coal, oil, and natural gas used by reducing the proportion of coal in the energy consumption structure, constantly optimizing the energy structure to reduce carbon emissions.
Scenario Ⅲ (balanced development model): different from Scenario I, this model focuses on the integrated and coordinated development of economic development, energy consumption, and carbon emission. The economic growth rate under this scenario is set higher than Scenario II and lower than Scenario I. The annual natural population growth rate is set lower than under Scenario I. Considering that this scenario focuses on the coordinated development of economic growth and carbon emissions, from the perspective of energy structure, adopting a balanced development model will promote further optimization of energy consumption structure. Therefore, this scenario is set to relatively increase the proportion of non-fossil energy in the energy consumption structure and decrease the proportion of coal in the energy structure.
Scenario IV (economic emission reduction model): this model simultaneously focuses on economic development and CER. In this scenario, the economic growth rate is the same as Scenario I, and promotes high economic development and moderate population growth, just like Scenario III. It concentrates on optimizing the energy structure while setting the proportion of coal to decrease relatively quickly and the proportion of non-fossil energy and natural gas to increase rapidly, like Scenario II.
3.2.2. Simulation of CER System in Multi-Agent Collaborative Mode
Provinces, as the main bodies, formulated their own 13th Five-Year Energy Plan based on the national 13th Five-Year Plan, continuously adjusted their energy structure while ensuring GDP growth at a relatively stable rate, and then collaborated among the other main bodies for energy-sharing and carbon-trading to accomplish the task of emissions reduction. Some of China’s major economic provinces, such as Shandong, Shanxi, Xinjiang, Henan, and Hebei, should take the initiative to assume greater responsibility and lead, both in terms of their important strategic position in national economic development and terms of energy consumption and economic development.
In the simulation of a CER system in a multi-agent enhanced low-carbon model, according to the CER tasks issued by the state, each province undertook the primary purpose of completing said tasks, controlling their economic growth rates to reduce energy consumption, accelerating the adjustment of their energy structures, and sacrificing the economy to reduce carbon emissions as necessary.
3.3. Data
The data used in this study were obtained from the China Statistical Yearbook, the China Energy Statistical Yearbook, and provincial statistical yearbooks; the few missing data were interpolated to complete the datasets. Carbon emissions are calculated based on the apparent energy consumption method and carbon emission factors.
4. Results and Discussion
4.1. Simulation of a CER System under a Unified Abatement Policy
The analysis of the simulation results aimed to explore a more desirable model for CER across regions. Figure 3, Figure 4, Figure 5 and Figure 6 show the trend of the indicator variables derived from the simulation model that was run, and Table 7 shows the simulated values of the indicators derived from the simulation model that was run.
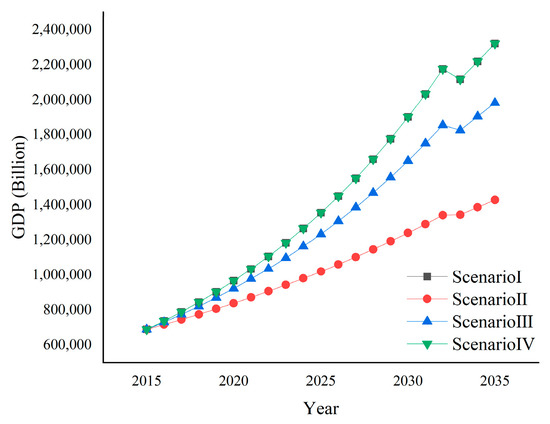
Figure 3.
The projection trends for GDP.
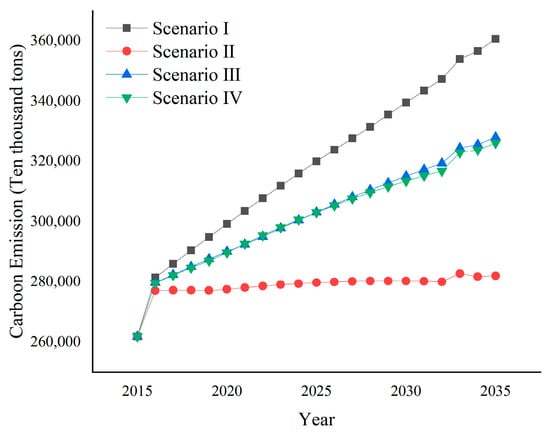
Figure 4.
The projection trends for energy consumption.
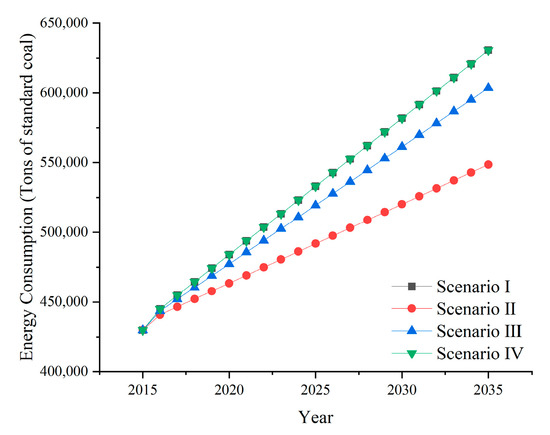
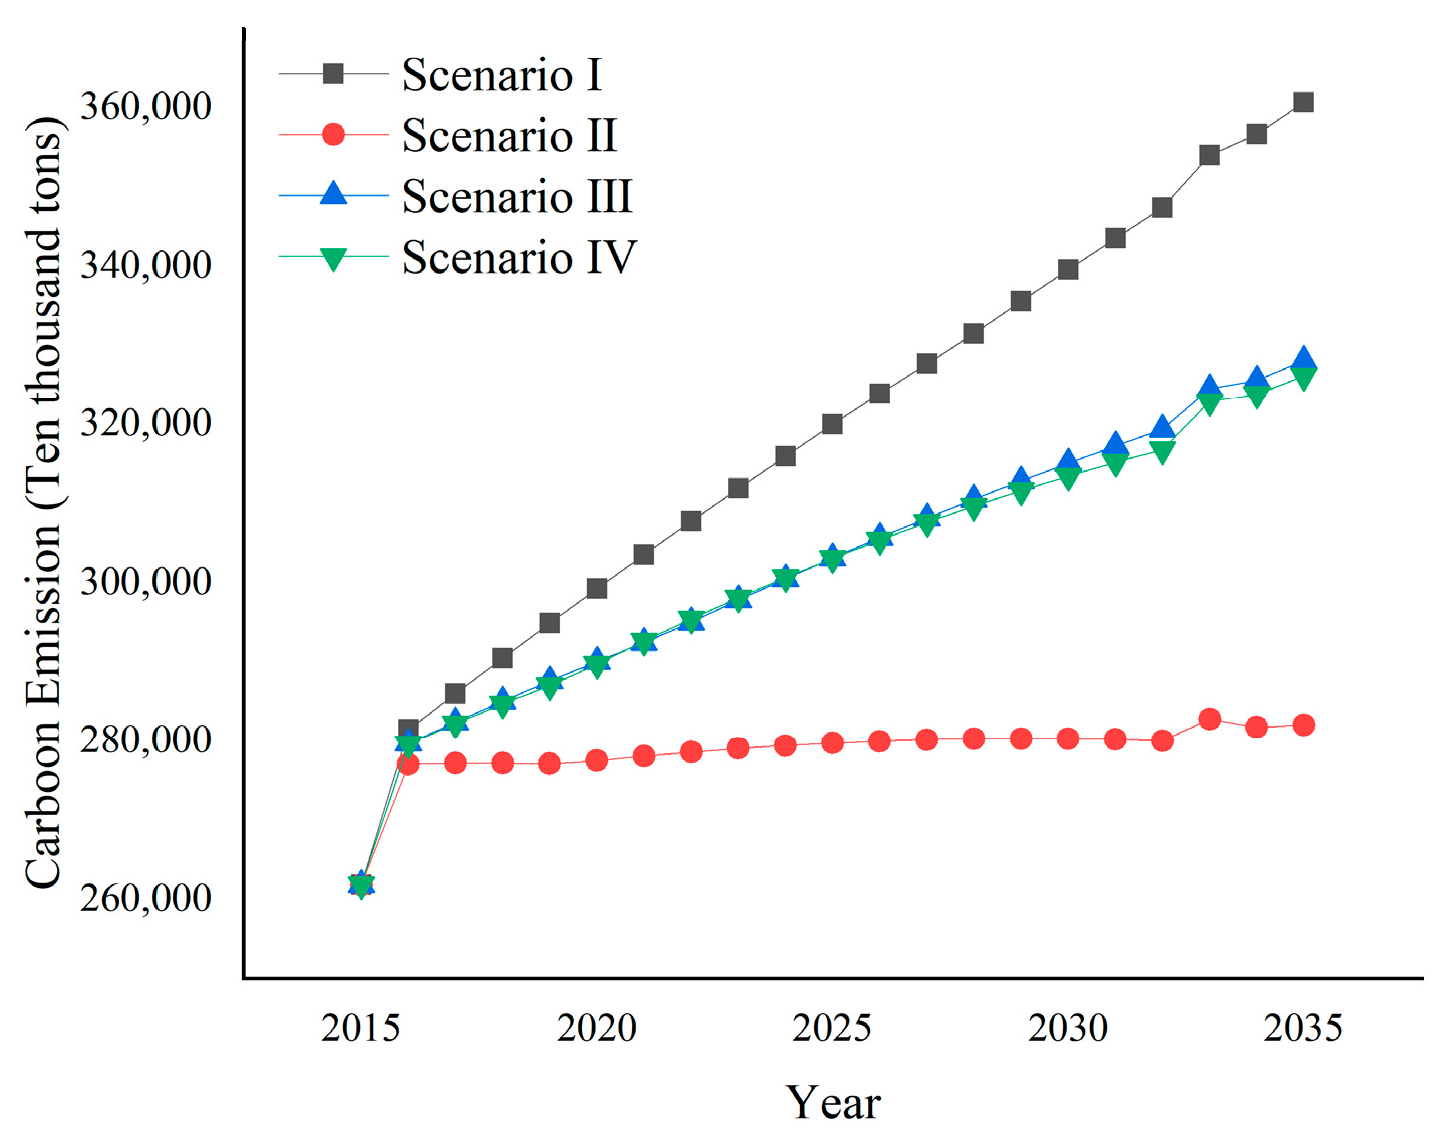
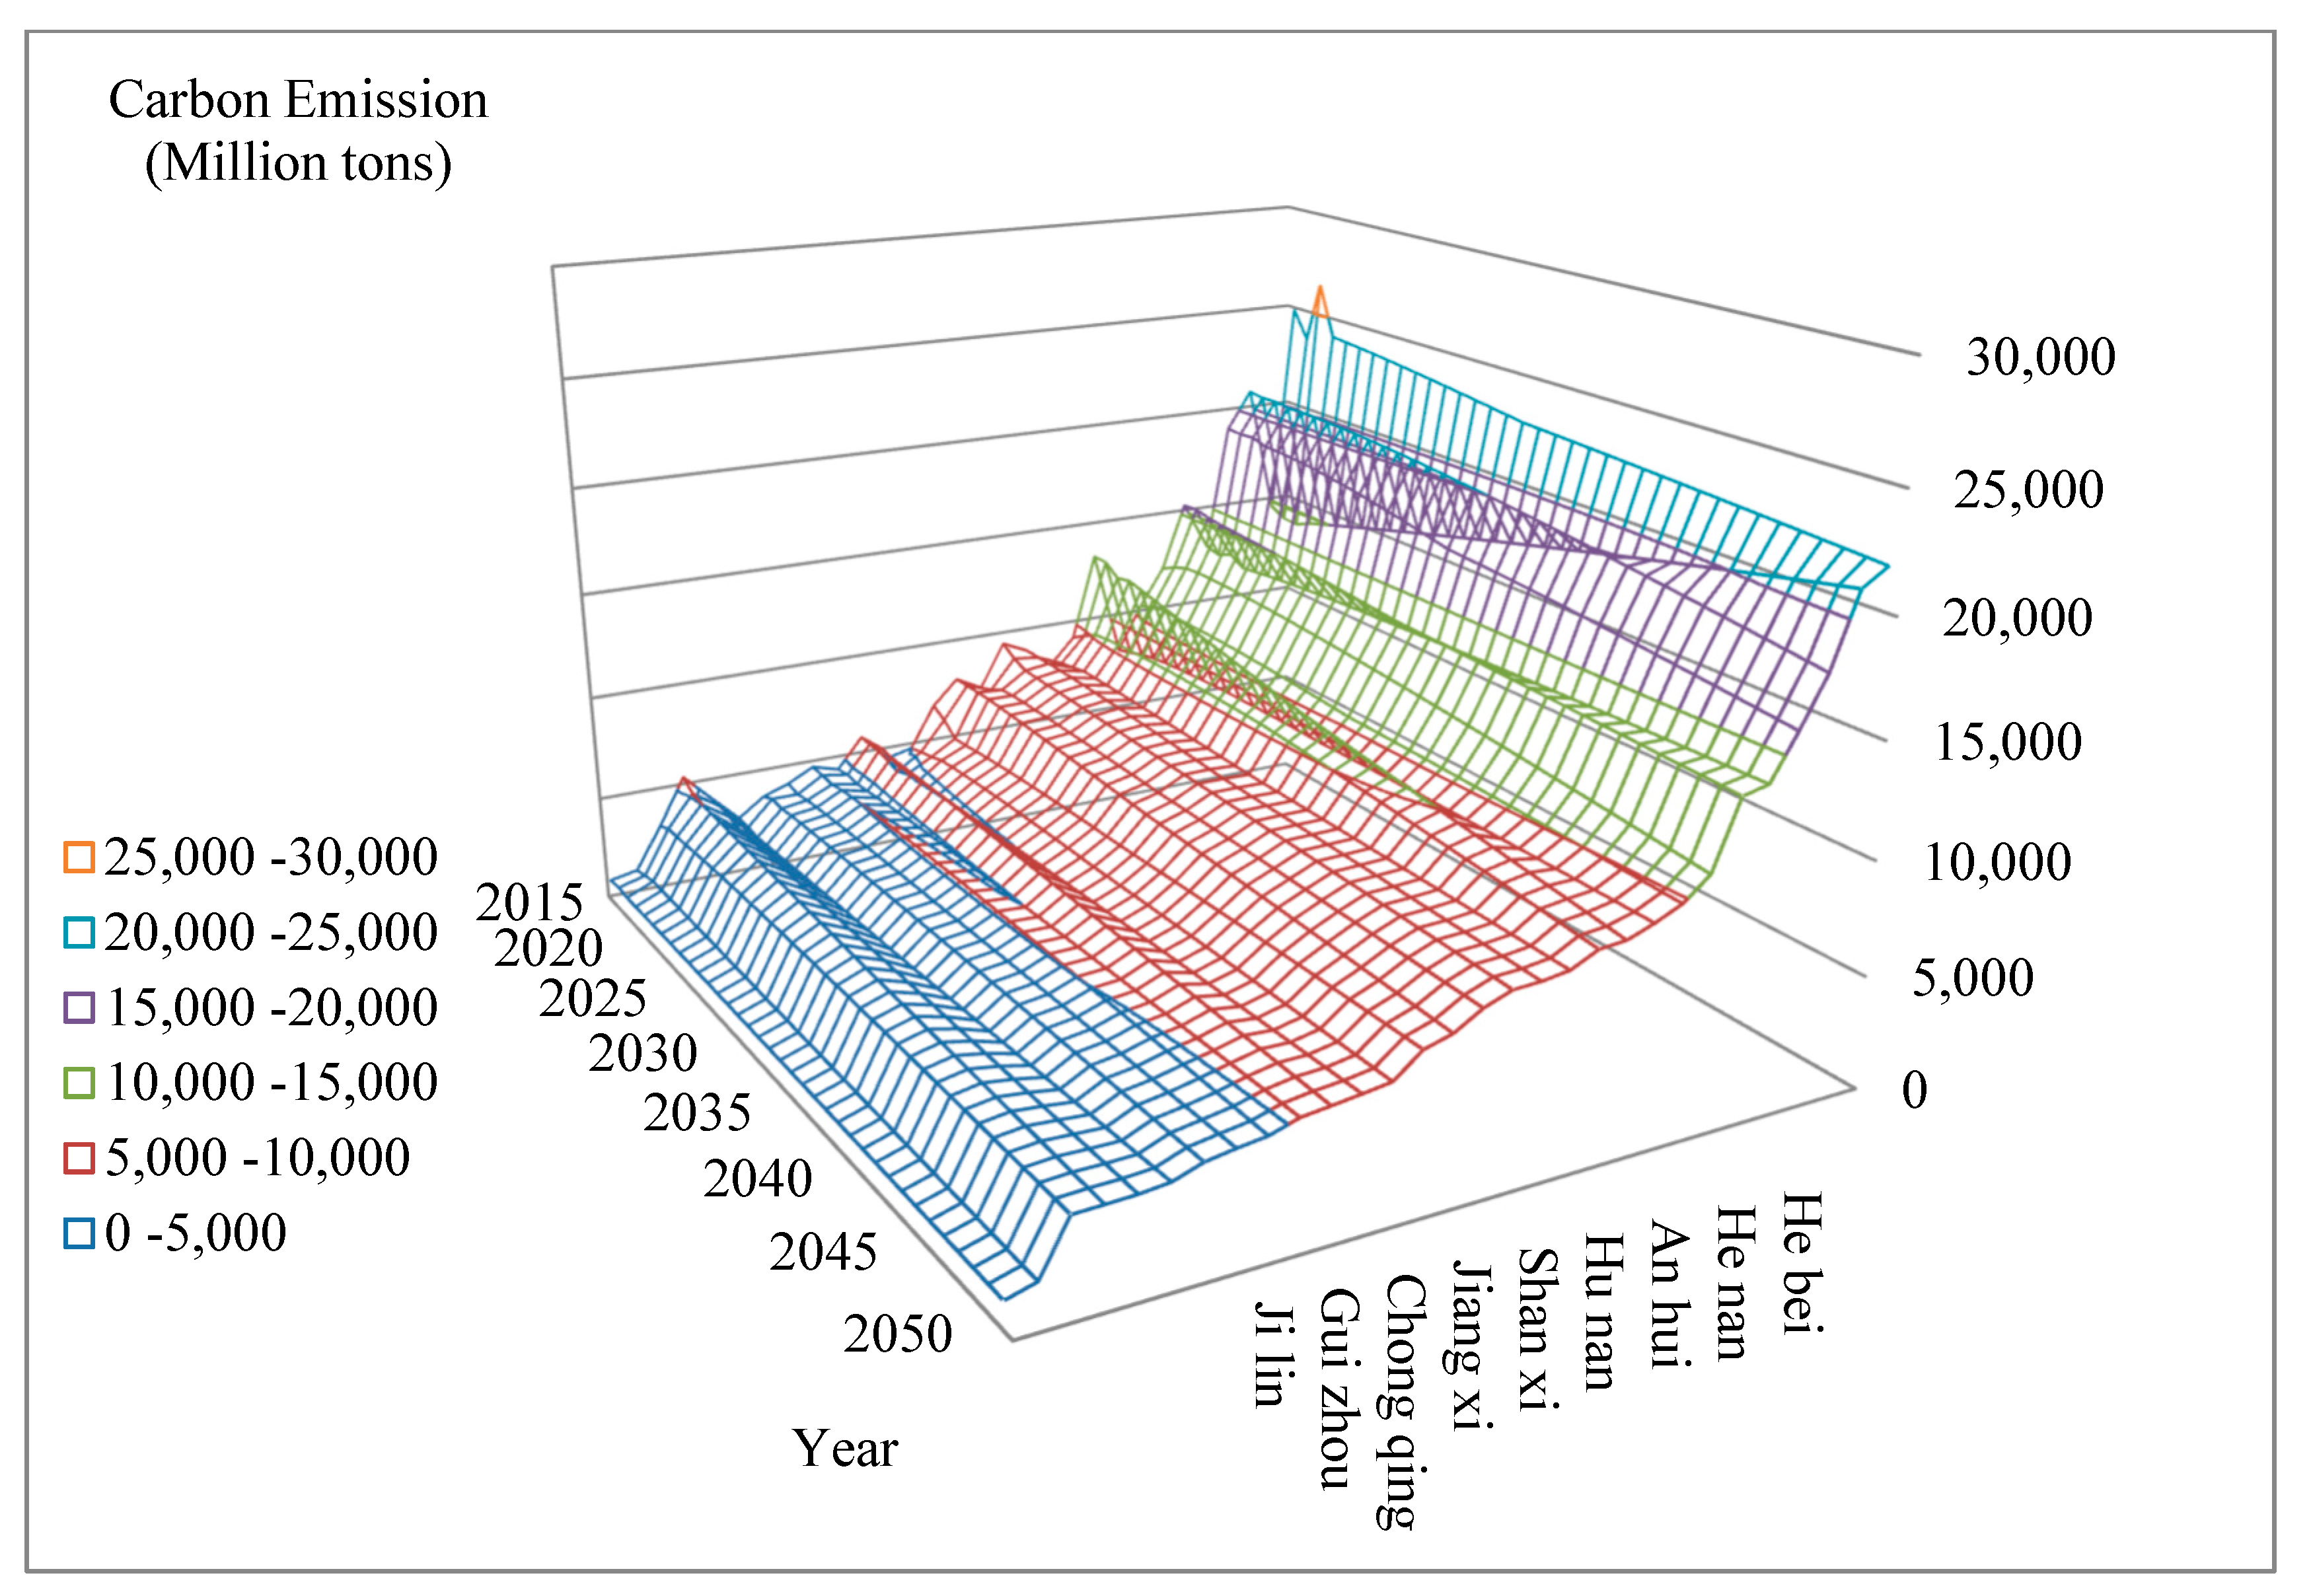
Figure 5.
The projection trends for carbon emission.
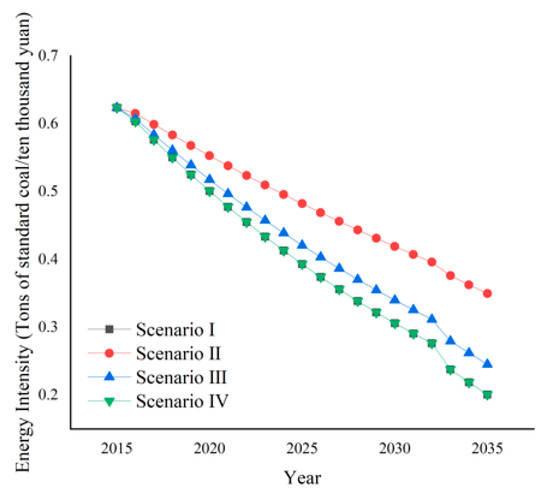
Figure 6.
The projection trends for energy intensity.
Table 7.
Results of dynamic simulations under different development scenarios.
Scenario Ι: this model attaches great importance to economic development. In terms of economic scale, the simulated forecasted GDP reaches 96,643.1 billion, 135,547 billion, and 190,111.8 billion in 2020, 2025, and 2030, respectively. The economic scale under this model is much higher than that of the same period under other scenarios. CO2 emissions are higher under this model than the levels of the same period under other models from 2017 to 2035. Observing the carbon emissions trend graph in Figure 3, Figure 4 and Figure 5, we can find that the carbon emissions of Scenario I show an increasing development trend during 2016–2032, which is mainly due to the blind pursuit of high economic growth, which leads to a large amount of energy consumption; CER intensity relative to the scale of economic development is relatively low. The degree of energy consumption structure optimization is also much lower than that set in other scenarios, resulting in a sharp increase in carbon emissions. From the perspective of total energy consumption, the energy consumption predicted by Scenario Ι reaches 4.841 BtM/t, 5.320 BtM/t, and 5.818 BtM/t in 2020, 2025, and 2030, respectively. From the above, it can be seen that although Scenario Ι attaches importance to both economic development and CER intensity, the blind pursuit of rapid economic growth, which generates huge energy consumption, results in unsatisfactory CER effects for CO2: the CER situation tends to be grim and easy to trigger energy crisis.
Scenario II: the total energy consumption reaches 2.803 BtM/t by 2030 and keeps increasing in the projected time range compared to 2020, 2025, and 2030, respectively, but the total energy consumption in this scenario is significantly lower than the energy consumption quantities in the same period of other scenarios because the main purpose of this model is energy conservation and emission reduction. The economy is relatively small, and the quantity of energy consumption remains low. During 2016–2030, the energy intensity per unit of GDP under this model is higher than that of the other scenarios in the same period, indirectly indicating that the total energy consumption under this model is low. However, the energy conversion and utilization efficiency are also relatively low. Because of the small economy size set in this model, the projected GDP size in 2020, 2025, and 2030 reaches 83,833.7 billion, 101,996.5 billion, and 124,094.3 billion, respectively: all lower than those of the other three scenarios. The model also has lower carbon emissions than the other scenarios and can reach the peak of carbon emissions in 2029, with a peak forecast of 2.803 BtM/t, which indicates that the emission reduction policies and measures before then are relatively effective. Therefore, this scenario restrains the growth trend of carbon emissions to a certain extent and allows the CER target of reaching the peak by 2030 to be accomplished ahead of schedule.
Scenario III: the total energy consumption was forecasted to reach 2.814 BtM/t, 2.983 BtM/t, and 3.148 BtM/t in 2020, 2025, and 2030, respectively; much lower than the level of the same period in Scenario I. This is closely related to the economic scale under different scenarios. Scenario II focuses on energy conservation and emission reduction, and the level of economic scale is relatively low. In terms of energy intensity per unit GDP, the energy intensity per unit GDP under this scenario is lower than the current development model and the same period level under Scenario II but higher than the same period level under Scenario I.
Scenario IV: the economic growth rate is also relatively fast and at the same level over the same period as Scenario I. Economic growth and energy consumption are closely related, so it is closer to Scenario I in energy consumption. However, the focus on adjusting the energy structure results in significantly lower carbon emissions than Scenario I, while due to the rapid economic growth, carbon emissions are also relatively flat with slow growth.
Table 8 shows the comparison and deviation between the actual and projected values for 2020. The projected carbon emissions for Scenario I are 10.78% lower than the actual value, the lowest of the four scenarios, and the projected GDP is 5.12% lower than the actual value, the highest of the four scenarios. This is in line with the expectation that Scenario I focuses on the economy and is light on emission reduction. This is because the projected GDP, carbon emissions, and energy consumption values in Scenario II are 21.19%, 16.92%, and 7.43% lower than the actual values, respectively, which are the highest among the four scenarios. This is also consistent with the expectation of low-carbon development in Scenario II, where carbon emissions are reduced at the expense of economic growth. Scenario III is second only to Scenario II regarding carbon reduction and maintaining economic growth. Scenario IV is second only to Scenario III regarding carbon reduction, but Scenario IV has better economic growth than Scenario III.
Table 8.
Comparison of real and predicted values.
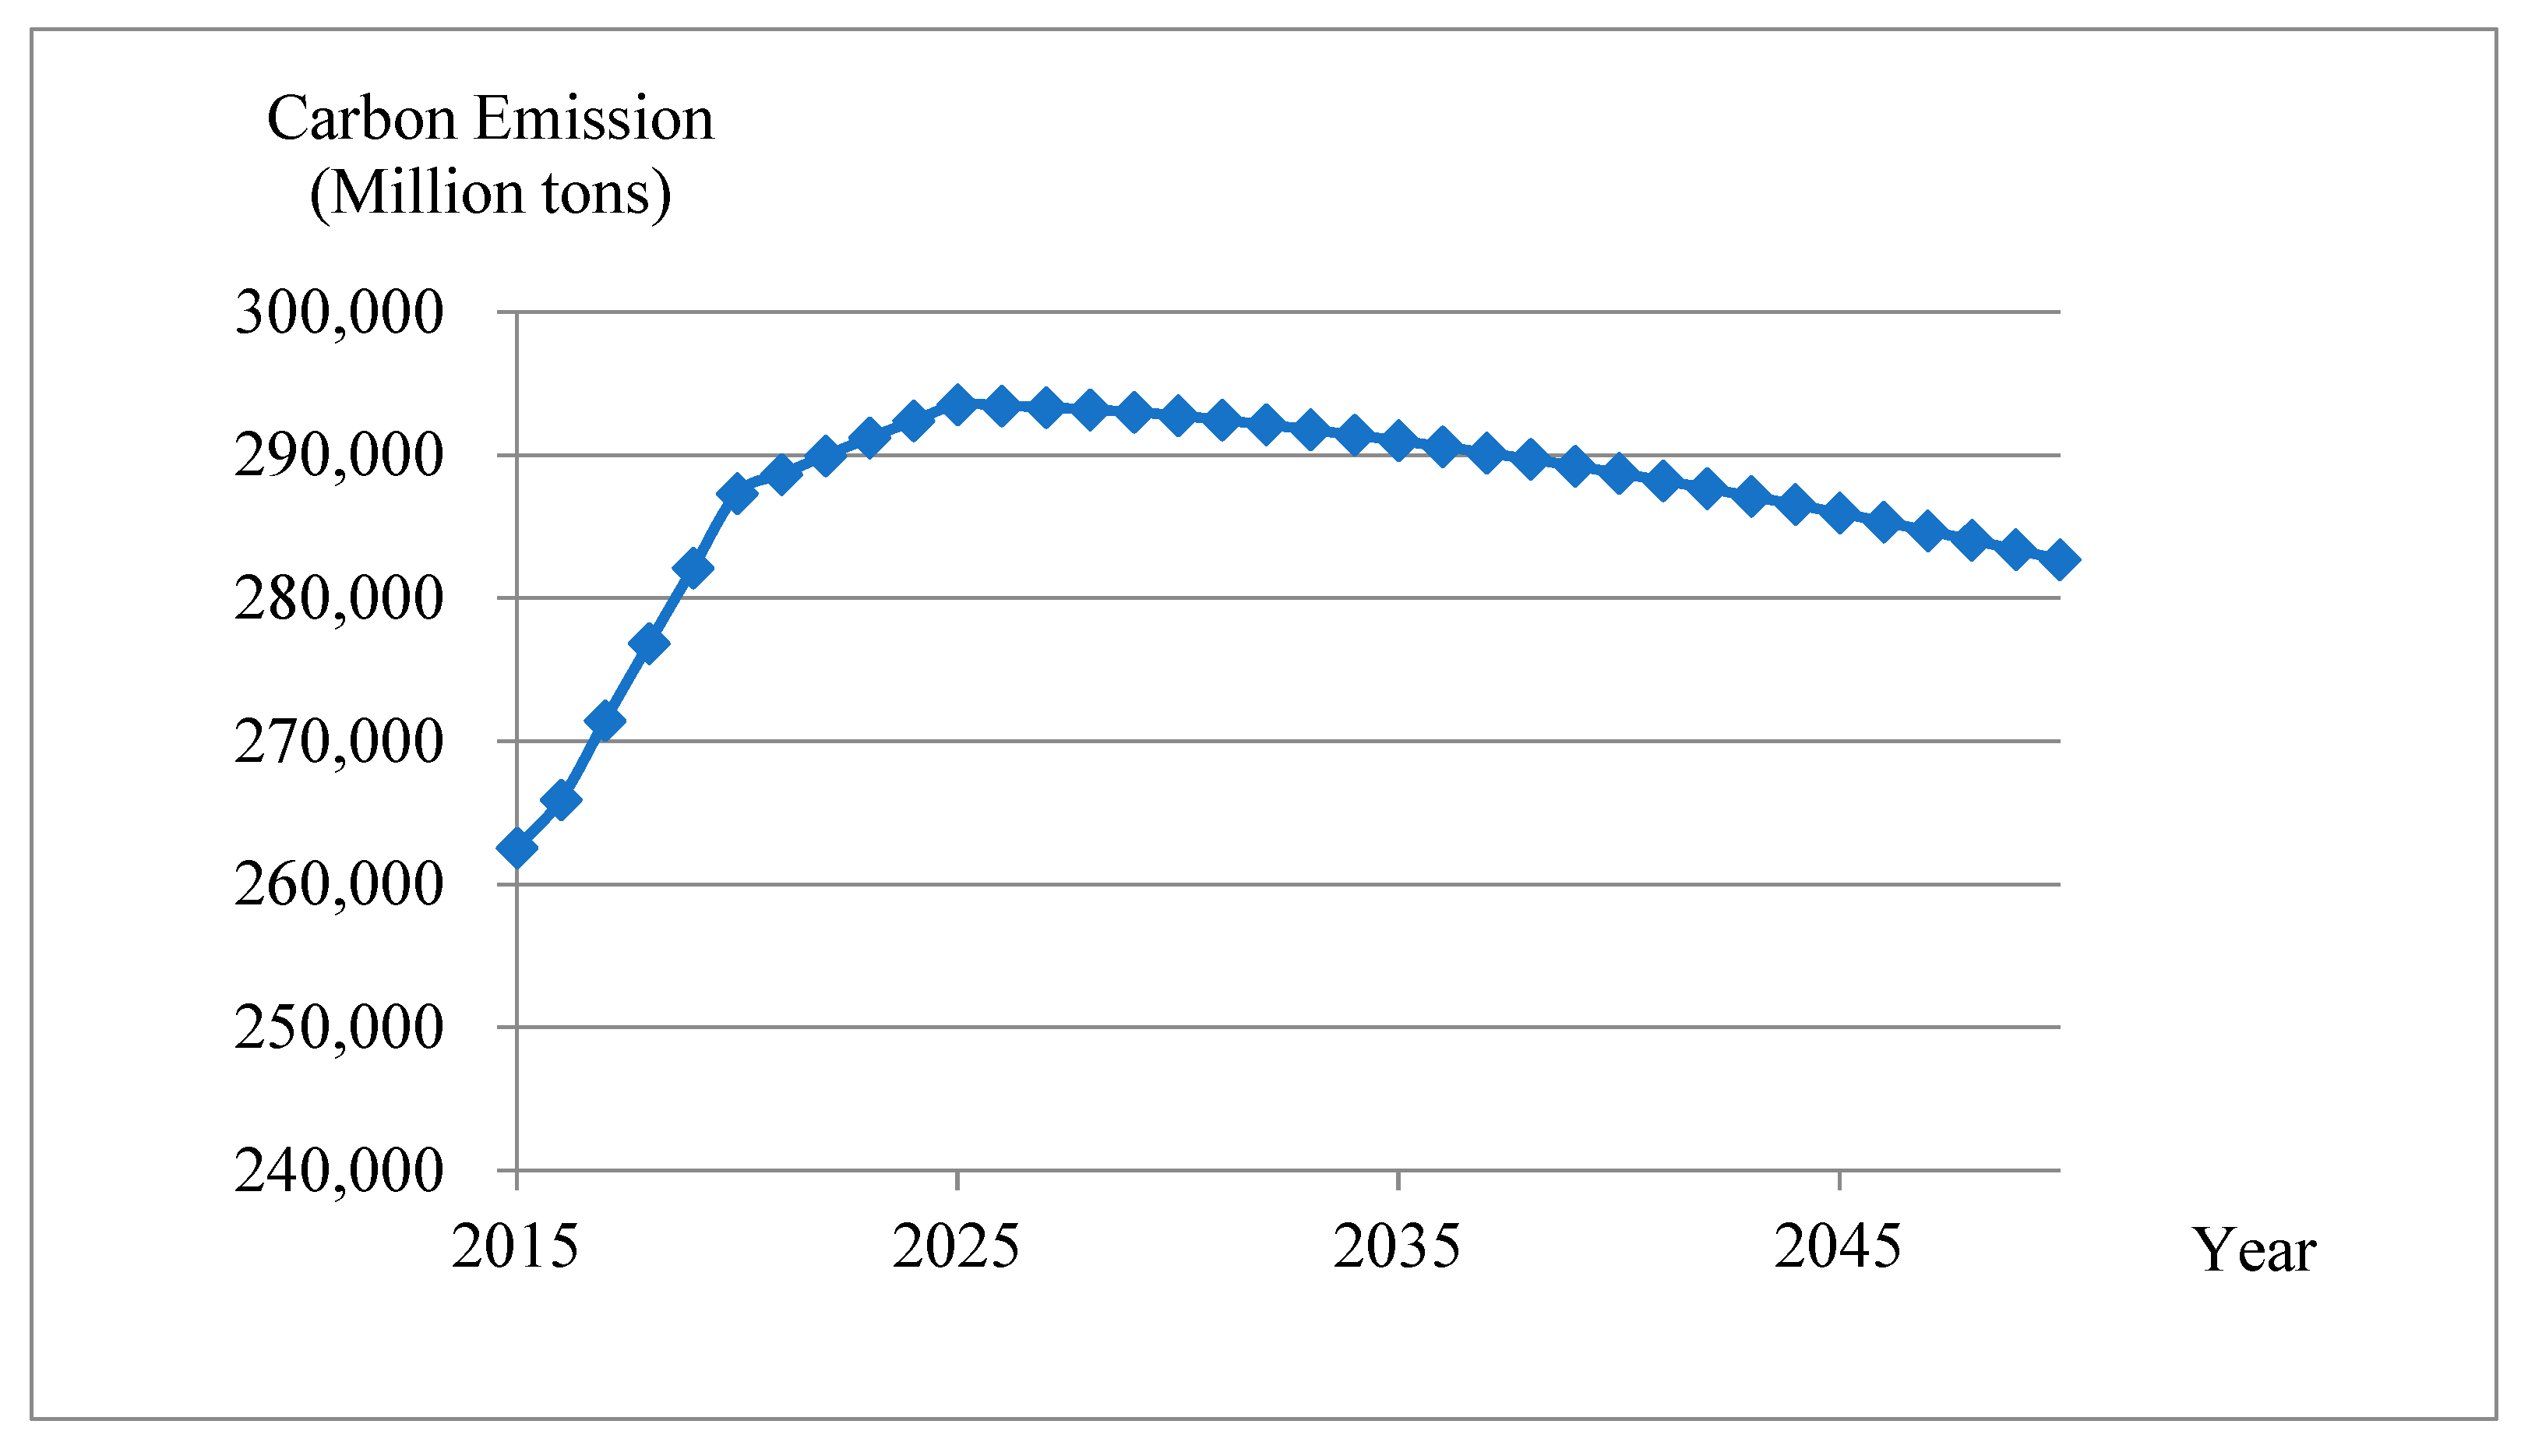
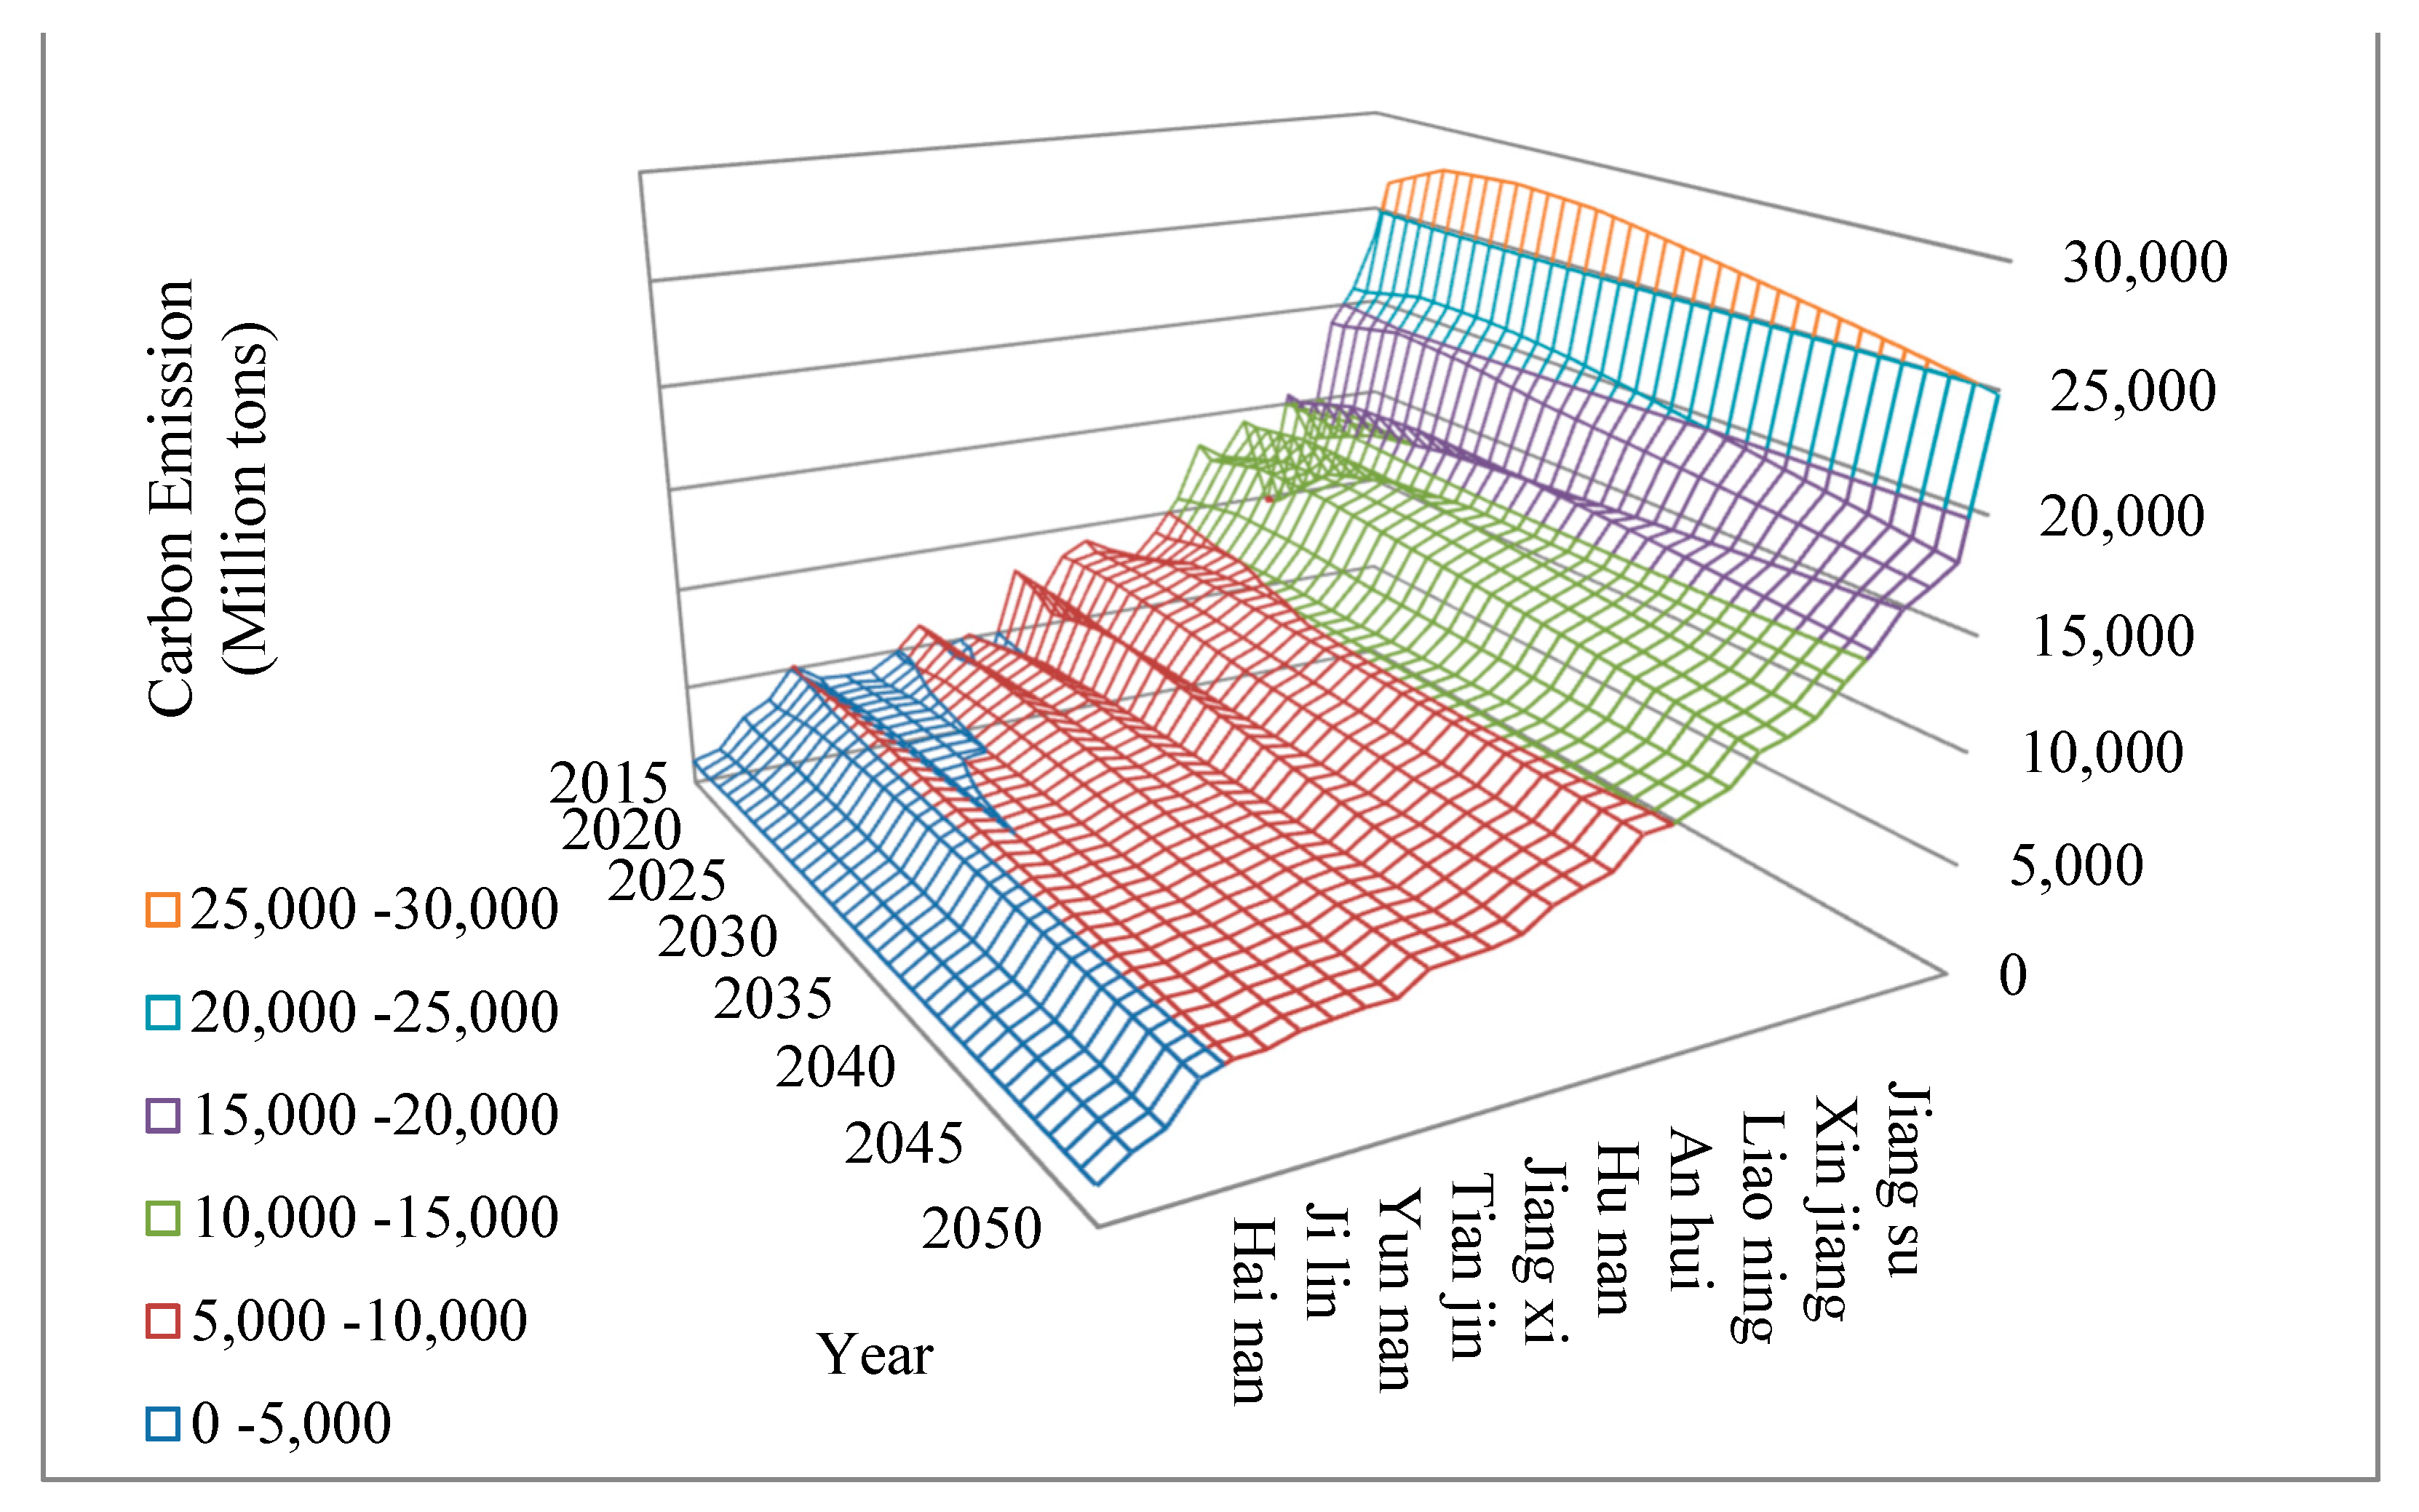
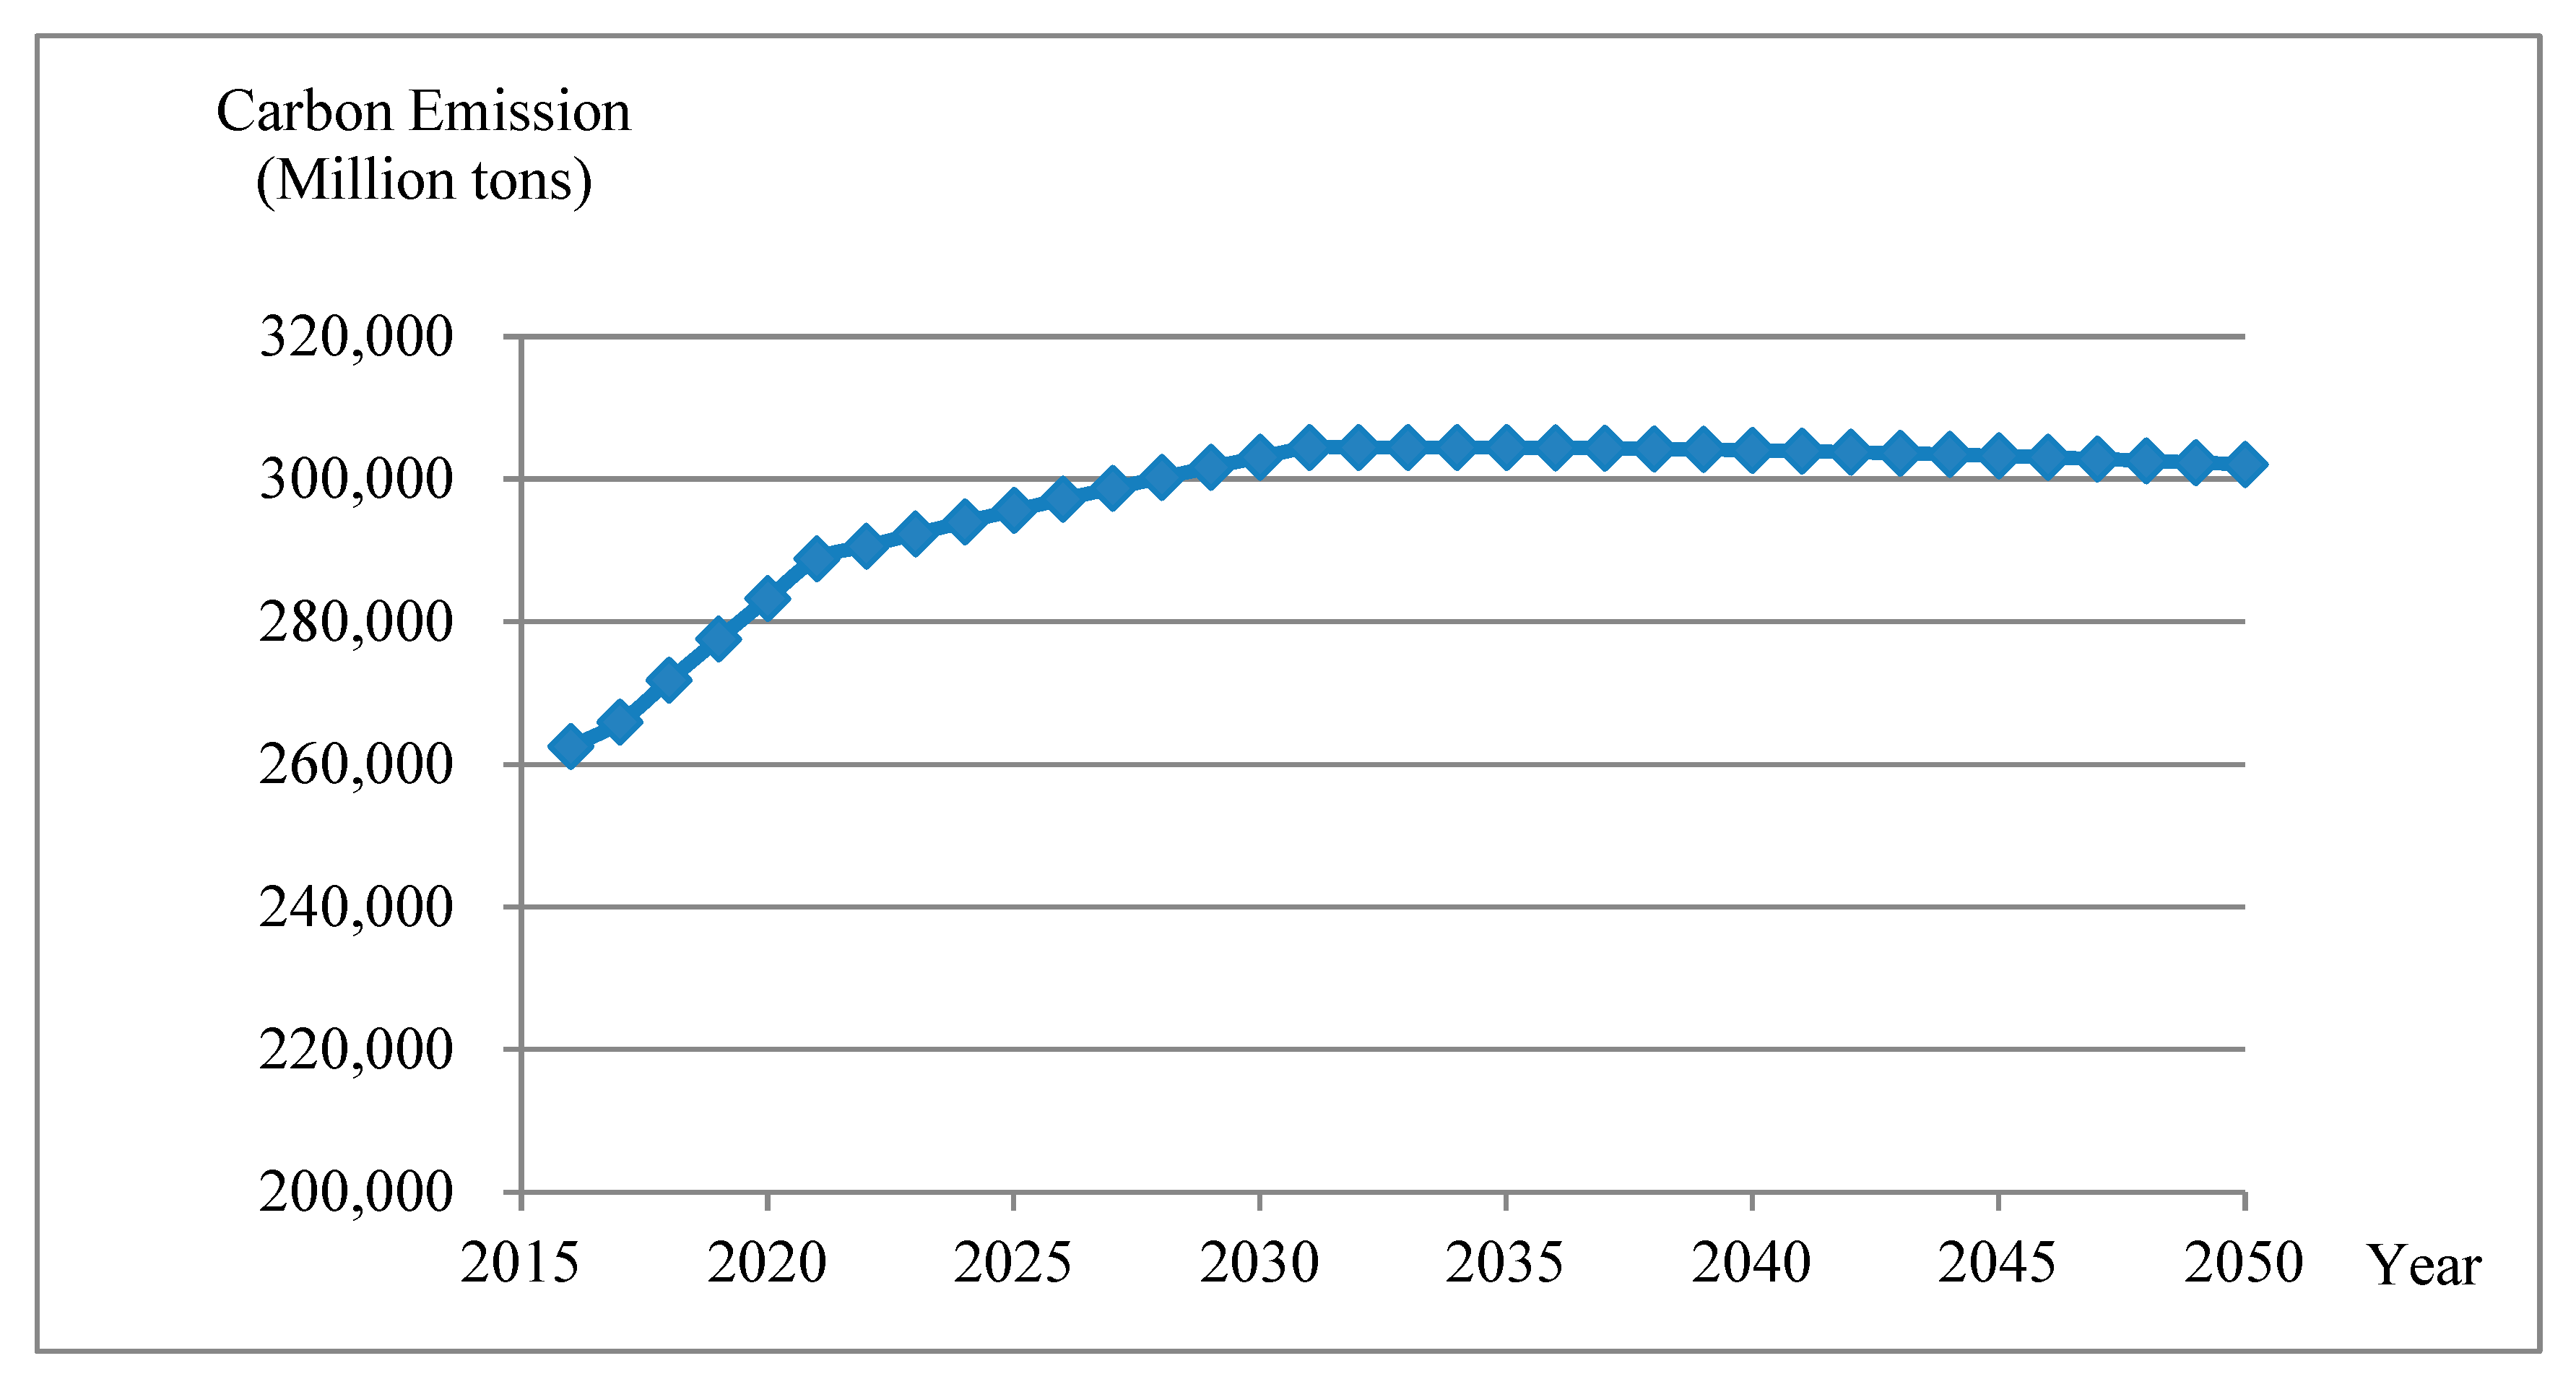
4.2. Simulation of CER System in Multi-Agent Collaborative Mode
In the multi-agent synergy model, some provinces complement each other in their energy trading between hydropower, wind energy, and other non-fossil energy-rich provinces (Guizhou, Guangxi, Qinghai, Inner Mongolia, Hubei). Other provinces meet their own needs while exporting electricity to provinces that consume more thermal energy to reduce the province’s coal consumption, such as Shandong, Shanxi, Jiangsu, Heilongjiang, and other provinces. Figure 7 shows that the national carbon emissions reach a peak of 2.935 BtM/t in 2026, and then the carbon dioxide emissions decline year by year while keeping the economy improving. Figure 8 shows the trend graph of carbon emissions by provinces and cities, and it can be seen that provinces such as Henan, Guangdong, Jiangsu, Hebei, and Shandong, which are currently relatively large in carbon emissions, respectively, reach the peak in 2026 or earlier.
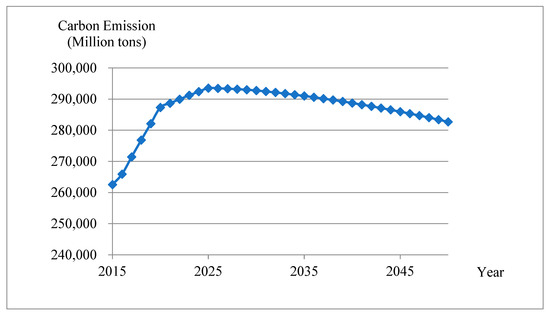
Figure 7.
National carbon emission trend.
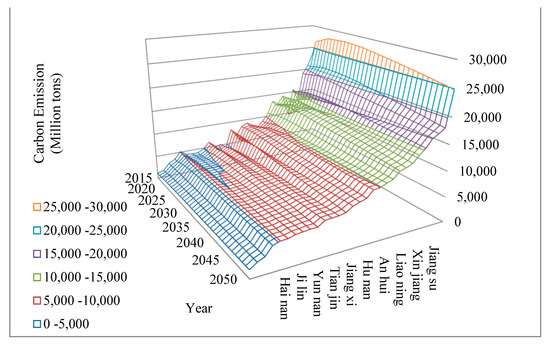
Figure 8.
Trend of carbon emission by provinces and cities.
4.3. Simulation of CER Systems in Multi-Agent Non-Cooperative Mode
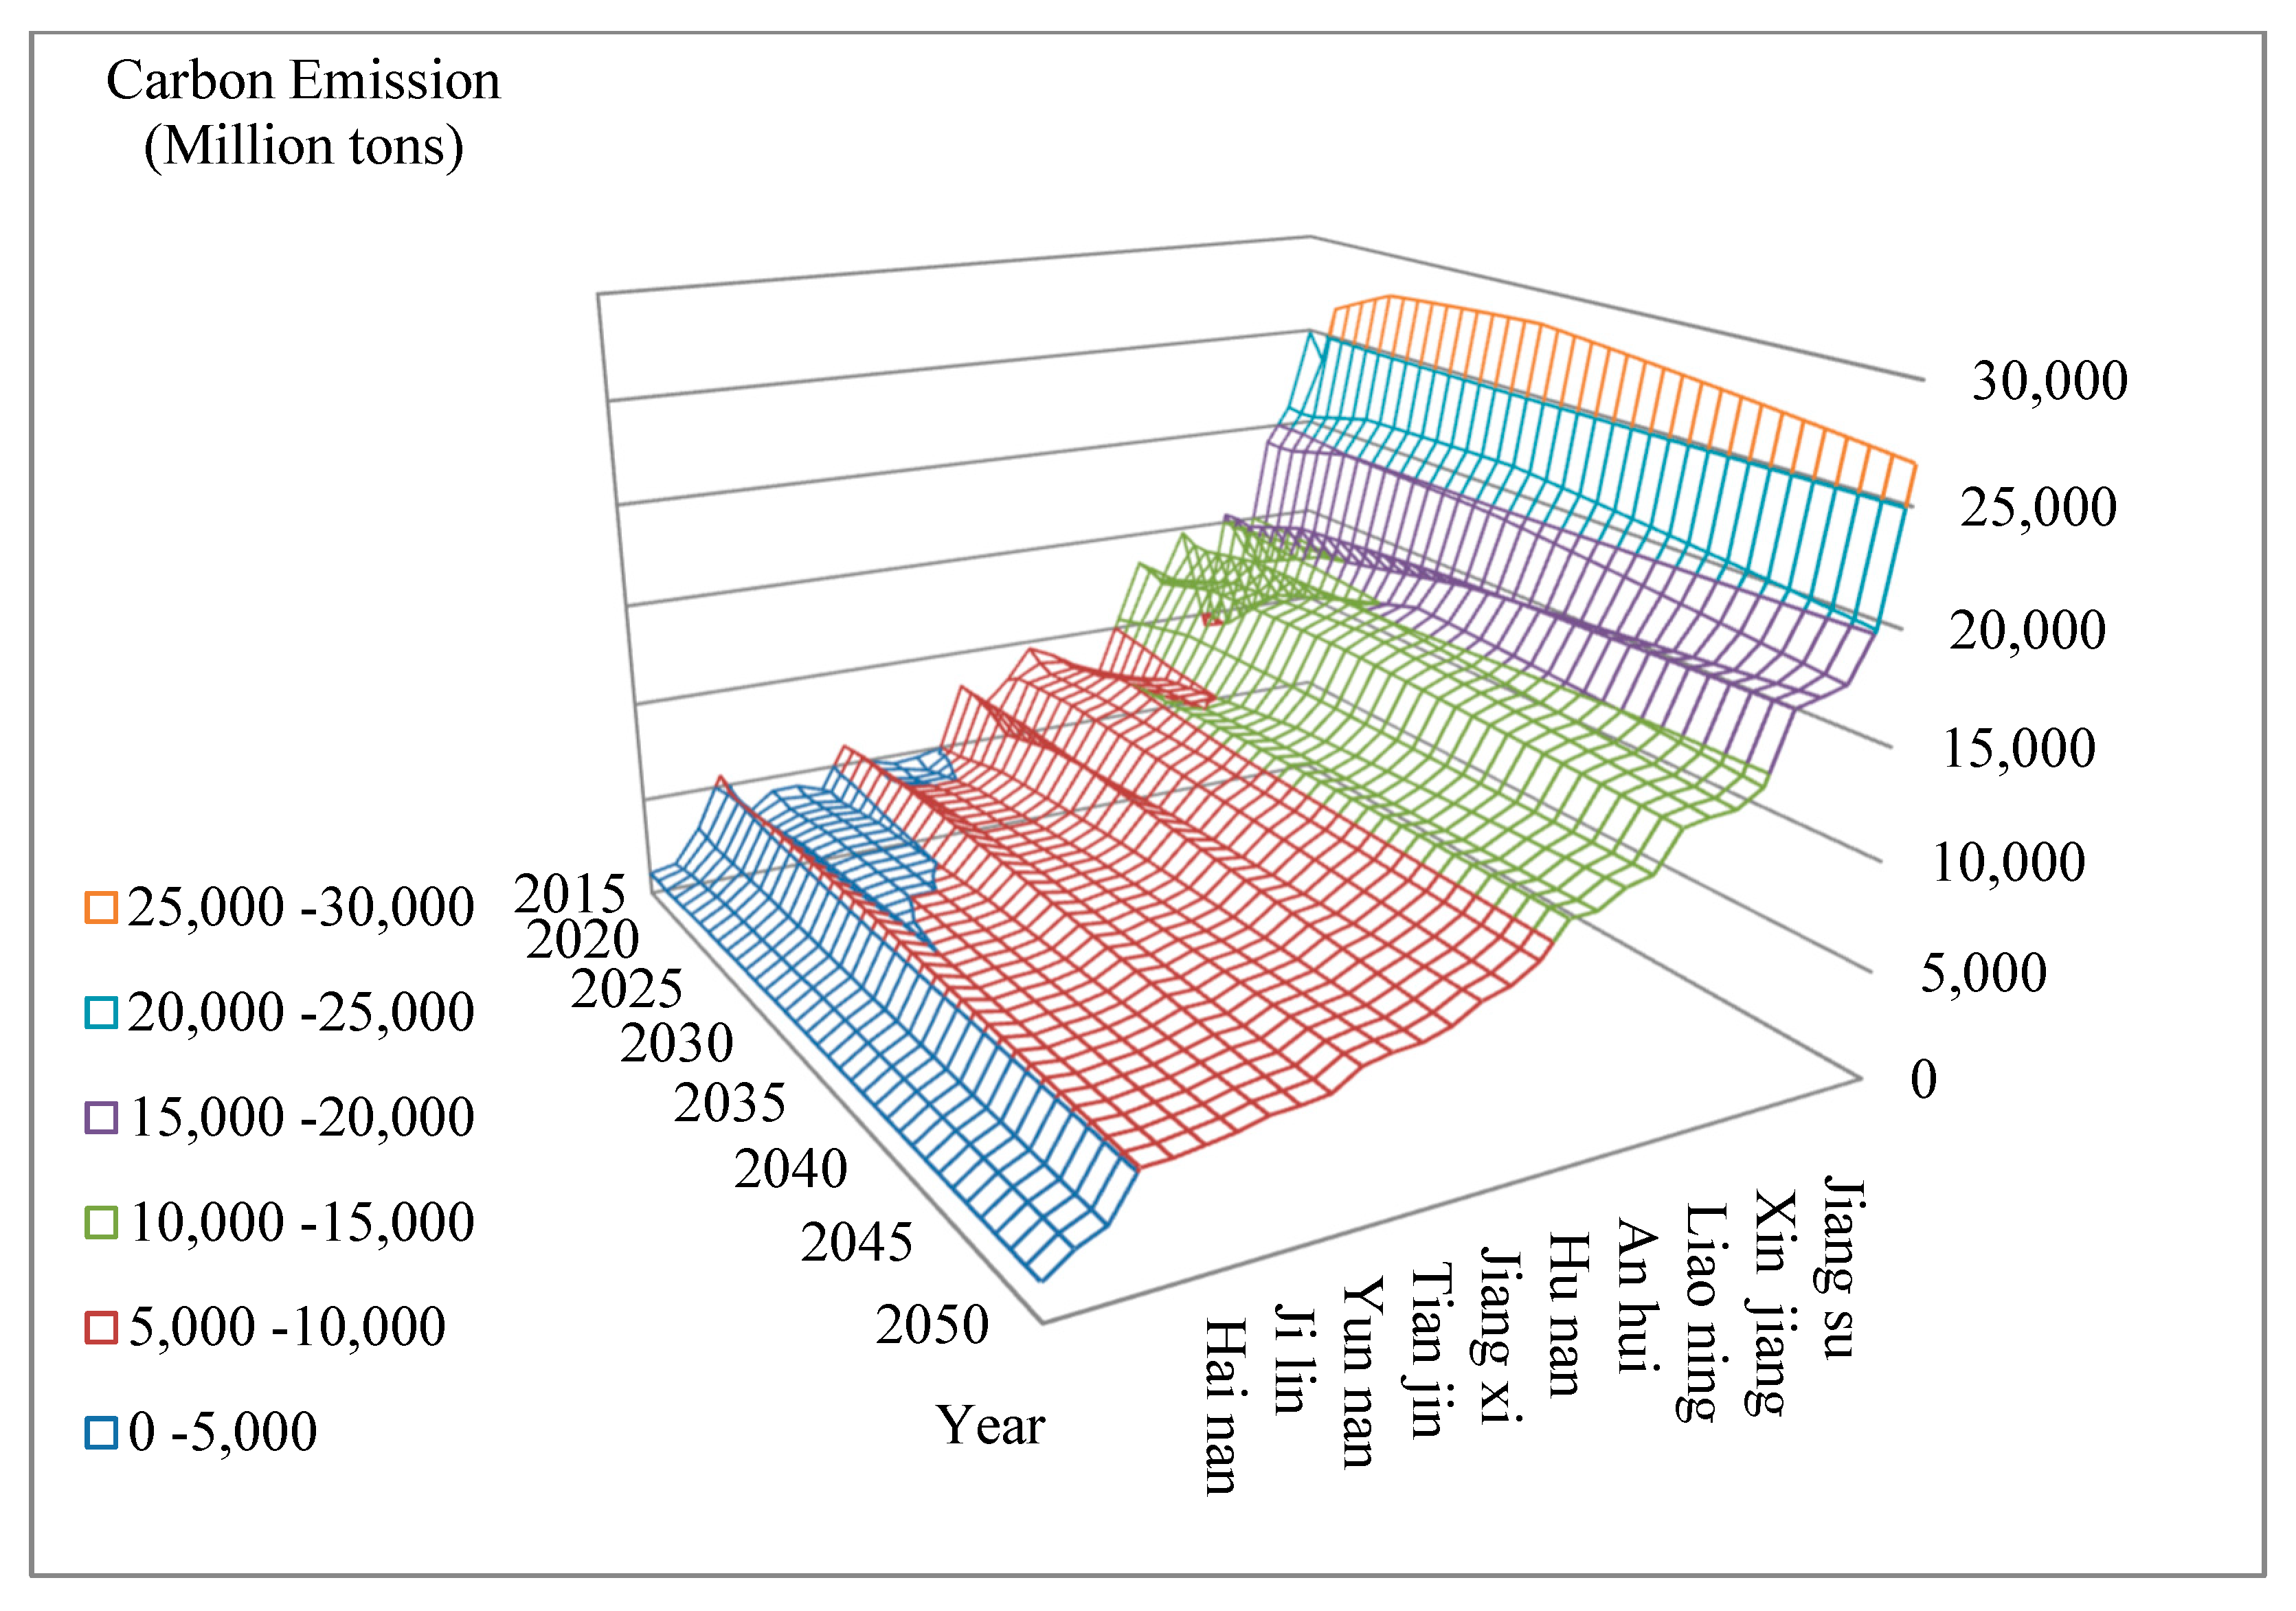
The non-synergistic model of carbon emission reduction requires that each province, as an independent entity, can only continuously adjust its own economic, industrial structure, and energy consumption structure to ensure economic growth and the completion of CER tasks. The national trend of carbon emissions shows a slow decline after the peak in 2032 (Figure 9). Differences in structure cause differences in carbon emissions by province. For provinces with a reasonable structure (Beijing, Shanghai, and Tianjin), the carbon emissions task is lower than the task given by the state and only needs to ensure steady economic growth; for provinces with high carbon economies (Hebei, Shandong, Jiangsu, and Henan), which need to balance economy and CER, the time to reach the peak of carbon emissions is delayed until around 2031 (Figure 10).

Figure 9.
National carbon emission trend.
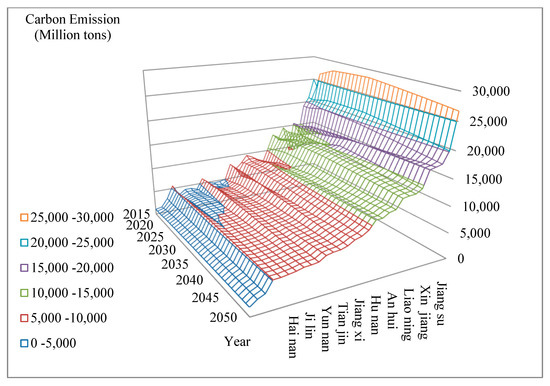
Figure 10.
Trend of carbon emission by provinces and cities.
4.4. Simulation of a CER System in a Multi-Agent Enhanced Low-Carbon Model
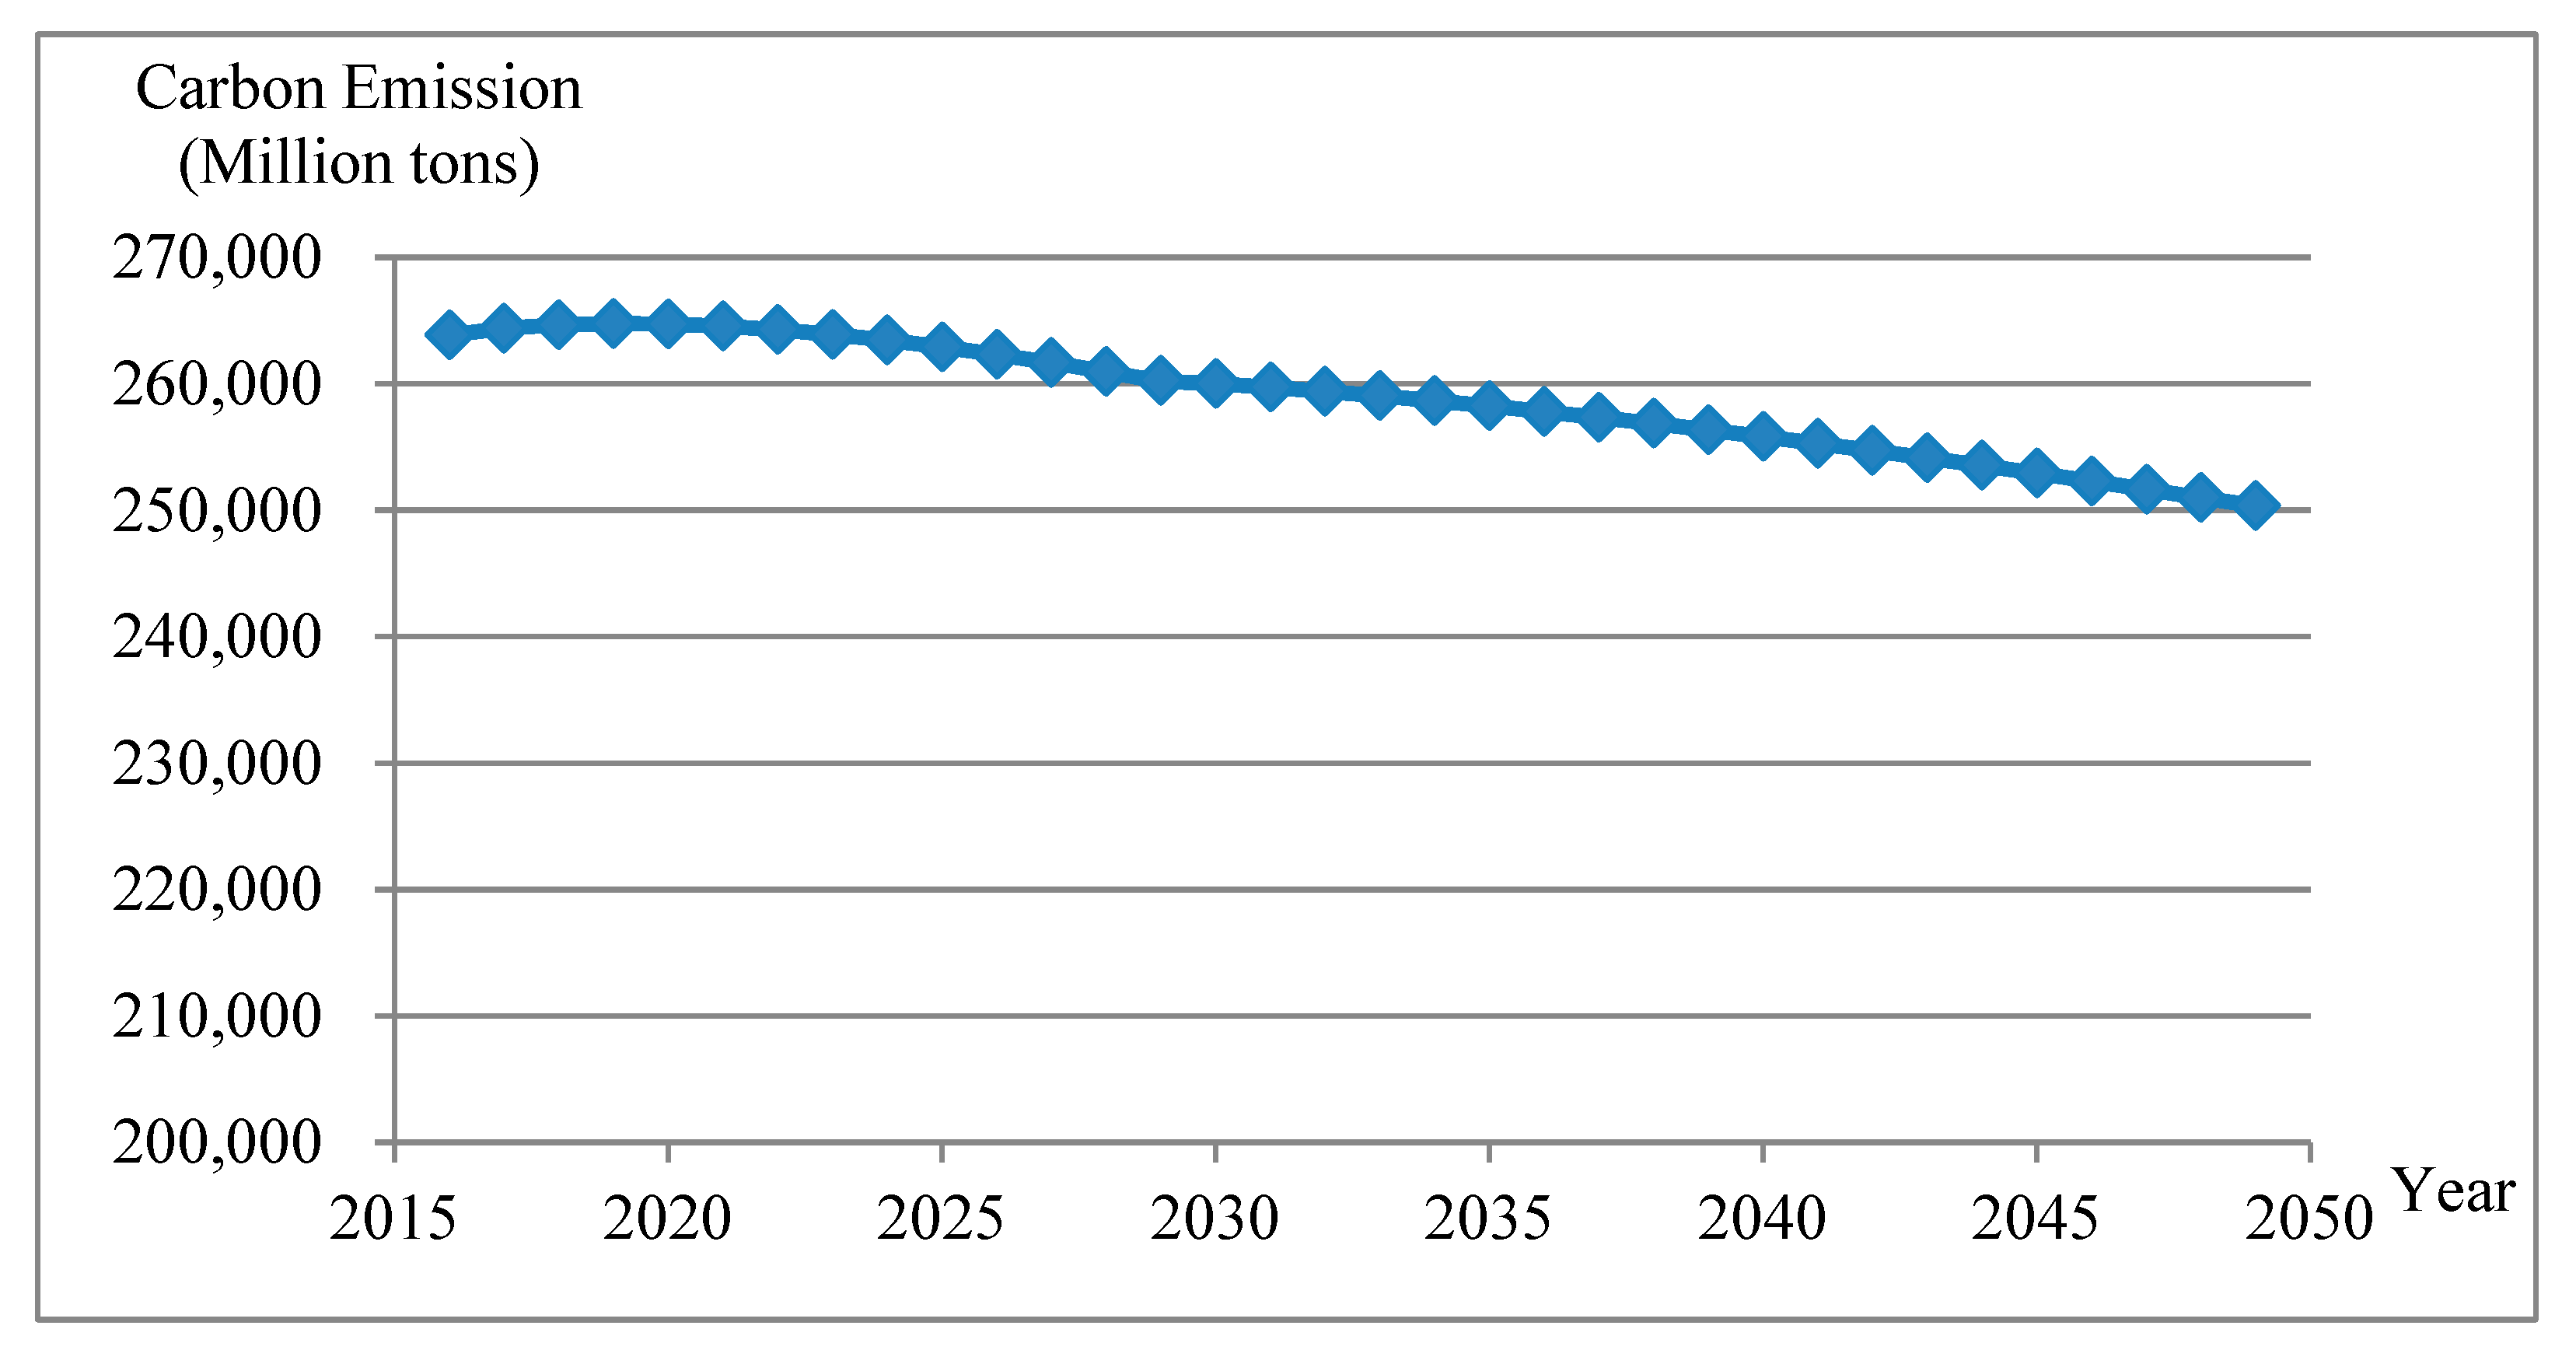
The enhanced low-carbon model imposes more stringent requirements on the CERs of the provinces. National emissions peak in 2020, the earliest of all scenarios (Figure 11). Carbon emissions are tightly controlled in the provinces and cities under this model, with provinces with higher fossil energy consumption performing strongly (Figure 12).
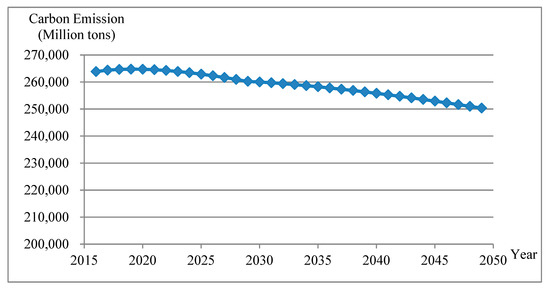
Figure 11.
National carbon emission trend.
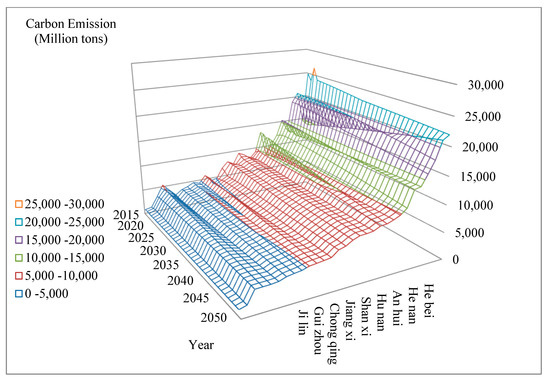
Figure 12.
Trend of carbon emission by provinces and cities.
4.5. Heterogeneity of Carbon Emissions in Different Scenarios
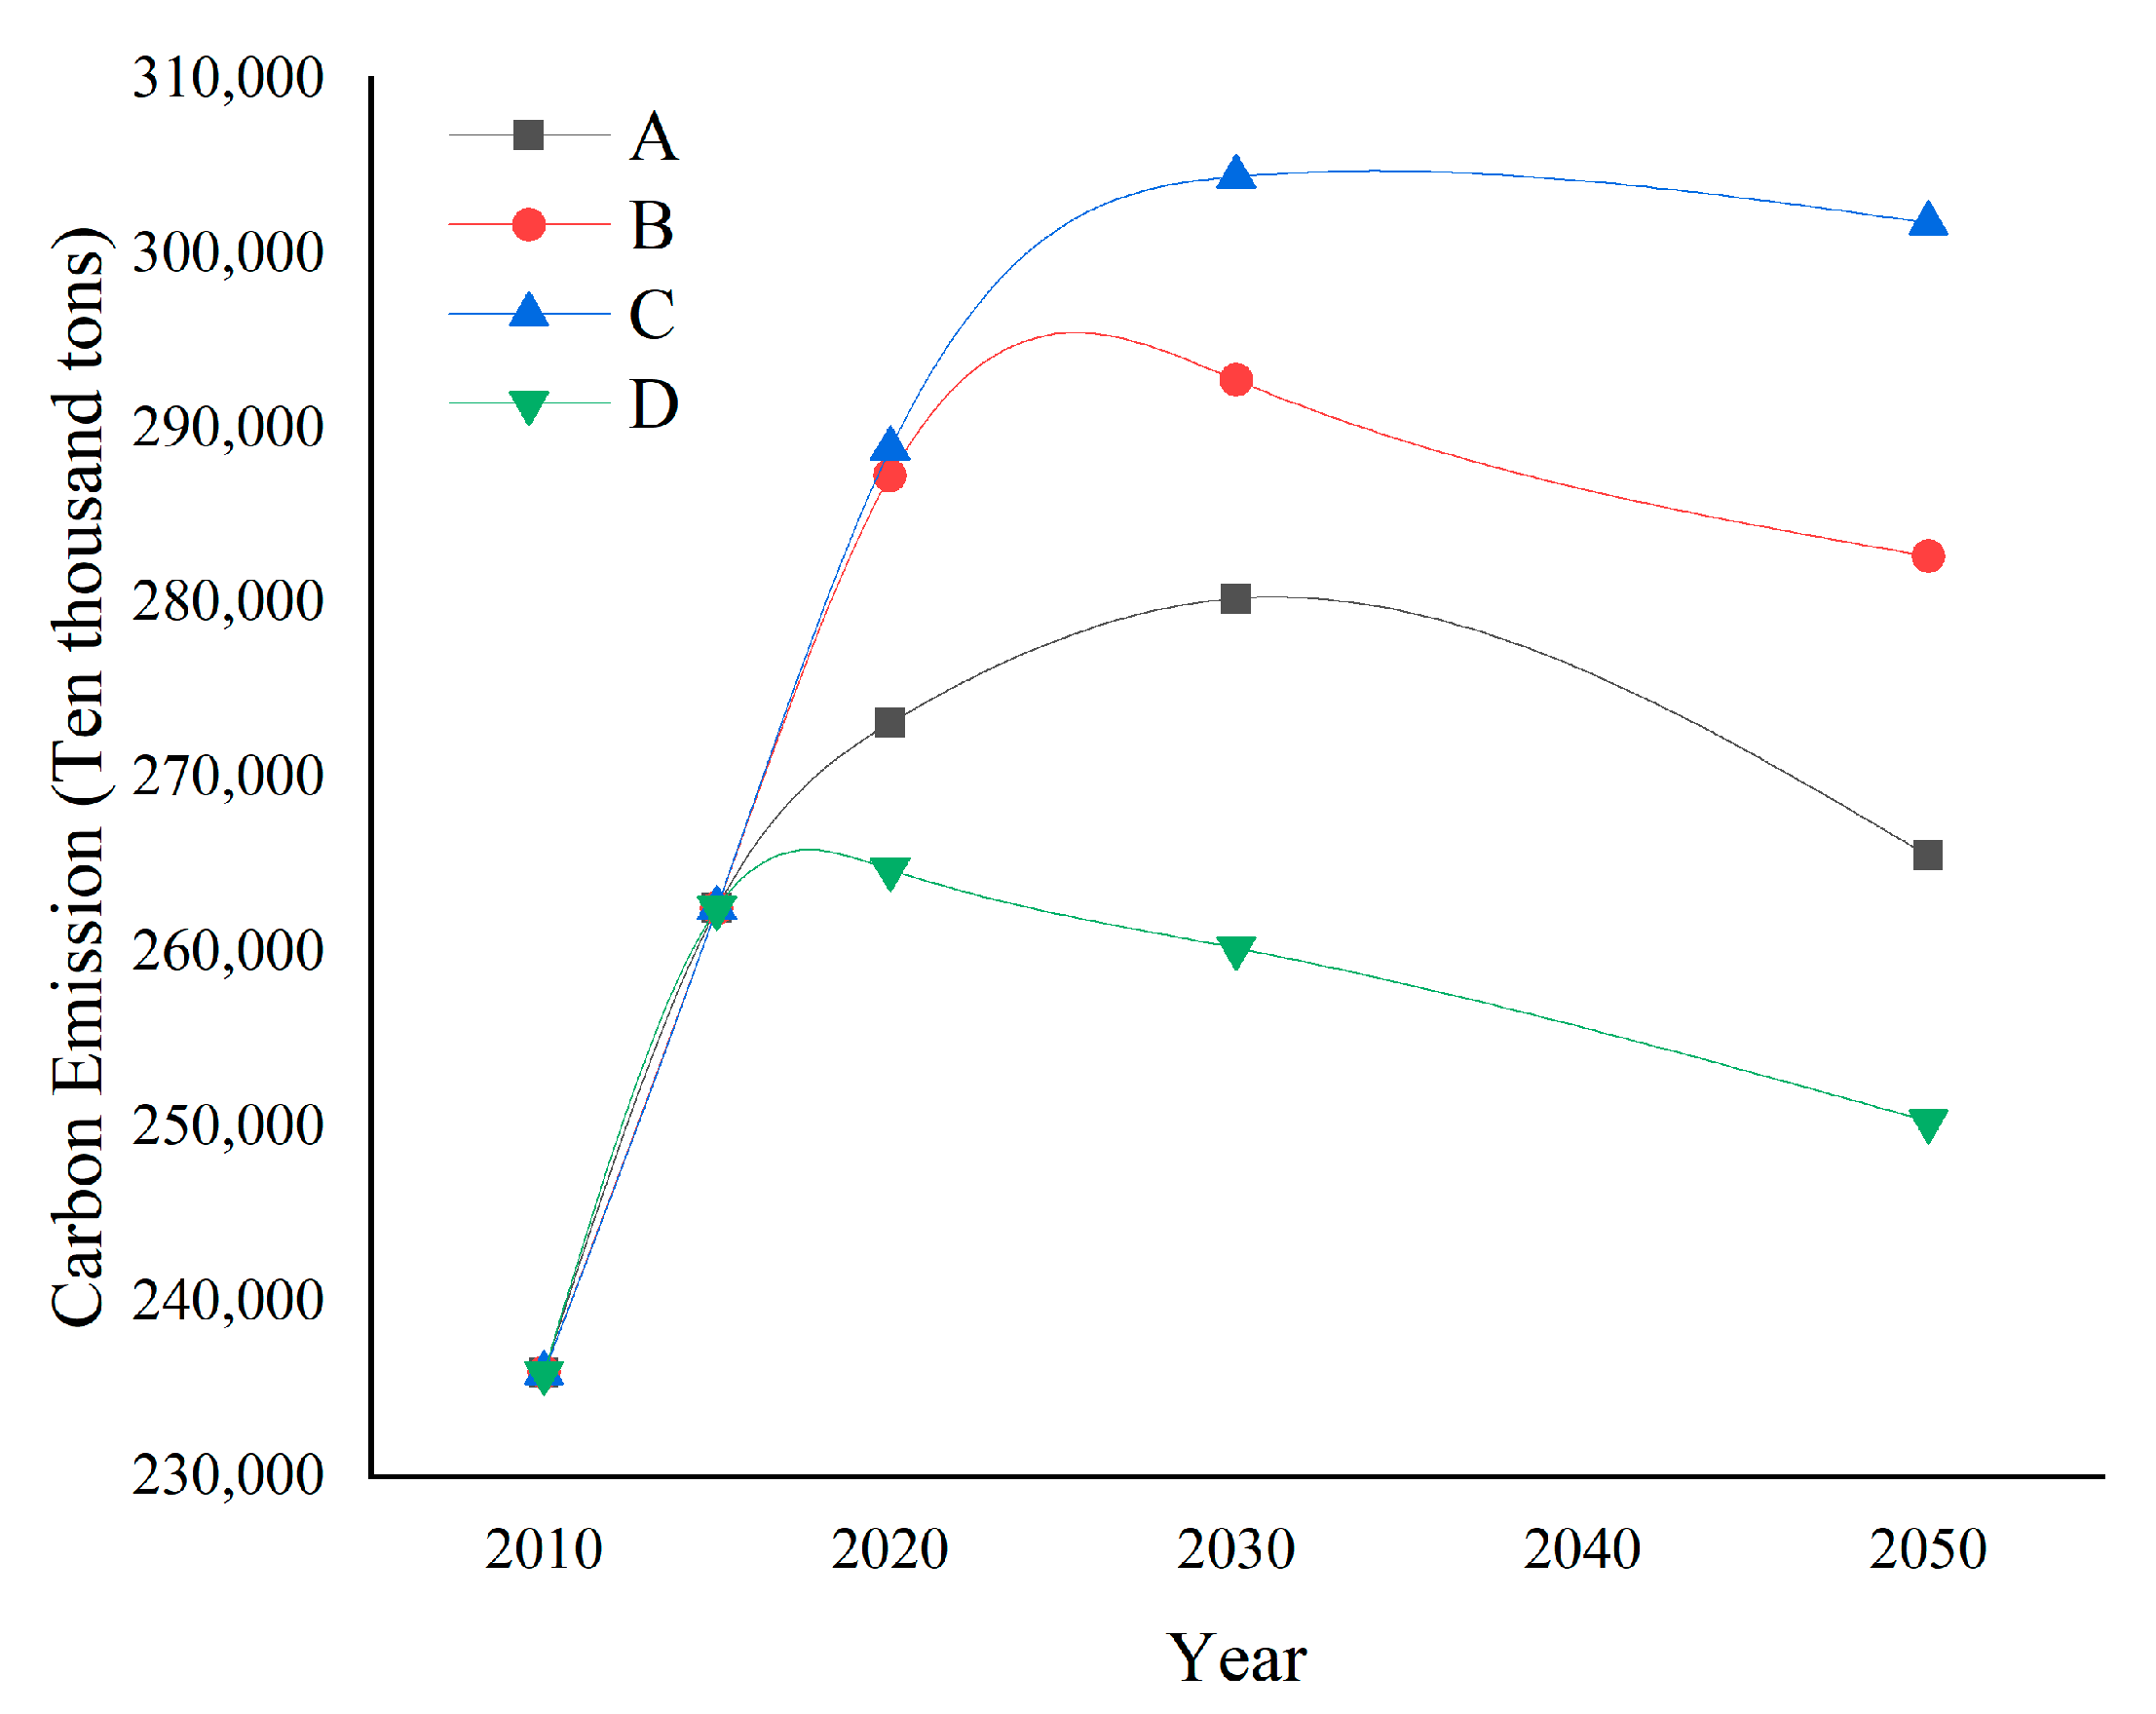
Figure 13 and Table 9 show the CO2 emissions under different scenarios. A–D represents the national unified low-carbon scenario, the provincial synergistic low-carbon scenario, the provincial individual low-carbon scenario, and the enhanced low-carbon scenario. The time to peak carbon emissions in the national unified low-carbon scenario, the intensive low-carbon scenario by provinces, and the collaborative low-carbon scenario by provinces are 2026, 2026, 2032, and 2020. Only the collaborative low-carbon scenario accomplishes both the task of carbon emissions reduction and stable economic growth.
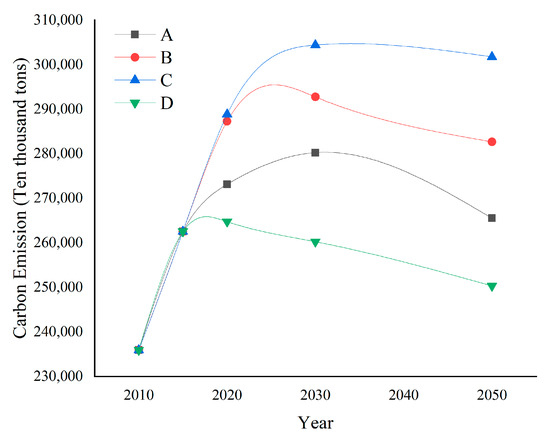
Figure 13.
Emissions of CO2 for different scenarios. A–D represent the national unified low-carbon scenario; provincial synergistic low-carbon scenario; provincial individual low-carbon scenario; enhanced low-carbon scenario.
Table 9.
Fossil fuel combustion CO2 emissions.
4.6. Discussion
Scenario I shows rapid increase in energy consumption and carbon emissions, which may even produce an energy crisis, cause side effects for carbon emissions reduction, and also adversely affect the long-term sustainable development of government decision-making. The carbon emissions in this model will not peak in the short term, and the carbon emissions will show a trend of continuous growth. Scenario II shows a lower economic scale than other scenarios in the same period. Scenario III shows not only stable and rapid economic growth but also control of carbon emissions to a certain extent, reaching the peak of carbon emissions in 2026 with lower carbon emissions than Scenario I. Scenario IV is an ideal development model, but due to the relatively fast economic growth, carbon emissions grow at a slow rate and do not peak around 2030.
Among the three scenarios in which the provinces are the main contributors to carbon emission reduction, the provinces intensified carbon emission reduction at the expense of the economy to reach the peak in 2020, but it is the least worthy of consideration.
5. Conclusions and Policy Implication
5.1. Conclusions
This study used a multi-subject simulation model to simulate and forecast the national carbon emission process, and the following conclusions were drawn.
- (1)
- Under the national unified CER policy: the carbon emissions reduction effect was, in order, Scenario II > Scenario III > Scenario IV > Scenario I. The effect of economic growth was Scenario II > Scenario III > Scenario I = Scenario IV. Scenario I has a sharp increase in energy consumption and carbon emissions due to the rapid economic growth and mismatch with emission reduction efforts such that carbon emissions do not peak in the short term and carbon emissions show a continuous growth trend. Scenario II has a much lower economic scale than the economic scale of the other scenarios in the same period, and carbon emissions peak in 2029. Scenario III not only achieves stable and rapid economic growth but also controls carbon emissions to a certain extent, and reaches the peak in 2026 with lower carbon emissions than Scenario I. Scenario IV has a relatively fast economic growth, which makes carbon emissions keep growing at a slow rate, and no peak occurs around 2030.
- (2)
- In the three scenarios of CER with provinces as the main body: if provinces strengthen CER by sacrificing their economy, the peak of carbon emission will appear in 2020, but this situation is not worth learning. In contrast, the economy of both scenarios of non-synergistic and synergistic emission reduction in each province grows steadily. However, the synergistic mechanism of carbon emission between subjects makes the peak in 2026 four years earlier in the synergistic model, while the peak in 2032 in the non-synergistic model and some provinces with large energy consumption slow down their economic growth.
- (3)
- To balance and consider the coordination of economic development and environmental governance, CER targets are set based on carbon emission intensity. This is necessary to reduce the growth rate of economic development to a certain extent and pursue economic and environmental goals. Furthermore, it is imperative to reduce the growth rate of economic development to some extent and pursue a coordinated development of the economy and environment.
5.2. Policy Implications
Based on the findings of this study, the following recommendations are made to provide references and lessons for cross-regional CER in China to achieve sustainable development.
- (1)
- Shaping a synergistic CER concept
The government should advocate the concept of collaborative emission reduction, strengthen strategic synergy, and make governments aware of the importance and necessity of integrated collaboration. On the one hand, the CER concept of regional synergy needs to be shaped. Regions that work together to promote the development of low-carbon industries through a reasonable and orderly transfer of industries can lead the way to promote the expansion of more regional CER. On the other hand, collaborative emissions reduction among government, enterprises, non-profit organizations, and residents should be shaped as well. The mechanism of enterprise participation, non-profit organization participation, and resident participation for collaborative emission reduction should be constructed.
- (2)
- Develop a regional differentiated low-carbon development system
CER task allocation should be tailored to local conditions, especially focusing on controlling carbon emissions in high carbon emission areas. CER responsibility-sharing can be enhanced to avoid higher regional differences brought by high carbon emissions; for low carbon emission areas, the government should mainly promote a virtuous cycle of low-carbon economy in the region. In general, the government should consider the actual situation of each region and improve low-carbon development systems while respecting each region’s development law to promote regional sustainable development.
- (3)
- Cross-regional Collaborative Emission Reduction Trading Platform
To effectively build a coordination mechanism for the interests of multiple entities, the government should establish a cross-regional collaborative emission reduction trading platform, improve the cross-regional carbon emission joint prevention and control mechanism, and promote the CER process through market mechanisms improving the policy and legal system. The government should establish a regional collaborative reduction market development platform and a cross-regional CER alliance or joint meeting and encourage the promotion of responsible emission reductions. China needs to promote the orderly transfer and coordinated development of regional industries. Implementing one of the important strategic ways of differentiated emission reduction allowances is urgent.
- (4)
- Promote the orderly transfer of regional industries
The scientific allocation of regional carbon emission limits should accord with the actual situation of each regional industry for the reasonable determination of CO2 emission limits for each region, with the goal of continuously improving the structural efficiency of emission reduction according to the quality of population, industrial structure, resource endowment conditions, energy structure, and level of technological innovation. The government should adjust emission limits in stages based on comprehensive consideration of the macroeconomic development level of each region, its industrial structure, strategic development planning, and other influencing factors. The government should also reshape the internal mechanisms of industrial division of labor, adjust unreasonable industrial structures, formulate effective policies or initiatives to promote the optimization of industrial structures, realize the deep integration of industrial chains, and promote the low-carbon transformation of regional industrial value chains.
Author Contributions
Conceptualization, X.S., H.Z. and Z.Q.; methodology, X.S., H.Z. and Z.Q.; software, H.Z. and Z.Q.; validation, X.S., H.Z., Z.Q., X.W. and J.L.; formal analysis, H.Z. and Z.Q.; validation, X.S., H.Z., Z.Q., X.W. and J.L.; investigation, X.S., H.Z.; resources, H.Z.; data curation, H.Z.; writing—original draft preparation, H.Z. and Z.Q.; validation, X.S., H.Z., Z.Q., X.W. and J.L.; writing—review and editing, H.Z. and Z.Q.; validation, X.S., H.Z., Z.Q., X.W. and J.L.; visualization, H.Z., X.W. and J.L.; supervision, H.Z., X.W. and J.L; project administration, X.S. and H.Z.; funding acquisition, X.S. All authors have read and agreed to the published version of the manuscript.
Funding
This work was supported by the project supported by the National Social Science Fund of China (19BGL276). The authors are grateful for the receipt of these funds.
Institutional Review Board Statement
Not applicable.
Informed Consent Statement
Not applicable.
Data Availability Statement
The data of carbon emission in this paper are from the Carbon Emission Accounts and Datasets (CEADs), and other variable data and related data are from the China Statistical Yearbook.
Conflicts of Interest
The authors declare no conflict of interest.
References
- Pjz, A.; Lez, A.; Hyla, B.; Yang, Z.C.; Hyh, A.; Xyw, D. Green Economic Efficiency and Its Influencing Factors in China from 2008 to 2017: Based on the Super-SBM Model with Undesirable Outputs and Spatial Dubin Model. Sci. Total Environ. 2020, 741, 140026. [Google Scholar]
- Liu, Y.; Liu, M.; Wang, G.; Zhao, L.; An, P. Effect of Environmental Regulation on High-Quality Economic Development in China—An Empirical Analysis Based on Dynamic Spatial Durbin Model. Environ. Sci. Pollut. Res. 2021, 28, 54661–54678. [Google Scholar] [CrossRef] [PubMed]
- Wang, Y.; Chen, H.; Long, R.; Sun, Q.; Jiang, S.; Liu, B. Has the Sustainable Development Planning Policy Promoted the Green Transformation in China’s Resource-Based Cities? Resour. Conserv. Recycl. 2022, 180, 106181. [Google Scholar] [CrossRef]
- Zhang, H.; Sun, X.; Bi, C.; Ahmad, M.; Wang, J. Can Sustainable Development Policy Reduce Carbon Emissions? Empirical Evidence from Resource-Based Cities in China. Sci. Total Environ. 2022, 838, 156341. [Google Scholar] [CrossRef] [PubMed]
- Ahmad, M.; Ahmed, Z.; Yang, X.; Hussain, N.; Sinha, A. Financial Development and Environmental Degradation: Do Human Capital and Institutional Quality Make a Difference? Gondwana Res. 2021. [Google Scholar] [CrossRef]
- Li, S.; Zhao, Y.; Xiao, W.; Yue, W.; Wu, T. Optimizing Ecological Security Pattern in the Coal Resource-Based City: A Case Study in Shuozhou City, China. Ecol. Indic. 2021, 130, 108026. [Google Scholar] [CrossRef]
- Sun, X.; Zhang, H.; Ahmad, M.; Xue, C. Analysis of Influencing Factors of Carbon Emissions in Resource-Based Cities in the Yellow River Basin under Carbon Neutrality Target. Environ. Sci. Pollut. Res. 2021. [Google Scholar] [CrossRef]
- Wang, S.; Fang, C.; Wang, Y. Spatiotemporal Variations of Energy-Related CO2 Emissions in China and Its Influencing Factors: An Empirical Analysis Based on Provincial Panel Data. Renew. Sustain. Energy Rev. 2016, 55, 505–515. [Google Scholar] [CrossRef]
- Zhu, B.; Zhang, T. The Impact of Cross-Region Industrial Structure Optimization on Economy, Carbon Emissions and Energy Consumption: A Case of the Yangtze River Delta. Sci. Total Environ. 2021, 778, 146089. [Google Scholar] [CrossRef]
- Ren, X.; Cheng, C.; Wang, Z.; Yan, C. Spillover and Dynamic Effects of Energy Transition and Economic Growth on Carbon Dioxide Emissions for the European Union: A Dynamic Spatial Panel Model. Sustain. Dev. 2021, 29, 228–242. [Google Scholar] [CrossRef]
- Zhou, D.; Zheng, C.P.; Hua, S.R.; Huang, Y.S. The Potentialities and Paths of China’s Carbon Emission Reduction Based on the Coordination of Fairness and Efficiency. J. Nat. Resour. 2019, 34, 80–91. [Google Scholar] [CrossRef]
- Han, X.; Jiao, J.; Liu, L.; Li, L. China’s Energy Demand and Carbon Dioxide Emissions: Do Carbon Emission Reduction Paths Matter? Nat. Hazards 2017, 86, 1333–1345. [Google Scholar] [CrossRef]
- Zhang, H.; Duan, M.; Deng, Z. Have China’s Pilot Emissions Trading Schemes Promoted Carbon Emission Reductions?– The Evidence from Industrial Sub-Sectors at the Provincial Level. J. Clean. Prod. 2019, 234, 912–924. [Google Scholar] [CrossRef]
- Wang, J.; Li, H. The Mystery of Local Fiscal Expenditure and Carbon Emission Growth in China. Environ. Sci. Pollut. Res. Int. 2019, 26, 12335–12345. [Google Scholar] [CrossRef]
- Yong, W.; Hy, A.; Rs, A. Effectiveness of China’s Provincial Industrial Carbon Emission Reduction and Optimization of Carbon Emission Reduction Paths in “Lagging Regions”: Efficiency-Cost Analysis—ScienceDirect. J. Environ. Manag. 2018, 275, 111221. [Google Scholar]
- Zhong, C.; Liu, Y.; Wang, M.Y.; Shi, Q.L. Feasibility Study on China’s Potential Paths to Intensity-Based Carbon Reduction Targets. China Popul. Environ. 2018, 28, 18–26. [Google Scholar]
- Jia, Z.; Lin, B. Rethinking the Choice of Carbon Tax and Carbon Trading in China. Technol. Forecast. Soc. Chang. 2020, 159, 120187. [Google Scholar] [CrossRef]
- Zheng, Y.; Peng, J.; Xiao, J.; Su, P.; Li, S. Industrial Structure Transformation and Provincial Heterogeneity Characteristics Evolution of Air Pollution: Evidence of a Threshold Effect from China. Atmos. Pollut. Res. 2020, 11, 598–609. [Google Scholar] [CrossRef]
- Du, K.; Li, J. Towards a Green World: How Do Green Technology Innovations Affect Total-Factor Carbon Productivity. Energy Policy 2019, 131, 240–250. [Google Scholar] [CrossRef]
- Xiong, Q.; Sun, D. Influence Analysis of Green Finance Development Impact on Carbon Emissions: An Exploratory Study Based on FsQCA. Environ. Sci. Pollut. Res. 2022, 1–12. [Google Scholar] [CrossRef]
- Toptal, A.; Özlü, H.; Konur, D. Joint Decisions on Inventory Replenishment and Emission Reduction Investment under Different Emission Regulations. Int. J. Prod. Res. 2013, 52, 243–269. [Google Scholar] [CrossRef]
- Yao, S.; Yu, X.; Yan, S.; Wen, S. Heterogeneous Emission Trading Schemes and Green Innovation. Energy Policy 2021, 155, 112367. [Google Scholar] [CrossRef]
- Zhang, Y.J.; Peng, Y.L.; Ma, C.Q.; Shen, B. Can Environmental Innovation Facilitate Carbon Emissions Reduction? Evidence from China. Energy Policy 2017, 100, 18–28. [Google Scholar] [CrossRef]
- Huang, J.; Chen, X.; Cai, X.; Zou, H. Assessing the Impact of Energy-Saving R&D on China’s Energy Consumption: Evidence from Dynamic Spatial Panel Model. Energy 2021, 218, 119443. [Google Scholar] [CrossRef]
- Li, L.; Mcmurray, A.; Li, X.; Gao, Y.; Xue, J. The Diminishing Marginal Effect of R&D Input and Carbon Emission Mitigation. J. Clean. Prod. 2020, 282, 124423. [Google Scholar]
- Lin, B.; Long, H. Emissions Reduction in China’s Chemical Industry-Based on LMDI. Renew. Sustain. Energy Rev. 2016, 53, 1348–1355. [Google Scholar] [CrossRef]
- Bahn, O.; Barreto, L.; Kypreos, S. Modelling and Assessing Inter-Regional Trade Of CO2 Emission Reduction Units. Environ. Model. Assess. 2001, 6, 173–182. [Google Scholar] [CrossRef]
- Zhang, B.; Wang, Z.; Yin, J.; Su, L. CO2 Emission Reduction within Chinese Iron & Steel Industry: Practices, Determinants and Performance. J. Clean. Prod. 2012, 33, 167–178. [Google Scholar]
- Zakeri, A.; Dehghanian, F.; Fahimnia, B.; Sarkis, J. Carbon Pricing versus Emissions Trading: A Supply Chain Planning Perspective. Int. J. Prod. Econ. 2015, 164, 197–205. [Google Scholar] [CrossRef] [Green Version]
- Tang, L.; Wu, J.; Yu, L.; Bao, Q. Carbon Emissions Trading Scheme Exploration in China: A Multi-Agent-Based Model. Energy Policy 2015, 81, 152–169. [Google Scholar] [CrossRef]
- Yu, S.M.; Fan, Y.; Zhu, L.; Eichhammer, W. Modeling the Emission Trading Scheme from an Agent-Based Perspective: System Dynamics Emerging from Firms’ Coordination among Abatement Options. Eur. J. Oper. Res. 2020, 286. [Google Scholar] [CrossRef]
- Hwab, C.; Rc, A.; Wz, A. Multi-Agent Based and System Dynamics Models Integrated Simulation of Urban Commuting Relevant Carbon Dioxide Emission Reduction Policy in China. J. Clean. Prod. 2020, 272, 122620. [Google Scholar] [CrossRef]
- Bouziane, S.E.; Khadir, M.T.; Dugdale, J. A Collaborative Predictive Multi-Agent System for Forecasting Carbon Emissions Related to Energy Consumption. Multiagent Grid Syst. 2021, 17, 39–58. [Google Scholar] [CrossRef]
- Xu, H.; Pan, X.; Guo, S.; Lu, Y. Forecasting Chinese CO2 Emission Using a Non-Linear Multi-Agent Intertemporal Optimization Model and Scenario Analysis. Energy 2021, 228, 120514. [Google Scholar] [CrossRef]
- Shahbaz, M.; Li, J.; Dong, X.; Dong, K. How Financial Inclusion Affects the Collaborative Reduction of Pollutant and Carbon Emissions: The Case of China. Energy Econ. 2022, 107, 105847. [Google Scholar] [CrossRef]
- Wang, F.; Li, H.; Cao, Y.; Zhang, C.; Ran, Y. Knowledge Sharing Strategy and Emission Reduction Benefits of Low Carbon Technology Collaborative Innovation in the Green Supply Chain. Front. Environ. Sci. 2022, 9, 751. [Google Scholar] [CrossRef]
- Yu, X.; Ma, S.; Cheng, K.; Kyriakopoulos, G.L. An Evaluation System for Sustainable Urban Space Development Based in Green Urbanism Principles—A Case Study Based on the Qin-Ba Mountain Area in China. Sustainability 2020, 12, 5703. [Google Scholar] [CrossRef]
- Zhi, B.; Liu, X.; Chen, J.; Jia, F. Collaborative Carbon Emission Reduction in Supply Chains: An Evolutionary Game-Theoretic Study. Manag. Decis. 2019, 57, 1087–1107. [Google Scholar] [CrossRef]


Publisher’s Note: MDPI stays neutral with regard to jurisdictional claims in published maps and institutional affiliations. |
© 2022 by the authors. Licensee MDPI, Basel, Switzerland. This article is an open access article distributed under the terms and conditions of the Creative Commons Attribution (CC BY) license (https://creativecommons.org/licenses/by/4.0/).