Article

Optimizing Leaching of Rare Earth Elements from Red Mud and Spent Fluorescent Lamp Phosphors Using Levulinic Acid

1
Department of Environmental and Sustainable Engineering, University at Albany, State University of New York, Albany, NY 12222, USA
2
College of Nanoscale Science and Engineering, SUNY Polytechnic Institute, Albany, NY 12203, USA
*
Author to whom correspondence should be addressed.
Sustainability 2022, 14(15), 9682; https://doi.org/10.3390/su14159682
Submission received: 27 June 2022 / Revised: 25 July 2022 / Accepted: 4 August 2022 / Published: 5 August 2022
(This article belongs to the Special Issue Valorization of Secondary Resources)

Abstract

:
Although various hydrometallurgical and solvometallurgical efforts have been made to extract REEs from end-of-life (EoL) products and waste, a systematic and statistical analysis of the impacts of leaching parameters to optimize the leaching process using organic acids is necessary, but lacking in the literature. This study employed the response surface methodology to develop mathematical models for optimal leaching by levulinic acid (LevA) of REEs in two waste materials, namely red mud and spent fluorescent lamp phosphors. The established models exhibited excellent statistical properties, in terms of significance, fitting, prediction, and error distribution. For red mud, the optimal conditions of liquid-to-solid ratio (L/S; v/w) of 40, temperature of 70 °C, and duration of 60 h led to 100% leaching of REEs excluding Sc. At the same L/S and temperature, >98.7% of REEs were leached from fluorescent phosphors after 96 h. The SEM–EDS analysis of the waste materials revealed and confirmed morphological and compositional changes after leaching under the optimal conditions.

1. Introduction

With the growing development in technology and economy, rare earth elements (REEs) have been among the most critical metals with increasing demands worldwide, due to their outstanding optical, magnetic, physical, and chemical properties associated with their unique 4f-electron configuration [1]. REEs are indispensable components in various advanced technologies, such as electric vehicles, wind turbines, hydrogen storage, high-energy batteries, high-intensity magnets, lasers, and colored phosphors [2,3,4,5], which play a crucial role in clean energy, energy security, and environmental sustainability. However, due to growing market needs and insufficient supply [6], many developed and developing economies face an increasing risk of shortage in REEs. Therefore, aside from the conventional rare earth mining, more sustainable approaches for recovering these valuable metals from wastes or end-of-life (EoL) products (e.g., urban mining and e-waste recycling) that contain high quantities of REEs are needed to address the current and future market demands [7].
Red mud (or bauxite residue) and fluorescent lamp phosphors are potential sources of REEs. Red mud is a solid waste generated from alumina production from bauxite through the Bayer process [8]. The current global production of red mud is 150 million tons annually and the total inventory has been approximated to exceed 2.7 billion tons so far [9,10]. Red mud contains REEs at a low level, but they are considerably significant in view of their value with tremendous demands and the massive quantities of red mud [11,12]. The REEs’ recovery process, however, is complicated due to the alkalinity and complex chemical composition of red mud. A variety of factors including reagent type, liquid-to-solid ratio (L/S), temperature, duration, and agitation pose impacts on the leaching efficiency of REEs [13].
The annual generation of fluorescent lamps globally has been estimated to reach at least 1.5 billion units [14]. In the U.S. alone, annual spent fluorescent lamps were estimated to be more than 600 million units [15], which contained around 1300 tons of REEs [15,16,17,18]. Based on the market price in 2021 [19,20,21], these rarely exploited REEs are valued at around $51.4 million. The fluorescent phosphors contain non-REE halo-phosphate phosphor (HALO) and tri-color REE phosphors, namely red (YOX), green (LAP/CAT/CBT), and blue (BAM) phosphor. YOX phosphor has the highest economic value because it consists almost entirely of two critical REEs, yttrium (Y) and europium (Eu) in contrast with other phosphors that are only doped with small amounts of REEs [22].
Various investigations using hydrometallurgical and solvometallurgical methods have been carried out to recover REEs from red mud and fluorescent phosphors. For instance, a sulfation process with concentrated H2SO4, combined with calcination, have been performed to recover REEs from red mud [23,24]. H2SO4 has been used to leach REEs from phosphors at 70 °C and subsequently ammonia was added to precipitate rare earth hydroxides [25]. HALO and YOX phosphors can be easily dissolved in diluted inorganic acids, while the green and blue phosphors exhibit resistance [22,26]. Although oxides of Y and Eu dissolve well in HNO3, HCl, and H2SO4 [27], employing inorganic acids involves formation of large amount of processing solutions and spent liquor, requires acid-resistant equipment, and shows low selectivity of REEs leaching, which calls for development of multistage technologies that increase the cost and difficulty for practical implementation [28].
Solvometallurgy uses non-aqueous solvents such as ionic liquids (ILs), organic acids, or deep-eutectic solvents (DES), which can mitigate environmental impacts by forming less processing solutions and spent liquor and decrease the cost on equipment [28]. A hydrophobic IL betainium bis(trifluoromethylsulfonyl) imide was tested for recovery of REEs from red mud [29]. The optimal leaching condition was found to be an aqueous solution of 40% with stirring at 400 rpm and 150 °C for 4 h, leading to a scandium (Sc) recovery of 45%. Bonomi et al. [30] investigated leaching of REEs from red mud by 1-ethyl-3-methylimidazolium hydrogen sulfate. The leaching at 200 °C for 12 h with the stirring at 200 rpm and L/S ratio of 20 resulted in an Sc recovery of 80%. A functionalized IL betainium bis (trifluoromethylsulfonyl) imide, [Hbet][Tf2N], was employed to perform selective leaching from YOX [22]. Y and Eu were then recovered from leachate through precipitation by oxalic acid, and the precipitate was subsequently calcined to obtain YOX with a purity of >99.9% [22]. Although ILs are claimed as green solvents, their high costs and low throughput of separation processes make them difficult to be used at industrial scales [27].
A solvometallurgical method using levulinic acid (LevA) and DES choline chloride—LevA to recover REEs from lamp phosphors was established [31]. The DES exhibited high solubility of YOX and low solubility of HALO phosphor. Pure LevA held more suitable properties than DES for the selective recovery of YOX. A multistep leaching process combining hydro- and solvometallurgy using methanesulfonic acid (MSA) as a lixiviant was also developed [32]. In this case, the HALO, YOX, and LAP phosphors were leached sequentially using pure or diluted MSA at room temperature, 80, or 180 °C.
Although a significant amount of work has been performed on recovering REEs from red and fluorescent phosphors, a more comprehensive and systematic, as well as statistical analysis of impacts of parameters on leaching efficiency is truly lacking in the current literature. In this study, we developed mathematical models for leaching REEs from both red mud and spent lamp phosphors using LevA. This acid was selected based on a screening of seven organic acids and eight DES. Three significant factors, namely L/S, duration, and temperature were integrated in the models established by Box–Behnken factorial designs. This design was employed to analyze the relations between a group of quantitative parameters and one or more response variables by response surface methodology (RSM) [33]. With the models, we identified and experimentally confirmed the optimal conditions to achieve the highest leaching efficiency. Moreover, the models allow us to fine-tune leaching parameters to fit certain needs with foreknowledge of leaching efficiency and related costs. To the best of our knowledge, using LevA for leaching REEs in red mud has not been reported before. A systematic and statistically guided optimization of REE leaching from fluorescent phosphor adds significant insight and an interesting tool to studies in this field.

2. Materials and Methods

2.1. Chemicals

Levulinic acid (LevA; >98%), malonic acid (MA; >99.5%), succinic acid (SA; >99.5%), lactic acid (LacA; >85%), acetic acid (AceA; 99.7%), formic acid (ForA; 99%), oxalic acid (OA; 98%), choline chloride (ChCl; 99%), urea (UA; >99%), ethylene glycol (EG; >99%), hydrochloric acid (36.5–38%), nitric acid of certified ACS plus (68–70%) and trace metal (67–70%) grade, lanthanum oxide (La2O3; 99.9%), cerium oxide (CeO2; 99.9%), gadolinium oxide (Gd2O3; 99.9%), and yttrium oxide (Y2O3; 99.9%) were purchased from Fisher Scientific (Waltham, MA, USA). The rare earth standard solutions (100 ppm in 7 vol% HNO3) were purchased from Inorganic Ventures (Christiansburg, VA, USA). Water was always of ultrapure quality with a resistivity of 18.2 MΩ·cm obtained from a Millipore ultrapure water system. All chemicals were used as supplied without any further purification.

2.2. Processing and Characterization of Raw Red Mud and Spent Fluorescent Lamps

The raw red mud was provided by an alumina refinery in Quebec, Canada. Based on the information from the provider, the pH was 12–13 at 10 wt% concentration, and the relative density was 1.3. The range of major components (wt%) given by the provider were 25–55% Fe2O3, 15–30% Al2O3, 5–15% TiO2, 4–15% SiO2, 5–10% NaOH, 2–10% Na2O, and 1–8% CaO. Prior to leaching experiments, the red mud samples were dried in an oven at 105 °C for 24 h and ground using a set of mortar and pestle, followed by passing through a 125 µm sieve. The powders smaller than 125 µm were collected and used for leaching (Figure S1A).
The spent lamps were provided by Office of Environmental Health & Safety of University at Albany, SUNY. This office collects e-waste generated at the university campus. To process spent fluorescent lamps for obtaining fluorescent phosphor powders, the end cut method was used to break the lamps [18,34]. The scraps were collected in a 1 L beaker and calcined at 125 °C for 1 h in a muffle furnace to remove mercury. Subsequently, the processed scraps were ground using a set of mortar and pestle and sieved with 125 and 63 µm sieves. The particles smaller than 63 µm were collected for leaching experiments (Figure S1B).

2.3. Screening of Solvents for Leaching Using Pure Rare Earth Oxides

Seven organic acids (i.e., LevA, MA, SA, LacA, AceA, ForA, and CA) and eight DES (i.e., ChCl–UA, ChCl–EG, ChCl–MA, ChCl–OA, ChCl–CA, EG–CA, EG–MA, and ChCl–LevA) were screened for leaching REEs from four rare earth oxides (REOs; i.e., La2O3, CeO2, Gd2O3, and Y2O3). This was to identify the most suitable leaching solvent. A certain amount of each REO was added to an organic acid or DES to reach the designed L/S (L/kg; Table S1). The temperature was set as 50 or 80 °C, and the magnetic stirring speed was set as 500 rpm for all tests. Ultrapure water was used as a control with the dissolution set as 0%. At the end of leaching for 24, 48, or 72 h, the dissolution rates of REOs were classified as 0, 20%, 40%, 60%, 80%, or 100%, based on the extent of solid disappearance by visual observation. An example of the classification of dissolution can be found in Figure S2.

2.4. Experimental Design for Identifying Optimal Leaching Parameters

Three variables, i.e., L/S, temperature, and duration, which could significantly impact leaching, were assessed to identify the optimal leaching condition using the Box–Behnken design. It needs to be noted that the concentration of LevA was fixed at 70% since this was reported as the optimal for leaching REEs in fluorescent phosphor. For each variable, three coded levels were tested within the selected ranges that were 10–30 L/kg for L/S, 50–90 °C for temperature, and 24–72 h for duration. The three coded levels were low (−1), middle (0), and high (+1) (Table 1). The stirring speed was set as 500 rpm for all tests. The response was leaching efficiency (% L) which was calculated by Equation (1):
%   L = m L m i × 100
where mL and mi are the mass of the dissolved metals in the leachate and in the initial solid sample, respectively. Since both target wastes contained more than one REE, the % L considered all REEs in a given material rather than a leaching efficiency for an individual REE. A three-factor and three-level experiment was designed using the Design-Expert software (Stat-Ease Inc., Minneapolis, MN, USA). Second (Equation (2)) or third order (Equation (3)) polynomial model was obtained upon finishing the leaching experiments:
Y = β 0 + β i χ i + β i χ i 2 + β ij χ i χ j
Y = β 0 + β i χ i + β i χ i 2 + β i χ i 3 + β ij χ i χ j + β ijk χ i χ j χ k
where Y is the predicted response, β is the coefficient, and χi, χj, and χk are the coded levels of variables i, j, and k, respectively. The statistical analysis of the models was conducted by analysis of variance (ANOVA). The significance of variables was determined by Fisher’s F-test. Once a statistically significant model was determined for each feedstock and optimal conditions for achieving the highest leaching efficiency were given by the software, experiments were conducted to validate the predicted conditions. This practice was iterated until the models were validated successfully.

2.5. Quantification of REEs and Morphological and Compositional Analysis of the Solids

Leaching experiments were performed in 20 mL closed glass vials. The lixiviant of 70% LevA in deionized water was added to a desired amount of solid to reach the designated L/S, and magnetically stirred at 500 rpm and heated at the desired temperature for a certain period of time using a hot plate. Following leaching, the liquid and residual solid were separated by centrifugation at 3200× g for 15 min. The liquid, referred to as the pregnant leach solution (PLS) was passed through a 0.45 μm PET membrane filter. The filtrate was subject to metal analysis as described below. A few residual solid samples were dried in a ventilated oven at 80 °C. The morphology and composition of these samples together with their corresponding untreated samples were analyzed by a scanning electron microscopy equipped with energy dispersive X-ray spectrometry (SEM–EDS; Zeiss LEO 1550, Oberkochen, Germany; Bruker Quantax XFlash 6, Billerica, MA, USA).
To quantify total REEs in the two target materials, the EPA method 200.7 [35] was used to digest the red mud and fluorescent phosphor solids. Briefly, 1.0 g of solid was added to a 250 mL beaker, followed by adding 4 mL of two-fold diluted HNO3 and 10 mL of five-fold diluted HCl. The lip of the beaker was covered with a watch glass, and a hot plate was used to heat the beaker for reflux extraction of the analytes at approximately 95 °C for 30 min. Once the extract was cooled down, it was transferred and diluted to 100 mL in a volumetric flask, followed by filtration with 0.45 μm membrane. The REEs contents in the acid digestion extract and PLS were measured using an inductively coupled plasma optical emission spectroscopy (ICP–OES; Perkin Elmer Optima 3300 DV, Shelton, CT, USA). Six major REEs in red mud were analyzed, i.e., Ce, Sc, Nd, La, Gd, and Y, while two dominant REEs, i.e., Y and Eu, were quantified for fluorescent phosphors. These REEs were quantified based on calibration curves established for each one.

3. Results and Discussion

3.1. Screening of Leaching Solvents Using Pure Rare Earth Oxides

Given the countless solvents that could be used for leaching REEs in wastes, we started with a screening test to identify suitable ones for this purpose. To ease comparison, we tested seven organic acids and eight DES on their performance of leaching REEs in REOs. These 15 solvents were pre-selected based on previous reports [31,36]. Among the four tested REOs, CeO2 was the most difficult to be dissolved with the highest dissolution of 40%, in contrast with the other three REOs with the highest dissolution of 100% (Table S1). CeO2 was also demonstrated to resist leaching by other researchers [37]. In general, organic acids exhibited a higher leaching performance than DES, which might be due to the generally lower viscosity of organic acids facilitating faster mass transfer and lower energy consumption [31]. Among the seven organic acids, LevA, a keto acid at 70% (6.87 mol/L) and saturated MA, a dicarboxylic acid at 7.33 mol/L showed superior abilities to dissolve REEs compared to the others. Further comparisons between these two acids led to the conclusion that 70% LevA was better than MA for dissolving REEs in the four REOs with a lower L/S.

3.2. Quantification of REEs in Original Red Mud and Fluorescent Phosphors by ICP–OES

The original red mud and fluorescent phosphor solids were digested using the standard EPA method, and the REEs were quantified by ICP–OES, as shown in Table 1. The most abundant REEs in descending order of quantities in our examined red mud originated from Canada were Ce, Sc, Nd, La, Gd, and Y, which was generally consistent with previous research [38]. A comparison with previous studies of Canadian red mud indicated our sample contained the similar main REE species with concentrations similar to those reported. For example, Reid et al. [39] found the main REEs in a Canadian red mud sample were Ce, La, Nd, Sc, and Sm with a total concentration of 0.029%, while Anawati and Azimi [40] reported that Ce, Y, La, Nd, Sc, and Sm with a total concentration of 0.026% were contained in their tested red mud. The REEs contents in our sample generated from Canada without karst [41] were relatively lower than those in red mud originated from a mixture of karst and lateritic bauxites in Greece [38], indicating REEs may vary in contents depending on origins and geographical locations [41]. Regarding fluorescent phosphors, Y and Eu were the most abundant REEs with a total proportion of 9.43 wt% (Table 1). This is consistent with the percentage of YOX (~10 wt%) in spent fluorescent phosphors [34].

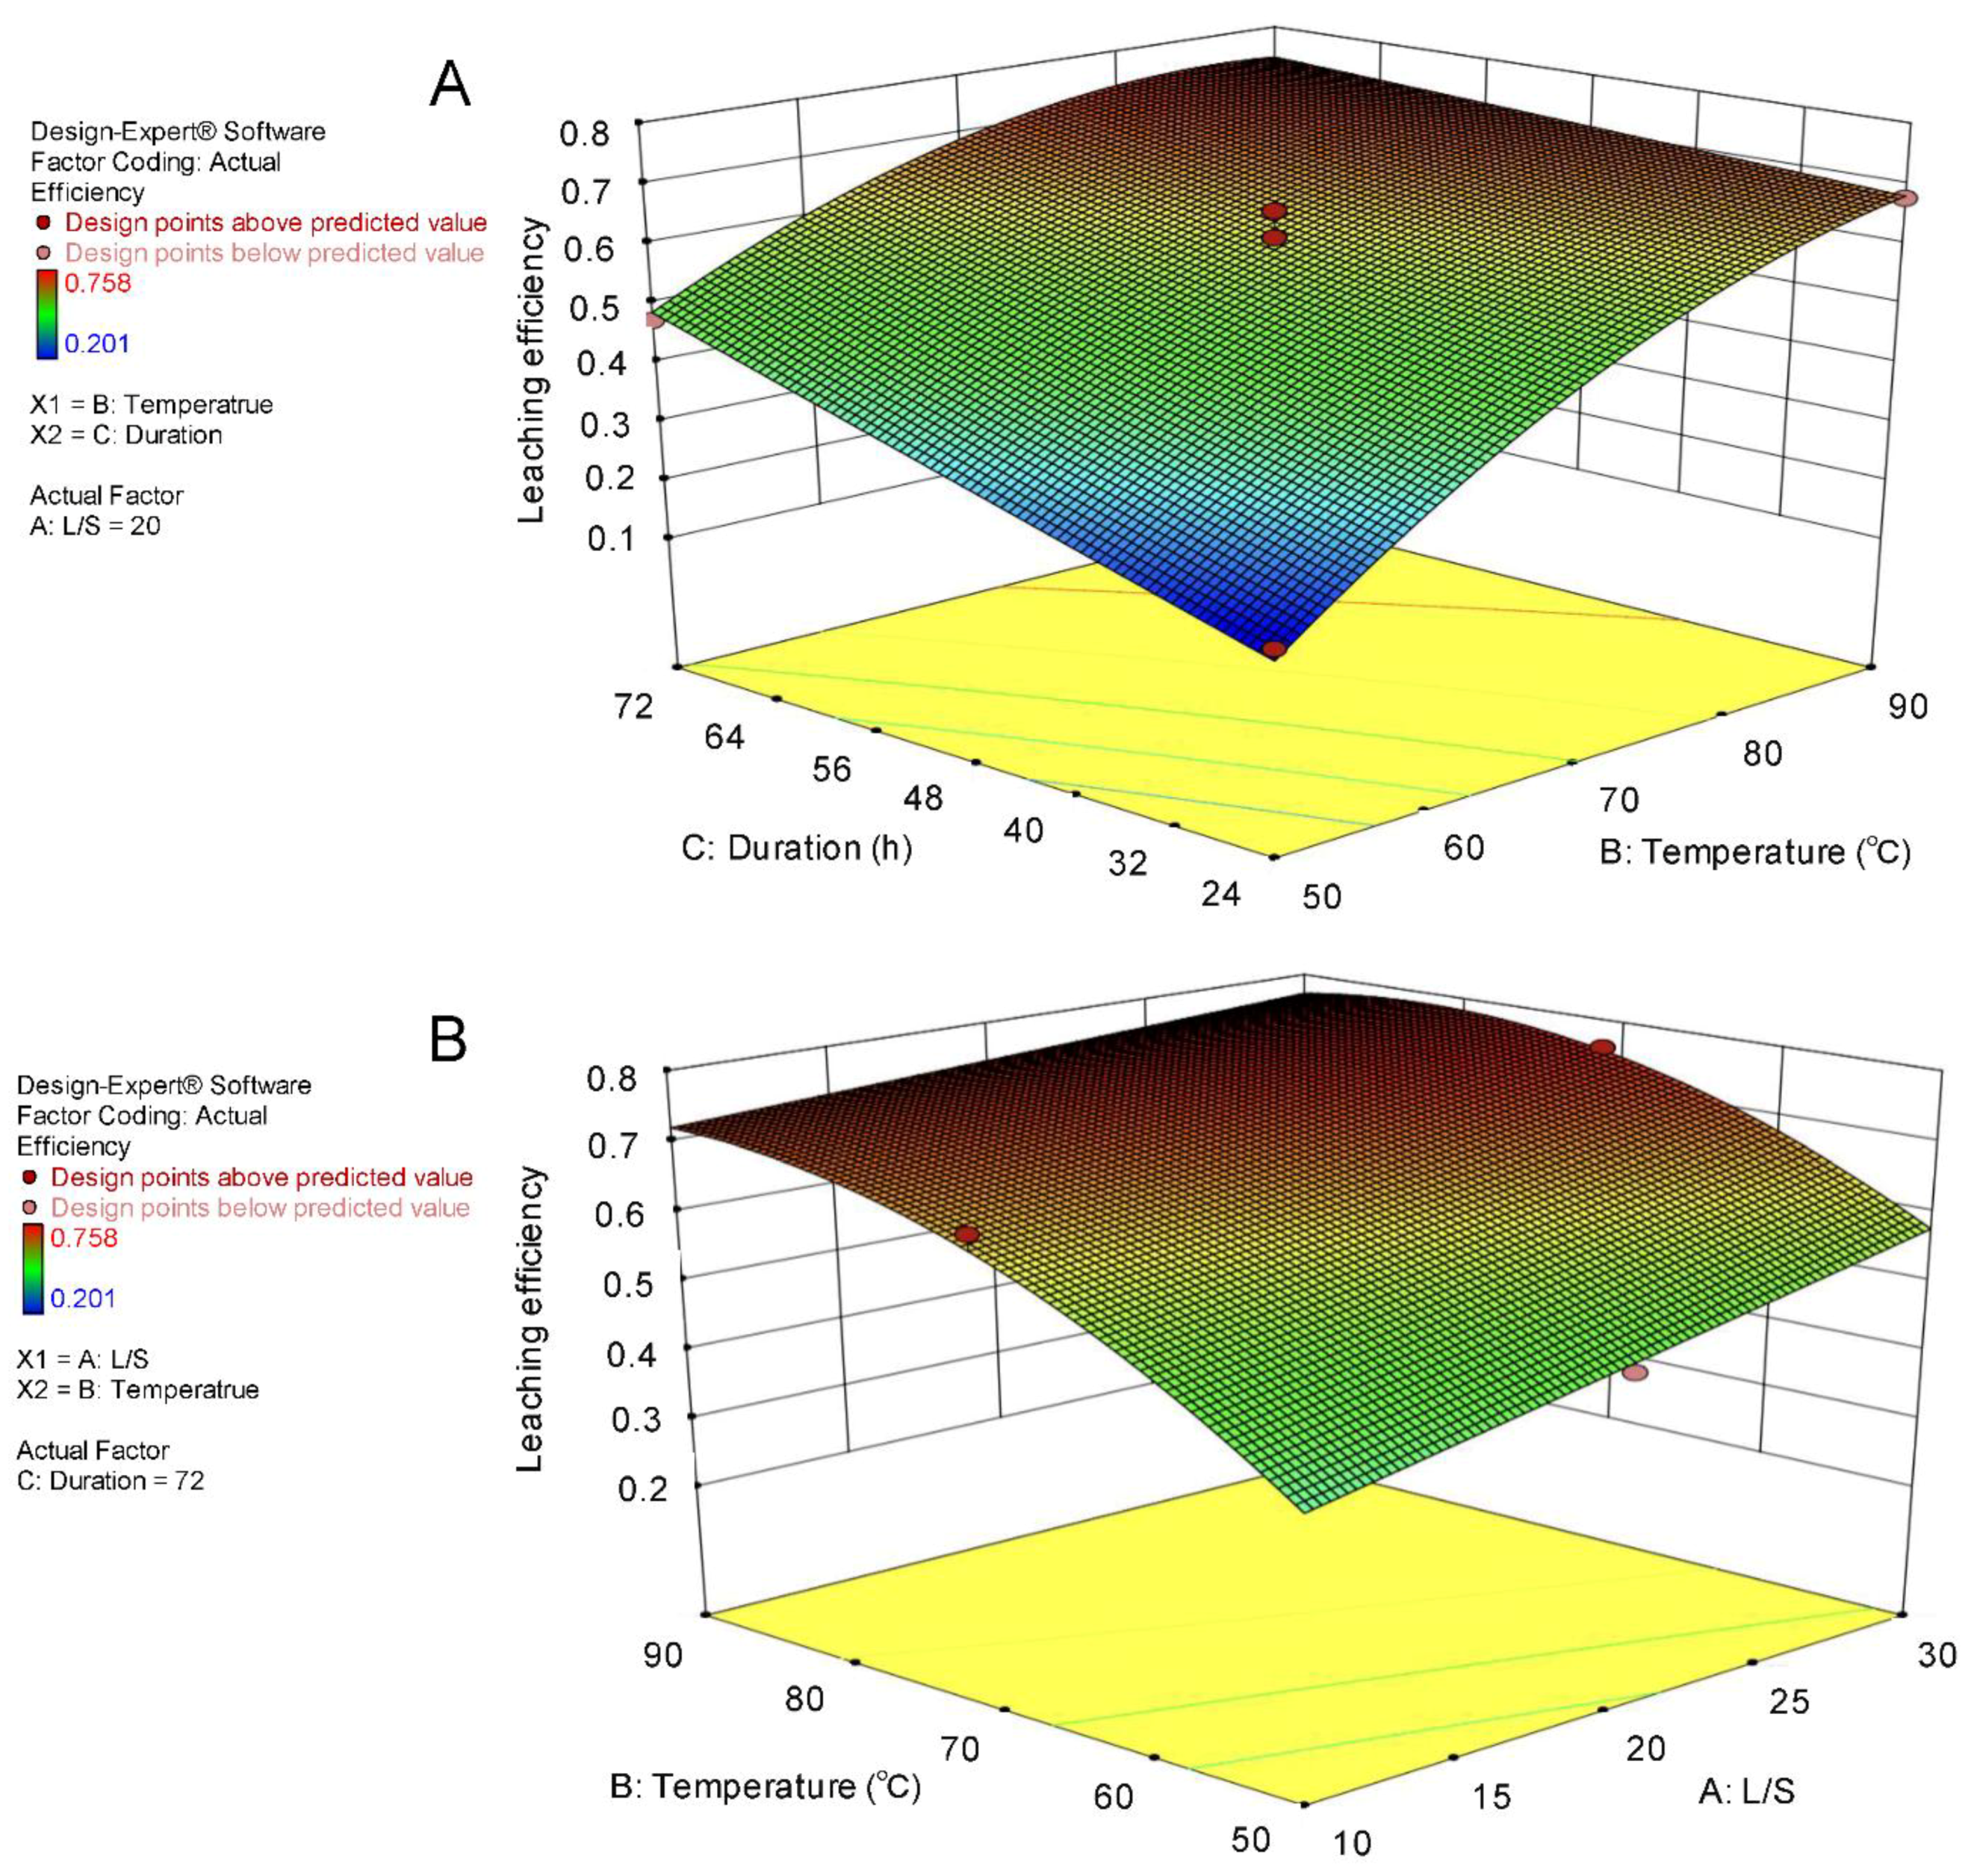
3.3. Identification of Optimal Conditions for Maximal Leaching Efficiency by LevA

A total of 17 runs was necessitated in the three-factor and three-level Box–Behnken design. Replications at the center points and tests at the midpoints of each edge of the multidimensional cube defining the targeted region were contained in the design. For red mud, the total leaching efficiency ranged from 39.1% to 71.1% (Table 2). Among the six REEs examined, Sc had the lowest leaching efficiency of 4.3–9.9%. This could be attributed to the fact that Sc is embedded in the iron (III) oxide lattice [42] and has a very close association with the iron oxide phases in red mud [38]. Therefore, unless iron was dissolved to a great extent, Sc would not be largely leached from red mud. As shown by our EDX analysis discussed in Section 3.6, LevA seemed not a good solvent for iron. It is also supported by the literature that iron-based catalysts including Fe2O3 are used for LevA synthesis [43,44]. Another factor that might affect iron and Sc leaching was pH [38,45], which was 3 at L/S of 10 in this study. It was found that with an increase of pH from 2 to 4, the iron extraction decreased from 7.7% to 0.03% [45]. The highest leaching efficiency of La, Gd, and Y was 100%, higher than that of Ce, which was congruent with our screening experiment results. Regarding fluorescent phosphors, the total leaching efficiency fell within the range of 20.1–75.8%. The highest total leaching efficiency for both red mud and fluorescent phosphors was derived from the same condition with the highest L/S of 30, the medium temperature of 70 °C, and the highest duration of 72 h.
The application of response surface methodology generated polynomial regression models establishing empirical relations between the total leaching efficiency and the examined variables, i.e., L/S (Χ1), temperature (Χ2), and duration (Χ3), in coded units. A response surface reduced cubic model (third order) and quadratic model (second order) was generated for red mud (Equation (4)) and fluorescent phosphors (Equation (5)), respectively:
Total   efficiency = 3.327 8.006 × 10 2 Χ 1 1.03 × 10 2 Χ 2 4.892 × 10 2 Χ 3 + 1.924 × 10 3 Χ 1 Χ 3 + 1.898 × 10 4 Χ 2 Χ 3 + 1.829 × 10 3 Χ 1 2 + 1.585 × 10 4 Χ 3 2 4.738 × 10 5 Χ 1 2 X 3
Total   efficiency = 1.742 + 4.94 × 10 3 Χ 1 + 4.673 × 10 2 Χ 2 + 9.24 × 10 3 Χ 3 1.63 × 10 4 Χ 1 Χ 2 + 1.7 × 10 4 Χ 1 Χ 3 1.26 × 10 4 Χ 2 Χ 3 2 × 10 4 Χ 2 2
The equations in terms of actual variables can be employed to predict the response for given levels of each variable in the original unit. It is worth noting that the equations by themselves cannot be used to elucidate the relative impact of each variable due to the scaled coefficients accommodating the units of each variable and the intercept not at the center of the design space. Instead, analysis of variance (ANOVA) was performed to determine the dominant variables and evaluate the significance and adequacy of the established models.
As displayed in Table 3, the F- and p-values for both red mud and fluorescent phosphors models suggested both were significant and could accurately describe the experimental data. This was also supported by the excellent correlation between predicted and actual data for both models (Figures S3A and S4A). Additionally, the linear normal probability plot of the residuals for both models implied the error terms were normally distributed (Figures S3B and S4B). The lack-of-fit F-value of 0.31 for red mud model and of 0.76 for fluorescent phosphors model indicated the lack-of-fit was insignificant compared to the pure error, meaning the models fitted well. With the developed models, the desired or maximal leaching efficiency can be achieved through various combinations of variables (L/S, temperature, and duration). Furthermore, the leaching parameters can be fine-tuned using the models to meet certain needs in terms of leaching efficiency and the associated costs.
Moreover, the ANOVA results revealed that among the three variables, L/S exerted the most significant impact on leaching efficiency for red mud, while temperature and duration exhibited more significant impacts for fluorescent phosphors (Table 3). A p-value less than 0.05 of a model term suggested that it was significantly different from zero at the 95% confidence level. In the scenario of red mud, four model items were significant, including L/S, interaction between temperature and duration, squared duration, and interaction between squared L/S and duration. Regarding fluorescent phosphors, the significant model items were temperature, duration, interaction between L/S and duration, interaction between temperature and duration, and squared temperature. With the consideration of F-ratio statistics, we can identify the most dominant factors, i.e., L/S for red mud and temperature for fluorescent phosphors, the change in which could lead to a major variation in total leaching efficiency.
The interplays between the response and variables were illustrated by the three-dimensional response surface plots (Figure 1 and Figure 2). For red mud, with a fixed L/S at 30, an increase in duration led to an increase in leaching efficiency with a certain temperature (Figure 1A). When the temperature was fixed at 50 °C, increasing L/S or duration generally raised leaching efficiency (Figure 1B). For fluorescent phosphor, with a fixed L/S at 20, an increase in temperature or duration resulted in an increase in leaching efficiency (Figure 2A). The similar observation was applicable to the situation with a fixed duration at 72 h, in which an increase in temperature or L/S led to an increase in leaching efficiency (Figure 2B). When the temperature was fixed at 70 °C, the same trends were also observed (Figure S5). Based on these analyses, the optimal condition for red mud was identified as L/S of 40, temperature of 70 °C, and duration of 60 h with a maximal leaching efficiency of 100%. Regarding fluorescent phosphors, the optimal condition was L/S of 40, temperature of 70 °C, and duration of 96 h with a maximal leaching efficiency of 98.7%. These conditions were validated by experimental data, as described in the following section.
Given these conditions, a thorough technical economic analysis considering all costs in the process, including capital and operational costs, indicated that the leaching of REEs from red mud was uneconomical at the present stage. This was mainly due to the low contents of REEs in red mud and the price tag of LevA. In the case of fluorescent phosphors, although more revenue could be generated compared to red mud with the same quantity, a net loss was still obtained considering all investment costs. Nevertheless, in view of the expanding scales and improving processes of LevA manufacturing which could lead to more competitive prices, as well as constantly increasing demands and costs of REEs, a profitable outcome is expected from leaching of REEs from red mud and fluorescent phosphors in the coming future.

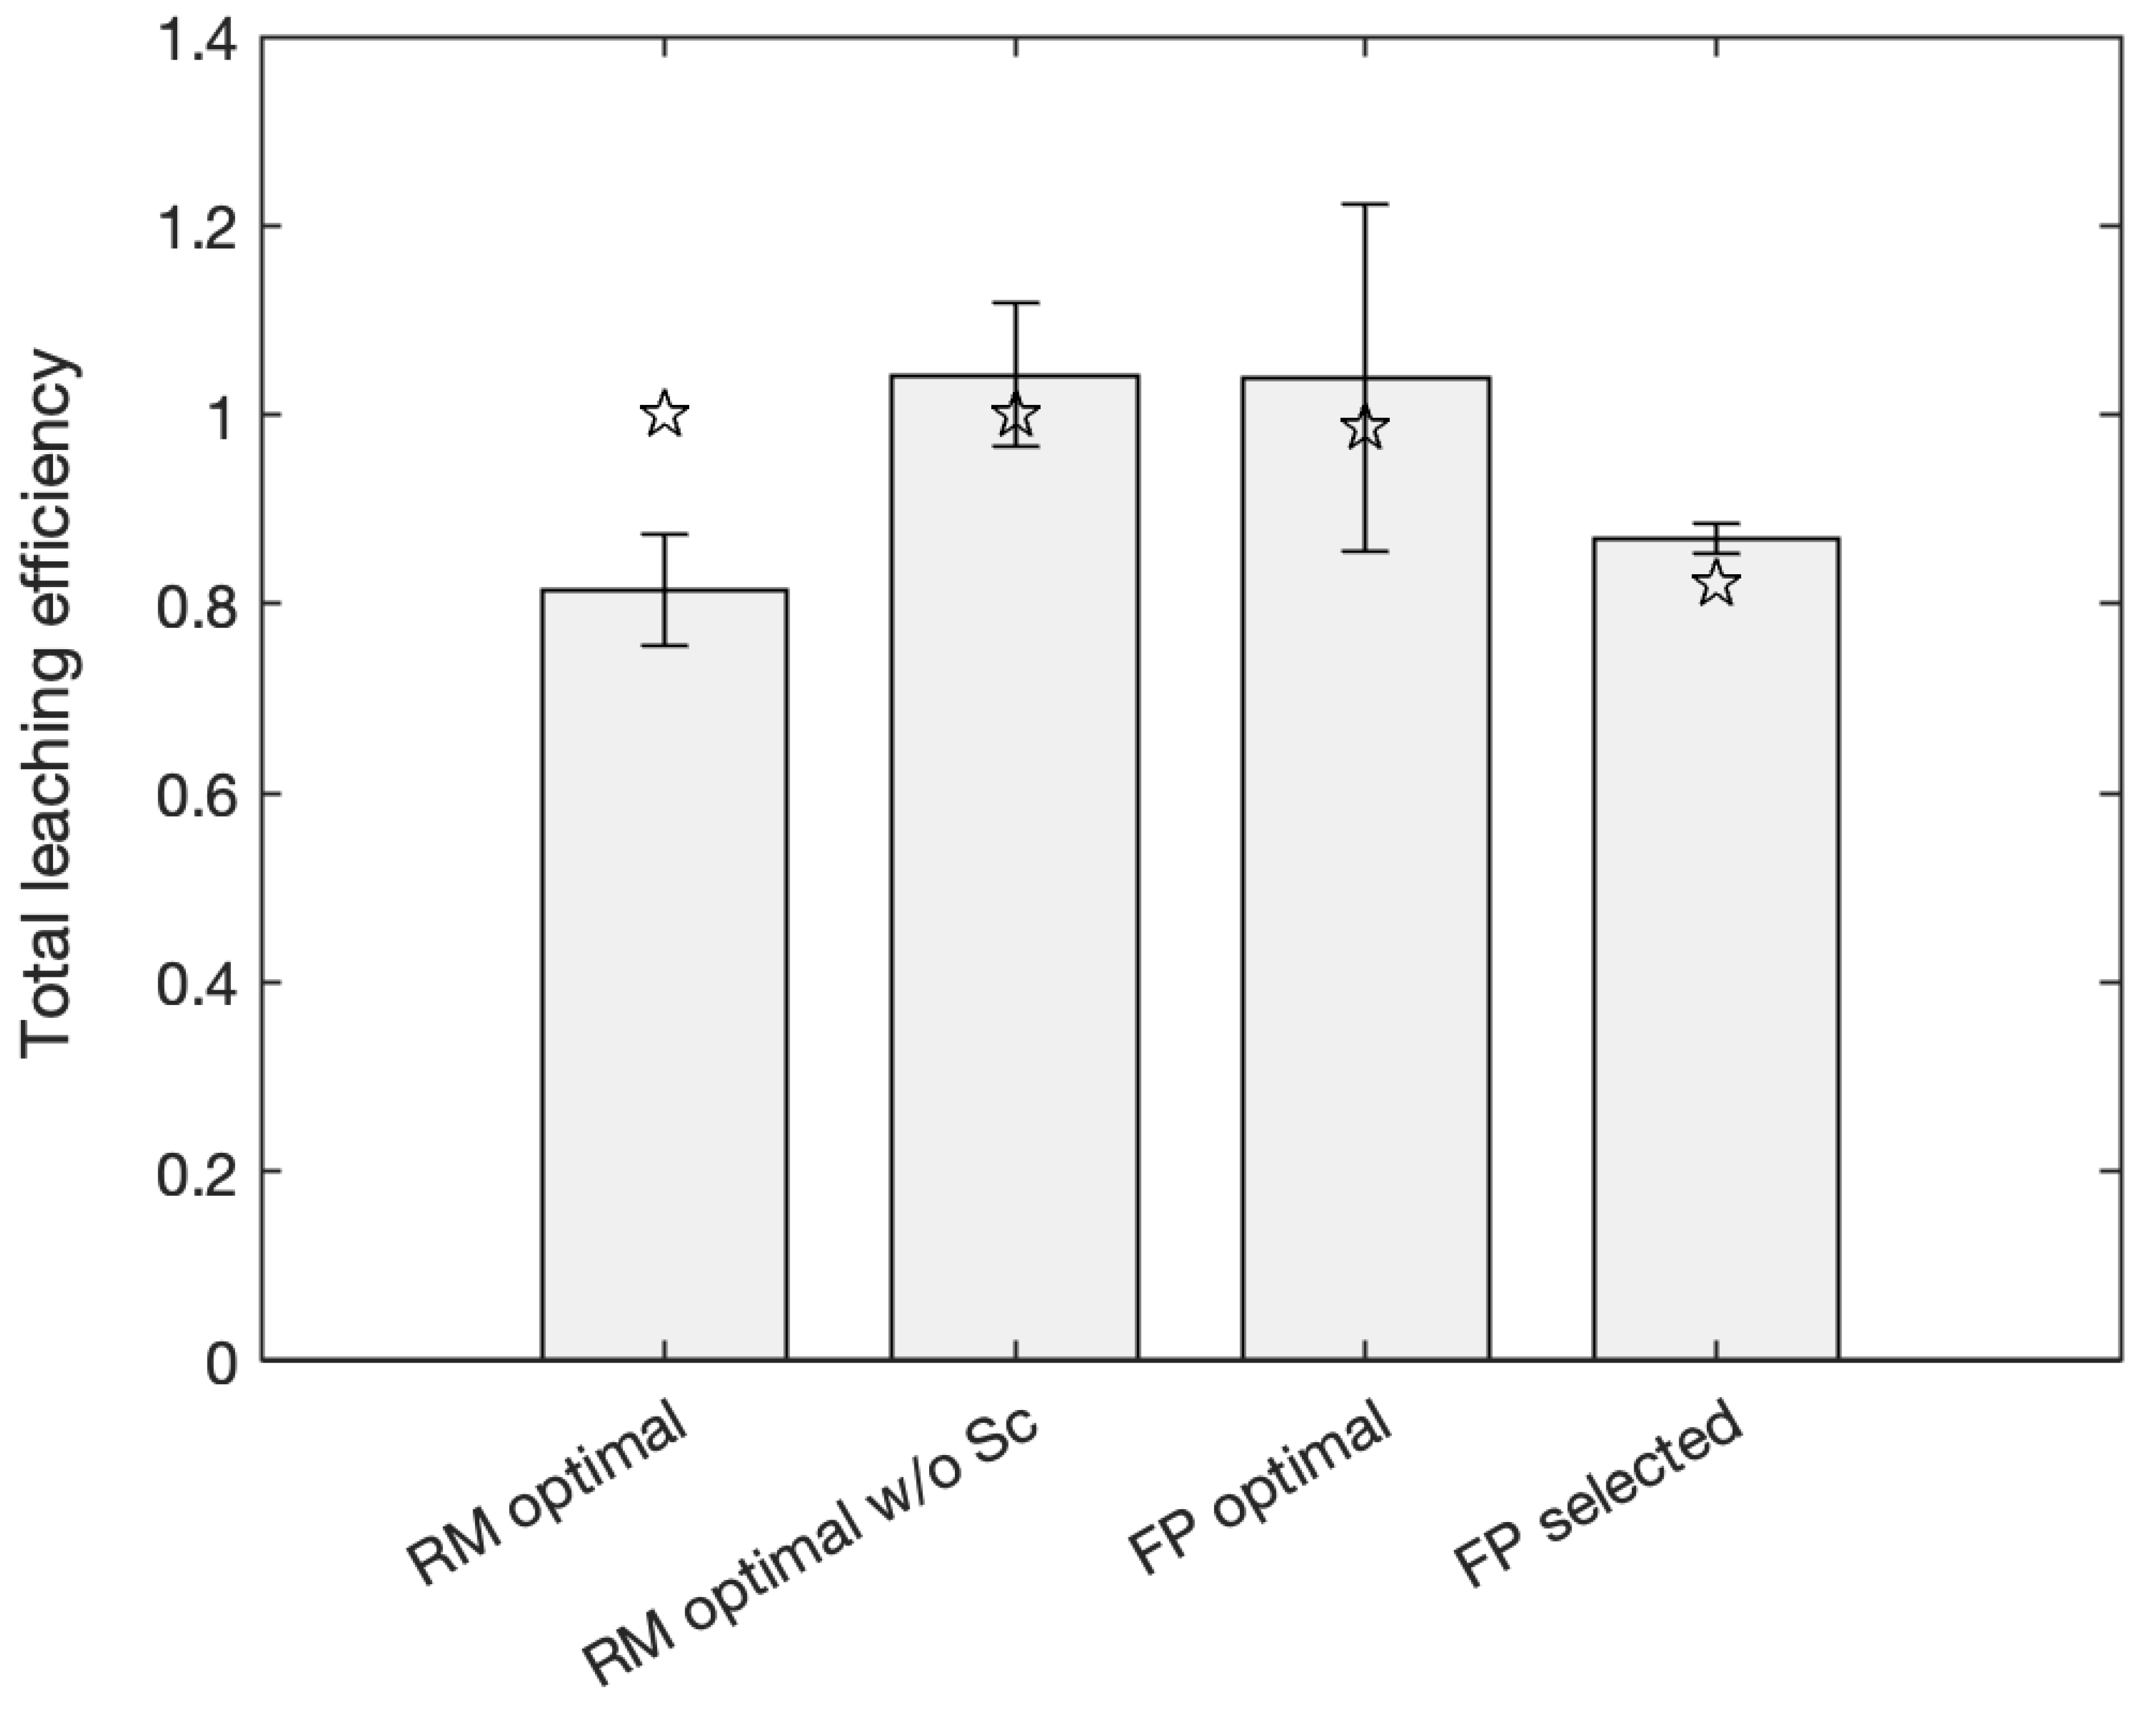
3.4. Validation of Models under Optimal and Randomly Selected Conditions

To validate the models established for leaching of REEs from red mud and fluorescent phosphors by 70% LevA, the optimal conditions for the two solids and a randomly selected condition (L/S of 30, temperature of 79 °C, and duration of 81 h) for fluorescent phosphors were tested to compare the experimental and predicted leaching efficiency. As shown in Figure 3, the measured and predicted total leaching efficiency matched well under both optimal and randomly selected conditions for fluorescent phosphors, indicating the experimental design and developed models were effective for identifying optimal conditions and making predictions.
Regarding red mud, however, the measured total leaching efficiency was lower than the predicted one under optimal conditions, with 81.4 ± 5.9% versus 100%, respectively. This could be attributed to the low leaching efficiency of Sc (11.3 ± 0.8%) under optimal conditions. Since total leaching efficiency was the response, the leaching of individual REEs may not be captured by the model. Sc accounted for a relatively high percentage, with ~22% of total REEs in red mud, making Sc a limiting factor and the difference between measured and predicted values mainly un-leached Sc. This conclusion was supported by the recalculation of measured total efficiency without inclusion of Sc, which matched perfectly with the predicted efficiency (Figure 3). Thus, considering the low sensitivity of the model to Sc and the ineffectiveness of LevA for this REE in red mud, Sc may be separately considered when applying the model.

3.5. Comparison of Leaching Efficiency between This Study and the Literature

The high leaching efficiency of REEs from red mud and phosphors obtained in this study was remarkable compared to previously reported values in the literature, especially considering the green and biogenic characteristics of LevA as well as the simple and low-cost leaching process. For instance, to leach REEs from red mud, a sulfation-roasting-leaching process using concentrated H2SO4 with an optimum roasting temperature of ~700 °C, roasting duration of 1 h, and leaching L/S of 1 was developed, resulting in an extraction of 60–80% of REEs after leaching for 2–7 d [46]. Another sulfation process was carried out to treat red mud with 80% H2SO4 at 120 °C for 14 h, followed by calcination at 700 °C for 1 h, leading to 88% of REEs recovery [24]. Alkan et al. [23] leached Sc from the slags produced from reductive smelting of red mud by mixing slags with 97% H2SO4 and deionized water, followed by holding samples at 75 °C for 1 h, after which around 70% of Sc was extracted. Reid et al. [39] pretreated red mud using microwave and then used H2SO4 as the leaching reagent, obtaining 64.2% and 78.7% of leaching efficiency for Sc and Nd, respectively. An acid baking water leaching process was developed to recover Sc from red mud [40], in which red mud was mixed with concentrated H2SO4 and baked at 200–400 °C. The Sc extraction efficiency was 58% and 80% at baking temperatures of 200 and 400 °C, respectively. Shoppert et al. [45] employed MgSO4 as the lixiviant to selectively leach Sc from alkali and thermally activated red mud, and achieved >80% of Sc leaching efficiency at pH of 2, L/S of 10, temperature of 80 °C, and duration of 1 h. As aforementioned, in the studies using ILs to leach Sc from red mud, the leaching efficiency of 45% and 80% were obtained under their respective conditions [29,30].
In the comparison with literature values on the leaching of REEs from fluorescent phosphors, our study also showed excellent results. For example, 1 M H2SO4 has been used to leach REEs from phosphors under the optimal condition as L/S of 20, temperature of 80 °C, and duration of 3 h, resulting in extraction yields of 88% for Eu and 99.8% for Y [47]. In another report using H2SO4 conducted by Strauss et al. [25], the recovery of 65% and 67% was obtained for Y and Eu, respectively. In the aforementioned study using [Hbet][Tf2N] to dissolve pure YOX phosphor performed by Dupont and Binnemans [22], the YOX with a L/S of as low as 25 could be completely dissolved at 90 °C for 40 h, but a higher L/S dramatically reduced the leaching efficiency. Our data were comparable to that of the study using LevA to dissolve pure YOX, which was nearly 100% under L/S of 10, temperature of 80 °C, and duration of 48 h [31], and higher than the reported one, which was around 90% of YOX dissolution, using diluted MSA under L/S of 15, temperature of 80 °C, and duration of 2 h [32].

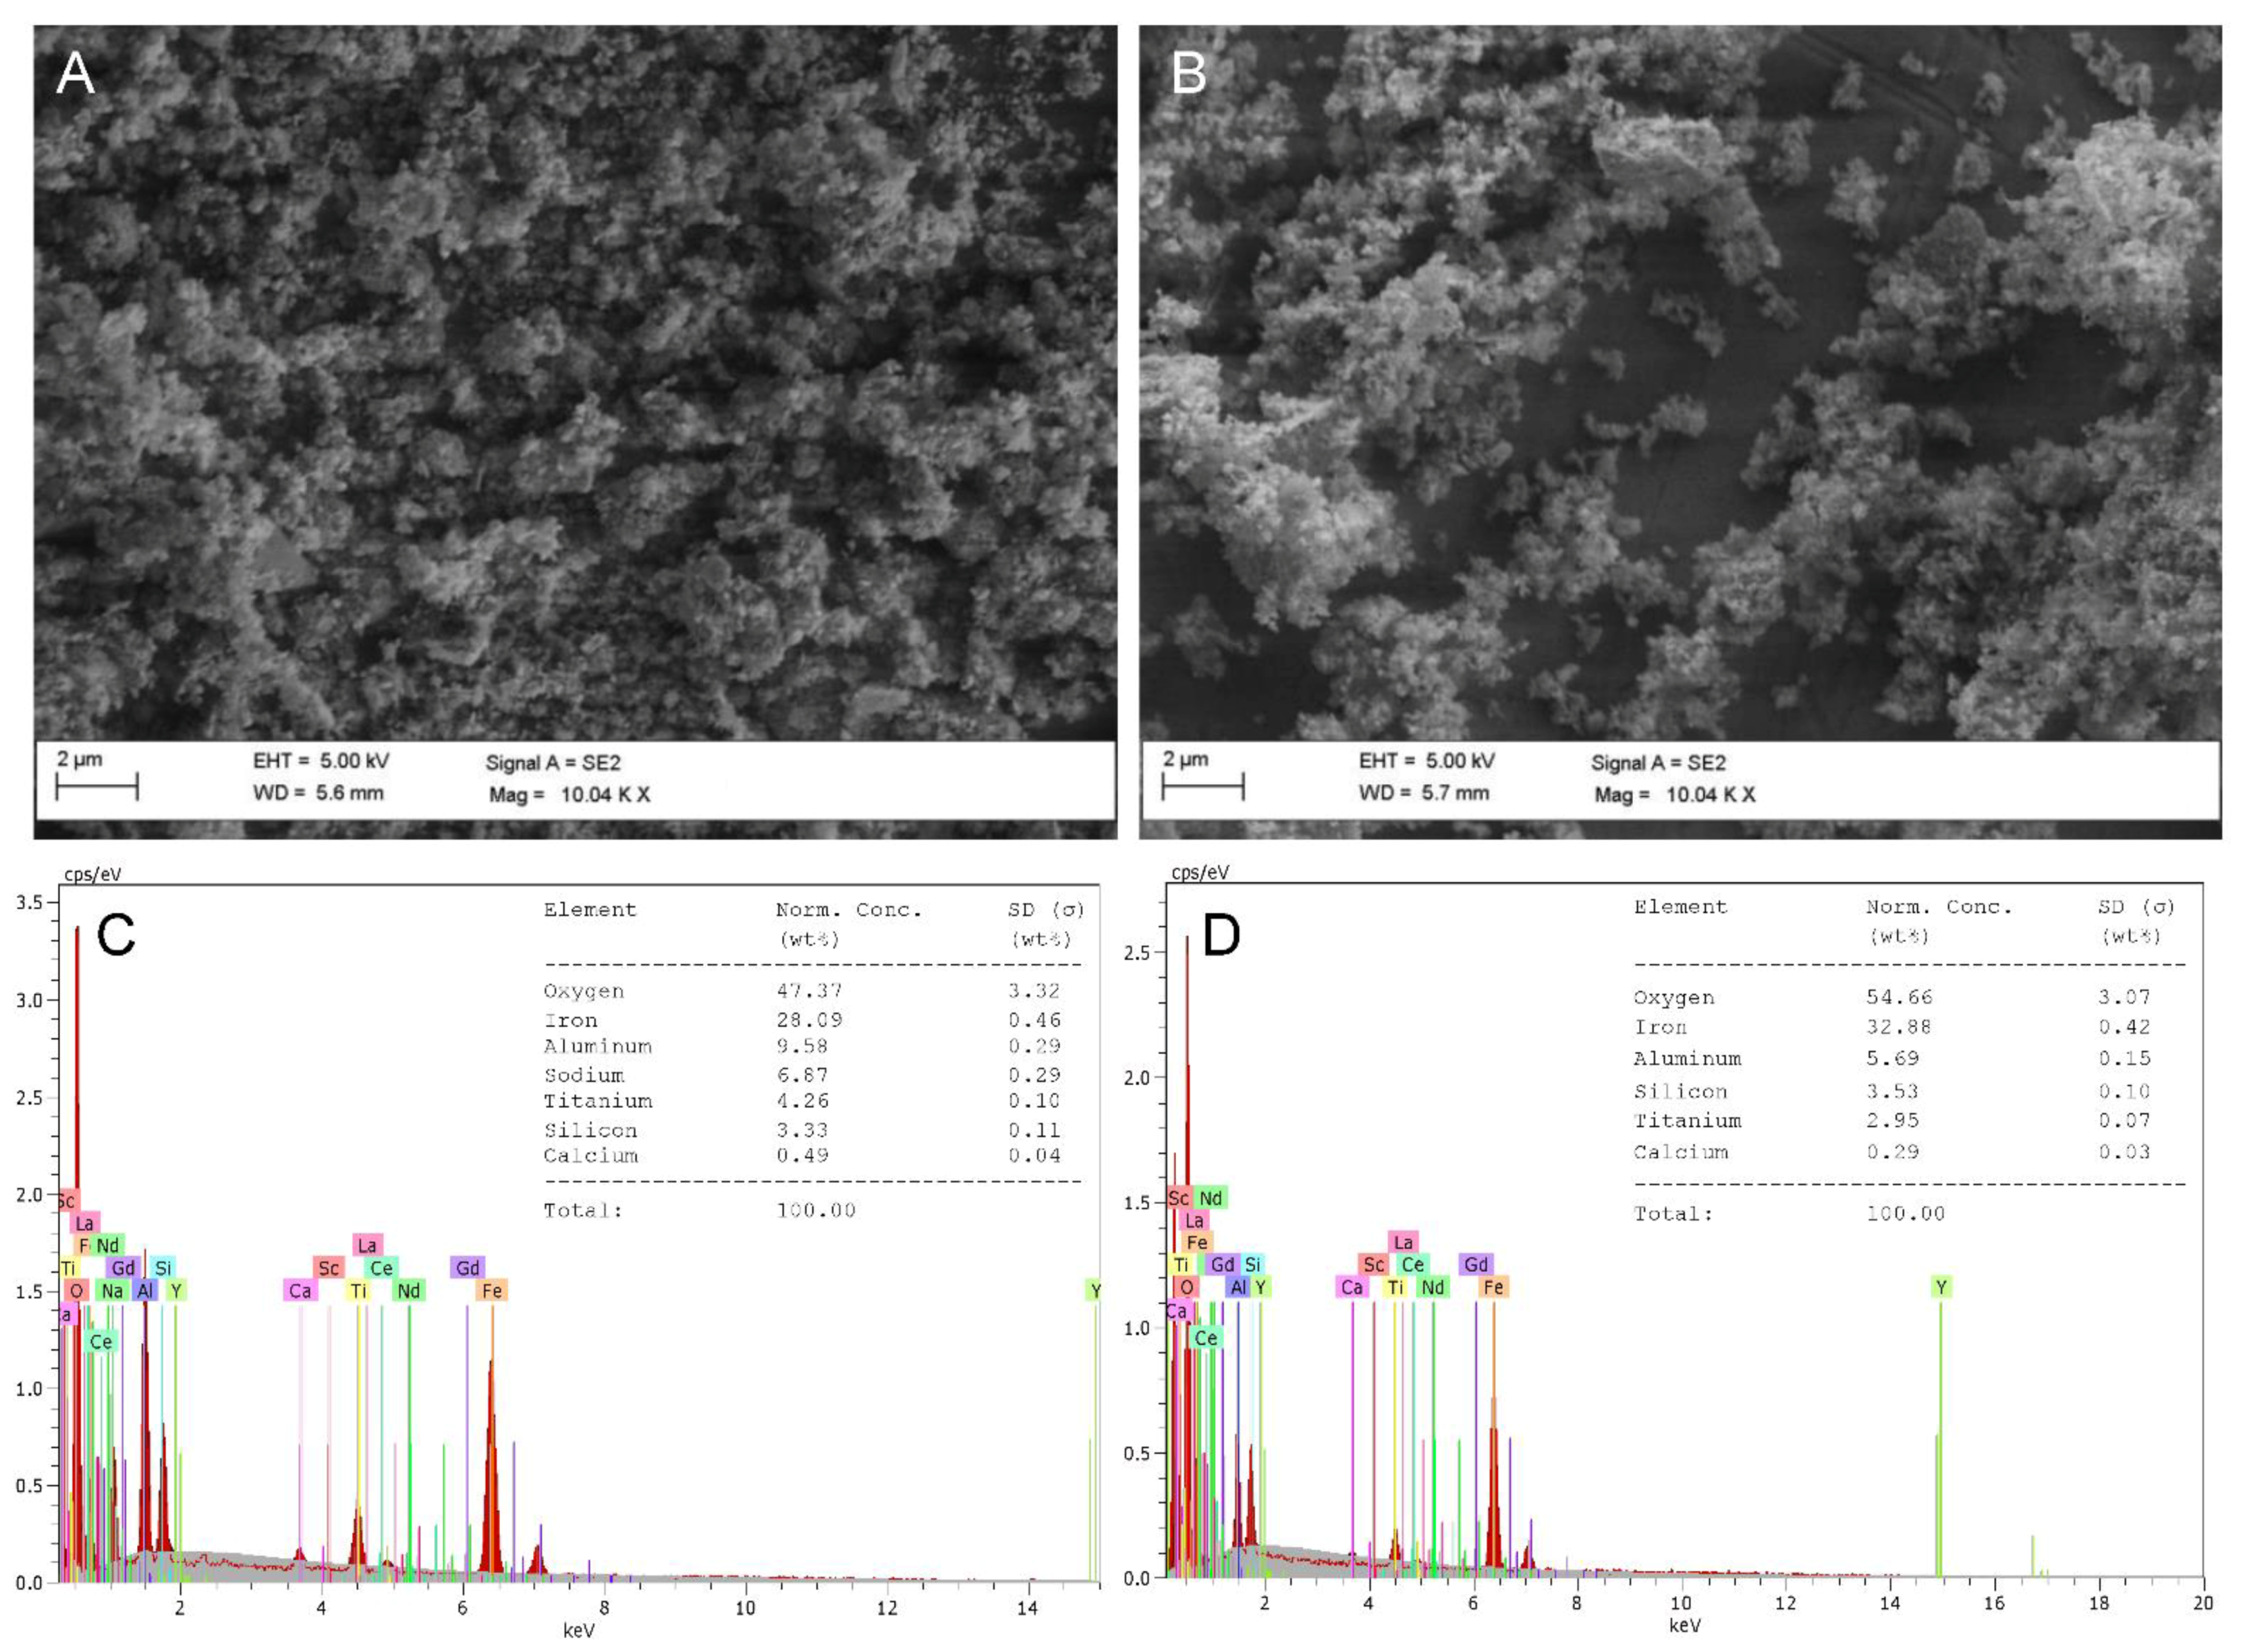
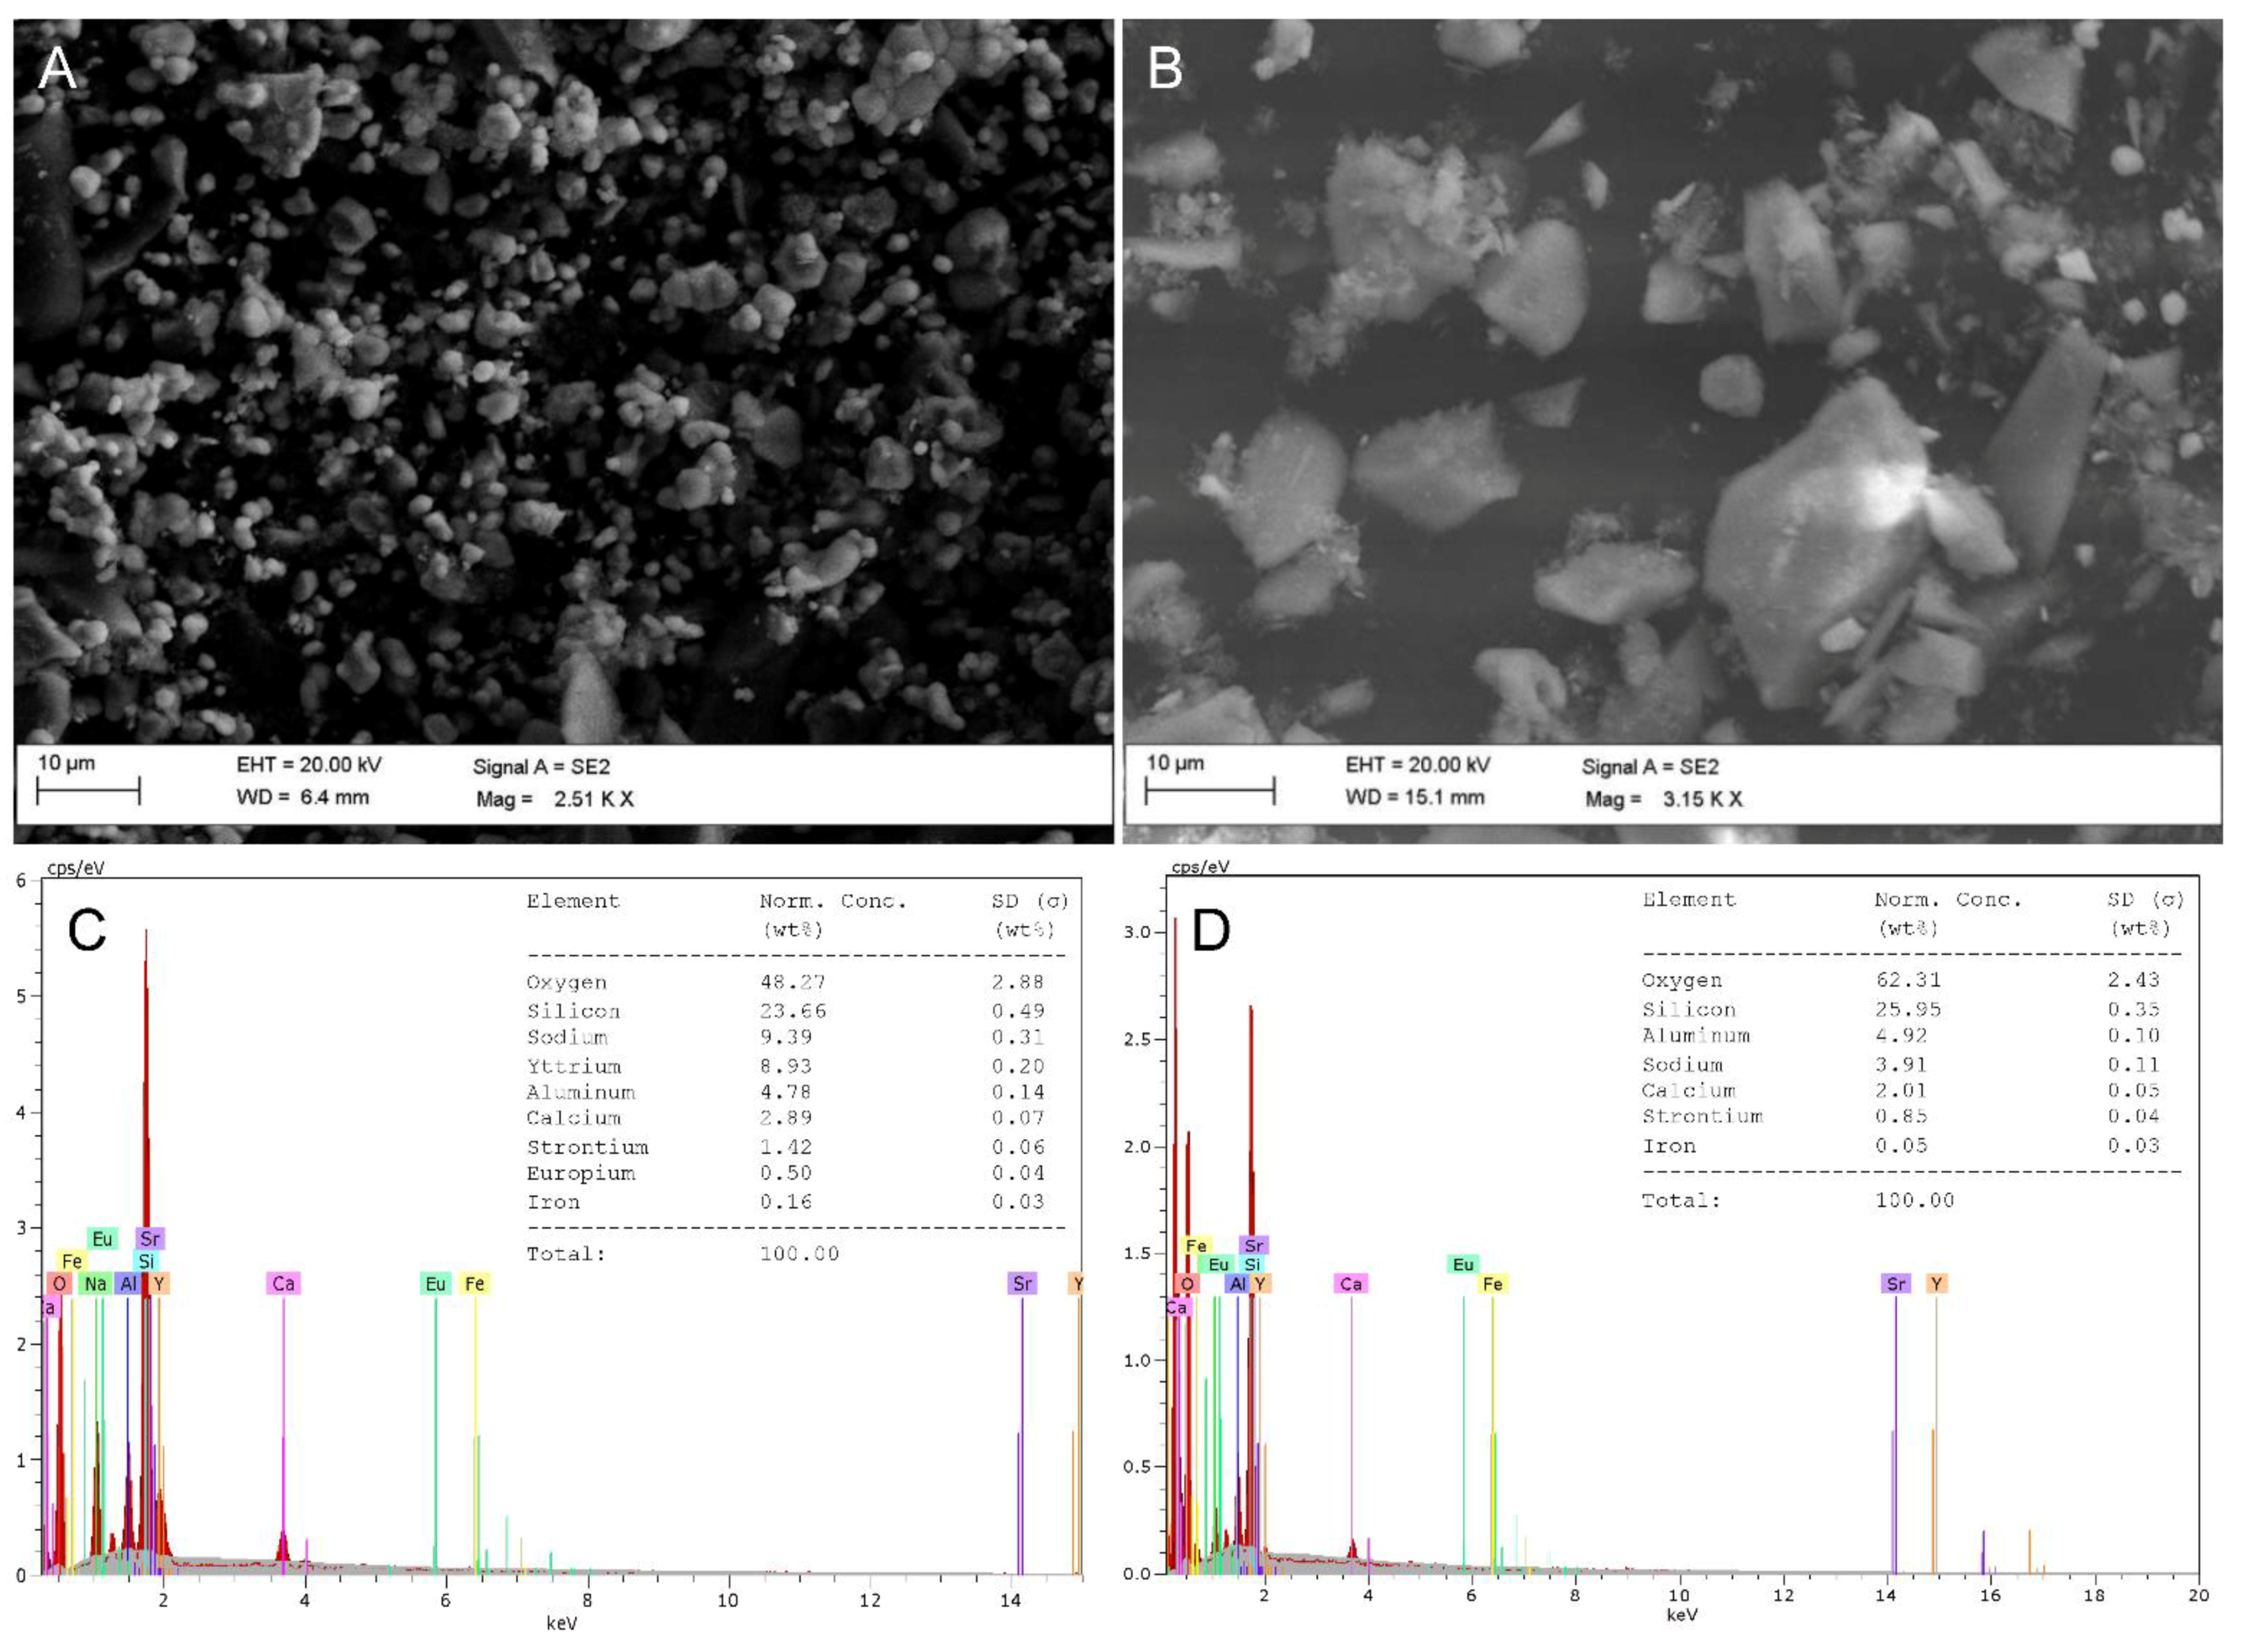
3.6. Morphological and Compositional Comparisons between Solids before and after Leaching

The original red mud and fluorescent phosphor solids and residues after leaching under the optimal conditions were characterized by SEM–EDS to examine their changes in morphology and compositions. The SEM image showed the original red mud particles seemed condensed and tended to form large aggregates (Figure 4A). Although all red mud particles smaller than 125 μm were collected through sieve, the particles smaller than 2 μm seemed accounting for the major proportion. After leaching, the residues appeared loose with the aggregates detaching to smaller particles (Figure 4B), which was probably due to the dispersing effects of leaching process.
EDS analysis showed that O, Fe, Al, Na, Ti, Si, and Ca were the main elements detected in the original red mud samples, with the REEs below the detection limit of 0.01 wt% (Figure 4C). The normalized concentrations of the main elements fell within the range of values provided by the red mud supplier, and the undetectable REEs were also consistent with the ICP–OES results showing they were all below 0.01 wt%. After leaching, the relative contents of O and Fe increased and Si stayed similar, while all other four main elements were reduced, with undetectable Na (Figure 4D). This was beneficial since the dissolution of iron was not an issue in our study but could be as high as ~60% accompanying REEs leaching in previous research using HCl [38]. The high dissolution of iron would significantly complicate the further separation and purification processes because of the high content of iron in red mud, thus elevating energy consumption and costs. This finding also supported our speculation that the low leaching efficiency of Sc was related to the low dissolution of iron.
The morphological analysis of original fluorescent phosphors (Figure 5A) indicated the presence of a large number of fine round particles much smaller than 10 μm, which may mainly be phosphor particles [16]. Interestingly, the residues after leaching mostly appeared irregular shapes and much larger sizes with majority comparable to 10 μm (Figure 5B), which could mainly be glass particles. This comparison demonstrated, from a morphological view that phosphor particles could be almost completely dissolved by 70% LevA under the optimal condition. The finding was also supported by the EDS analysis showing the absence of Y and Eu after leaching (Figure 5D), in contrast with the presence of these two REEs before leaching at the concentrations consistent with ICP–OES results (Figure 5C).

4. Conclusions

The findings from this study filled the knowledge gap in the systematic and statistical evaluation of the effects of key leaching parameters on REE leaching processes in waste materials using organic acids. The mathematical models developed using the response surface methodology could guide the leaching process by levulinic acid in red mud and fluorescent phosphors by weighing the relative influence of L/S, temperature, and duration, as well as identifying the optimal conditions which were experimentally validated. Sc was found to be the limiting factor for total leaching efficiency in red mud, most likely due to the embedment of Sc in iron oxides and the low dissolution of iron. With the optimal parameters, i.e., L/S of 40, 70 °C, and 60 h for red mud and 96 h for fluorescent phosphors, the actual total leaching efficiency reached 100% for both fluorescent phosphors and red mud without considering Sc, which matched well with the predicted values. The further morphological and compositional characterizations by SEM–EDS of the waste materials before and after leaching confirmed the high REE leaching efficiency under the optimal conditions. The findings obtained here enable us to calibrate leaching parameters to satisfy specific operational and economic demands, as well as provide insightful guidance for REE leaching processes in the scenarios of other waste materials and organic acids.

Supplementary Materials

The following supporting information can be downloaded at: https://www.mdpi.com/article/10.3390/su14159682/s1, Figure S1: Processed red mud (A; <125 μm) and florescent phosphors (B; <63 μm); Figure S2: An example of the classification of dissolution by direct observation. The denoted sample numbers are the same as those in Table S1. The dissolution from left to right: 60%, 100%, 80%, and 20%; Figure S3: Predicted against actual plot (A) and normal plot of residuals (B) of the developed model for red mud; Figure S4: Predicted against actual plot (A) and normal plot of residuals (B) of the developed model for florescent phosphors; Figure S5: Three-dimensional response surface plots of total efficiency as a function of different variables for florescent phosphors with a fixed temperature at 70 °C; Table S1: Design matrix and results for screening of organic acids and DES. The stirring speed was 500 rpm for all tests.

Author Contributions

Conceptualization, T.J. and Y.L.; Methodology, T.J., S.S., K.A.D. and Y.L.; Data curation, T.J. and S.S.; Formal analysis, T.J., S.S., K.A.D. and Y.L.; Investigation, T.J. and Y.L.; Validation, T.J. and Y.L.; Visualization, T.J.; Supervision, Y.L.; Writing—original draft, T.J.; Writing—review & editing, T.J. and Y.L. All authors have read and agreed to the published version of the manuscript.

Funding

This research was funded by University at Albany, State University of New York.

Institutional Review Board Statement

Not applicable.

Informed Consent Statement

Not applicable.

Data Availability Statement

The data supporting the findings of this study are available within the article and its Supplementary Materials.

Acknowledgments

The authors acknowledge financial support from University at Albany, State University of New York. The authors also appreciate the red mud samples provided by Vaudreuil Alumina Refinery of Rio Tinto Group.

Conflicts of Interest

The authors declare that they have no known competing financial interest or personal relationships that could have appeared to influence the work reported in this paper.

References

  1. Patil, A.B.; Tarik, M.; Struis, R.P.; Ludwig, C. Exploiting end-of-life lamps fluorescent powder e-waste as a secondary resource for critical rare earth metals. Resour. Conserv. Recycl. 2021, 164, 105153. [Google Scholar] [CrossRef]
  2. Binnemans, K.; Jones, P.T.; Blanpain, B.; Van Gerven, T.; Yang, Y.; Walton, A.; Buchert, M. Recycling of rare earths: A critical review. J. Clean. Prod. 2013, 51, 1–22. [Google Scholar] [CrossRef]
  3. Opare, E.O.; Struhs, E.; Mirkouei, A. A comparative state-of-technology review and future directions for rare earth element separation. Renew. Sustain. Energy Rev. 2021, 143, 110917. [Google Scholar] [CrossRef]
  4. Riba, J.-R.; López-Torres, C.; Romeral, L.; Garcia, A. Rare-earth-free propulsion motors for electric vehicles: A technology review. Renew. Sustain. Energy Rev. 2016, 57, 367–379. [Google Scholar] [CrossRef] [Green Version]
  5. Song, X.; Chang, M.-H.; Pecht, M. Rare-earth elements in lighting and optical applications and their recycling. Jom-Us 2013, 65, 1276–1282. [Google Scholar] [CrossRef]
  6. Mancheri, N.A. World trade in rare earths, Chinese export restrictions, and implications. Resour. Policy 2015, 46, 262–271. [Google Scholar] [CrossRef]
  7. Li, Z.; Diaz, L.A.; Yang, Z.; Jin, H.; Lister, T.E.; Vahidi, E.; Zhao, F. Comparative life cycle analysis for value recovery of precious metals and rare earth elements from electronic waste. Resour. Conserv. Recycl. 2019, 149, 20–30. [Google Scholar] [CrossRef]
  8. Evans, K. Successes and challenges in the management and use of bauxite residue. In Proceedings of the Bauxite Residue Valorisation and Best Practices Conference, Leuven, Belgium, 5–7 October 2015; pp. 113–128. [Google Scholar]
  9. Binnemans, K.; Jones, P.T.; Blanpain, B.; Van Gerven, T.; Pontikes, Y. Towards zero-waste valorisation of rare-earth-containing industrial process residues: A critical review. J. Clean. Prod. 2015, 99, 17–38. [Google Scholar] [CrossRef] [Green Version]
  10. Evans, K. The history, challenges, and new developments in the management and use of bauxite residue. J. Sustain. Metall. 2016, 2, 316–331. [Google Scholar] [CrossRef] [Green Version]
  11. Rivera, R.M.; Ulenaers, B.; Ounoughene, G.; Binnemans, K.; Van Gerven, T. Extraction of rare earths from bauxite residue (red mud) by dry digestion followed by water leaching. Miner. Eng. 2018, 119, 82–92. [Google Scholar] [CrossRef]
  12. Ujaczki, É.; Zimmermann, Y.S.; Gasser, C.A.; Molnár, M.; Feigl, V.; Lenz, M. Red mud as secondary source for critical raw materials–extraction study. J. Chem. Technol. Biotechnol. 2017, 92, 2835–2844. [Google Scholar] [CrossRef]
  13. Liu, Z.; Li, H. Metallurgical process for valuable elements recovery from red mud—A review. Hydrometallurgy 2015, 155, 29–43. [Google Scholar] [CrossRef]
  14. Wagner, T.P. Compact fluorescent lights and the impact of convenience and knowledge on household recycling rates. Waste Manag. 2011, 31, 1300–1306. [Google Scholar] [CrossRef] [PubMed]
  15. Yen, C.H.; Cheong, R. Application of Green Solvents for Rare Earth Element Recovery from Aluminate Phosphors. Minerals 2021, 11, 287. [Google Scholar] [CrossRef]
  16. Alaoui, Y.T.H.; Aouragh, N.S.; Kitane, S. Recovery and Characterization of Phosphor Powders From Waste Linear Tube Fluorescent Lamps. Int. J. Mech. Eng. Technol. 2018, 9, 1357–1366. [Google Scholar]
  17. Ecolamp. 2021. Available online: https://ecolamp.co.uk/lamps/ (accessed on 10 March 2022).
  18. Hopfe, S.; Flemming, K.; Lehmann, F.; Möckel, R.; Kutschke, S.; Pollmann, K. Leaching of rare earth elements from fluorescent powder using the tea fungus Kombucha. Waste Manag. 2017, 62, 211–221. [Google Scholar] [CrossRef]
  19. Gambogi, J. Rare Earths; U.S. Geological Survey (USGS) National Minerals Information Center: Reston, VA, USA, 2021.
  20. Statista. Available online: https://www.statista.com (accessed on 10 April 2022).
  21. Stormcrow. 2021. Available online: https://www.stormcrow.ca/wp-content/uploads/2021/03/20210308-Stormcrow-UCore-Initiation-Final.pdf (accessed on 10 April 2022).
  22. Dupont, D.; Binnemans, K. Rare-earth recycling using a functionalized ionic liquid for the selective dissolution and revalorization of Y2O3: Eu 3+ from lamp phosphor waste. Green Chem. 2015, 17, 856–868. [Google Scholar] [CrossRef] [Green Version]
  23. Alkan, G.; Yagmurlu, B.; Gronen, L.; Dittrich, C.; Ma, Y.; Stopic, S.; Friedrich, B. Selective silica gel free scandium extraction from Iron-depleted red mud slags by dry digestion. Hydrometallurgy 2019, 185, 266–272. [Google Scholar] [CrossRef]
  24. Narayanan, R.P.; Kazantzis, N.K.; Emmert, M.H. Selective process steps for the recovery of scandium from Jamaican bauxite residue (red mud). ACS Sustain. Chem. Eng. 2018, 6, 1478–1488. [Google Scholar] [CrossRef]
  25. Strauss, M.L. The Recovery of Rare Earth Oxides Fromwaste Fluorescent Lamps; Colorado School of Mines: Golden, CO, USA, 2016. [Google Scholar]
  26. Wang, Q.; Ma, L.; He, X.; Chen, Y.; Tan, C.; Su, T. CRT (Cathode Ray Tube) Fluorescent Powder Processing Method. Chinese Patent CN102312095B; filed 24 May 2011, and issued 17 April 2013,
  27. Mudali, U.K.; Patil, M.; Saravanabhavan, R.; Saraswat, V. Review on E-waste Recycling: Part II—Technologies for Recovery of Rare Earth Metals. Trans. Indian Natl. Acad. Eng. 2021, 6, 613–631. [Google Scholar] [CrossRef]
  28. Zinoveev, D.; Pasechnik, L.; Fedotov, M.; Dyubanov, V.; Grudinsky, P.; Alpatov, A. Extraction of Valuable Elements from Red Mud with a Focus on Using Liquid Media—A Review. Recycling 2021, 6, 38. [Google Scholar] [CrossRef]
  29. Davris, P.; Balomenos, E.; Panias, D.; Paspaliaris, I. Selective leaching of rare earth elements from bauxite residue (red mud), using a functionalized hydrophobic ionic liquid. Hydrometallurgy 2016, 164, 125–135. [Google Scholar] [CrossRef]
  30. Bonomi, C.; Alexandri, A.; Vind, J.; Panagiotopoulou, A.; Tsakiridis, P.; Panias, D. Scandium and titanium recovery from bauxite residue by direct leaching with a Brønsted acidic ionic liquid. Metals 2018, 8, 834. [Google Scholar] [CrossRef] [Green Version]
  31. Pateli, I.M.; Abbott, A.P.; Binnemans, K.; Rodriguez, N.R. Recovery of yttrium and europium from spent fluorescent lamps using pure levulinic acid and the deep eutectic solvent levulinic acid–choline chloride. RSC Adv. 2020, 10, 28879–28890. [Google Scholar] [CrossRef]
  32. Rodriguez, N.R.; Grymonprez, B.; Binnemans, K. Integrated Process for Recovery of Rare-Earth Elements from Lamp Phosphor Waste Using Methanesulfonic Acid. Ind. Eng. Chem. Res. 2021, 60, 10319–10326. [Google Scholar] [CrossRef]
  33. Box, G.E.; Behnken, D.W. Some new three level designs for the study of quantitative variables. Technometrics 1960, 2, 455–475. [Google Scholar] [CrossRef]
  34. Hopfe, S.; Konsulke, S.; Barthen, R.; Lehmann, F.; Kutschke, S.; Pollmann, K. Screening and selection of technologically applicable microorganisms for recovery of rare earth elements from fluorescent powder. Waste Manag. 2018, 79, 554–563. [Google Scholar] [CrossRef]
  35. U.S. EPA. Determination of Metals and Trace Elements in Water and Wastes by Inductively Coupled Plasma-Atomic Emission Spectrometry; Revision 4.4 ed.; Method 200.7; U.S. EPA: Cincinnati, OH, USA, 1994.
  36. Florindo, C.; Oliveira, F.S.; Rebelo, L.P.N.; Fernandes, A.M.; Marrucho, I.M. Insights into the synthesis and properties of deep eutectic solvents based on cholinium chloride and carboxylic acids. ACS Sustain. Chem. Eng. 2014, 2, 2416–2425. [Google Scholar] [CrossRef]
  37. Li, Z.; Din, J.; Xu, J.; Liao, C.; Yin, F.; Lǚ, T.; Cheng, L.; Li, J. Discovery of the REE minerals in the Wulong–Nanchuan bauxite deposits, Chongqing, China: Insights on conditions of formation and processes. J. Geochem. Explor. 2013, 133, 88–102. [Google Scholar] [CrossRef]
  38. Borra, C.R.; Pontikes, Y.; Binnemans, K.; Van Gerven, T. Leaching of rare earths from bauxite residue (red mud). Miner. Eng. 2015, 76, 20–27. [Google Scholar] [CrossRef] [Green Version]
  39. Reid, S.; Tam, J.; Yang, M.; Azimi, G. Technospheric mining of rare earth elements from bauxite residue (red mud): Process optimization, kinetic investigation, and microwave pretreatment. Sci. Rep. 2017, 7, 15252. [Google Scholar] [CrossRef] [Green Version]
  40. Anawati, J.; Azimi, G. Recovery of scandium from Canadian bauxite residue utilizing acid baking followed by water leaching. Waste Manag. 2019, 95, 549–559. [Google Scholar] [CrossRef] [PubMed]
  41. Meyer, F. Availability of bauxite reserves. Nat. Resour. Res. 2004, 13, 161–172. [Google Scholar] [CrossRef] [Green Version]
  42. Brookins, D.G. Scandium. In Eh-pH Diagrams for Geochemistry; Springer: Berlin/Heidelberg, Germany, 1988; pp. 120–121. [Google Scholar]
  43. Ashokraju, M.; Mohan, V.; Murali, K.; Rao, M.V.; Raju, B.D.; Rao, K.S.R. Formic acid assisted hydrogenation of levulinic acid to γ-valerolactone over ordered mesoporous Cu/Fe2O3 catalyst prepared by hard template method. J. Chem. Sci. 2018, 130, 16. [Google Scholar] [CrossRef] [Green Version]
  44. Du, H.; Deng, F.; Kommalapati, R.R.; Amarasekara, A.S. Iron based catalysts in biomass processing. Renew. Sustain. Energy Rev. 2020, 134, 110292. [Google Scholar]
  45. Shoppert, A.; Loginova, I.; Napol’skikh, J.; Valeev, D. High-Selective Extraction of Scandium (Sc) from Bauxite Residue (Red Mud) by Acid Leaching with MgSO4. Materials 2022, 15, 1343. [Google Scholar] [CrossRef]
  46. Borra, C.R.; Mermans, J.; Blanpain, B.; Pontikes, Y.; Binnemans, K.; Van Gerven, T. Selective recovery of rare earths from bauxite residue by combination of sulfation, roasting and leaching. Miner. Eng. 2016, 92, 151–159. [Google Scholar] [CrossRef]
  47. Innocenzi, V.; Ippolito, N.M.; Pietrelli, L.; Centofanti, M.; Piga, L.; Vegliò, F. Application of solvent extraction operation to recover rare earths from fluorescent lamps. J. Clean. Prod. 2018, 172, 2840–2852. [Google Scholar] [CrossRef]
Figure 1. Three-dimensional response surface plots of total efficiency as a function of different variables for red mud with a fixed L/S at 30 (A) and a fixed temperature at 50 °C (B).
Sustainability 14 09682 g001
Figure 2. Three-dimensional response surface plots of total efficiency as a function of different variables for fluorescent phosphors with a fixed L/S at 20 (A) and a fixed duration at 72 h (B).
Sustainability 14 09682 g002
Figure 3. Validation of models under the optimal condition for red mud (RM) with and without the inclusion of Sc, and under the optimal and randomly selected conditions for fluorescent phosphors (FP). Error bar indicates standard deviation of the mean for triplicate experiments. Pentagram indicates predicated leaching efficiency by the models.
Sustainability 14 09682 g003
Figure 4. Morphological (A,B) and compositional analysis (C,D) of red mud by SEM–EDS before (A,C) and after (B,D) leaching under the optimal condition (L/S of 40, temperature of 70 °C, and duration of 60 h). Scale bar of SEM images is 10 μm. Elemental compositions with normalized concentrations (wt%) and standard deviations (SD) are displayed above the EDS spectrum. The detection limit of an element by EDS is 0.01 wt%. The elements not shown in the table were undetectable. The denoting element names in the spectrum are just to show the supposed peak positions, which not necessarily indicates there is a detected peak and concentration.
Sustainability 14 09682 g004
Figure 5. Morphological (A,B) and compositional analysis (C,D) of fluorescent phosphors by SEM–EDS before (A,C) and after (B,D) leaching under the optimal condition (L/S of 40, temperature of 70 °C, and duration of 96 h). Scale bar of SEM images is 10 μm. Elemental compositions with normalized concentrations (wt%) and standard deviations (SD) are displayed above the EDS spectrum. The denoting element names in the spectrum are just to show the supposed peak positions, which not necessarily indicates there is a detected peak and concentration.
Sustainability 14 09682 g005
Table 1. REE compositions of red mud and fluorescent phosphors measured by ICP–OES. REE detection limit was 1 mg/kg. Data were expressed as mean ± standard deviation for triplicate measurements.
REERed Mud (mg/kg)Fluorescent Phosphors (g/kg)
Ce79.67 ± 1.53-
Sc46.33 ± 0.58-
Nd38.70 ± 0.58-
La38.67 ± 0.58-
Gd5.00 ± 0.01-
Y3.47 ± 0.1287.80 ± 1.83
Eu-6.54 ± 0.12
Table 2. The Box–Behnken design of the variables with total leaching efficiency as the response.
RunL/S (L/kg)Temperature (°C)Duration (h)Red MudFluorescent Phosphors
CeScNdLaGdYTotalYEuTotal
12090720.8810.0990.1290.2381.0000.9230.4620.7120.6790.709
22090240.7730.0690.4600.7810.8000.7500.5640.6790.6400.677
32070480.6950.0650.4140.9160.9200.6350.5510.6030.5750.601
41070720.7590.0690.4940.7991.0000.7500.5780.6630.6260.661
51050480.6980.0500.5020.7940.6200.6920.5360.2760.2590.275
62050240.5470.0430.3830.6410.5600.6350.4260.2020.1880.201
72050720.7760.0520.5280.8900.4800.6920.5850.4770.4440.474
82070480.6730.0650.4030.8590.9201.0000.5360.6150.5810.612
92070480.6400.0520.4240.7450.6800.6350.4920.6150.5720.612
101090480.8650.0970.5090.8350.9600.9230.6300.7840.1470.740
113070720.7530.0910.5121.0000.9601.0000.7110.7620.7160.758
122070480.7580.0690.4400.8691.0001.0000.5830.6590.6150.656
132070480.8460.0820.5480.9781.0001.0000.6550.5610.5200.558
143050480.7980.0520.5201.0000.7800.7270.6290.3940.3720.393
151070240.5120.0520.3130.5840.5400.6350.3910.5340.3980.525
163070240.5500.0490.3880.8840.6600.9520.4810.4610.4410.459
173090480.8890.0910.5041.0001.0000.8650.6800.7290.7020.728
Table 3. Analysis of variance (ANOVA) for models of red mud and fluorescent phosphors.
SourceRed MudFluorescent Phosphors
Degree of FreedomF-Valuep-ValueDegree of FreedomF-Valuep-Value
Model86.900.0065755.29<0.0001
Χ1 (L/S)17.460.025812.220.1703
Χ2 (temperature)11.400.27121270.25<0.0001
Χ3 (duration)10.560.4747164.82<0.0001
Χ1Χ2---14.000.0765
Χ1Χ310.0640.806116.290.0334
Χ2Χ3110.250.0126113.750.0049
Χ1212.610.1447---
Χ22---125.690.0007
Χ32110.840.0110---
Χ12Χ317.990.0223---
Residual8--9--
Lack-of-fit40.310.857650.760.6237
Pure Error4--4--
Cor Total16--16--
Publisher’s Note: MDPI stays neutral with regard to jurisdictional claims in published maps and institutional affiliations.

