Article

Optimization of Aircraft Taxiing Strategies to Reduce the Impacts of Landing and Take-Off Cycle at Airports

Department of Civil, Constructional and Environmental Engineering, Sapienza University of Rome, Via Eudossiana 18, 00184 Rome, Italy
*
Author to whom correspondence should be addressed.
Sustainability 2022, 14(15), 9692; https://doi.org/10.3390/su14159692
Submission received: 16 July 2022 / Revised: 29 July 2022 / Accepted: 4 August 2022 / Published: 6 August 2022

Abstract

:
The increasing attention of opinion towards climate change has prompted public authorities to provide plans for the containment of emissions to reduce the environmental impact of human activities. The transport sector is one of the main ones responsible for greenhouse emissions and is under investigation to counter its burdens. Therefore, it is essential to identify a strategy that allows for reducing the environmental impact produced by aircraft on the landing and take-off cycle and its operating costs. In this study, four different taxiing strategies are implemented in an existing Italian airport. The results show advantageous scenarios through single-engine taxiing, reduced taxi time through improved surface traffic management, and onboard systems. On the other hand, operating towing solutions with internal combustion cause excessive production of pollutants, especially HC, CO, NOX, and particulate matter. Finally, towing with an electrically powered external vehicle provides good results for pollutants and the maximum reduction in fuel consumption, but it implies externalities on taxiing time. Compared to the current conditions, the best solutions ensure significant reductions in pollutants throughout the landing and take-off cycle (−3.2% for NOx and −44.2% for HC) and economic savings (−13.4% of fuel consumption).

1. Introduction

Air transport is one of the main economic activities associated with the development of a country, as it guarantees the mobility of goods and people. In the pre-COVID-19 period, aviation was responsible for about 2% of global greenhouse gas emissions produced by all economic sectors [1,2]. According to the pre-pandemic estimates of air traffic growth, the percentage incidence is expected to reach values between 10% and 15% by 2050 [3].
Aviation emissions are produced at two different levels:
  • At cruise altitudes (8–12 km) producing air pollution effects on a global scale and contributes to climate change [4,5];
  • At ground level, during the landing and take-off (LTO) cycle directly at the airport, contributes to the degradation of near-airport air quality [6,7].
The main pollutants produced by the operation of aircraft engines are hydrocarbons (HC), carbon monoxide (CO), carbon dioxide (CO2), nitrogen oxides (NOx), sulfur oxides (SOx), and particulate matter (PM) [8]. Although emissions per flight hour have been deeply investigated and assessed [9,10] and different results require modification of used fuels and engine technologies, the operations during a complete LTO cycle require further investigation to be optimized. They refer to approach, taxi-in, taxi-out, take-off, and climb-out phases below the altitude of 3000 feet whose time in mode and percentage thrust are defined by ICAO [11]. The scientific literature focusing on ground-level emissions is vast [12,13,14] having also long acknowledged the relevance of exhausts generated by aircraft engines, along with the emissions from ground facilities and operations (from refueling to maintenance, to heating) and road traffic around the airport premises [15,16] and the strategic roles sustainable aviation fuels will play in the future [17,18,19]. All of the above becomes detrimental to the quality of life of the airport environments and the communities living nearby, with negative impacts also on public health [14,20,21,22,23]. Their emissions depend on the operational phase (approach, taxi-in, taxi-out, take-off, climb-out) [24]. The most significant parameters are the duration of each phase and the percentage of exploitation of the maximum thrust of the engine used in each phase. The taxiing phases (taxi-in and taxi-out) have a long duration with low operating thrust (7% each according to ICAO indications): the combustion occurs inefficiently, causing high quantities of emissions and producing negative effects on near-airport air quality. This has to be associated with the general fact that pollution is generated whenever the fuel combustion process is incomplete or not properly performed; typically, HC emissions are a sign of poor combustion. In the literature, studies concerning the effects of operating time during aircraft taxiing demonstrated the importance of this phase. In the USA between 2006 and 2007, taxiing time over 40 min increased by 20%, while in Europe an incidence of taxiing time of between 10% and 30% of the total flight time was assessed, resulting in a consumption of approximately 5–10% of the total fuel burned during the entire flight cycle [25]. Furthermore, Miller et al. [26] showed that the increase in the demand for air traffic leads to a higher rate of growth for taxiing time than for cruising time, due to the greater number of aircraft movements that cause on-ground congestion of the airport and overload of controllers [27]. Moreover, other studies assessed the emissions produced by an aircraft in varying taxiing modes; the following strategies were analyzed separately: single-engine taxiing [25], dispatch towing [25,26], onboard systems [28], and the optimization of surface traffic management [29]. However, most of these assessments define the inventory under standard operating conditions [30], without considering the impact of the real environmental conditions (air temperature and pressure).
Although the recent international climate agreements (from COP21 Paris 2015 to COP26 Glasgow 2021) do not provide for any regulation for greenhouse gas emissions from the transport sector, it is crucial to foresee an inventory of emissions produced by aircraft during the LTO cycle [31]. For this reason, this study aims to assess the emission scenario of an airport with the International Standard Atmosphere (ISA) according to the Airport Air Quality Manual [11] and Boeing Fuel Flow Method 2 (BFFM2) [32] to take into account the effect of environmental conditions. The ground handling phases are specifically analyzed to know the emissions distribution over the LTO phases [33]. Four different strategies for taxiing, (i.e., single-engine taxiing, dispatch towing, onboard systems, and optimization of surface traffic management) have been considered to assess different emission scenarios [34]. The results allowed the identification of the best strategy to reduce fuel consumption and air pollutants emissions.
The adopted methodology addresses the emission assessment, shortly described in Section 2.1, according to the above-mentioned ICAO’s Airport Air Quality Manual, where a sensitive parameter, i.e., the fuel flow, is further specified by introducing additional criteria (related to temperature and pressure) to make it more consistent with the actual average environmental conditions, as elaborated in Section 2.2. This advances the usual approach for determining the fuel flow, just according to the ISA reference, and creates a more reliable simulation procedure. The methodology considers the most detrimental pollutants and specifically: HC, NOx, PM, and CO2. This updated procedure is applied to a middle-size Italian airport that cannot be disclosed for confidentiality reasons, located in a mixed land-use area; hereinafter called the Study Airport. The main performances of the Study Airport are elaborated on and reported in Section 3. These steps enable us to build different operational scenarios, where four different taxiing measures are considered to create a mitigation strategy for the air traffic emissions, as described in Section 4 and compared with the basic or business-as-usual operational scenario at the Study Airport.

2. Methods

2.1. Emissions Assessment

The ICAO Air Quality Manual [11] establishes three levels of assessment that enable the determination of inventories of emissions, corresponding to different accuracy levels: (i) simple, (ii) advanced, and (iii) sophisticated. Quantity and quality of available information and data dictate the level to select, which for the case in hand was the advanced one. The choice of the level of complexity of the calculation must be defined in advance, based on the input data and the reliability of the expected results. This study was carried out according to the advanced approach: it conjugates an excellent degree of detail and accuracy for the operating parameters to obtain reliable results. Therefore, Equation (1) gives the amount of consumed fuel (FC) during taxiing with all engines running (full engine taxiing, FET):
F C F E T = j F C j , F E T = j T I M j · F F j · N j
where FCj,FET is the fuel consumption of the j-th aircraft during taxiing in FET conditions (kg), TIMj is the time-in-mode for taxiing of the j-th aircraft (s), FFj is the fuel flow for taxiing for each engine used on j-th aircraft (kg/s), and Nj is the number of engines used during taxiing of the j-th aircraft.
Equation (2) allows the calculation of the pollutant emissions during taxiing:
E i , F E T = j E I i j ·     F C j , F E T
where Eij is the total emissions of the pollutant i produced by the j-the aircraft for one LTO cycle and EIij is the emission index for the pollutant i for each engine used on the j-th aircraft (kg/aircraft or #/aircraft).
TIM values were obtained through a monitoring activity of the real operating time inside the airport, based on the data recorded over 24 days of the busiest month of the year 2019 to take into account all traffic management surface scenarios and actual operation time typical of the reference airport herein not disclosed for privacy reason. Table 1 lists the taxiing TIM values calculated as the arithmetic average of the recorded data.
In Table 1 the values for a taxi-in and taxi-out are lower than the average values defined by ICAO (7 and 19 min, respectively).

2.2. Parameters for the Estimation of the Emissions

The fuel flow values (FF) and the emission indices of HC, CO, and NOX were initially obtained through the Aircraft Engine Emission Data Bank (EEDB) [35], determined under ISA conditions during the aircraft engine test. These parameters were then corrected with the BFFM2 method, which uses scientific and empirical correlations to modify the FF values as a function of the airport’s actual environmental conditions (air temperature and pressure). The PM emission indices relating to each phase of the LTO cycle were obtained with the First Order Approximation V.4.0 method [11]. This calculation system permits to obtain a plausible estimation of the concentration by mass of the particulate material (in terms of both volatile component and non-volatile). The CO2 and SOX emission indices are established according to [11] (3155 g/kg and 1 g/kg of fuel burned, respectively) [36,37].

2.3. Taxiing Strategies

This study analyzed the contribution of the taxi-in and taxi-out phases, maintaining the approach, take-off, and climb-out phases of the basic scenario. TIM values of the approach (4.0 min), take-off (0.7 min), and climb-out (2.2 min) phases have been defined according to the reference values provided by ICAO for the standard LTO cycle. Four different taxiing modes were studied:
  • Single-engine taxiing (SET);
  • Dispatch towing (APU);
  • Taxing with onboard systems (MES);
  • Reducing taxiing time (RED).
The results have been compared with those of the basic scenario (FET).

2.3.1. Single-Engine Taxiing

SET is the simplest operational mode of ground handling because it involves using half of the aircraft engines [38]. Therefore, the reduction in emissions corresponds to the number of pollutants that the turned-off engines would have produced during operation. This operating mode is not recommended in the case of sloping taxiways in adverse weather conditions that make the surface slippery or icy and where tight curves of small radius are because they would produce power overloads in the working engines. Furthermore, aircraft engines require heating and cooling time of 2 to 5 min: SET can be considered only if the duration of the taxiing phases exceeds the time necessary for the engines to warm up/cool down. In this study, the minimum time for considering this taxiing strategy is assumed equal to 5 min, as a precaution.
Equation (3) gives the fuel consumption in SET conditions (FCSET):
F C S E T = j F C j , S E T = [ N j 2 · T I M j + N j 2 · min {   T I M j   ;   300   } ] · F F j , S E T
where FCj,SET is the fuel consumption of the j-th aircraft during taxiing in FET conditions (kg); FFj,SET is the fuel flow that measures the weight flow rate of fuel consumed by the engines of the j-th aircraft during taxiing (kg/s). According to Equation (3), all the engines of the j-th aircraft (Nj) operate for 5 min (engine warm-up/cooling time), while half of them are considered to be in operation during TIMj (in seconds).
Equation (4) allows the calculation of emissions (Ei,SET) during SET conditions.
E i , S E T = j E I i j ·     F C j , S E T

2.3.2. Dispatch Towing

Dispatch towing is the operational towing of aircraft with a specific vehicle along the taxiways (from the parking stand to the runway threshold and vice versa): during the taxiing, the aircraft keeps the engines off, except for the heating/cooling time envisaged for the engines. The aircraft’s power supply is guaranteed by the auxiliary power unit (APU). Although the emissions produced by aircraft engines are almost totally reduced, the emissions from APU and the towing vehicle must be considered. The contribution of towing vehicles is analyzed in three different scenarios, according to the type of power supply of the vehicle: diesel, petrol, and electric [39]. The emissions produced by the towing vehicle depend on the aircraft to be towed, (e.g., narrow or wide body) and its fuel (diesel or petrol); Table 2 lists the towing vehicle performance according to the international literature [40,41].
At the same time, APU is operated to ensure the power supply of the aircraft when the main engines are turned off. It works at lower operating power, in “No Load” conditions (NL) [42] ACRP Report 64. Table 3 lists the APU-NL performances in terms of fuel flow of the j-th aircraft (FFj,APU) and emission indices due to NL conditions. It should be noted that [42] does not provide information about PM emissions.
Finally, it is necessary to consider that the operational towing determines a reduction in the travel speed on taxiways, causing an increase in taxiing time; in addition, the coupling/detachment time of the aircraft from the towing vehicle cannot be overlooked. For these reasons, a multiplication factor of 2.5 is generally applied to the operating time of the taxiing phases [25]. Therefore, the fuel consumption (FCAPU) depends on three items: the aircraft operation during the warm-up/cool-down operations, the towing vehicle operation during taxiing, and APU operation (three addenda in Equation (5), respectively):
F C A P U = j F C j , A P U = j ( N j · F F j , A P U · min { T I M j · 2.5   ; 300 } ) + ( T I M j · 2.5 · P · c · L F ) + ( T I M j · 2.5 300 ) · F F j , A P U E i , S E T = j E I i j · F C j , S E T
where FCj,APU is the fuel consumption of the j-th aircraft during taxiing in APU conditions (kg), FFj,APU is the fuel flow that measures the weight flow rate of fuel consumed by each engine of the j-th aircraft during taxiing (kg/s) in APU conditions; 2.5 is the corrective factor of TIMj; 300 is the time (in seconds) required to warm up/cool down the engine; P is the towing vehicle power (bhp); c is the consumption factor of the towing vehicle (kg/bhp*s) according to Table 2; LF is the load factor or the reduction of towing efficiency under maximum load (percentage).
Equation (6) gives the total emission index for the polluting agent i produced by APU conditions (EIi,APU)
E i , A P U = j E I i j , A P U · F C j , A P U
where Eij,APU (kg/(aircraft*bhp*h)) is the emission index for the pollutant i when the j-th aircraft operates in APU NL conditions.

2.3.3. Onboard Systems

Onboard systems provide traction parallel to the main one, based on the electrification of the landing gears. In this way, the movement of the aircraft is guaranteed autonomously by keeping the main engines off, except for the heating/cooling time. According to [42], APU works at its highest operating power (main engine start, MES). Table 4 lists the APU-MES performances in terms of fuel flow of the j-th aircraft (FFj,MES) and emission indices due to MES conditions.
Onboard systems allow aircraft to maintain taxiing speeds unchanged, reaching values comparable to those of taxiing with the engines running. In any case, in this study, it is considered convenient to make a precautionary estimate of a 30% increase in taxiing time. In MES conditions two items contribute to emissions in the taxiing phases with onboard systems: the first one refers to the emissions produced by the aircraft during a 5-min-long warm-up/cool-down, and the second one gives the emissions produced by APU. Equation (7) gives the fuel consumption due to MES conditions (FCMES):
F C M E S = j F C j , M E S = j [ ( N j · F F j , M E S · 300 ) + ( T I M j · 1.3 ) · F F j , M E S ]
where FCj,MES is the fuel consumption of the j-th aircraft during taxiing in MES conditions (kg); FFj,MES is the fuel flow that measures the weight flow rate of fuel consumed by each engine of the j-th aircraft during taxiing (kg/s) in MES conditions.
Equation (8) gives the total emission index for the polluting agent i produced by MES conditions (Ei,MES):
E i , M E S = j E I i j , M E S ·     F C j , M E S
where Eij,MES (kg/aircraft or #/aircraft) is the emission index for the pollutant i when the j-th aircraft operates in APU MES conditions.

2.3.4. Reducing Taxiing Time

As a final solution to optimize aircraft taxiing, potential benefits that can be obtained with more accurate management of ground traffic at the airport are evaluated, while maintaining taxiing in FET (RED). Collected data about taxiing time are concentrated in 3 min with respect to the average value. It is therefore considered admissible to consider calculation scenarios with a reduction in taxiing time of 1, 2, and 3 min (RED1, RED2, RED3, respectively), compared to the average values defined in Table 1, as these timeframes frequently occur in real operational scenarios [43]. For the Study Airport, a fast time simulation with runway capacity analyzer and airside capacity analyzer allowed modeling future operative scenarios with optimized ground handling procedures and modified layout of aprons and taxiways [44,45,46]. In particular, the conflict resolution of taxiing paths and the reduction of the departure queue at runway entry points significantly reduce TIM and emissions [47,48]. The future scenarios allow reduction in taxiing time of 1, 2, and 3 min compared to the current scenario. These values are a characteristic of the aerodrome of study, but the approach can be generalized to other airports.
Therefore, the calculation of fuel consumption (FCRED) and pollutant emissions (EIi,RED) during SET taxiing conditions was performed according to Equations (9) and (10)
F C R E D = j F C j , R E D = j T I M j · F F j · N j
where FCj,RED is the fuel consumption of the j-th aircraft during taxiing in FET conditions.
E i , R E D = j E I i j , R E D ·     F C j , R E D
where Eij,RED (kg/aircraft or #/aircraft) is the total emissions of the pollutant i produced by the j-the aircraft during one RED LTO cycle.

2.4. Costs

The definition of strategic choice must necessarily include the calculation of the costs associated with the purchase and fuel consumption in each alternative analyzed in the study. It will thus be possible to quantify the economic savings from each solution, compared to the basic scenario, and steer traffic planners towards the most technically sound and profitable strategy. The analyzed scenarios have been compared to the basic one in terms of total fuel costs (TC) (Equation (11)):
T C = F C × u n i t   f u e l   p r i c e
where FC refers to the FC values obtained from Equations (1), (3), (5), (7) and (9).
It is emphasized that the aircraft and APU are powered by kerosene combustion, while the towing vehicle is characterized by a different power supply depending on the scenario considered (diesel, petrol, or electric).
The unit kerosene price is obtained through the public analysis provided by the International Air Transport Association (IATA) [49], while the prices of diesel and gasoline are obtained from the Italian Ministry of Economic Development [50]; on the other hand, the cost of electricity for recharging a towing vehicle battery has been overlooked.

2.5. Case Study

The Study Airport is a medium-sized Italian infrastructure, with a single 2800 m long runway, a parallel taxiway, 6 runway exit taxiways, and an apron connected to the parallel taxiway through ten taxiways (Figure 1).
The airport is in a highly anthropized area: the effort for the local reduction of emissions is strategic. It has traffic of about 70,000 movements/year (take-offs and landings) consisting of the aircraft types listed in Table 5 where the number of LTO cycles and the type and number of engines for each aircraft are also listed.

3. Results

3.1. Pollutant Emissions in the Basic Scenario

Fuel consumption and pollutant emissions in the basic scenario (FET) have been estimated according to Equations (1) and (2) having regard to traffic data in Table 5. Table 6 lists the results.
Each pollutant quantity depends on the TIM of each phase of the LTO cycle and the percentage of thrust operated by the aircraft engines. HC and CO appear to be mainly produced during the incomplete combustion process, associated with the operation of engines at low operating thrusts. Therefore, the results show that over 90% of HC and CO are associated with taxiing phases that are characterized by longer operating time and by the lowest exploitation of the aircraft engines (7%). On the other hand, the fuel consumption and the production of the other polluting species (NOX, PM, SOX, and CO2) are proportional to the high operating thrusts. Therefore, the highest concentration and production values are expected in the take-off phases (thrust 100%) and climb out (thrust 85%). Moreover, the results show a strong incidence of TIM: the greatest concentration is associated with the climb-out phase, while the contributions obtained in the taxiing phases are also relevant, affected by long operational time.

3.2. Pollutant Emissions According to the Optimization Scenarios
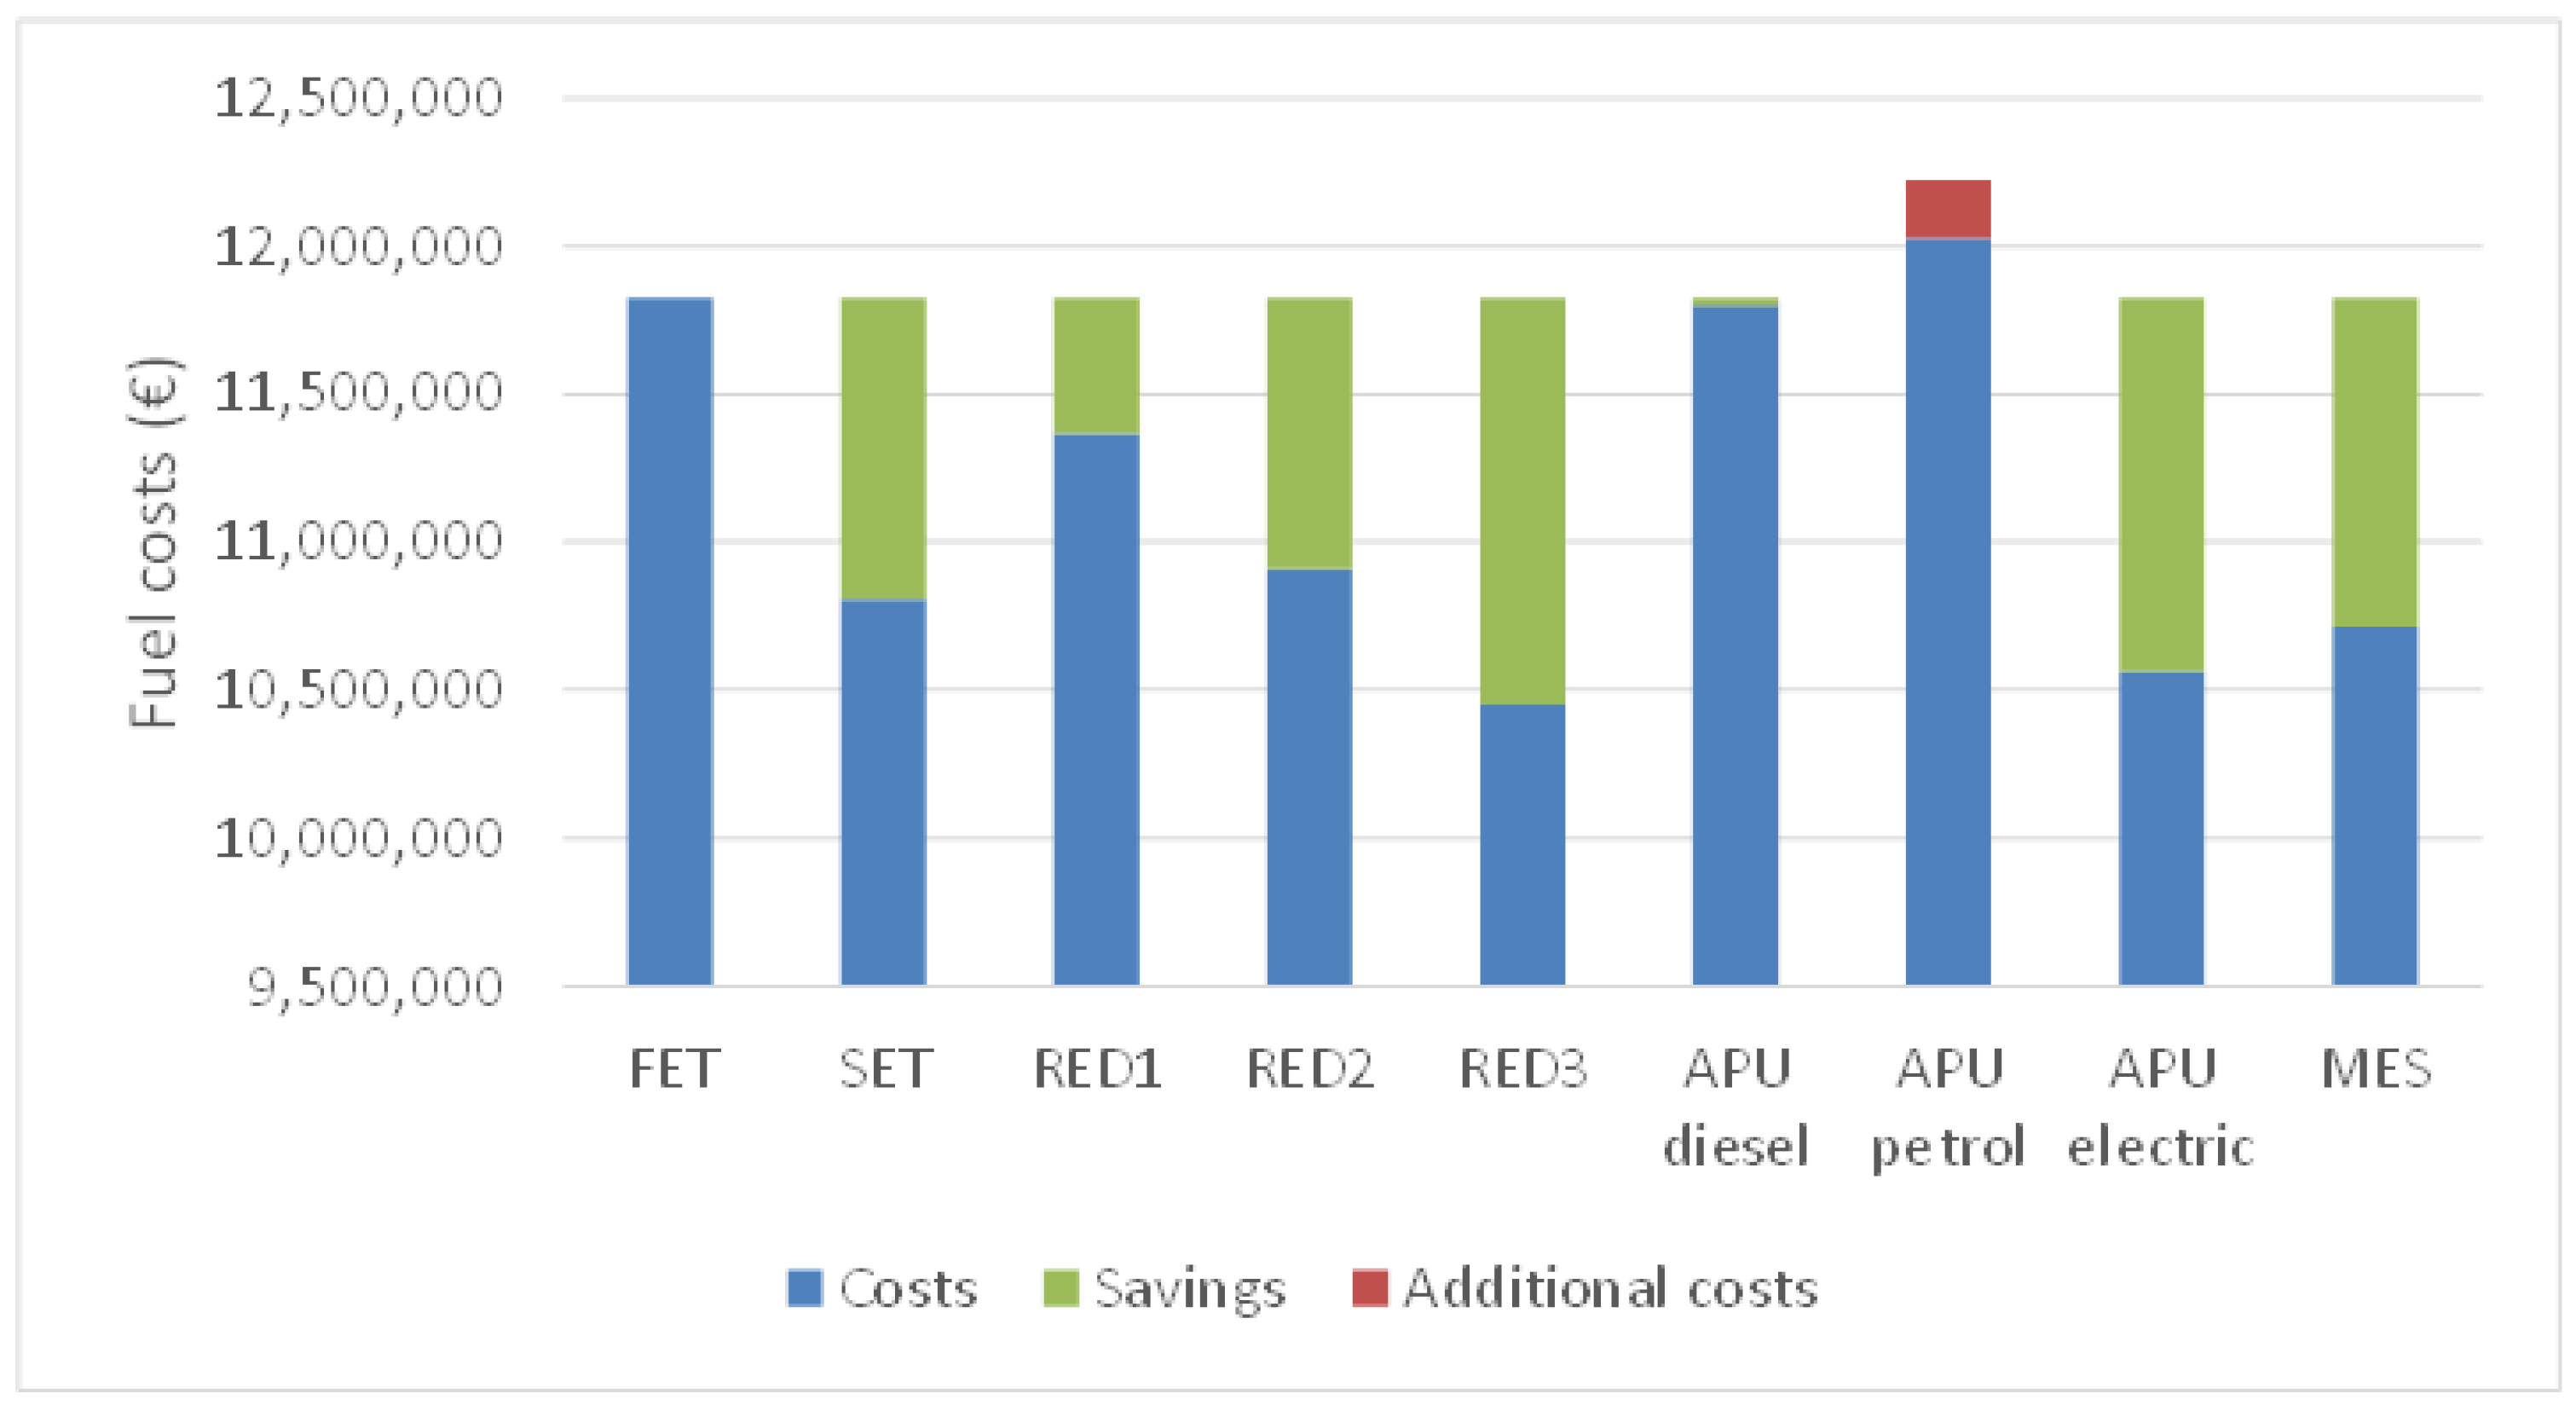
Table 7 lists the results obtained with the alternative taxiing modes, (i.e., SET, APU-NL, APU-MES; RED) described in Section 2. For each proposed scenario, the values of the air emissions and the fuel consumption are compared with those of FET one (values in Table 6). Only the results obtained for the taxiing phases and the effects induced on the complete LTO cycle are reported because no operational modification is considered for the other phases.
In the taxi-in phase, significant reductions in all pollutant emissions are achieved by applying SET (−10.1%) and ensuring better management of the surface traffic (−16.0%, −31.9%, −47.9% for RED1, RED2, and RED3, respectively). Such strategies reduce in equal percentages all the pollutants since the taxi operating time of aircraft engines is reduced. Dispatch towing with internal combustion vehicles (diesel/petrol) implies a generalized increase in the pollutant concentrations due to the emission package of the towing vehicle and APU; more specifically, a diesel-powered towing vehicle causes an increase in NOX equal to 109% and PM equal to 240%, while a petrol-fuelled towing vehicle generates an increase in CO of up to 344%. Electric towing vehicles, on the other hand, provide a less unfavorable scenario, with a 25% increase in HC. The onboard systems (MES mode) determine a good reduction of pollutants (except for an 18.3% increase in NOX), but due to the operating APU, there is a minimal increase in fuel consumption (1.2%).
The taxi-out phase implies a longer operating time than taxi-in: this condition causes a greater impact on the containment of emissions when the aircraft’s main engines are kept off because the fuel consumption is significantly reduced. In the taxi-out phase, SET conditions ensure a significant reduction in the emissions (−30.2%) and interesting results are from the improvement of ground operations (−7.9%, −15.8%, −23.8% for RED1, RED2, and RED3, respectively. Onboard systems are a valid option: the fuel consumption is reduced by 39.0%: it generates −57.6% for HC and −60.4% for PM. Even the electric-powered towing system can be considered a favorable scenario since gives slightly to the maximum reduction in fuel consumption (−41.3%): in any case, the operational consequences, (i.e., the increase in taxiing time) do not make this solution advantageous to justify its application. Finally, the towing solutions with internal combustion vehicles (diesel/petrol) also for the taxi-out define emission scenarios not compliant with the mitigation objective: diesel towing determines an increase in PM equal to 199.8% and NOX equal to 73.4%; petrol-fuelled towing generates an increase in CO equal to 308.6%.

3.3. Cost Analysis

Table 8 lists the results obtained in terms of yearly fuel costs in the examined taxiing modes.
Figure 2 represents for each taxi mode the fuel cost (blue bars) and the difference with respect to the FET scenario: savings are represented with green bars, while the red bar shows the additional cost value.
The graph shows the greatest savings can be achieved with the correct optimization of the surface handling operations inside the airport, both at entry and exit. Towing scenarios with electric vehicles and onboard systems ensure comparable savings results. On the other hand, the petrol trailer scenario defines overall costs as higher than FET.

4. Discussion

The results can be interpreted also in terms of different time horizons: short and long terms compared to the current FET mode. The former, immediately implementable, is at virtually no cost; the latter calls for targeted investment and development plans.
In the short term, with no changes to the airport infrastructure and without significant economic investment, neither by the airport management nor by the airlines, the best solution in terms of fuel consumption is SET both in the taxi-in (−10.1%) and taxi-out (−30.2%) phases. This strategy allows reducing in the LTO cycle the fuel consumption by −8.6%, and the pollutant emissions between −3.0% for NOX and −21.6% for CO (Table 9).
SET in the short period ensures a saving related to the fuel purchase of 1,016,985 €/year (Table 8). Such value should be divided into −144,489 €/year and −872,496 €/year in the taxi-in and taxi-out phases, respectively.
For the long-term scenario (Table 10), the airport’s specific development plans to upgrade the infrastructure or improvements to increase the sustainability of the fleet can be considered. It is considered convenient to aim for at least a 2-min reduction in the taxi-in time (RED2) because it implies a reduction in emissions equal to −31.9%). In turn, for the taxi-out phase, the scenario that can be obtained with onboard systems (MES) is optimal, guaranteeing conspicuous reductions of pollutants (between −22% for NOx and −60.4% of PM) and fuel consumption (−39.0%).
On the whole, the best options for taxi-in and taxi-out ensure a significant reduction in fuel consumption compared to the current FET mode (−13.4%) and imply interesting results in terms of reduced HC and CO emissions (−44%).
The long-term scenario enables a saving of −457,988 €/year for the taxi-in (RED2 mode) and −1,127,879 €/year for the taxi-out (MES mode). The overall cost reduction is −1,585,867 €/year, 56% more than the short-term scenario.
However, the implications of finding low-impact solutions go beyond the simple quantification of saving fuel and reducing emissions. The study will continue in this analysis and will address the comparison of the magnitude of the pollution emissions generated by ground operations, according to the adopted methodology, with those generated by other sources such as road traffic attracted and generated by the airport [51]. Proper knowledge of the magnitude of both will also help the accuracy of tools such as environmental and strategic impact studies on airport areas and other urban mobility plans and airport masterplans.

5. Concluding Remarks

This study determined the emission scenarios produced by aircraft within an Italian airport. It analyzed four different alternative measures for ground handling, to establish a strategic solution that ensures the lowest environmental impact for the facility and the surrounding areas, based on technical and economic considerations. Four different taxiing modes, (i.e., single-engine taxiing, dispatch towing, taxing with onboard systems, and reducing taxiing time) were studied and compared to the current operational scenario. The analysis focused on the emissions from fuel combustion and the fuel costs: HC, CO, CO2, NOX, SOX, and PM have been assessed according to international approaches provided by ICAO. Two different horizons have been considered to identify the best strategy during the service life of the airport: short-term is promptly at virtually no cost, while long-term needs for targeted investment and development plans of the infrastructure. In the short term, single-engine taxiing is the best solution both in the taxi-in and taxi-out phases of the LTO cycle: the overall reduction in emissions ranges between 3 and 21%, and fuel consumption is reduced by 8.6%. In the long-term, the reduction of the taxiing time in the taxi-in phase results in the highest emissions and fuel reduction (−31.9% compared to the current scenario), while in the taxi-out phase the taxiing with onboard systems result in the best solution (up to −57.6% for HC).
One very last point to consider is that the results from the emissions scenarios might call for some caveats. Firstly, they are test results from the specific case study in hand, and further studies to consolidate these findings are currently in progress to this end, analyzing operations on the busiest airport with severer environmental problems [51]. Very preliminary results are promising, which might seem to indicate that the presented strategies would be generally feasible. At the same time, this shifts the focus on uncertainty in terms of operational policies. The scenarios and results presented to be widely implemented require the full acceptance of airline carriers, which usually tend to match operational efficiency with environmental friendliness. As demonstrated, the reduced fuel consumption should be a driver, representing a not negligible saving item, but certainly, to consolidate as a practice and provide long-term benefits, the proposed taxiing strategies are to be framed within specific regulatory tools (air traffic plans, sustainable urban mobility plans, air quality plans, etc.), to become structural. This might involve the consensus also from ground operators and traffic controllers, along with the airlines and the progress of transport policies in this direction.

Author Contributions

Conceptualization, P.D.M.; data curation, L.M.; formal analysis, N.R.R.; investigation, M.V.C. and L.M.; methodology, P.D.M. and L.M.; validation, P.D.M. and M.V.C.; writing—original draft, P.D.M., M.V.C. and L.M.; writing—review and editing, M.V.C. and L.M. All authors have read and agreed to the published version of the manuscript.

Funding

This research received no external funding.

Institutional Review Board Statement

Not applicable.

Informed Consent Statement

Not applicable.

Data Availability Statement

Not applicable.

Conflicts of Interest

The authors declare no conflict of interest.

References

  1. IATA. The IATA Technology Roadmap Report. 2009. Available online: https://www.escholar.manchester.ac.uk/api/datastream?publicationPid=uk-ac-man-scw:106699&datastreamId=FULL-TEXT.PDF (accessed on 28 June 2022).
  2. European Commission. Reducing Emissions from Aviation. 2017. Available online: https://ec.europa.eu/clima/eu-action/transport-emissions/reducing-emissions-aviation_en (accessed on 5 July 2022).
  3. International Civil Aviation Organization (ICAO). Trends in Emissions that Affect Climate Change. Available online: https://www.icao.int/environmental-protection/Pages/ClimateChange_Trends.aspx (accessed on 13 July 2022).
  4. Eyring, V.; Kohler, H.W.; Lauer, A.; Lemper, B. Emissions from international shipping: 2. Impact of future technologies on scenarios until 2050. J. Geophys. Res. Atmos. 2005, 110, D17306. [Google Scholar] [CrossRef]
  5. Vennam, L.P.; Vizuete, W.; Talgo, K.; Omary, M.; Binkowski, F.S.; Xing, J.; Mathur, R.; Arunachalam, S. Modeled Full-Flight Aircraft Emissions Impacts on Air Quality and Their Sensitivity to Grid Resolution. J. Geophys. Res. Atmos. 2017, 122, 13472–13494. [Google Scholar] [CrossRef] [PubMed]
  6. Riley, K.; Cook, R.; Carr, E.; Manning, B. A systematic review of the impact of commercial aircraft activity on air quality near airports. City Environ. Interact. 2021, 11, 100066. [Google Scholar] [CrossRef]
  7. Hudda, N.; Durant, L.W.; Fruin, S.A.; Durant, J.L. Impacts of Aviation Emissions on Near-Airport Residential Air Quality. Environ. Sci. Technol. 2020, 54, 8580–8588. [Google Scholar] [CrossRef] [PubMed]
  8. Bendtsen, K.M.; Bengtsen, E.; Saber, A.T.; Vogel, U. A review of health effects associated with exposure to jet engine emissions in and around airports. Environ. Health 2021, 20, 10. [Google Scholar] [CrossRef]
  9. Klöwer, M.; Allen, M.R.; Lee, D.S.; Proud, S.R.; Gallagher, L.; Skowron, A. Quantifying aviation’s contribution to global warming. Environ. Res. Lett. 2021, 16, 104027. [Google Scholar] [CrossRef]
  10. Wells, C.A.; Williams, P.D.; Nichols, N.K.; Kalise, D.; Poll, I. Reducing transatlantic flight emissions by fuel-optimised routing. Environ. Res. Lett. 2021, 16, 025002. [Google Scholar] [CrossRef]
  11. International Civil Aviation Organization (ICAO). Document 9889. Airport Air Quality Manual, Second Edition. Available online: https://www.icao.int/publications/Documents/9889_cons_en.pdf (accessed on 2 July 2022).
  12. Celikel, A.; Duhanian, N.; Peeters, S. Preliminary Local Air-Quality Study; Report EEC/BA/ENV/Note No. 001/2002; Environmental Studies Business Area, EUROCONTROL Experimental Centre: Brussels, Belgium, 2002. [Google Scholar]
  13. European Union Aviation Safety Agency (EASA). European Aviation Environmental Report, Chapter 7. Available online: https://www.easa.europa.eu/eaer/topics/aviation-environmental-impacts (accessed on 1 July 2022).
  14. European Union Aviation Safety Agency (EASA). Agency Research Agenda 2020–2022. Available online: https://www.easa.europa.eu/downloads/117222/en (accessed on 1 July 2022).
  15. Postorino, M.N. Environmental effects of airport nodes: A methodological approach. Int. J. Sustain. Dev. Plan. 2010, 5, 192–204. [Google Scholar] [CrossRef] [Green Version]
  16. Masiol, M.; Harrison, R.M. Aircraft engine exhaust emissions and other airport-related contributions to ambient air pollution: A review. Atmos. Environ. 2014, 95, 409–455. [Google Scholar] [CrossRef] [Green Version]
  17. Brennan, E. EUROCONTROL 2050 air traffic forecast and Objective Skygreen provide guidance for a purposeful long-term aviation sustainability. In EUROCONTROL Aviation Sustainability Briefing; EUROCONTROL: Brussels, Belgium, 2022; Volume 6, pp. 2–3. [Google Scholar]
  18. EUROCONTROL Objective Skygreen 2022–2030. The Economics of Aviation Decarbonisation towards the 2030 Green Deal Milestone. 2022. Available online: https://www.eurocontrol.int/sites/default/files/2022-05/eurocontrol-objective-skygreen-2022-2030-report-20220523.pdf (accessed on 1 July 2022).
  19. European Union Aviation Safety Agency (EASA). Sustainable Aviation Fuel ‘Monitoring System. Available online: https://www.easa.europa.eu/downloads/115346/en (accessed on 1 July 2022).
  20. Fan, W.; Sun, Y.; Zhu, T.; Wen, Y. Emissions of HC, CO, NOX, CO2 and SO2 from civil aviation in China in 2010. Atmos. Environ. 2012, 56, 52–57. [Google Scholar] [CrossRef]
  21. Stettler, M.E.J.; Eastham, S.; Barret, S.R.H. Air Quality and public health impacts of UK airports. Part I: Emissions. Atmos. Environ. 2011, 45, 5415–5424. [Google Scholar] [CrossRef]
  22. Yim, S.H.L.; Stettler, M.E.J.; Barret, S.R.H. Air Quality and public health impacts of UK airports. Part II: Impacts and policy assessment. Atmos. Environ. 2013, 67, 5415–5424. [Google Scholar] [CrossRef]
  23. Lawal, A.S.; Russell, A.G.; Kaiser, J. Assessment of Airport-Related Emissions and Their Impact on Air Quality in Atlanta, GA, Using CMAQ and TROPOMI. Environ. Sci. Technol. 2022, 56, 98–108. [Google Scholar] [CrossRef]
  24. Tait, K.N.; Khan, M.A.H.; Bullock, S.; Lowenberg, M.H.; Shallcross, D.E. Aircraft Emissions, Their Plume-Scale Effects, and the Spatio-Temporal Sensitivity of the Atmospheric Response: A Review. Aerospace 2022, 9, 355. [Google Scholar] [CrossRef]
  25. Balakrishnan, H.; Deonandan, I.; Simaiakis, I. Opportunities for Reducing Surface Emissions through Airport Surface Movement Optimization; Technical Report ICAT 2008/7; MIT International Center for Air Transportation: Cambridge, MA, USA, 2008; Available online: http://hdl.handle.net/1721.1/66491 (accessed on 1 July 2022).
  26. Miller, B.; Minoque, K.; Clarke, J. Constraints in Aviation Infrastructure and Surface Aircraft Emissions; Massachusetts Institute of Technology: Cambridge, MA, USA, 2000; pp. 1–15. [Google Scholar]
  27. Di Mascio, P.; Carrara, R.; Frasacco, L.; Luciano, E.; Ponziani, A.; Moretti, L. Influence of tower air traffic controller workload and airport layout on airport capacity. J. Airpt. Manag. 2021, 15, 408–423. [Google Scholar]
  28. Guo, R.; Zhang, Y.; Wang, Q. Comparison of emerging ground propulsion systems for electrified aircraft taxi operations. Transp. Res. C 2014, 44, 98–109. [Google Scholar] [CrossRef]
  29. Li, J.; Yang, H.; Liu, X.; Yu, N.; Tian, Y.; Zhou, X.; Zhang, P.; Wang, K. Aircraft Emission Inventory and Characteristics of the Airport Cluster in the Guangdong–Hong Kong–Macao Greater Bay Area, China. Atmosphere 2020, 11, 323. [Google Scholar] [CrossRef] [Green Version]
  30. International Civil Aviation Organization (ICAO). Manual of the ICAO Standard Atmosphere—3rd Edition 1993 (Doc. 7488). DOC-07488-003-01-Q-P. Available online: http://www.aviationchief.com/uploads/9/2/0/9/92098238/icao_doc_7488_-_manual_of_icao_standard_atmosphere_-_3rd_edition_-_1994.pdf (accessed on 5 July 2022).
  31. Ivković, I.; Čokorilo, O.; Kaplanović, S. The estimation of GHG emission costs in road and air transport sector: Case study of Serbia. Transport 2018, 33, 260–267. [Google Scholar] [CrossRef] [Green Version]
  32. Du Bois, D.; Paynter, G.C. Fuel flow method 2 for estimating aircraft emissions. SAE Trans. 2006, 115, 1–14. [Google Scholar]
  33. Mazaheri, M.; Johnson, G.R.; Morawska, L. Particle and Gaseous Emissions from Commercial Aircraft at Each Stage of the Landing and Takeoff Cycle. Environ. Sci. Technol. 2009, 43, 441–446. [Google Scholar] [CrossRef]
  34. Chati, S.Y.; Balakrishnan, H. Analysis of aircraft fuel burn and emissions in the landing and take-off cycle using operational data. In Proceedings of the International Conference on Research in Air Transportation, Istanbul, Turkey, 26–30 May 2014. [Google Scholar]
  35. International Civil Aviation Organization (ICAO). Aircraft Engine Emission Data Bank (07/2021). Available online: https://www.easa.europa.eu/domains/environment/icao-aircraft-engine-emissions-databank (accessed on 2 June 2022).
  36. Wilkerson, J.T.; Jacobson, M.Z.; Malwitz, A.; Balasubramanian, S.; Wayson, R.; Fleming, G.; Naiman, A.D.; Lele, S. Analysis of emission data from global commercial aviation: 2004 and 2006. Atmos. Chem. Phys. 2010, 10, 6391–6408. [Google Scholar] [CrossRef] [Green Version]
  37. Wasiuk, D.K.; Lowenberg, M.H.; Shallcross, D.E. An aircraft performance model implementation for the estimation of global and regional commercial aviation fuel burn and emissions. Transp. Res. D 2015, 35, 142–159. [Google Scholar] [CrossRef] [Green Version]
  38. Koudis, G.S.; Hu, S.J.; Majumdar, A.; Ochieng, W.Y.; Settler, M.E.J. The impact of single engine taxiing on aircraft fuel consumption and pollutant emissions. Aeronaut. J. 2018, 122, 1967–1984. [Google Scholar] [CrossRef] [Green Version]
  39. Lukic, M.; Hebala, A.; Giangrande, P.; Klumpner, C.; Nuzzo, S.; Chen, G.; Gerada, C.; Eastwick, C.; Galea, M. State of the art of electric taxiing systems. In Proceedings of the IEEE International Conference on Electrical Systems for Aircraft, Railway, Ship Propulsion and Road Vehicles International Transportation Electrification Conference (ESARS-ITEC), Nottingham, UK, 7–9 November 2018; pp. 1–6. [Google Scholar]
  40. Environmental Protection Agency (EPA). Technical Support for Development of Airport Ground Support Equipment Emission Reductions; Environmental Protection Agency: Washington, DC, USA, 1999.
  41. California Air Resources Board (CARB). Air Pollution Mitigation Measures for Airports and Associated Activity; National Technical Information Service: Springfield, VA, USA, 1994.
  42. Airport Cooperative Research Program (ACRP). Handbook for Evaluating Emissions and Costs of APUs and Alternative Systems; Report 64; Transportation Research Board: Washington, DC, USA, 2012.
  43. Di Mascio, P.; Moretti, L. Hourly Capacity of a Two Crossing Runway Airport. Infrastructures 2020, 5, 111. [Google Scholar] [CrossRef]
  44. Di Mascio, P.; Cervelli, D.; Comoda Correra, A.; Frasacco, L.; Luciano, E.; Moretti, L.; Nichele, S. A Critical Comparison of Airport Capacity Studies. J. Airpt. Manag. 2020, 21, 307–321. [Google Scholar]
  45. Di Mascio, P.; Cervelli, D.; Comoda Correra, A.; Frasacco, L.; Luciano, E.; Moretti, L. Effects of Departure manager and arrival manager systems on airport capacity. J. Airpt. Manag. 2021, 15, 204–218. [Google Scholar]
  46. Di Mascio, P.; Carrara, R.; Frasacco, L.; Luciano, E.; Ponziani, A.; Moretti, L. How the Tower Air Traffic Controller Workload Influences the Capacity in a Complex Three-Runway Airport. Int. J. Environ. Res. Public Health 2021, 18, 2807. [Google Scholar] [CrossRef]
  47. Čokorilo, O. Human Factor Modelling for Fast-Time Simulations in Aviation. Aircr. Eng. Aerosp. Technol. 2013, 85, 389–405. [Google Scholar] [CrossRef]
  48. Simaiakis, I.; Balakrishnan, H. Queuing models of airport departure processes for emissions reduction. In Proceedings of the AIAA Guidance, Navigation, and Control Conference, Chicago, IL, USA, 10–13 August 2009. [Google Scholar]
  49. IATA. Jet Fuel Price Monitor. 2021. Available online: https://www.iata.org/en/publications/economics/fuel-monitor/ (accessed on 29 June 2022).
  50. Ministero dello Sviluppo Economico. Prezzi Medi Settimanali dei Carburanti e Combustibili. 2021. Available online: https://dgsaie.mise.gov.it/prezzi-settimanali-carburanti (accessed on 14 July 2022).
  51. Corazza, M.V.; di Mascio, P.; Esposito, G. Airports as sensitive areas to mitigate air pollution: Evidences from a case study in Rome. Environments, 2022; submitted. [Google Scholar]
Figure 1. Airport layout.
Sustainability 14 09692 g001
Figure 2. Costs comparison.
Sustainability 14 09692 g002
Table 1. Taxiing TIM values.
PhaseTIM (Minutes)
Taxi-in6.3
Taxi-out12.6
Table 2. Towing vehicle performance.
Aircraft ClassFuel Type—EnergyPowerLoad FactorFuel ConsumptionHC EmissionsCO EmissionsNOX EmissionsPM EmissionsCO2 Emissions
bhp%gal/bhp-hg/bhp-hg/bhp-hg/bhp-hg/bhp-hg/gal
Narrow BodyDiesel175800.0611.24110.559797.2
Petrol130800.089424040.038932.8
Electric---80------------------
Wide BodyDiesel500800.0531.24110.539797.2
Petrol500800.089424040.038932.8
Electric---80------------------
Table 3. APU performance parameters in NL conditions.
Aircraft ClassFFj,APUHC EmissionsCO EmissionsNOX EmissionsPM EmissionsCO2 Emissions
kg/sg/kg of Fuelg/kg of Fuelg/kg of Fuelg/kg of Fuelg/kg of Fuel
Narrow Body0.0216.5331.755.45---3155
Wide Body0.0350.8710.267.55---3155
Table 4. APU performance parameters in MES conditions.
Aircraft ClassFFj,MESHC EmissionsCO EmissionsNOX EmissionsPM EmissionsCO2 Emissions
kg/sg/kg of Fuelg/kg of Fuelg/kg of Fuelg/kg of FuelG/Kg of Fuel
Narrow Body0.0380.294.947.64---3155
Wide Body0.0640.130.9811.53---3155
Table 5. Yearly average traffic mix.
Aircraft TypeEngine TypeNumber of EnginesLTO CyclesAircraft TypeEngine TypeNumber of EnginesLTO Cycles
A30BPW415829CRJ7GE CF34-8C5239
A310GE CF6-80C2A223CRJ9GE CF34-8C522676
A318CFMI CFM56-5B9/321069D328PW306B212
A319CFMI CFM56-5B5/P21659DC8CFMI CFM56-2C121
A320CFMI CFM56-5B4/324310DH8CPWC PW1232162
A321IAE V2533-A52346DH8DPWC PW150A2466
A330-200RR Trent 772B-60274E135AN AE3007A12654
A330-300RR Trent 772B-6021E145AN AE3007A1237
AN26Ivchenko AI 24VT2135E170GE CF34-8E5A12111
AT45PWC PW1272315E190GE CF34-10E5A121102
AT72PWC PW1202973F100RR Tay Mk650-152260
B190P&W PT6A-65B21F50PWC PW125B23
B350SHP P&W PT6A-60A21F70RR Tay Mk650-1521144
B461ALF502R-549GL5TRR BR710A2-20212
B462ALF 502R-54322GLEXR-R BR710-48-C2216
B463ALF 502R-54770J328P&W 306B211
B737-200P&W JT8D-9A2129L188Allison T56-A1441
B737-300P&W JT8D-9A21166MD80PW JT8D-217C22
B737-400P&W JT8D-9A21822MD82PW JT8D-217C21617
B737-500P&W JT8D-9A2538MD83PW JT8D-217C274
B737-600CFMI CFM56-7B20272MD87PW JT8D-217C214
B737-700CFMI CFM56-7B22293MD90IAE V2525-D522
B737-800CFMI CFM56-7B2626859RJ1HLY LF507-1F4150
B747-200PW JT9D-7Q44RJ70LY LF 507-1F42
B747-400GE CF6-80C2B1F43RJ85LY LF507-1F4514
B757-200RR RB211-535 E42459SB20AN AE2100A2144
B767-200GE CF6-80A22267SF34GE CT7-5A224
B767-300PW40602140SH36P&W PT6A-67R21
CRJ1GE CF34-3A122SW3Garrett TPE331-10U-503G23
CRJ2GE CF34-3A121019SW4Garrett TPE331-1229
Table 6. Emissions of FET.
PhaseTIMThrustHCCONOXSOXPMCO2Fuel
Approach4.0300.89.739.84.30.513,4164252
Taxi-in6.375.758.911.22.60.282052601
Taxi-out12.6711.4118.722.65.20.516,5375242
Take off0.71000.31.663.02.60.482282608
Climb out2.2850.84.1130.56.71.021,2816745
LTO cycle25.8---19.0193.1267.021.42.667,66821,448
Table 7. Airport emission scenarios.
Taxiing ModePhaseHCCONOXSOXPMCO2Fuel Consumption
TonTonTonTonTonTonTon
SETTaxi-in5.153.010.12.30.273792339
−10.1%−10.1%−10.1%−10.1%−10.1%−10.1%−10.1%
Taxi-out8.082.915.83.70.3115443659
−30.2%−30.2%−30.2%−30.2%−30.2%−30.2%−30.2%
LTO-cycle15.0151.3259.019.62.461,84919,603
−21.2%−21.6%−3.0%−8.6%−6.5%−8.6%−8.6%
RED1Taxi-in4.849.59.42.20.268952185
−16.0%−16.0%−16.0%−16.0%−16.0%−16.0%−16.0%
Taxi-out10.5109.320.84.80.415,2274826
−7.9%−7.9%−7.9%−7.9%−7.9%−7.9%−7.9%
LTO-cycle17.2174.3263.420.62.565,04720,617
−9.5%−9.8%−1.3%−3.9%−2.9%−3.9%−3.9%
RED2Taxi-in3.940.17.61.80.255851770
−31.9%−31.9%−31.9%−31.9%−31.9%−31.9%−31.9%
Taxi-out9.699.919.04.40.413,9164411
−15.8%−15.8%−15.8%−15.8%−15.8%−15.8%−15.8%
LTO-cycle15.4155.4259.819.82.462,42719,787
−19.1%−19.5%−2.7%−7.8%−5.9%−7.8%−7.8%
RED3Taxi-in3.030.75.81.40.142741355
−47.9%−47.9%−47.9%−47.9%−47.9%−47.9%−47.9%
Taxi-out8.790.517.24.00.412,6063996
−23.8%−23.8%−23.8%−23.8%−23.8%−23.8%−23.8%
LTO-cycle13.6136.6256.219.02.359,80618,956
−28.6%−29.2%−4.0%−11.6%−8.8%−11.6%−11.6%
APU dieselTaxi-in8.464.023.42.70.884812478
48.5%8.6%109.0%3.4%240.1%3.4%−4.7%
Taxi-out13.687.239.22.91.411,0433077
19.0%−26.6%73.4%−33.2%199.8%−33.2%−41.3%
LTO-cycle23.9166.6295.819.24.162,44919,161
25.9%−13.7%10.8%−7.7%59.3%−7.7%−7.7%
APU petrolTaxi-in10.5261.514.52.70.284882478
84.3%343.8%29.6%3.4%−9.4%3.4%−4.7%
Taxi-out17.7485.221.23.50.211053077
54.7%308.6%−5.9%−33.1%−49.6%−33.1%−41.3%
LTO-cycle30.0762.0269.019.82.362,47019,161
58.1%294.7%0.7%−7.7%−10.1%−7.7%−7.7%
APU electricTaxi-in7.159.511.22.50.278192478
25.0%1.1%−0.4%−4.7%−20.2%−4.7%−4.7%
Taxi-out10.978.214.53.10.297093077
−4.6%−34.1%−36.0%−41.3%−60.4%−41.3%−41.3%
LTO-cycle19.9153.2258.818.62.260,45319,161
4.7%−20.7%−3.1%−10.7%−13.1%−10.7%−10.7%
MESTaxi-in4.749.713.32.60.283042632
−17.4%−15.6%18.3%1.2%−20.2%1.2%1.2%
Taxi-out4.852.417.63.20.210,0833196
−57.6%−55.8%−22.0%−39.0%−60.4%−39.0%−39.0%
LTO-cycle11.4117.6264.119.42.261,31319,434
−39.8%−39.1%−1.1%−9.4%−13.1%−9.4%−9.4%
Table 8. Yearly fuel costs for different scenarios.
ModeKerosene (€)Diesel/Petrol (€)Total (€)Difference with Respect to FET (€)
FET11,825,396011,825,396-
SET10,808,411010,808,411−1,016,985
RED111,367,408011,367,408−457,988
RED210,909,420010,909,420−915,976
RED310,451,432010,451,432−1,373,963
APU diesel10,564,5831,236,85111,801,434−23,961
APU petrol10,564,5831,460,27412,024,857199,461
APU electric10,564,583010,564,583−1,260,813
MES10,714,738010,714,738−1,110,658
Table 9. Results of SET conditions in the short-term scenario.
PhaseHCCONOXSOXPMCO2Fuel Consumption
TonTonTonTonTonTonTon
Approach0.89.739.84.30.513,4164252
0%0%0%0%0%0%0%
Taxi-in (SET)5.153.010.12.30.273792339
−10.1%−10.1%−10.1%−10.1%−10.1%−10.1%−10.1%
Taxi-out (SET)8.082.915.83.70.311,5443659
−30.2%−30.2%−30.2%−30.2%−30.2%−30.2%−30.2%
Take off0.31.663.02.60.482282608
0%0%0%0%0%0%0%
Climb out0.84.1130.56.71.021,2816745
0%0%0%0%0%0%0%
LTO cycle15.0151.3259.019.62.461,84919,603
−21.2%−21.6%−3.0%−8.6%−6.5%−8.6%−8.6%
Table 10. Results of SET conditions in the long-term scenario.
PhaseHCCONOXSOXPMCO2Fuel Consumption
TonTonTonTonTonTonTon
Approach0.89.739.84.30.513,4164252
0%0%0%0%0%0%0%
Taxi-in (RED2)3.940.17.61.80.255851770
−31.9%−31.9%−31.9%−31.9%−31.9%−31.9%−31.9%
Taxi-out (MES)4.852.417.63.20.210,0833196
−57.6%−55.8%−22.0%−39.0%−60.4%−39.0%−39.0%
Take off0.31.663.02.60.482282608
0%0%0%0%0%0%0%
Climb out0.84.1130.56.71.021,2816745
0%0%0%0%0%0%0%
LTO cycle10.6108.0258.418.62.258,59318,572
−44.2%−44.1%−3.2%−13.4%−14.2%13.4%−13.4%
Publisher’s Note: MDPI stays neutral with regard to jurisdictional claims in published maps and institutional affiliations.

