Article

Potassium Source and Biofertilizer Influence K Release and Fruit Yield of Mango (Mangifera indica L.): A Three-Year Field Study in Sandy Soils

1
School of Biological and Environmental Engineering, Guiyang University, Guiyang 550005, China
2
Haikou Experimental Station, Chinese Academy of Tropical Agricultural Sciences (CATAS), Haikou 571101, China
3
Department of Biology, College of Science, Princess Nourah bint Abdulrahman University, P.O. Box 84428, Riyadh 11671, Saudi Arabia
4
School of BioSciences, University of Melbourne, Parkville, VIC 3010, Australia
5
Centre for Anthropogenic Pollution Imapct and Management, University of Melbourne, Parkville, VIC 3010, Australia
6
Field Crops Research Institute, Agricultural Research Center, Giza 12112, Egypt
7
Department of Soils and Water, Faculty of Agriculture, Assiut University, Assiut 71526, Egypt
8
Pomology Department, Faculty of Agriculture, Assiut University, Assiut 71526, Egypt
*
Authors to whom correspondence should be addressed.
These authors contributed equally to this work.
Sustainability 2022, 14(15), 9766; https://doi.org/10.3390/su14159766
Submission received: 5 July 2022 / Revised: 4 August 2022 / Accepted: 5 August 2022 / Published: 8 August 2022

Abstract

:
Arid degraded soils have a coarse texture and poor organic matter content, which reduces the activity of microorganisms and soil enzymes, and thus the soil quality, plant yield and quality decrease. Potassium solubilizing bacteria (KSB) have been suggested to increase the activity of soil enzymes and increase the release of potassium from natural K-feldspar in the arid degraded soil, and thus potentially reduce the rates of the application of chemical fertilizers. Field studies were conducted for three successive growing seasons in an organic farming system to investigate the effects of K-feldspar and KSB (Bacillus cereus) on K release, soil fertility, and fruit yield of mango plants (Mangifera indica L.). The maximum growth of mango plants was found in the treatments inoculated with KSB. KSB increased soil available N, P, K, and the activity of dehydrogenase and alkaline phosphatase enzymes by 10, 7, 18, 54, and 52%, respectively. KSB increased the fruit yield of mango by 23, 27, and 23% in the first, second, and third growing seasons, respectively. The partial (up to 50%) substitution of chemical K-fertilizer with K-feldspar gave fruit yield and quality very close to that fertilized with the full chemical K-fertilizer. The release rate of K (over all the treatments) varied between 0.18 and 0.64 mg kg−1 of soil per day. KSB significantly increased the K release rate. The application of chemical K-fertilizer gave the highest K release, while substitution with K-feldspar reduced the release of K. Natural K-feldspar contains 8.2% K but is poorly soluble when applied alone. KSB increased the soil quality parameters and enhanced the growth and quality of mango fruit. The fruit yield of mango, under KSB inoculation and fertilization with different K sources, ranged between 9.14 to 17.14 t ha−1. The replacement of 50% of chemical K-fertilizer with natural K-feldspar caused a decrease in the fruit yield by 17, 8, and 2.7% in the first, second, and third years, respectively. The substitution of chemical K-fertilizer with K-feldspar up to 50% with KSB is a good strategy to reduce the excessive use of chemical K-fertilizer. B. cereus and natural K-feldspar have the potential to improve soil health and mango plant productivity in low fertile arid soils.

1. Introduction

Mango (Mangifera indica L.) plants belong to the Anacardiaceae family and are considered the queen of tropical fruits with a special flavour and taste [1]. The global production of mango was 56 million tonnes in 2020 [2]. Asian mango producers control more than 70% of the world’s market, with India being the top producer with 25 tonnes per hectare [2]. Mango is an important tropical fruit, consumed fresh or after being processed into juice and jam. Mango fruit has excellent eating quality and nutritional composition due to its high content of minerals, vitamins, fiber, and phytochemicals [3,4].
Potassium nutrition is one of the most important problems facing organic agriculture because most natural sources of K are poorly soluble, which reduces plant uptake [5,6]. Potassium is an essential element with roles in plant growth and final yield as it controls ionic balance, protein synthesis, photosynthesis, stress tolerance, translocation of photosynthates, and activation of several plant enzymes [7,8]. Potassium has a special role in flowering, fruiting, and the formation of starch [9]. On the other hand, high rates of K may cause an imbalance in the nutrition of calcium and magnesium [9]. The application of chemical K-fertilizer and weathering of K-minerals are the main sources of K for plant growth [10,11]. Natural K-feldspar is a low-cost source for K nutrition in organic agriculture production and could substitute in industrial agriculture for chemical K-fertilizers which are often expensive [6,12]. Although K-feldspar minerals contain valuable concentrations of K, they are poorly soluble [5,6]. Natural K-feldspar has been used in several studies, but there is little information about the kinetics of release of K in sandy soils, especially in organic farming systems. The application of adequate K fertilizer to mango plants increases the fruit yield and quality, on the other hand, excessive rates cause an economic loss for farmers and an overuse of a non-renewable resource, which contradicts sustainable development [13,14,15].
Excessive long-term application of chemical fertilizers may negatively impact environmental ecosystems, resulting in health effects and reducing soil quality which consequently may reduce crop productivity [16,17,18]. One of the most important disadvantages of using potassium fertilizers is that they are expensive, and the excessive consumption of them in agricultural production leads to increased costs and reduced profits [16,17,18]. Increasing the rate of the added potassium fertilizer reduces Mg uptake and plant growth [18]. The use of bio-fertilizers, which are applied to soil or plants, is an effective approach to minimize the application of chemical fertilizers and increase food safety for human consumption [16,17,19]. Bacillus cereus is a potassium solubilizing bacterium (KSB) and has been used in several studies to increase the solubility of K. In addition, B. cereus enhances plant growth via increasing nutrient uptake and production of plant hormones [16,20,21,22,23]. Although the role of KSB in increasing nutrient uptake and plant growth is known for several field crops, its role in the rate of K release in sandy soils still needs additional research.
Several studies have been conducted on the use of natural K-feldspar in organic farming systems. However, there is little information about the rate of K release, especially in coarse texture soils. Also, most of the previous studies about the effect of potassium solubilizing bacteria have focused on the availability and uptake of K without investigating the role of these microorganisms in the kinetics of K release. The rate of K release from the added fertilizers is one of the most important factors for mango production in arid degraded soils, especially those of coarse texture and poor in their content of K minerals. The present research assumes that inoculation with K-dissolving bacteria will affect the release rates of K from K-feldspar and that knowledge of release rates will determine to what extent it can be relied upon in the K nutrition of mango trees in arid degraded soils. The current study aims to investigate the kinetics of K release under chemical K-fertilizers and natural K-feldspar in a sandy soil cultivated with mango with or without potassium solubilizing bacteria. The effect of KSB and K sources on soil fertility, leaf nutrient concentrations, plant growth, yield, and fruit quality were also determined.

2. Materials and Methods

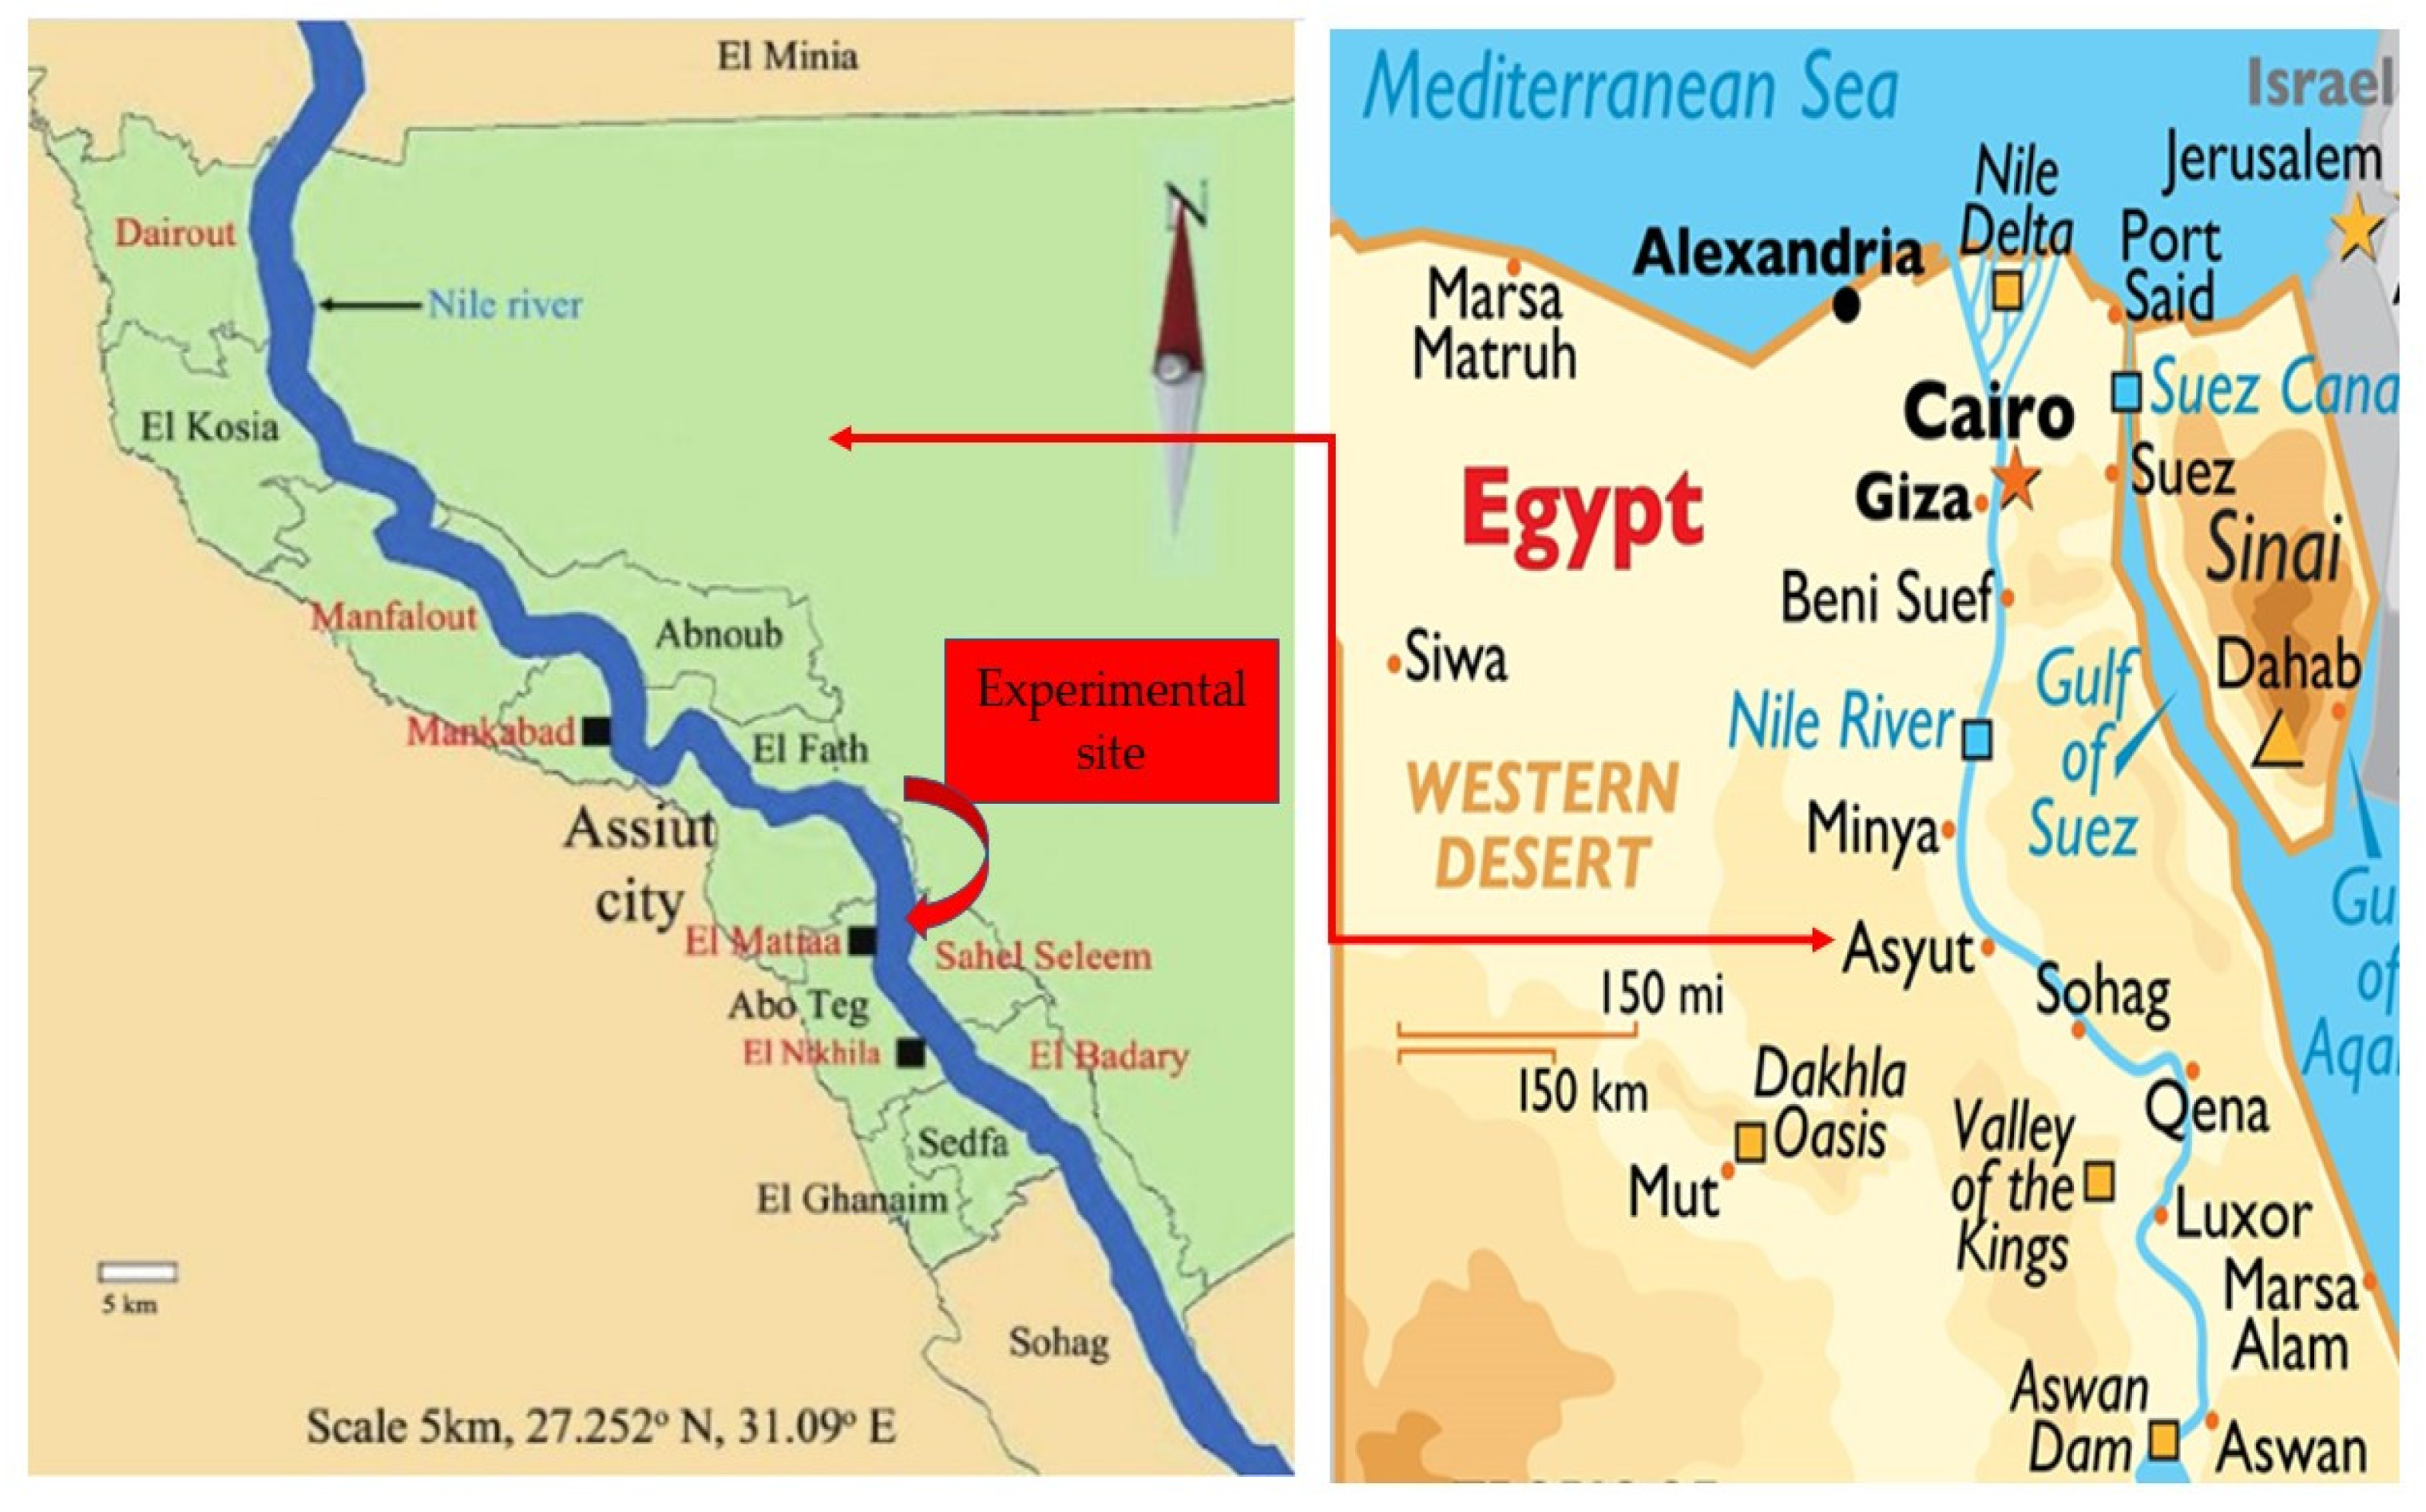
2.1. Field Experiment

The field experiments were carried out at a private farm which has followed an organic farming system for ten years (Figure 1). The farm is located at Sahel Sleem, Asyut Governorate, Egypt (27°03′11.4″ N 31°20′05.6″ E). Composted manure is the only soil amendment which is added yearly at a rate of 30 t ha−1 in the end of December and mixed with the top soil layer. The main characteristics of the compost are: pH of 7.2, total organic matter of 80%, and total N, P, and K of 2.1, 0.30, and 0.82%, respectively. The current study was conducted during the 2018, 2019, and 2020 growing seasons with 10-year-old Keitt mango trees (Mangifera indica L. cv. Keitt). The plant density was 400 plants ha−1 with a plant spacing of 5 × 5 m. The field experiment was conducted on a sandy soil, which is classified as an Arenosol according to the Food and Agriculture Organization [24]. Table 1 shows the main characteristics of the studied soil. The experiment investigated two factors (KSB × K fertilizers) and consisted of 12 different treatments (2 KBS treatments × 6 fertilization treatments). The trial was laid out in a randomized complete block design with 5 replicates, each containing 5 trees, for each treatment (60 experimental plots in total). The treatments were repeated every growing season in the same experimental units. The first factor was inoculation with potassium solubilizing bacteria (with or without inoculation). The second factor consisted of six treatments: 100-Sul = fertilized only with K2SO4, 75-Sul:25-Fel = 75% of K dose from K2SO4 + 25% from K-feldspar, 50-Sul:50-Fel = 50% of K dose from K2SO4 + 50% from K-feldspar, 25-Sul:75-Fel = 25% of K dose from K2SO4 + 75% from K-feldspar, 100-Fel = fertilized only with K-feldspar, and C = control without fertilization. Each year, the fertilizers were mixed with the top soil layer (0–0.2 m) during the field preparation at the end of December.
Natural rock K-feldspar (powdered) containing 8.2% K and potassium sulfate (41.5% K, 17.8% S) were used as the K sources. Potassium was added each year at a rate of 250 kg of K ha−1 as recommended by the Ministry of Agriculture and Land Reclamation of Egypt. Each tree was inoculated with 20 mL of commercial bio-fertilizer containing Bacillus cereus AR156 (108 CFU mL−1). 50 mL of bio-fertilizer was added to one liter of distilled water, then the bio-fertilizer was sprayed around the tree and mixed with soil. The commercial bio-fertilizer was bought from the National Research Center, Giza, Egypt. The inoculation process was completed twice, first in January and then again after two weeks to ensure successful inoculation with biofertilizer. Harvesting was conducted in August of each growing season by collecting fruits by hand. The fruit yield of each tree was recorded, and then the total yield was calculated per hectare.

2.2. Soil Physicochemical Parameters

Soil samples (0–0.5 m) were collected on the first of April each year. The collected soil samples were used to follow up the changes in soil characteristics and nutrients availability. The soil samples were air-dried, crushed, and then sieved using a 2 mm sieve. Physiochemical characteristics were analyzed based on the standard methods described by Burt [25]. The soil pH was determined in the soil suspension (1:2 (w/v), soil: deionized water) using a pH meter. The total soluble salts were determined in the soil extract (1:2 (w/v), soil: deionized water) by the electrical conductivity method. Soil organic carbon (SOC) was determined using the Walkley and Black method. Total calcium carbonate was determined by Collin’s Calcimeter. Total nitrogen was measured by Kjeldahl’s distillation method after the digestion of soil samples with concentrated sulfuric and perchloric acids (at a ratio of 7:3, respectively). Devarda’s alloy was added to the soil extraction during the distillation to obtain the total nitrogen (NH4 + NO3 + Organic-N). A sodium bicarbonate solution (0.5 M) at pH 8.5 was used to extract the available phosphorus. Phosphorus in the soil extract was measured by the spectrophotometer method (Unico 2000UV, Germany) at 660 mm. Available soil potassium was extracted by ammonium acetate and measured by the flame photometer.
The activity of alkaline phosphatase enzyme was determined by spectrophotometer at 400 nm after the incubation of soil samples with 0.025 M p-nitrophenyl phosphate substrate at 37 °C for 60 min [26,27]. The activity of dehydrogenase enzyme was determined by spectrophotometer at 485 nm after the incubation of 5 g of soil sample with triphenyltetrazolium chloride for 24 h at 37 °C [28].

2.3. Kinetic Release of Soil Potassium (K)

Every year, soil samples (0–0.5 m) were taken from all the replicates (plots) of each treatment to study the kinetic release of K. Each composite sample (one kg of soil) was collected randomly from different places in the plot and then combined together to be a representative sample. The evaluation of K kinetics is based on the extraction of K at different times. Based on previous research, the CaCl2 method is recommended for determining the rate of K release in calcareous soils [29,30,31]. In the current study, K was extracted by 0.01 mol L−1 CaCl2 after incubation (25 ± 1 °C) periods of 1, 3, 7, 14, 21, 30, 50, and 80 days [30]. A soil sample (1 g) was suspended in 20 mL of 0.01 mol L−1 CaCl2. K in the supernatant was measured by a flame photometer (Jenway 7PFP, Stafford, UK). The kinetics of K release with time were fitted using the power function model of Havlin and Westfall [32]. Thus, Kt = atb, where, potassium released at time (t) = Kt, a and b is the intercept and slope of the curve fitted by the equation. Coefficients of determination (R2) and standard error (SE) of the function were calculated for each treatment.

2.4. Plant Analysis

Composite leaf samples, each consisting of fifty leaves from each tree from each experimental plot, were collected from the third and fourth node below the panicle at the beginning of the emergence of the panicle [33,34,35]. Plant samples were collected and transferred directly to the laboratory. After the plant samples were washed with tap water and then distilled water, they were spaced out on clean laboratory benches to air dry. After 48 h, the plant samples were dried by oven at 70 °C for 48 h and then ground. Two grammes of each dried sample were digested with a mixture of 350 mL H2O2 + 0.42 g selenium powder + 14 g Li2SO4. H2O + 420 mL concentrated H2SO4 [36]. The digested plant samples were analyzed for N, P, and K according to the standard methods described by Burt [25] (details given above in the soil physicochemical parameters section). Chlorophyll a and b in the fresh leaves were extracted by acetone and measured by the method of Arnon [37]. The growth parameters (shoot length, leaves number, and leaf area) were recorded at the beginning of the emergence of panicle in April each year. To measure the growth characteristics, 20 secondary branches were selected. Ten ripe fruits were selected randomly from each experimental plot to determine the fruit quality, including total soluble solids, total sugar, vitamin C, total fiber, and % pulp, were determined according to the Official Methods of Analysis [38].

2.5. Statistical Analysis

A factorial randomized block design (RBD) with five replicates was used in the current field experiment. Duncan multiple range tests and ANOVA were run by SPSS 17.0 package (SPSS, Chicago, IL, USA) at a 5% level of probability. The data were checked for normality by the Kolmogorov-Smirnov test before undertaking ANOVA. Principal component analysis (PCA) was run by Past software version 4.06.

3. Results

3.1. Effect of KSB and K Source on K-Kinetics Release

Table 2 shows the results of the kinetic release study. The tested treatments significantly affected the parameters of the power equation. The power function equation is suitable to describe the kinetics release of potassium based on the coefficients of determination (R2 = 0.87–0.96). The value of b, which represents the slope of the curve and can be considered as an index of the K release rate, differed significantly among the tested treatments. The release rate of K varied between 0.18 to 0.64 mgkg−1 of soil per day. The highest K release rate was found in the soil treated with potassium sulfate (100-Sul) and inoculated with potassium solubilizing bacteria (KSB), while the lowest was found in the control soil without inoculation. The release rate of K was found to decrease in the order: 100-Sul > 75-Sul:25-Fel > 50-Sul:50-Fel > 25-Sul:75-Fel = 100-Fel > C. The inoculation of soil with potassium solubilizing bacteria significantly increased the K release rate over the non-inoculated treatments.

3.2. Effect of KSB and K Source on Soil Quality

Soil organic carbon (SOC) and soil pH were affected significantly by the potassium fertilization treatments and potassium solubilizing bacteria (KSB) (Figure 2). Soil organic carbon in the inoculated treatments was higher than the in non-inoculated ones. Of all the potassium source treatments, KSB inoculation resulted in increased SOC of 15% compared to the non-inoculated treatments. The SOC ranged between 4.6 to 5.2 g C kg−1 of soil DW in the non-inoculated treatments and between 5.5 to 5.8 g C kg−1 of soil DW in the case of inoculated ones. The initial SOC in the soil before cultivation was 4.5 g C kg−1 of soil DW (Table 1) and after three years of inoculation with KSB it reached 5.7 g C kg−1 of soil DW. The soil pH ranged between 7.7 and 8.0. The pH of the soil in the treatments that were inoculated with KSB was lower than the non-inoculated ones. The highest significant soil pH (8.0) was recorded in the C treatment without KSB inoculation, while the lowest soil pH (7.7) was found in the 100-Sul and 75-Sul:25-Fel, which were inoculated with KSB. Of all the potassium source treatments, KSB significantly increased the activity of dehydrogenase and alkaline phosphatase in soil by 54 and 52%, respectively. The lowest significant values of dehydrogenase and alkaline phosphatase activity were found in the control soil without potassium fertilization. Moreover, the activity of dehydrogenase and alkaline phosphatase in 100-Fel treatment was significantly lower than the other potassium treatments.
The available soil nitrogen (N), phosphorus (P), and potassium (K) were significantly affected by the potassium fertilization treatments and KSB (Figure 3). The concentrations of soil available N, P, and K in the inoculated treatments were higher than in the non-inoculated treatments. Of all the potassium source treatments, KSB increased the available N, P, and K by 10, 7, and 18% compared with the non-inoculated soils, respectively. Overall, the 75-Sul:25-Fel treatment gave the highest available N and P values, while 100-Sul gave the highest value of K availability in the studied sandy soil.

3.3. Effect of KSB and K Source on Nutrient Concentrations and Growth of Mango Plants

Nitrogen (N), phosphorus (P), and potassium (K) concentrations in mango leaves were affected by the potassium fertilization treatments (Table 3). KSB caused 4.1, 7.7, and 13.4% increases in N, P, and K concentrations in mango leaves, but these increases were insignificant. In general, all the potassium fertilization treatments, except 100-Fel, gave higher nutrient concentrations than the control. The lowest values of N, P, and K concentrations in mango leaves were found in the control. The growth parameters of mango plants include: shoot length, number of leaves, leaf area, and chlorophyll are shown in Table 4. The studied growth parameters were affected significantly by the potassium fertilization treatments and KSB. KSB gave the maximum significant growth of mango.
In general, all the potassium fertilization treatments gave higher growth than the control. In most cases, the lowest growth was found in the control soil and in the soil treated with 100-Fel. There were no significant differences in the growth of plants treated with 100-Sul, 75-Sul:25-Fel, and 50-Sul:50-Fel. Chlorophyll a and b were affected significantly by the KSB and potassium fertilization treatments, respectively. The maximum values of chlorophyll a and b were found in the plants grown on the soil inoculated with KSB and fertilized with 100-Sul and 75-Sul:25-Fel.

3.4. The Effect of KSB and K Source on Mango Plant Fruit Yield and Quality

The fruit yield of mango plants was affected significantly by the potassium fertilization treatments and KSB (Figure 4). The fruit yield in the KSB treatments was higher than in the non-inoculated ones. KSB increased fruit yield by 23, 27, and 23% in the first, second, and third growing seasons, respectively. There were no significant differences of the fruit yield obtained from 100-Sul, 75-Sul:25-Fel, and 50-Sul:50-Fel in the data of the second and third years. In general, all the potassium fertilization treatments resulted in a significantly (p < 0.01) higher fruit yield than the control. The lowest fruit yield was in the control and 100-Fel. The fruit yield ranged between 9.14 and 17.14 t ha−1. The maximum fruit yield was achieved from the treatments that received the full recommended dose from potassium sulfate (100-Sul) followed by the treatments that received 75 or 50% of the recommended dose from K2SO4 + 25 or 50% from K-feldspar (75-Sul:25-Fel and 50-Sul:50-Fel). In the inoculated treatments, the replacement of 50% of the chemical K-fertilizer with natural feldspar caused a decrease in fruit yield by 17, 8, and 2.7% in the first, second, and third years, respectively. The decrease in the fruit yield was only statistically significant in the first year.
The principal component analysis (PCA) in Figure 5 shows the relationships among fruit yield, K release (KR), availability of potassium (K), nitrogen (N), and phosphorus (P), soil organic carbon (SOC), the activity of dehydrogenase (DHE) and phosphatase enzymes (PHOSP), and the soil pH. The PCA showed that there were positive correlations between fruit yield, K release, and the availability of K and P. The correlation between soil quality parameters and soil pH was negative.
The quality parameters of mango fruit were affected significantly by the tested treatments, as shown in Table 5. The total soluble solids, total sugar, and vitamin C increased significantly in response to KSB inoculation. KSB increased the pulp in mango fruit and reduced the fiber content. In most cases, the highest quality parameters were found in 100-Sul, 75-Sul:25-Fel, and 50-Sul:50-Fel.

4. Discussion

4.1. Kinetics of K Release

The power function equation described the kinetics of the release of potassium adequately based on the data of the coefficients of determination (R2). Plata et al. [39] showed that the power function defined the kinetic release of nutrients from volcanic rock mining byproducts well. The K release rate varied significantly between the treatments and ranged between 0.18 and 0.64 mg kg−1 of soil per day. The application of chemical fertilizer (potassium sulphate) gave the highest K release rate, while the substitution with K-feldspar reduced the K release rate. The mineral of K-feldspar in the current study contained 8.2% K, but it was only poorly soluble [5,6]. The inoculation with potassium solubilizing bacteria significantly enhanced K release over the non-inoculated treatments. Bacillus cereus can dissolve potassium from K-feldspar minerals by producing organic acids that increase the K release from the mineral [16,40]. Several studies have confirmed that potassium solubilizing bacteria are able to produce organic acids such as tartaric, citric, and oxalic acids [16,41,42,43,44].

4.2. Soil Quality

The improvement of soil quality was likely due to the reduction in soil pH as a result of the activity of Bacillus cereus. KSB has been previously shown to produce organic acids and other chemicals which may reduce soil pH [16,42,44]. The initial soil pH in the current study before cultivation was 8.0. The soil pH was significantly reduced to 7.7 as a result of KSB inoculation, especially in the treatments that contained potassium sulfate alone or mixed with K-feldspar. Several previous researchers have confirmed the ability of B. cereus to produce organic acids and reduce the soil pH [16,42,43,44]. According to the results of our study, the soil pH in the treatments inoculated with the bio-fertilizer was lower than that of the non-inoculated ones. Therefore, we assume that the soil pH declined due to direct and indirect effects of biofertilizer. The direct effect of the biofertilizer was through increasing the activity of soil microbes and enzymes. Chen et al. [43] studied the activity of potassium solubilizing bacteria (B. aryabhattai SK1-7) in fermentation and pot experiments, and they found that the pH of the growth media declined from 7.2 to 4.3 within the first day, while the soil pH in the pot experiments was decreased by 0.28 units after 100 days of inoculation. The decreases in the soil pH as a result of inoculation with KSB was also reported by Buragohain et al. [44]. The indirect effect of the biofertilizer was through increasing the plant growth as a result of stimulating hormones produced from the inoculated biofertilizer [45,46]. The root growth increased the soil organic matter which decomposed and reduced the soil pH [47]. Higher root growth also increased the root secretions which may increase the soil organic matter and reduce the rhizosphere pH [48].
During the growth of KSB, some organic acids are secreted as secondary metabolites, decreasing the soil pH [43,44]. The soil pH was significantly reduced after three years of inoculation with KSB. On the other hand, the soil organic matter and nutrient availability significantly increased. The mechanism of increasing nutrient availability may be due to the increase in root growth and the activity of soil enzymes [16,41]. We hypothesise that the increase in the activity of soil enzymes and the decrease in soil pH led to increased nutrient availability. The findings of the current study showed a remarkable increase in the activity of dehydrogenase and alkaline phosphatase in the inoculated soil. The activity of soil enzymes reflects the soil health and microbes’ activity [27,49]. Moreover, the activity of soil enzymes affects nutrient cycling in the soil and plant system [27,50].

4.3. Fruit Yield and Quality

The growth, quality, and yield of mango plants were improved by the application of potassium treatments and the inoculation with potassium solubilizing bacteria (KSB). In the current study, there were clear increases in chlorophyll and nutrient uptake, which is likely to have led to the increase in vegetative growth and total plant biomass [17,45]. The bio-fertilization of mango plants with Bacillus cereus caused large improvements in the availability and uptake of N, P, and K. According to the principal component analysis (PCA) in Figure 4, the loading plot showed that yield, K release (KR), availability of potassium (K), nitrogen (N), and phosphorus (P), soil organic carbon (SOC), the activity of dehydrogenase, and phosphatase enzymes were positively correlated with each other and negatively with the soil pH.
The fruit yield is highly correlated with K release and soil quality indicators, e.g., nutrient availability and soil enzymes. Soils in arid regions suffer from high alkalinity, and consequently, the quality of the soil is clearly reduced. Lowering the pH of alkaline soils provides good conditions for increasing nutrient availability, thus increasing the activity of soil microorganisms and increasing the secretion of soil enzymes. We hypothesise that lowering the soil pH led to an increase in the activity of soil microorganisms, which led to an increase in the rates of potassium release. Potassium is one of the essential macronutrients and is important for plant growth [7,51]. Potassium has a crucial role in the activation of some plant enzymes, synthesis of protein, photosynthesis, and fruit quality [13,51,52]. The inoculation of mango plants with KSB caused increases in the concentrations of leaf N, P, and K by 4.1, 7.7, and 13.4%, respectively. Essential nutrients, e.g., N, P, and K act to increase the biomass yield through improving the growth of plant roots, activating some plant enzymes, promoting the process of photosynthesis, avoiding the loss of energy, and other fundamental physiological processes [7,16]. The bio-fertilization of mango with B. cereus significantly increased the total yield of mango by 24% as compared with the untreated plants (Figure 5). The substitution of chemical K-fertilizer with K-feldspar up to 50% with the potassium solubilizing bacteria gave a fruit yield of mango very similar to that fertilized with full chemical K-fertilizer.
The inoculation of mango with B. cereus resulted in an increase in the total fruit yield, which may be due to the production of some plant hormones that promoted the plant’s growth [53,54]. The yield and growth of some field and vegetable crops such as cotton, rapeseed, cucumber, pepper, and sudan grass were increased when these species were inoculated with potassium solubilizing microorganisms [55,56,57]. According to the results of the current study, the maximum K release (0.64 mg kg−1 of soil per day) was found in the 100% of K from K2SO4. The superiority of K2SO4 as a K source was confirmed in other studies, e. g., Merwad [58] and Ali et al. [59]. Despite the clear superiority of using K2SO4 in mango fertilization, the partial (up to 50%) substitution of chemical K-fertilizer with K-feldspar did not cause a significant effect on reducing the fruit yield. Reducing the use of chemical fertilizers has become an urgent necessity for sustainable development and environmental preservation [56,57]. Natural alternatives to chemical K-fertilizers have a slow release rate, so it is recommended to use bio fertilizers that improve the efficiency of minerals and increase K release [58,59].

5. Conclusions

The use of natural minerals in the organic production of horticulture has been increasing in the last decade. Studying the kinetics of K release under organic farming is required to provide real information about the ability of K-feldspar to supply plants with their K requirements. The use of K-feldspar and Bacillus cereus are good strategies to reduce the rates of chemical K-fertilizers. The substitution of chemical K-fertilizer with K-feldspar up to 50% in combination with the potassium solubilizing bacteria can give a fruit yield of mango very similar to that fertilized with a full chemical K-fertilizer. Potassium feldspar contains K, but cannot be used alone to provide the mango plants with optimal K requirements, due to its low solubility. The findings of the current study confirmed the positive role of B. cereus in increasing the K release from K-feldspar. Further field and laboratory analyses should be conducted to explore the role of K-feldspar and B. cereus on the quality of mango in organic farming systems. Monitoring the microbial communities to determine the impact of B. cereus on the native microbial population, and how adaptation takes place over time would also be desirable in future research.

Author Contributions

Conceptualization, E.A.A.A.-Z., A.A.A.-H. and M.A.E.; methodology, E.A.A.A.-Z. and A.A.A.-H.; software, S.M.R.; validation, S.M.R. and M.A.E.; data curation, E.A.A.A.-Z., J.W. and Z.D.; writing—original draft preparation, E.A.A.A.-Z., A.A.A.-H., J.W., Z.D. and M.A.E.; writing—review and editing, M.A.E., A.A.A.-H. and Y.H. (Yingdui He); visualization, M.A.E. and A.M.G.; supervision, M.A.E.; project administration Y.H. (Yongyong Hui). All authors have read and agreed to the published version of the manuscript.

Funding

The authors are grateful to Senior Foreign Expert Project of China (Grant number G2021034008L), Central Public-interest Scientific Institution Basal Research Fund (NO. 1630092022001) and Discipline and Master’s Site Construction Project of Guiyang University by Guiyang City Financial Support Guiyang University(2022-x110). The authors are grateful to Princess Nourah bint Abdulrahman University Researchers Supporting Project number (PNURSP2022R93, Princess Nourah bint Abdulrahman University, Riyadh, Saudi Arabia) for the financial support given to this research.

Institutional Review Board Statement

Not applicable.

Informed Consent Statement

Not applicable.

Conflicts of Interest

The authors declare no conflict of interest.

References

  1. Kim, Y.; Lounds-Singleton, A.J.; Talcott, S.T. Antioxidant phytochemical and quality changes associated with hot water immersion treatment of mangoes (Mangifera indica L.). Food Chem. 2009, 115, 989–993. [Google Scholar] [CrossRef]
  2. FAOSTAT. FAO Statistical Databases Agriculture. 2020. Available online: http://faostat.fao.org (accessed on 1 January 2021).
  3. Elsheshetawy, H.E.; Mossad, A.; Elhelew, W.K.; Farina, V. Comparative study on the quality characteristics of some Egyptian mango cultivars used for food processing. Ann. Agric. Sci. 2016, 61, 49–56. [Google Scholar] [CrossRef] [Green Version]
  4. Palafox-Carlos, H.; Yahia, E.; Islas-Osuna, M.A.; Gutierrez-Martinez, P.; Robles-Sánchez, M.; González-Aguilar, G.A. Effect of ripeness stage of mango fruit (Mangifera indica L., cv. Ataulfo) on physiological parameters and antioxidant activity. Sci. Hortic. 2012, 135, 7–13. [Google Scholar] [CrossRef]
  5. Bolland, M.D.A.; Baker, M.J. Powdered granite is not an effective fertilizer for clover and wheat in sandy soils from Western Australia. Nutr. Cycl. Agroecosys. 2000, 56, 59–68. [Google Scholar] [CrossRef]
  6. Ciceri, D.; Close, T.C.; Barker, A.V.; Allanore, A. Fertilizing properties of potassium feldspar altered hydrothermally. Comm. Soil Sci. Plant Anal. 2019, 50, 482–491. [Google Scholar] [CrossRef]
  7. Marschner, H. Mineral Nutrition of Higher Plants; Academic Press: New York, NY, USA, 1997. [Google Scholar]
  8. Stino, R.G.; Abd El-Wahab, S.M.; Habashy, S.A.; Kelani, R.A. Productivity and fruit quality of three mango cultivars in relation to foliar sprays of calcium, zinc, boron or potassium. J. Hortic. Sci. Ornam. Plants 2011, 3, 91–98. [Google Scholar]
  9. Almeida, E.V.; Fernandes, D.; Caione, G.; Prado, R.M.; Boliani, A.C.; Corrêa, L.S. Liming in growing mango cultivar Keitt in production. Comm. Soil Sci. Plant Anal. 2015, 46, 430–438. [Google Scholar] [CrossRef]
  10. Bell, M.J.; Ransom, M.D.; Thompson, M.L.; Hinsinger, P.; Florence, A.M.; Moody, P.W.; Guppy, C.N. Considering Soil Potassium Pools with Dissimilar Plant Availability. In Improving Potassium Recommendations for Agricultural Crops; Murrell, T.S., Mikkelsen, R.L., Sulewski, G., Norton, R., Thompson, M.L., Eds.; Springer: Cham, Switzerland, 2021. [Google Scholar] [CrossRef]
  11. White, P.J.; Bell, M.J.; Djalovic, I.; Hinsinger, P.; Rengel, Z. Potassium Use Efficiency of Plants. In Improving Potassium Recommendations for Agricultural Crops; Murrell, T.S., Mikkelsen, R.L., Sulewski, G., Norton, R., Thompson, M.L., Eds.; Springer: Cham, Switzerland, 2021. [Google Scholar] [CrossRef]
  12. Manning, D.A. Mineral Sources of Potassium for Plant Nutrition. In Sustainable Agriculture; Springer: Dordrecht, The Netherlands, 2011; Volume 2, pp. 187–203. [Google Scholar] [CrossRef] [Green Version]
  13. Taha, R.A.; Hassan, H.A.; Shaaban, E.A. Effect of different potassium fertilizer forms on yield, fruit quality and leaf mineral content of Zebda mango trees. Middle-East J. Sci. Res. 2014, 21, 123–129. [Google Scholar]
  14. Basak, B.B. Waste mica as alternative source of plant-available potassium: Evaluation of agronomic potential through chemical and biological methods. Nat. Resour. Res. 2019, 28, 953–965. [Google Scholar] [CrossRef]
  15. Basak, B.B.; Maity, A.; Ray, P.; Biswas, D.R.; Roy, S. Potassium supply in agriculture through biological potassium fertilizer: A promising and sustainable option for developing countries. Arch. Agron. Soil Sci. 2020, 68, 101–114. [Google Scholar] [CrossRef]
  16. Meena, V.S.; Maurya, B.R.; Verma, J.P.; Meena, R.S. Potassium Solubilizing Microorganisms for Sustainable Sgriculture; Springer: Uttar Pradesh, India, 2016. [Google Scholar]
  17. Youssef, M.A.; Eissa, M.A. Comparison between organic and inorganic nutrition for tomato. J. Plant Nutr. 2017, 40, 1900–1907. [Google Scholar] [CrossRef]
  18. Toumi, M.; Nedjimi, B.; Halitim, A.; Garcia, M. Effects of K-Mg ratio on growth and cation nutrition of Vitis vinifera L. cv.“Dattier de Beiruth” grafted on SO4 rootstock. J. Plant Nutr. 2016, 39, 904–911. [Google Scholar] [CrossRef]
  19. Eissa, M.A.; Ghoneim, M.F.; El-Gharably, G.A.; El-Razek, M.A. Phytoextraction of nickel, lead and cadmium from metals contaminated soils using different field crops and EDTA. World Appl. Sci. J. 2014, 32, 1045–1052. [Google Scholar]
  20. Narula, N.; Saharan, B.S.; Kumar, V.; Bhatia, R.; Bishnoi, L.K.; Lather, B.P.; Lakshminarayana, K. Impact of the use of biofertilizers on cotton (Gossypium hirsutum) crop under irrigated agro-ecosystem. Arch. Agron. Soil Sci. 2005, 51, 69–77. [Google Scholar] [CrossRef]
  21. Zhang, A.M.; Zhao, G.Y.; Gao, T.G.; Wang, W.; Li, J.; Zhang, S.F.; Zhu, B.C. Solubilization of insoluble potassium and phosphate by Paenibacillus kribensis CX-7, A soil microorganism with biological control potential. Afr. J. Microbiol. Res. 2013, 7, 41–47. [Google Scholar] [CrossRef]
  22. Xiao, Y.; Wang, X.; Chen, W.; Huang, Q. Isolation and identification of three potassium-solubilizing bacteria from rape rhizospheric soil and their effects on ryegrass. Geomicrobiol. J. 2017, 34, 873–880. [Google Scholar] [CrossRef]
  23. Singh, M.; Biswas, S.K.; Nagar, D.; Lal, K.; Singh, J. Impact of bio-fertilizer on growth parameters and yield of potato. Int. J. Curr. Microbiol. Appl. Sci. 2017, 6, 1717–1724. [Google Scholar] [CrossRef]
  24. Food and Agriculture Organization. Guidelines for Soil Description, 4th ed.; Viale delle Terme di Caracalla: Rome, Italy, 2006.
  25. Burt, R. Soil Survey Laboratory Methods Manual; Soil survey investigations report no. 42, version 4.0; Natural Resources Conservation Service, US Department of Agriculture: Washington, DC, USA, 2004.
  26. Tabatabai, M.A. Soil enzymes. In Methods of Soil Analysis, Part 2, 2nd ed.; Page, A.L., Miller, R.H., Keeney, D.R., Eds.; Agronomy 9; American Society of Agronomy: Madison, WI, USA, 1983; pp. 903–947. [Google Scholar]
  27. Yao, T.; Zhang, W.; Gulaqa, A.; Cui, Y.; Zhou, Y.; Weng, W.; Wang, X.; Liu, Q.; Jin, F. Effects of peanut shell biochar on soil nutrients, soil enzyme activity, and rice yield in heavily saline-sodic paddy field. J. Soil Sci. Plant Nutr. 2021, 21, 655–664. [Google Scholar] [CrossRef]
  28. Serra-Wittling, C.; Houot, S.; Barriuso, E. Soil enzymatic response to addition of municipal solid-waste compost. Biol. Fertil. Soils 1995, 20, 226–236. [Google Scholar] [CrossRef]
  29. Houba, V.J.; Novozamsky, I.; Lexmond, T.M.; Van der Lee, J.J. Applicability of 0.01 M CaCl2 as a single extraction solution for the assessment of the nutrient status of soils and other diagnostic purposes. Commun. Soil Sci. Plant Anal. 1990, 21, 2281–2290. [Google Scholar] [CrossRef]
  30. Hosseinpur, A.R.; Motaghian, H.R. Application of kinetic models in describing soil potassium release characteristics and their correlations with potassium extracted by chemical methods. Pedosphere 2013, 23, 482.e492. [Google Scholar] [CrossRef]
  31. Fatemi, A. Kinetics of soil potassium release under long-term imbalanced fertilization in calcareous soils. Pedosphere 2017, 27, 1105–1115. [Google Scholar] [CrossRef]
  32. Havlin, J.L.; Westfall, D.G. Potassium release kinetics and plant response in calcareous soils. Soil Sci. Soc. Am. J. 1985, 49, 366–370. [Google Scholar] [CrossRef]
  33. Abd El-Rahman, M. Relation of spraying silicon with fruiting of Keitt Mango trees growing under upper Egypt conditions. Stem Cell 2015, 6, 1–5. [Google Scholar]
  34. Faria, L.N.; Donato, S.L.; Santos, M.R.D.; Castro, L.G. Nutrient contents in ‘Tommy Atkins’mango leaves at flowering and fruiting stages. Eng. Agríc. 2016, 36, 1073–1085. [Google Scholar] [CrossRef] [Green Version]
  35. Helaly, M.N.; El-Hoseiny, H.; El-Sheery, N.I.; Rastogi, A.; Kalaji, H.M. Regulation and physiological role of silicon in alleviating drought stress of mango. Plant Physiol. Biochem. 2017, 118, 31–44. [Google Scholar] [CrossRef]
  36. Parkinson, J.A.; Allen, S.E. A wet oxidation procedure suitable for the determination of nitrogen and mineral nutrients in biological material. Comm. Soil Sci. Plant Anal. 1975, 6, 1–11. [Google Scholar] [CrossRef]
  37. Arnon, D.I. Copper enzymes in isolated chloroplasts. Polyphenol oxidase in Beta vulgaris. Plant Physiol. 1949, 24, 1–15. [Google Scholar] [CrossRef] [Green Version]
  38. Association of Official Analytical Chemists. Official Methods of Analysis, 21st ed.; Hurwitz, W., Ed.; Association of Official Analytical Chemists: Gaithersburg, MD, USA, 2019. [Google Scholar]
  39. Plata, L.G.; Ramos, C.G.; Oliveira, M.L.; Oliveira, L.F. Release kinetics of multi-nutrients from volcanic rock mining by-products: Evidences for their use as a soil remineralizer. J. Clean. Prod. 2021, 279, 123668. [Google Scholar] [CrossRef]
  40. Friedrich, S.; Platonova, N.P.; Karavaiko, G.I.; Stichel, E.; Glombitza, F. Chemical and microbiological solubilization of silicates. Acta Biotechnol. 1991, 11, 187–196. [Google Scholar] [CrossRef]
  41. Hu, T.; Gu, J.; Zhen, L.; Lv, R.; Chang, F.; Feng, A.J. Influences of potassium solubilizing bacteria and K-feldspar on enzyme activities and metabolic activities of the bacterial communities in kiwifruit planting soil. J. Gen. Appl. Microbiol. 2021, 67, 106–113. [Google Scholar] [CrossRef] [PubMed]
  42. Al-Sayed, H.M.; Hegab, S.A.; Youssef, M.A.; Khalafalla, M.Y.; Almaroai, Y.A.; Ding, Z.; Eissa, M.A. Evaluation of quality and growth of roselle (Hibiscus sabdariffa L.) as affected by bio-fertilizers. J. Plant Nutr. 2020, 43, 1025–1035. [Google Scholar] [CrossRef]
  43. Chen, Y.; Ye, J.; Kong, Q. Potassium-solubilizing activity of Bacillus aryabhattai SK1-7 and its growth-promoting effect on Populus alba L. Forests 2020, 11, 1348. [Google Scholar] [CrossRef]
  44. Buragohain, S.; Nath, D.J.; Devi, Y.B.; Bhattacharyya, B.; Dutta, S. Molecular characterization of potassium solubilizing bacteria from crop rhizosphere of the North Eastern Region of India. Curr. Sci. 2018, 114, 2543–2548. [Google Scholar] [CrossRef]
  45. Majeed, A.; Muhammad, Z.; Ahmad, H. Plant growth promoting bacteria: Role in soil improvement, abiotic and biotic stress management of crops. Plant Cell Rep. 2018, 37, 1599–1609. [Google Scholar] [CrossRef] [PubMed]
  46. Etesami, H. Can interaction between silicon and plant growth promoting rhizobacteria benefit in alleviating abiotic and biotic stresses in crop plants? Agric. Ecosyst. Environ. 2018, 253, 98–112. [Google Scholar] [CrossRef]
  47. Yi, L.P.; Ma, J.; Li, Y. Distribution of soil nutrient concentration in the rhizosphere system of desert halophytes under two soil conditions. J. Des. Res. 2008, 28, 443–448. [Google Scholar]
  48. Eissa, M.A.; Ahmed, E.M.; Reichman, S.M. Production of the forage halophyte Atriplex amnicola in metal-contaminated soils. Soil Use Manag. 2016, 32, 350–356. [Google Scholar] [CrossRef]
  49. Song, Y.Y.; Song, C.C.; Shi, F.X.; Wang, M.Q.; Ren, J.S.; Wang, X.W.; Jiang, L. Linking plant community composition with the soil C pool, N availability and enzyme activity in boreal peatlands of Northeast China. Appl. Soil Ecol. 2019, 140, 144–154. [Google Scholar] [CrossRef]
  50. Banerjee, D.; Das, S.; Molina, S.A.; Madgwick, D.; Katz, M.; Jena, S.; Bossmann, L.K.; Pal, D.; Takemoto, D.J. Investigation of the reciprocal relationship between the expression of two gap junction connexin proteins, connexin46 and connexin43. J. Biol. Chem. 2011, 286, 24519–24533. [Google Scholar] [CrossRef] [PubMed] [Green Version]
  51. Asaduzzaman, M.; Asao, T. Improvement of Quality in Fruits and Vegetables through Hydroponic Nutrient Management; BoD–Books on Demand: Norderstedt, Germany, 2019. [Google Scholar] [CrossRef] [Green Version]
  52. Troufflard, S.; Mullen, W.; Larson, T.R.; Graham, I.A.; Crozier, A.; Amtmann, A.; Armengaud, P. Potassium deficiency induced the biosynthesis of oxylipins and glucosinolates in Arabiodopsis thaliana. BMC Plant Biol. 2010, 10, 172. [Google Scholar] [CrossRef] [PubMed] [Green Version]
  53. Abd El-Hakeem, S.S.; Fekry, W.A. Effect of K-feldspar, potassium sulphate and silicate dissolving bacteria on growth, yield and quality of sweet potato plants. Zagazig J. Agric. Res. 2014, 41, 467–477. [Google Scholar]
  54. Youssef, G.H.; Seddik, W.M.; Osman, M.A. Efficiency of natural minerals in presence of different nitrogen forms and potassium dissolving bacteria on peanut and sesame yields. J. Am. Sci. 2010, 6, 647–660. [Google Scholar]
  55. Meena, V.S.; Maurya, B.R.; Bahadur, I. Potassium solubilization by bacterial strain in waste mica. Bangladesh J. Bot. 2014, 43, 235–237. [Google Scholar] [CrossRef] [Green Version]
  56. Narayan, O.P.; Kumar, P.; Yadav, B.; Dua, M.; Johri, A.K. Sulfur nutrition and its role in plant growth and development. Plant Signal. Behav. 2022, 2030082. [Google Scholar] [CrossRef]
  57. Eissa, M.A. Effect of sugarcane vinasse and EDTA on cadmium phytoextraction by two saltbush plants. Environ. Sci. Pollut. Res. 2016, 23, 10247–10254. [Google Scholar] [CrossRef]
  58. Merwad, A. Efficiency of K-sulphate and K-feldspar combined with silicate dissolving bacteria on yield and nutrient uptake by maize plants. Egypt. J. Soil Sci. 2016, 56, 249–259. [Google Scholar]
  59. Ali, M.M.E.; Petropoulos, S.A.; Selim, D.A.F.H.; Elbagory, M.; Othman, M.M.; Omara, A.E.-D.; Mohamed, M.H. Plant growth, yield and quality of potato crop in relation to potassium fertilization. Agronomy 2021, 11, 675. [Google Scholar] [CrossRef]
Figure 1. Map showing location of the experimental site.
Sustainability 14 09766 g001
Figure 2. Effect of KSB and K source on soil quality. (A): soil organic carbon, (B): soil pH, (C): activity of dehydrogenase enzyme, and (D): activity of alkaline phosphatase enzyme. 100-Sul = fertilized only with K2SO4, 75-Sul:25-Fel = 75% of K dose from K2SO4 + 25% from K-feldspar, 50-Sul:50-Fel = 50% of K dose from K2SO4 + 50% from K-feldspar, 25-Sul:75-Fel = 25% of K dose from K2SO4 + 75% from K-feldspar, 100-Fel = fertilized only with K-feldspar, and C = control without fertilization. Means denoted by different letters are significantly different according to Duncan’s test at p < 0.05. Values are means ± standard error, n = 5.
Sustainability 14 09766 g002
Figure 3. Effect of KSB and K source on nitrogen (N), phosphorus (P), and potassium (K) availability in the studied soil. (A): available N, (B): available P, and (C): available K. 100-Sul = fertilized only with K2SO4, 75-Sul:25-Fel = 75% of K dose from K2SO4 + 25% from K-feldspar, 50-Sul:50-Fel = 50% of K dose from K2SO4 + 50% from K-feldspar, 25-Sul:75-Fel = 25% of K dose from K2SO4 + 75% from K-feldspar, 100-Fel = fertilized only with K-feldspar, and C = control without fertilization. Means denoted by different letters are significantly different according to Duncan’s test at p < 0.05. The values are means ± standard error, n = 5.
Sustainability 14 09766 g003
Figure 4. Effect of KSB and K source on fruit yield of mango (t ha−1) in (A): 2018, (B): 2019, and (C): 2020 growing seasons. 100-Sul = fertilized only with K2SO4, 75-Sul:25-Fel = 75% of K dose from K2SO4 + 25% from K-feldspar, 50-Sul:50-Fel = 50% of K dose from K2SO4 + 50% from K-feldspar, 25-Sul:75-Fel = 25% of K dose from K2SO4 + 75% from K-feldspar, 100-Fel = fertilized only with K-feldspar, and C = control without fertilization. Means denoted by different letters are significantly different according to Duncan’s test at p < 0.05. The values are means ± standard error, n = 5.
Sustainability 14 09766 g004aSustainability 14 09766 g004b
Figure 5. Principal component analysis (PCA) showing relationship among fruit yield, K release (KR), availability of potassium (K), nitrogen (N), and phosphorus (P), soil organic carbon (SOC), the activity of dehydrogenase (DHE) and phosphatase enzymes (PHOSP), and the soil pH.
Sustainability 14 09766 g005
Table 1. Some physical and chemical properties of the studied soil in the beginning of the experiment.
Properties (Units)Value
Sand (0.05 to 2.0 mm, g kg−1)900 ± 22
Silt (0.002 to 0.05 mm, g kg−1)80 ± 7
Clay (<0.002 mm, g kg−1)20 ± 2
TextureSandy
CaCO3 (g kg−1)200 ± 6
pH (1:2)8.00 ± 0.08
ECe (dS m−1)1.5 ± 0.0
Organic Carbon (g kg−1)4.5 ± 0.1
Total N (mg kg−1)200 ± 7
Available N (mg kg−1)30 ± 2
Available P (Olsen) (mg kg−1)6.0 ± 0.0
Available K (mg kg−1)130 ± 6
Total K (mg kg−1)650 ± 12
Each value represents a mean ± standard error (SE) of three replicates.
Table 2. Effect of KSB and K source on the parameters of kinetics function, coefficients of determination (R2), and standard errors of the estimates (SEE). Letters a and b refer to a and b is the intercept and slope of the curve, respectively.
InculationTreamentsa
(mg kg1)
b
(mg kg1 day1)
SEER2
Inoculated with KSB100-Sul25 ± 3 a0.64 ± 0.02 a2.420.89
75-Sul:25-Fel20 ± 2 b0.50 ± 0.01 b1.520.96
50-Sul:50-Fel19 ± 1 b0.45 ± 0.02 bc1.180.94
25-Sul:75-Fel20 ± 2 b0.35 ± 0.03 d2.550.93
100-Fel19 ± 2 b0.37 ± 0.03 d2.620.95
C14 ± 2 c0.22 ± 0.01 e2.380.88
Without inoculation100-Sul24 ± 1 a0.53 ± 0.04 b1.020.89
75-Sul:25-Fel21 ± 2 b0.47 ± 0.02 b1.510.93
50-Sul:50-Fel18 ± 2 c0.40 ± 0.01 cd1.600.94
25-Sul:75-Fel21 ± 2 b0.33 ± 0.05 d2.570.90
100-Fel20 ± 1 b0.30 ± 0.05 d2.120.95
C13 ± 1 c0.18 ± 0.01 e1.150.87
100-Sul = fertilized only with K2SO4, 75-Sul:25-Fel = 75% of K dose from K2SO4 + 25% from K-feldspar, 50-Sul:50-Fel = 50% of K dose from K2SO4 + 50% from K-feldspar, 25-Sul:75-Fel = 25% of K dose from K2SO4 + 75% from K-feldspar, 100-Fel = fertilized only with K-feldspar, and C = control without fertilization. Means denoted by different letters are significantly different according to Duncan’s test at p < 0.05. The values are means ± standard error, n = 5.
Table 3. Effect of KSB and K source on N, P, and K concentrations (g kg−1) in mango leaves.
InculationTreamentsNPK
Inoculated with KSB100-Sul22.2 ± 2.1 c4.6 ± 0.0 ab35.8 ± 2.1 c
75-Sul:25-Fel22.0 ± 2.0 c5.0 ± 0.0 a42.6 ± 2.5 b
50-Sul:50-Fel31.5 ± 2.1 a5.2 ± 0.3 a55.2 ± 2.6 a
25-Sul:75-Fel25.1 ± 3.0 b5.0 ± 0.2 a47.2 ± 3.2 b
100-Fel18.2 ± 2.0 d4.7 ± 0.1 b28.0 ± 2.1 d
C17.2 ± 1.2 d3.5 ± 0.0 bc28.0 ± 2.1 cd
Without inoculation100-Sul21.0 ± 2.7 c4.5 ± 0.1 b33.8 ± 2.0 c
75-Sul:25-Fel22.0 ± 2.3 c4.6 ± 0.2 b40.6 ± 3.5 b
50-Sul:50-Fel30.5 ± 2.5 a4.7 ± 0.2 b42.2 ± 3.6 b
25-Sul:75-Fel25.0 ± 3.4 b4.8 ± 0.3 b40.2 ± 3.5 b
100-Fel17.1 ± 1.8 d4.4 ± 0.3 b27.0 ± 2.3 d
C15.2 ± 1.6 e3.2 ± 0.0 c25.0 ± 1.8
100-Sul = fertilized only with K2SO4, 75-Sul:25-Fel = 75% of K dose from K2SO4 + 25% from K-feldspar, 50-Sul:50-Fel = 50% of K dose from K2SO4 + 50% from K-feldspar, 25-Sul:75-Fel = 25% of K dose from K2SO4 + 75% from K-feldspar, 100-Fel = fertilized only with K-feldspar, and C = control without fertilization. Means denoted by different letters are significantly different according to Duncan’s test at p < 0.05. The values are means ± standard error, n = 5.
Table 4. Effect of KSB and K source on the growth of mango plants.
InculationTreamentsShoot Length
mm
No. of Leaves
/Shoot
Leaf Area
mm2
Chlorophyll-a
mg g−1
Chlorophyll-b mg g−1
Inoculated with KSB100-Sul850 ± 33 a38 ± 2 a8600 ± 800 a2.44 ± 0.05 a1.42 ± 0.08 a
75-Sul:25-Fel860 ± 25 a37 ± 2 a8500 ± 700 a2.34 ± 0.04 b1.39 ± 0.09 a
50-Sul:50-Fel830 ± 40 a36 ± 3 a8500 ± 800 a2.28 ± 0.07 c1.18 ± 0.07 c
25-Sul:75-Fel770 ± 42 b33 ± 2 b8000 ± 700 b2.17 ± 0.04 d1.20 ± 0.08 c
100-Fel650 ± 33 c33 ± 2 b8100 ± 600 b2.06 ± 0.08 d1.09 ± 0.09 d
C540 ± 42 d31 ± 2 b7500 ± 700 c2.00 ± 0.07 e0.89 ± 0.09 e
Without inoculation100-Sul720 ± 21 b35 ± 2 ab8400 ± 800 a2.36 ± 0.05 b1.38 ± 0.08 a
75-Sul:25-Fel760 ± 20 b36 ± 2 a8300 ± 800 ab2.27 ± 0.04 c1.29 ± 0.09 b
50-Sul:50-Fel780 ± 64 b32 ± 3 b8300 ± 1000 ab2.12 ± 0.07 d1.30 ± 0.07 b
25-Sul:75-Fel720 ± 53 b33 ± 3 b8000 ± 700 b2.07 ± 0.04 d1.08 ± 0.08 d
100-Fel620 ± 36 c27 ± 2 c7900 ± 600 b1.87 ± 0.08 f0.95 ± 0.09 e
C500 ± 42 d26 ± 2 c7100 ± 700 c1.85 ± 0.07 f0.75 ± 0.09 f
100-Sul = fertilized only with K2SO4, 75-Sul:25-Fel = 75% of K dose from K2SO4 + 25% from K-feldspar, 50-Sul:50-Fel = 50% of K dose from K2SO4 + 50% from K-feldspar, 25-Sul:75-Fel = 25% of K dose from K2SO4 + 75% from K-feldspar, 100-Fel = fertilized only with K-feldspar, and C = control without fertilization. Means denoted by different letters are significantly different according to Duncan’s test at p < 0.05. The values are means ± standard error, n = 5.
Table 5. The influence of KSB and K sources on fruit quality.
InculationTreamentsTotal Soluble Solids (%)Total Sugar
(%)
Vitamin C
mg kg−1
Total Fibre
(%)
Pulp (%)
Inoculated with KSB100-Sul16 ± 2 a14 ± 2 a460 ± 15 ab0.75 ± 0.03 d78 ± 9 a
75-Sul:25-Fel16 ± 2 a14 ± 2 a470 ± 10 a0.72 ± 0.01 d75 ± 8 b
50-Sul:50-Fel15 ± 2 ab13 ± 2 ab450 ± 13 b0.73 ± 0.02 d75 ± 6 b
25-Sul:75-Fel13 ± 1 bc10 ± 1 c440 ± 15 cd0.75 ± 0.04 d72 ± 9 c
100-Fel14 ± 1 b10 ± 1 c400 ± 16 e0.70 ± 0.04 d73 ± 8 c
C12 ± 1 c10 ± 1 c350 ± 12 g1.00 ± 0.02 a65 ± 5 e
Without inoculation100-Sul15 ± 1 ab13 ± 1 ab430 ± 12 cd0.76 ± 0.01 d73 ± 5 c
75-Sul:25-Fel14 ± 1 b12 ± 1 b400 ± 10 e0.82 ± 0.03 c73 ± 7 c
50-Sul:50-Fel14 ± 1 b12 ± 1 b430 ± 13 cd0.83 ± 0.03 c70 ± 8 d
25-Sul:75-Fel12 ± 1 c10 ± 1 c400 ± 13 e0.86 ± 0.02 c71 ± 7 cd
100-Fel12 ± 1 c10 ± 1 c370 ± 12 f0.90 ± 0.01 b71 ± 9 cd
C12 ± 1 c10 ± 1 c320 ± 14 h1.08 ± 0.02 a62 ± 5 f
100-Sul = fertilized only with K2SO4, 75-Sul:25-Fel = 75% of K dose from K2SO4 + 25% from K-feldspar, 50-Sul:50-Fel = 50% of K dose from K2SO4 + 50% from K-feldspar, 25-Sul:75-Fel = 25% of K dose from K2SO4 + 75% from K-feldspar, 100-Fel = fertilized only with K-feldspar, and C = control without fertilization. Means denoted by different letters are significantly different according to Duncan’s test at p < 0.05. The values are means ± standard error, n = 5.
Publisher’s Note: MDPI stays neutral with regard to jurisdictional claims in published maps and institutional affiliations.

