Article

Modeling and Performance Analysis for High-Rise Building Using ArchiCAD: Initiatives towards Energy-Efficient Building

by
Siti Birkha Mohd Ali
1,2,3,
Amirhossein Mehdipoor
4,
Noora Samsina Johari
3,
Md. Hasanuzzaman
1,* and
Nasrudin Abd Rahim
1
1
Higher Institution Centre of Excellence (HICoE), UM Power Energy Dedicated Advanced Centre (UMPEDAC), Level 4, Wisma R&D, University of Malaya, Jalan Pantai Baharu, Kuala Lumpur 59990, Malaysia
2
Institute of Advanced Studies, University of Malaya, Kuala Lumpur 50603, Malaysia
3
Faculty of Engineering and Life Sciences, Universiti Selangor, Bestari Jaya 45600, Selangor, Malaysia
4
Ecole de Technologie Superieure ETS, 1100 Notre-Dame St W, Montreal, QC H3C1K3, Canada
*
Author to whom correspondence should be addressed.
Sustainability 2022, 14(15), 9780; https://doi.org/10.3390/su14159780
Submission received: 17 June 2022 / Revised: 5 July 2022 / Accepted: 8 July 2022 / Published: 8 August 2022
(This article belongs to the Special Issue Energy Technology and Sustainable Energy Systems)

Abstract

:
An energy-efficient building is not built in a day. It requires effective processes, approaches, and tools, as well as high commitment from all the involved parties. A similar requirement is needed for effective retrofitting practice. Building Information Modelling (BIM) is one of the sensible processes in ensuring either the new building development or retrofitting initiatives arrive at its ultimate objectives, i.e., reduction in energy consumption, energy cost, and removal of harmful emissions. Many studies had proved that a window is one of the building elements that could contribute to establishing an energy-efficient building. Therefore, a 25-floor Wisma R&D, University of Malaya building was modeled using ArchiCAD to analyse the influences of window glazing, opaque materials, and shading elements on overall building energy performances. The accuracy of the model and simulation outcome was initially compared with the energy audit result conducted from March to May 2017. Consequently, this study revealed that the effective combinations of the window parameters had assisted in improving the infiltration rate and heat transfer coefficient which allowed a lower cooling load within 3% to 6%, respectively. After most, minimum savings of 18,133.9 kWh, RM 6618.88, and 1265.16 kg of carbon dioxide (CO2) were gained through a reduction of cooling load in Wisma R&D based on the window system improvement. This article aims to promote the capability of ArchiCAD as a practical tool for effective retrofitting decision-making. Ultimately, this study revealed the importance of a multivariate framework in building energy conservation and provide an insight into the improvement of the Malaysia Standard MS1525:2019, mainly for high-rise buildings in Malaysia.

1. Introduction

The crucial need to design and establish energy-efficient buildings is based on the world statistical report released on global warming and greenhouse gas (GHG) emissions. Statistically, buildings globally were responsible for about 32% of final energy consumption, 55% of global electricity demand [1], and emission of 19% of energy-related greenhouse gases in 2010 [2], and this amount is rising every year. One prospective solution to this is ‘green building’ which aims to provide an environmentally sustainable building in design, construction, and maintenance [3,4]. As a result of this alarming fact, countries such as the United States of America (USA), China, Canada, India, and Brazil are among the top five countries ranked in Leadership in Energy and Environmental Design (LEED) as countries making significant strides in sustainable, construction and market transformation [5]. In addition, the Australian government through its Australian National Construction Code establishes energy-saving guidelines and regulations that should be followed by first-class buildings [6].
Malaysia is also among the countries taking measures [7] on this matter. Green Building Index or GBI is one of the main guidelines introduced in February 2009 to accommodate the current and future construction industry needs, which involve professionals like architects, engineers, and surveyors [8,9]. On top of GBI, Malaysia Standard (MS 1525) is referred to as the code of practice in designing an energy-efficient building or a guideline used to retrofit an existing building effectively. However, these guidelines consist of numerous building parameters which are not easily assessed, unless a more effective approach could potentially link them. For instance, according to [10], BIM tools are capable to evaluate building performances based on GBI criteria which potentially provide a significant impact on the building design assessment. Consequently, further findings have proven that 51 out of 100 credits specified in GBI measures could be evaluated using the BIM tools. [10]. In short, the Malaysian government has addressed the importance of sustainable building through numerous policies and encourages participation from all building professionals and relevant parties. Nevertheless, room for improvement is still available to meet the objective of being a low-carbon country by 2050. Hence, BIM is a way forward in materializing this objective and one of the ways is through ArchiCAD software.
The existence of BIM tools allows future newly-constructed buildings to be designed toward sustainability, in other words, energy-efficiency. However, the demand for retrofitting the existing inefficient buildings requires serious attention. According to [3,11], retrofitting existing buildings is a realistic method due to the lack of new green building development and the fact that the bulk of existing structures will still be in use for the next 50–100 years due to its long lifespan nature [4]. Retrofitting initiatives assists in reducing energy use, reducing the utility cost, lowering the maintenance costs, and reducing the environmental impact and waste reduction, which leads to productivity improvement as well as improves the levels of indoor air quality and comfort along with enhancing the sustainability of existing facilities [3,11,12,13,14]. On the other aspect, [3] emphasizes that the recent growth of the new green building constructions is inadequate to overcome the negative impact of the existing building operation. Furthermore, as Malaysia has the goal of meeting the carbon reduction of 45% by 2030 and becoming a low carbon country by 2050, an effective retrofitting measure needs to be established without delay. Statistically, only 2% of the total buildings in Malaysia are energy efficient or Low Energy Office (LEO) [15,16]. The above scenario is mentioned by the authors of [17] as well. In general, their studies have shown that the existing public buildings in Malaysia that have undergone modification or retrofitted as per the standard codes are very few. Due to this, the motivation for conducting this research arose. Specifically, the outcome of this study is beneficial for assisting the policy maker and the building professionals in effective retrofitting mainly for the high-rise building in Malaysia. For instance, instead of replacing a single glazing material with the double-glazing type, an effective combination between the glazing, opaque, and shading could provide a better implication for building energy conservation. Moreover, this study promotes the multivariate framework that should be inculcated in any building development and retrofitting process.
Due to the need of tackling the negative impact of the existing building in Malaysia, Wisma R&D, University of Malaya is chosen as the sample building due to its low load factor performance found in the earlier study [18]. In addition, as the building is categorised as an old building (more than 30 years of design), the sample chosen is practically representing the high number of old buildings in Malaysia. The building properties, such as walls, slabs, roofs, and floors, are the common materials used for buildings in the older years. As the complete walk-through energy audit had been conducted in 2017 [19], the building model and simulation analysis from this study are initially justified for the accuracy of the outcome. To arrive at effective retrofit activities, a detailed analysis beyond LF performance and EA should be carried out. Due to this, the Energy Performance Evaluation was performed through the virtual building model which considers numerous factors of building parameters. Through this multivariate model, an in-depth analysis could be performed before recommending the best retrofitting initiatives, particularly for Wisma R&D.
In general, this study focuses on building performances based on fourteen different window parameter combinations. In specific, the outcome of the study allowed the building owners to grasp the idea of the effect of window performance on the infiltration rate and heat transfer coefficient, which directly affect the cooling load requirement in one building. Finally, the reduction of the cooling load has allowed the reduction of energy, cost, and CO2 value. However, this study excludes the Return of Investment (ROI) analysis of replacing the existing window with the better one. Even though the result from this study could provide towards the betterment of the Malaysia Standard MS1525:2019, the related policies and MS1525 guideline implications are disregarded in this paper.

2. Literature Review

Energy is a lifeline and crucial element for the social, economic, and sustainable development of various countries [20], including Malaysia. However, inefficient energy conservation in the various sectors is known to be consistently contributing to the increment of the energy need. In addition, the acceleration of the energy demand is significantly influenced by per capita Gross Domestic Product [21]. Due to this, Malaysia, which is currently highly dependent on the conventional type of power generation, has no choice but to increase the volume of its power generation to accommodate with the growing energy need. However, two major global issues, global warming and depletion of fossil fuel resources, have become the major concern and motivating factor to evolve efficient energy solutions. Thus, with these alarming facts, Efficient Utilization of Energy, which is one of the underlying principles highlighted in the National Energy Policy [22] required a strategic plan and implementation. On top of the initiative outlined on the power generation, it is crucial to look at a different perspective which involves various green-based approach activities like green vehicles and efficient energy conservation in the building. Building Information Modelling (BIM) and Artificial Neural Network (ANN) are some of the approaches that involved multivariate parameters which are very useful in efficient energy conservation [21,23,24]. Due to their numerous benefits, they are state-of-the-art within the building sectors and well known by building professionals. Particularly on BIM implementation, software like ArchiCAD is required as a tool for visualizing the reference building. This approach could be beneficial to both the new building design as well retrofitting the existing one. In achieving the ultimate objective of sustainable development from the standpoint of a building, various contributing factors, such as building envelopes, weather, orientation, operating hours, occupancy, internal temperature, and many others, should be inculcated in any building energy conservation studies. In short, the multivariate building model is essential in any energy-efficient building design or retrofitting initiative. As this study used an old building as its reference, the existing non-design and passive design factors are inculcated in the model and simulation process in finding the best-retrofitting initiatives to make it more efficient. This can only be done by utilizing sophisticated tools like ArchiCAD. The Energy Performance Evaluation is later simulated and analysed based on the virtual building model.

2.1. Retrofit at a Glance

Retrofit could occur to any part of a building, for instance, to one or more levels of a multilevel building or whole block [25]. A study claimed that the after effect uncovered that the measure of energy spared from retrofitting a building is near to the sum required to develop a similar size new non-residential building and operate it for a year. As a rule of thumb, an effective retrofitting measure should be established before a retrofitting work is executed, which includes introducing ‘greener’ building parameters as part of the retrofit measure. Thus, to make a more informed decision, identifying the significant contributors to reducing energy consumption in an existing building is the initial step. Due to this, any retrofit process should typically entail energy auditing as its first step [26]. While cost, time, and management support remain a challenge, a systematic, practical, and affordable retrofitting measure could assist the existing building owners to embark on the retrofitting need. One of the best ways is to conduct a virtual retrofitting simulation of the building after the formal energy audit processes. This will allow building owners to analyse the significant building parameters which should be considered in the retrofitting initiatives.
Various contributing factors had directly or indirectly contributed to high energy consumption in the building. According to [27], the energy consumption in buildings is influenced by many factors, i.e., divided mainly into energy forms, building types, and building’s energy behaviour influences. Later, under each main factor, it demonstrates complex sub-contributors, which form a greater complexity in identifying the building energy consumption. Therefore, a combination of approaches is deemed necessary to encompass many aspects that contribute to a building’s energy performance. The conventional approaches to building energy performance study have deployed the energy audit as one of the practical methods in analysing the amount of the energy consumption, zone or area that consumes much energy, the appliances/equipment install, and the behaviour of the occupants. Through this, the building owner can analyse the main contributors that contribute to the amount of the building’s energy consumption. Nevertheless, the effect of different energy forms that act as the electricity resource, the building material, building opening, and numerous other contributing factors cannot be analysed. Hence, a more sophisticated approach, such as a computational-based simulation, like ArchiCAD needs to contemplate. In other words, this study applies the concept of the multivariate model in analysing a building’s energy performance.

2.2. The Contributing Factors

Thus far, numerous studies [28] claimed that the HVAC system accounts for 87% of the total building energy consumption. Another study, [29], conveyed that in a typical mid-rise office building in Malaysia, air-conditioners utilized the most energy at 58%, followed by lighting (20%), office equipment (19%), and other (3%). The authors of [9] claimed that a large portion of building energy consumption is used in the heating and cooling of buildings, lighting, and to run equipment such as the refrigerator, clothes dryer, and office equipment make up another large portion. The authors of [30] claimed that office buildings are likely to have higher cooling demands in the future due to climate change. According to [16], the saving expected when retrofitting a building’s heating system in a more extreme climate is higher than in a mild climate country. Recently, IEA reported that the global energy demand from air conditioners is expected to triple by 2050. Thus, the growing use of air-conditioning (AC) in homes and offices worldwide will be one of the top drivers of global electricity demand over the next three decades [31]. The report from IEA is also supported by a study in China’s government building, which suggested that air-conditioning systems should be given particular attention when determining energy retrofit subsidies [32]. On top of the above, numerous pieces of research evidence stated the significant contribution of the heating and cooling elements towards building energy consumption. Therefore, any retrofitting initiatives of the existing buildings in Malaysia should focus on reducing the building cooling load effectively.
The outcome of the energy audit for this building has been presented earlier [19]. It was concluded that the air-conditioning is the biggest contributor to the total energy consumption for Wisma R&D. This finding hence supported numerous earlier researchers who highlighted the importance of reducing the internal heat gain and infiltration of a building which leads to a lower cooling load demand.
According to IEA, the building envelope and its components (external walls, roofs, windows, and many others) can be critical in determining how much energy is required internally and later affect the overall building energy performance due to its effect on the cooling and heating needs. The unsuitable material and design of the above components have a direct effect on higher cooling demand, especially for Malaysia. In addition, this has caused higher internal heat gain in the building. In overcoming this issue, one might install a higher capacity chiller specification or air-conditioning system. However, this is not a relevant, economical, and practical long-term solution for a building [33,34]. By properly managing and controlling the internal heat gain, optimisation of the energy consumption within a building could be achieved along with desirable occupant comfort. Besides the internal heat gain, the authors of [35] claimed that air infiltration rates have also impacted the building energy consumption to a larger or small degree depending on the tightness of the building enclosure, heating ventilation, and air conditioning system. Hence, this research will investigate how the glazing, opaque, and shading materials selection impacts the internal heat and air infiltration rates of one building. As a guideline, infiltration or Air Exchange Rate (ACH) [36] is used in determining the best combination of glazing, opaque, and shading material in this research. The infiltration or the Summer Air Exchange Rate (ACH) is a function of air-tightness for summer temperature which is outlined in ASHRAE 2001 [36]. In summary, the lower the infiltration value measure within a building, the tighter the enclosure is. This will lead to the reduction of cooling needs within the building, especially in hot and humid climate countries like Malaysia.
To analyse the effect of the window design parameters related to the internal heat gain and air infiltration rates within Malaysia’s buildings, in-depth analysis, and concrete judgement need to be attained. Based on [35], the relative importance of infiltration airflows has been increasing in the total building energy consumption due to the improvements in building insulation and window products. Several other studies had concluded that the energy loss due to infiltration was estimated between 6% to 9% of the total country’s budget. It is responsible for approximately 3% of the cooling load and even higher for the heating load in a building [37,38]. The infiltration is often related to the opening tightness, especially the windows. Due to this, it is important to identify the most suitable window design parameters that impact the infiltration rate and its cooling load before an effective retrofit initiative could be carried out.
Although numerous energy performance studies for Malaysia’s buildings were carried out via energy audits, Building Energy Index (BEI) analysis, GBI assessment analysis, and simulation-based approaches [10,39,40,41], there is, thus far, no inclusive study of window design that impacts the building cooling load for high-rise buildings in Malaysia. In addition, a complete 25-floor virtual building, which is almost similar to the Wisma R&D building, is modelled in this study. This allows high-level accuracy results from the simulation process.

2.3. Energy Performances Approaches

In general, the importance of accurate prediction of a building’s energy performance is crucial. Although theoretical and statistical analyses are commonly used to forecast building energy use [6] in the early years, simulation-based analysis is becoming more popular among the building practitioner and academia due to its precision. However, most conventional simulation-based studies on Malaysian buildings were limited to either part of a building or several zones [42,43]. These methods of carrying out the building energy performance study are often adopted due to their level of simplification and decreased simulation run-time [44], and due to the limitation of the building-energy simulation software. Due to this, the in-depth effect of numerous building parameters on energy consumption is not enclosed. Moreover, a basic simulation-based approach neglects the opportunity to glimpse the relationship between parameters in a building design. In addition, the economic and environmental effects are hardly seen to be inculcated in building simulation software. The limitations of the existing approaches, therefore, create the need for a more accurate building model and simulation tool.
Another drawback identified from the simplification of the building energy performance study during the retrofitting initiative is to exclude the basic building parameters such as the wall, roof, and slab details. Even though these parameters are impractical from a retrofitting point of view, the existing material identified through an energy audit or a drawing layout should be taken into account during the simulation-based analysis. Without those elements, the building energy performance study conducted is considered inaccurate.
This research focuses on analysing the impact of three window design parameters, glazing, opaque material, and shading types, that could impact the internal heat gain and the infiltration of the building from the viewpoint of a high-rise office building in Malaysia. This research emphasizes the aim of trio balancing as its best-performing design which inculcates the multivariate model through a complex virtual building. This includes efficient energy consumption, minimizing the electricity cost, and reducing carbon emission through a complex building simulation-based approach.
Understanding the trend of energy consumption is the first step toward optimizing the energy consumed by buildings [45]. Hence, an energy audit (EA) is one of the well-known approaches to defining the breakdown of the energy used in a building. EA, which is conducted before any retrofit project, could assist in better decision-making. Concurrently, as the final retrofitting decision should be made from the energy and cost-saving and the optimistic environmental impact estimation, analysis beyond a walk-through energy audit needs to be carried out. Additionally, the authors of [16] claimed that in ensuring a high success rate of the retrofitting project plan, a suitable implementation process and post-retrofit measurement and verification need to be in place.
Apart from the above information, the quantity, size, and material of the envelope (i.e., walls, windows, and doors) are identified during the audit process. These pieces of information are either obtained through the actual observation or from the building layout drawing. In this research, the building’s air-conditioning (AC) system is identified from both the interview session with the maintenance personnel and during the walk-through survey. Details of the air-conditioning units and the building system had been outlined in [19]. In summary, the total installed air-conditioning units in the building is 262,838.2 W. This had been compared with the amount of the total load in the 2018′s utility bill, which was 656,500 W. The walk-through energy audit conducted found that the air-conditioning load consists of 33% of the overall building consumption. Based on this percentage, the load from the air-conditioning system was calculated as 216,645 W. From these two references, the simulation-based approach has considered selecting 250,000 W as the input representing the existing cooling load for this building.

2.4. Building Information Modelling (BIM)

Nowadays, numerous software is used as a tool in conducting energy performance studies. This is in line with the technological approaches called Building Information Modelling (BIM). According to [46], at least 150 BIM-software packages are available worldwide.
In the early years of energy-efficient building development, achieving a specific Green-Star credit for the industry seems challenging as the assessment process is not well-prepared and user-friendly [47]. From the methodological and technical points of view, many studies used techniques that are still too slow with higher chances of making errors in computations [2]. Some even permit too many assumptions, which later contributed to poor estimation rate, higher investment risk, and high uncertainty in the saving estimates. Due to all the drawbacks and limitations, BIM is now a global digital technology that is widely believed to have the potential to revolutionise the construction industry [5,24,46,48,49]. According to Jons Sogren, Chair of the International Standard Organization (ISO), enforcement of using BIM in building development will result in more efficient building and infrastructure projects in the future [50]. This is due to its technology which inculcates a sophisticated building development process, encompassing various standards and guidelines such as ISO, ASHRAE, and green indexes in it.
From an effective retrofitting point of view, the aims are beyond energy saving and emission reduction. It includes the capacity and capability of the return of investment (ROI). Hence, the ability of modelling software in providing cost information is highly preferable. Due to this, identifying cost-effective strategies for retrofitting the existing buildings will help to prioritize interventions and increase the success of saving initiatives [16,51]. To fulfill the requirement, selected software such as ArchiCAD, EnergyPlus, and Revit are capable of achieving these. In summary, BIM is claimed to be the solution and common designation for a new way of approaching the design, construction, and maintenance of buildings that can improve many aspects of the construction industry throughout the building’s life cycle [2,24]. However, this study discussed the cost-saving impact based on the saving obtained from the energy reduction through effective retrofitting initiatives. Nonetheless, the ROI is excluded.
Based on the above-listed benefits of BIM, the 25 floors of the Wisma R&D building were modelled using ArchiCAD, and the energy performance study is carried out through its embedded Energy Performance Evaluation built-in feature. In a nutshell, the novelty of this study lies in its capabilities to analyse the impacts of three significant window design parameters on the building’s energy consumption, energy cost, and CO2 emission through the reduction of cooling load. In particular, this research provides a significant guideline for future retrofitting exercises for Wisma R&D, University Malaya, and other similar high-rise buildings in Malaysia. This research aims to promote and encourage future and existing building owners to inculcate BIM in their future design and retrofitting projects as the popularity of establishing BIM within the construction industry in Malaysia is still very low [52]. The outcome of this research allows a prediction of the total savings from sustainable design and retrofitting initiatives for the high-rise building, in Malaysia, in particular.

3. Data and Methods

A detailed step-wise methodology has been followed, and it is indeed very important as the virtual building modelling process requires lots of references and information. The detailed building parameters which are used as the fixed and variable input in the model are set before the Energy Performance Evaluation is simulated. The simulation was carried out by altering the values of three window design parameters, namely, the glazing and opaque materials and the shading element. Several combinations are analysed to observe the effect of one or more window design parameters on the cooling load demand. Beforehand, the existing building parameters of Wisma R&D were used as a reference, and the Energy Performance Evaluation is performed. The outcome from the initial simulation (A0) was used as a reference to ensure that the virtual building model is acceptable before a further simulation is carried out for the other combinations of window design parameters.

3.1. Walk-Through Energy Audit

Historically, Wisma R&D was built more than 30 years ago and owned by Telekom Malaysia (TM). It is characterised as an office building with a total of 25 floors, including three parking levels. The total floor area is 444,727.66 square feet or 41,316.55 m2. The building layout was obtained from the Department of Development and Asset Maintenance (also known as JPPHB). Due to several renovations carried out throughout the operation, the authors decided to conduct a walk-through energy audit (EA) to cross-check the existing layout and the building parameters before the virtual building is modelled. In addition, EA is conducted as some of the information on the building was not found in the building’s layout. The distance between each floor’s slabs was measured during this process. Moreover, the type and size of the cooling system (air-conditioning) were identified through this process as well. The involvement of the management and maintenance personnel was crucial in this research as the JPPHB had replaced the cooling system in 2008, hence lots of changes had occurred from the original layout.

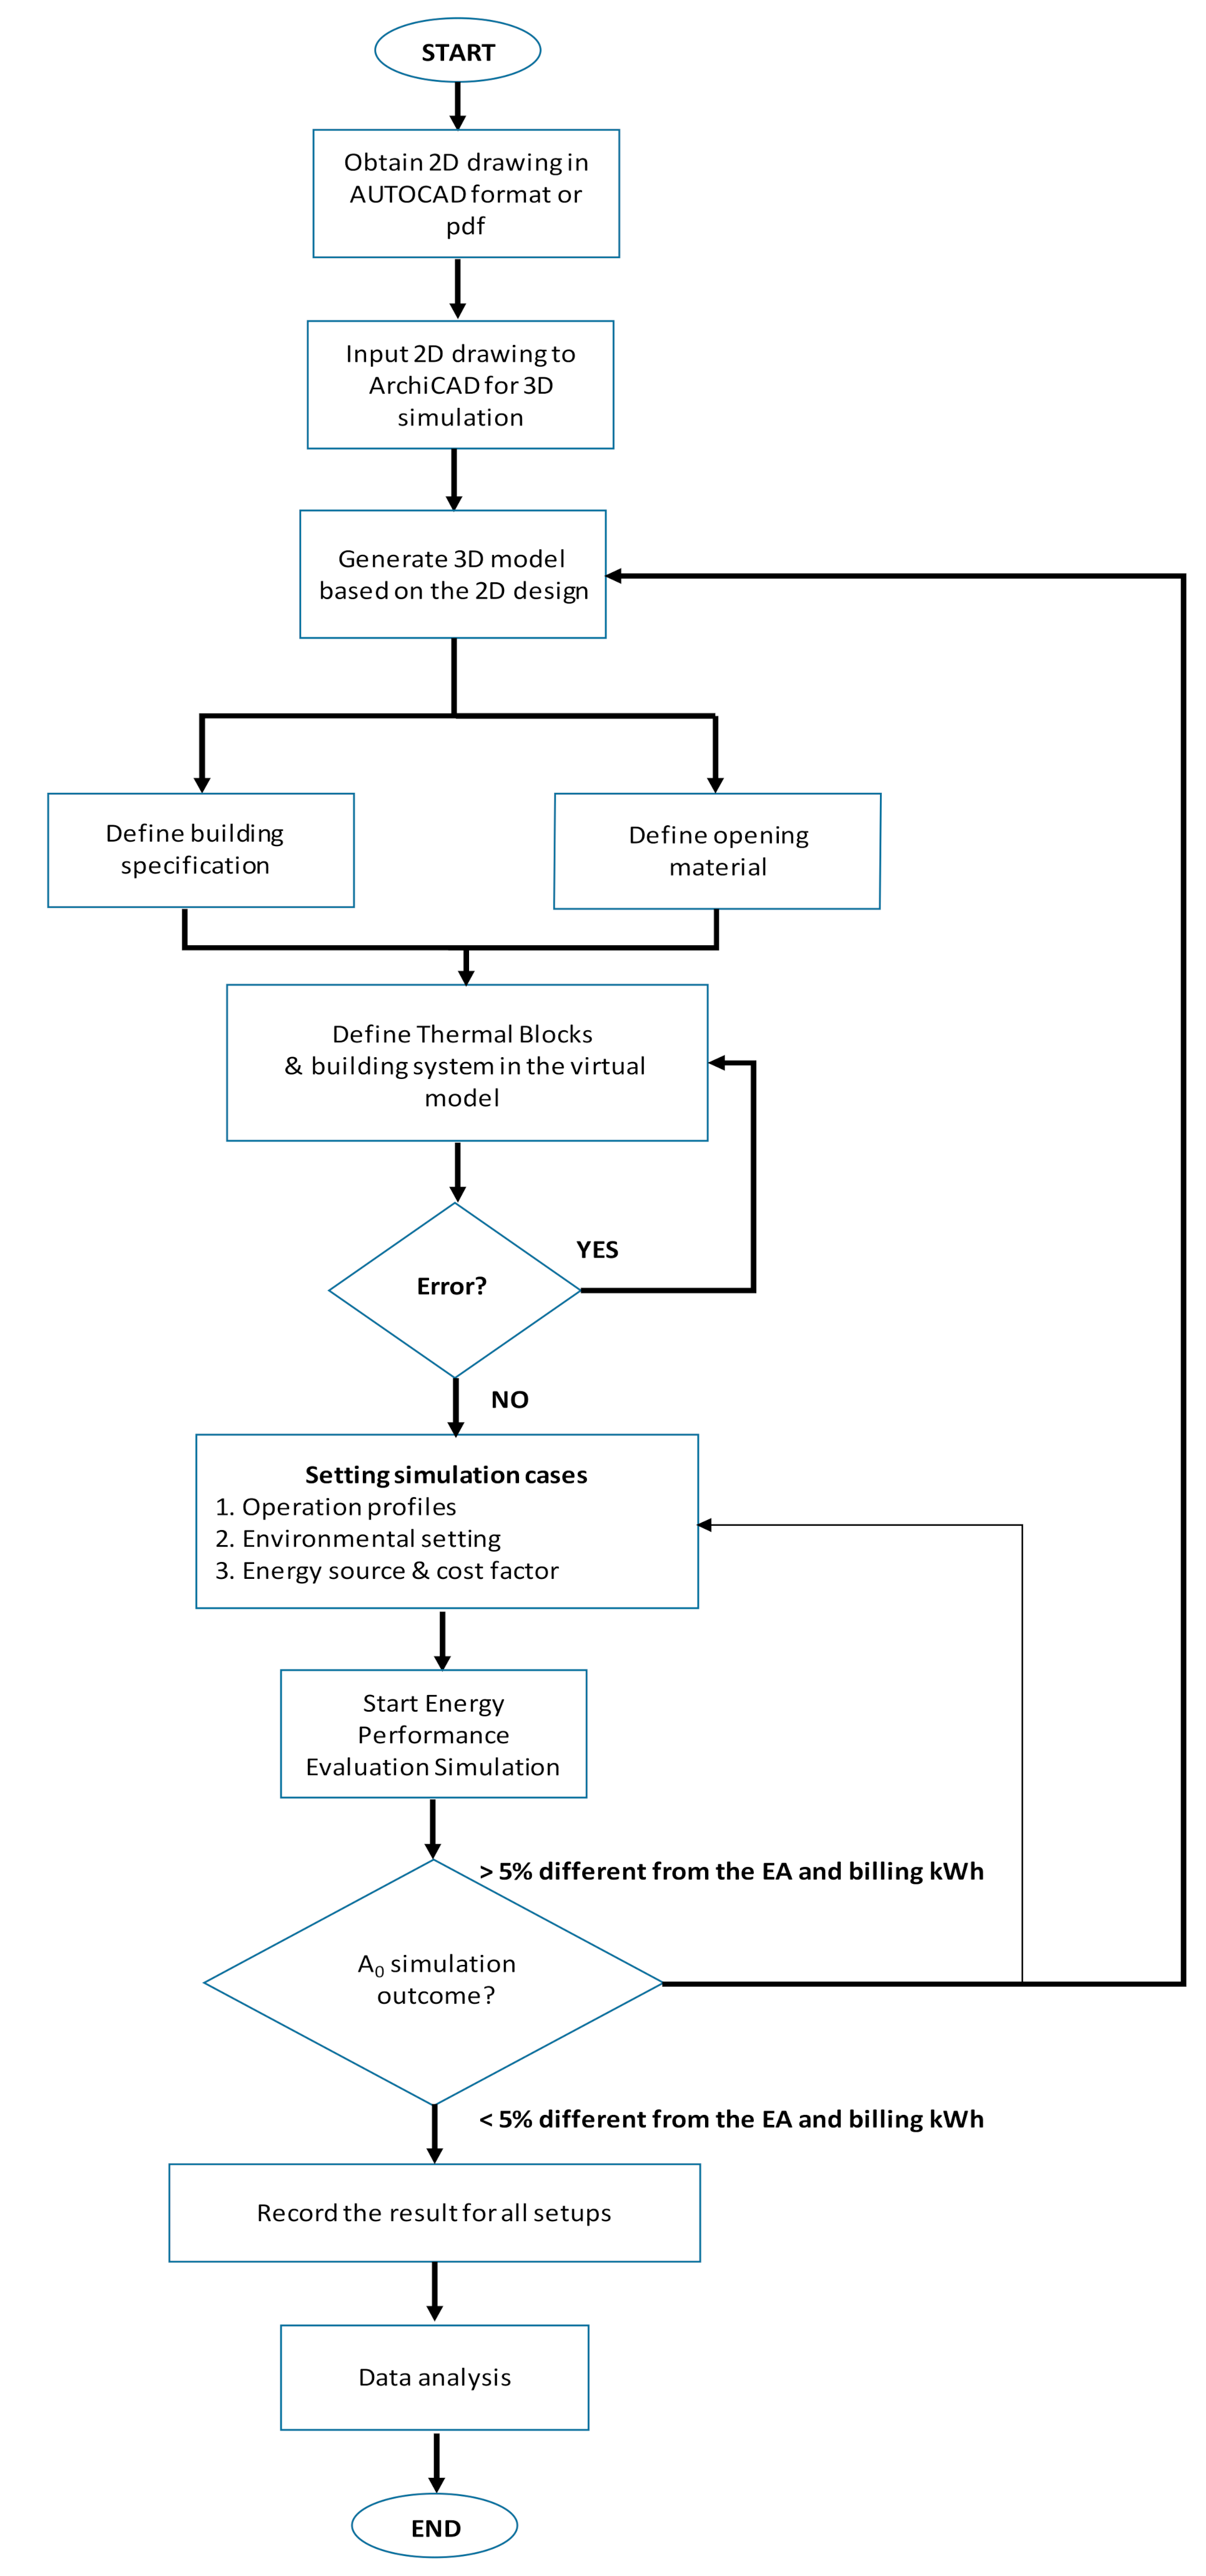
3.2. Modelling Phases

As mentioned, ArchiCAD software has been selected as a tool for modelling the virtual building and analysing the building’s energy consumption. There are two major phases involved in the modelling process. The virtual building was modelled starting at level 4. This is due to the floor area, which is similar from level 4 to level 22. On the other hand, level 3 consists of the cafeteria and the rooftop area, while levels 1 and 2 consist of the management office and laboratories whose cross-sectional floor areas are larger than the remaining floors. Hence, these three-floor areas were modelled after the completion of level 4 onwards. The bottom three floors, which mainly consist of the parking space, were completed later. The building layout of the 25 floors of Wisma R&D, which was earlier obtained from JPPHB UM, was used to initiate the modelling work. The virtual building model demands at least the structure envelope, fenestration, and all the major internal structures that provide significant heat storage mass within a building. In general, the modelling process consists of Phase I and Phase II.
Phase I includes the development of the three-dimensional (3-D) building model based on the building layout. For Wisma R&D, the individual floor layout is available and used to initiate the modelling work. This phase includes determining and modelling the architectural and structural elements such as floor area, wall, and openings, i.e., doors and windows, frame, slab, and roof. As this research aims to analyse the impact of three window elements on the building energy performances, the entire architecture, and structural elements remain unchanged throughout the simulation process. This is because, even though it is known that the building envelope and its structural properties have a significant impact on energy performance, in the case of retrofit initiatives, it is not a practical and economical approach. Hence, the simulation was made purely based on the window design parameters.
As mentioned earlier, selecting suitable window glazing, opaque and the element of shading can reduce the internal heat and the infiltration, which directly impacts the energy consumption, mainly from the air-conditioning. Thus, this research will analyse the impact of these three window design parameters on building energy consumption and recommend the best retrofitting initiatives for Wisma R&D. The basic architecture and structural materials of Wisma R&D are listed in Table 1. These are the fixed elements inserted in the virtual building model which were obtained from various sources such as the building’s layout, EA, and the maintenance department personnel. The fixed elements were then set as default values in the building model, and the physical properties of these elements which are obtained in the ArchiCAD catalog were listed in Table 1.
Phase II encompasses the development of the thermal blocks for each floor within the building. Once the 3-D model has been developed along with the architectural and structural elements, this is the next phase of the modelling process. According to [53], thermal blocks are a collection of rooms or spaces in a building with a similar orientation, operation profile, and internal temperature requirements. Each thermal block is set with a different supply building system. For the Wisma R&D model, three main thermal blocks, i.e., office, circulation, common area, and services and facilities, are defined. Each thermal block is classified with a specific supply building system. The operation profile, total area, and type of the supply building systems of each thermal block are shown in Table 2.
From the virtual building model developed, Wisma R&D has a total gross area measured as 42,171.87 m2 with 839 zones. The virtual building is proved to be as accurate as the Wisma R&D building based on the area measurement. The information obtained from the management stated that the total floor area is 41,316.55 m2. Hence, the difference in area is small; measure at around 2%.
Wisma R&D is equipped with the Variable Refrigerant Flow (VRF) system, and each floor has its specific capacity. Hence, the cooling capacity for this building is estimated based on the average capacity of each level. In the virtual building model, only the Office and Circulation and Common Area are set with the VRF, whereas the Services & Facilities zone is set with the ventilation fans. This has made the virtual building model very similar to a real building operation, which later assists in higher accuracy of Energy Performance Evaluation. The average cooling capacity for the whole building is 352.3 horsepower (HP), which is equivalent to 262.8 kW. A comparison is made with the maximum demand recorded in 2018’s utility bill. It is observed that in 2018, the average maximum demand (MD) for Wisma R&D was 656.5 kW. From the EA exercise, 34 percent of the electricity consumption by this building was from the air-conditioning system (223.21 kW) [19]. Hence, 250 kW was selected as the total cooling capacity for Wisma R&D, which is set as the initial value in the (A0) building model.
There is no heating load inserted in the virtual model as this building does not have any heating elements at any part of the building. Upon setting up the thermal blocks and supply building system, the Energy Performance Evaluation is executed.

3.3. Simulation Setup—Energy Performance Evaluation

The energy model review palette in ArchiCAD allows numerous information related to a building design, materials, environmental setting, wind protection, and many others to be included as part of the Energy Performance Evaluation. In this research, the building’s energy performance was conducted with fourteen different combinations of window design parameters. The initial simulation (A0) was based on the existing building parameters and is used as the baseline in this research.
In performing the energy performance of one building, general information, such as the operating hours, type of building, and many others, is included. Hence, in this research, annual dynamic operating hours (8760 h) were divided into working hours (6264 h) and non-working hours (2496 h). In addition, the near-optimal Operation Profile selection for Wisma R&D is identified as General Office. Furthermore, in ArchiCAD, various other building parameters are permitted to be included, leading to a high level of accuracy in the energy evaluation process. Figure 1 shows the operational profile setup in this simulation. Each parameter is thoroughly discussed in the next section.
The Energy Performance Evaluation was performed based on this operation profile. Subsequently, the remaining simulations were based on different combinations, which included the window’s glazing material, opaque, and shading type. In general, three different types of double-glazing material, three opaque materials, and three shading elements were set in different combinations in this research. Table 3 shows the summary.

3.3.1. Operation Profile

Referring to the Operation Profile information in Figure 1, the selected values are the default setup for a non-residential building model in ArchiCAD. For instance, the human heat gain of a general office is set to 120 W per capita referring to the non-residential cooling and heating load calculation [49]. The female heat gain is 130 W and is 140 W for a male. A different reference [50] states that the typical energy load per person is 400 BTU/hr for a typical worker and up to 1000 BTU/hr for sports activities. Hence, based on this, the minimum human heat gains appropriate for a non-residential is 117.2 W. The specification provided has proved that the ArchiCAD default setting for the general office’s human heat gain is practical for the general office in this simulation process. Furthermore, as there is no heating system in the Wisma R&D building, the service hot water load is set to zero, whereas the humidity load is set at 10 g/day, m2.
Furthermore, the Operation Profile values include the scheduling parameters, such as internal temperatures, occupancy count, lighting type, and other equipment rates for the specific operation time. In this research, as there are five working days and two non-working days, the scheduling parameters were set according to the actual situation. In particular, the operating time chosen was supported by many other simulation studies summarized in the [30] handbook. To conclude, it was found that the cooling load profile from different computer program analyses for the non-residential building is utilized from 7 a.m. to 5 p.m. (normal working hours in Malaysia).
The overall parameter setup is listed in Table 4. These parameters remained unchanged throughout the energy performance evaluations so that the effect of different glazing and opaque materials and shading elements could be observed.

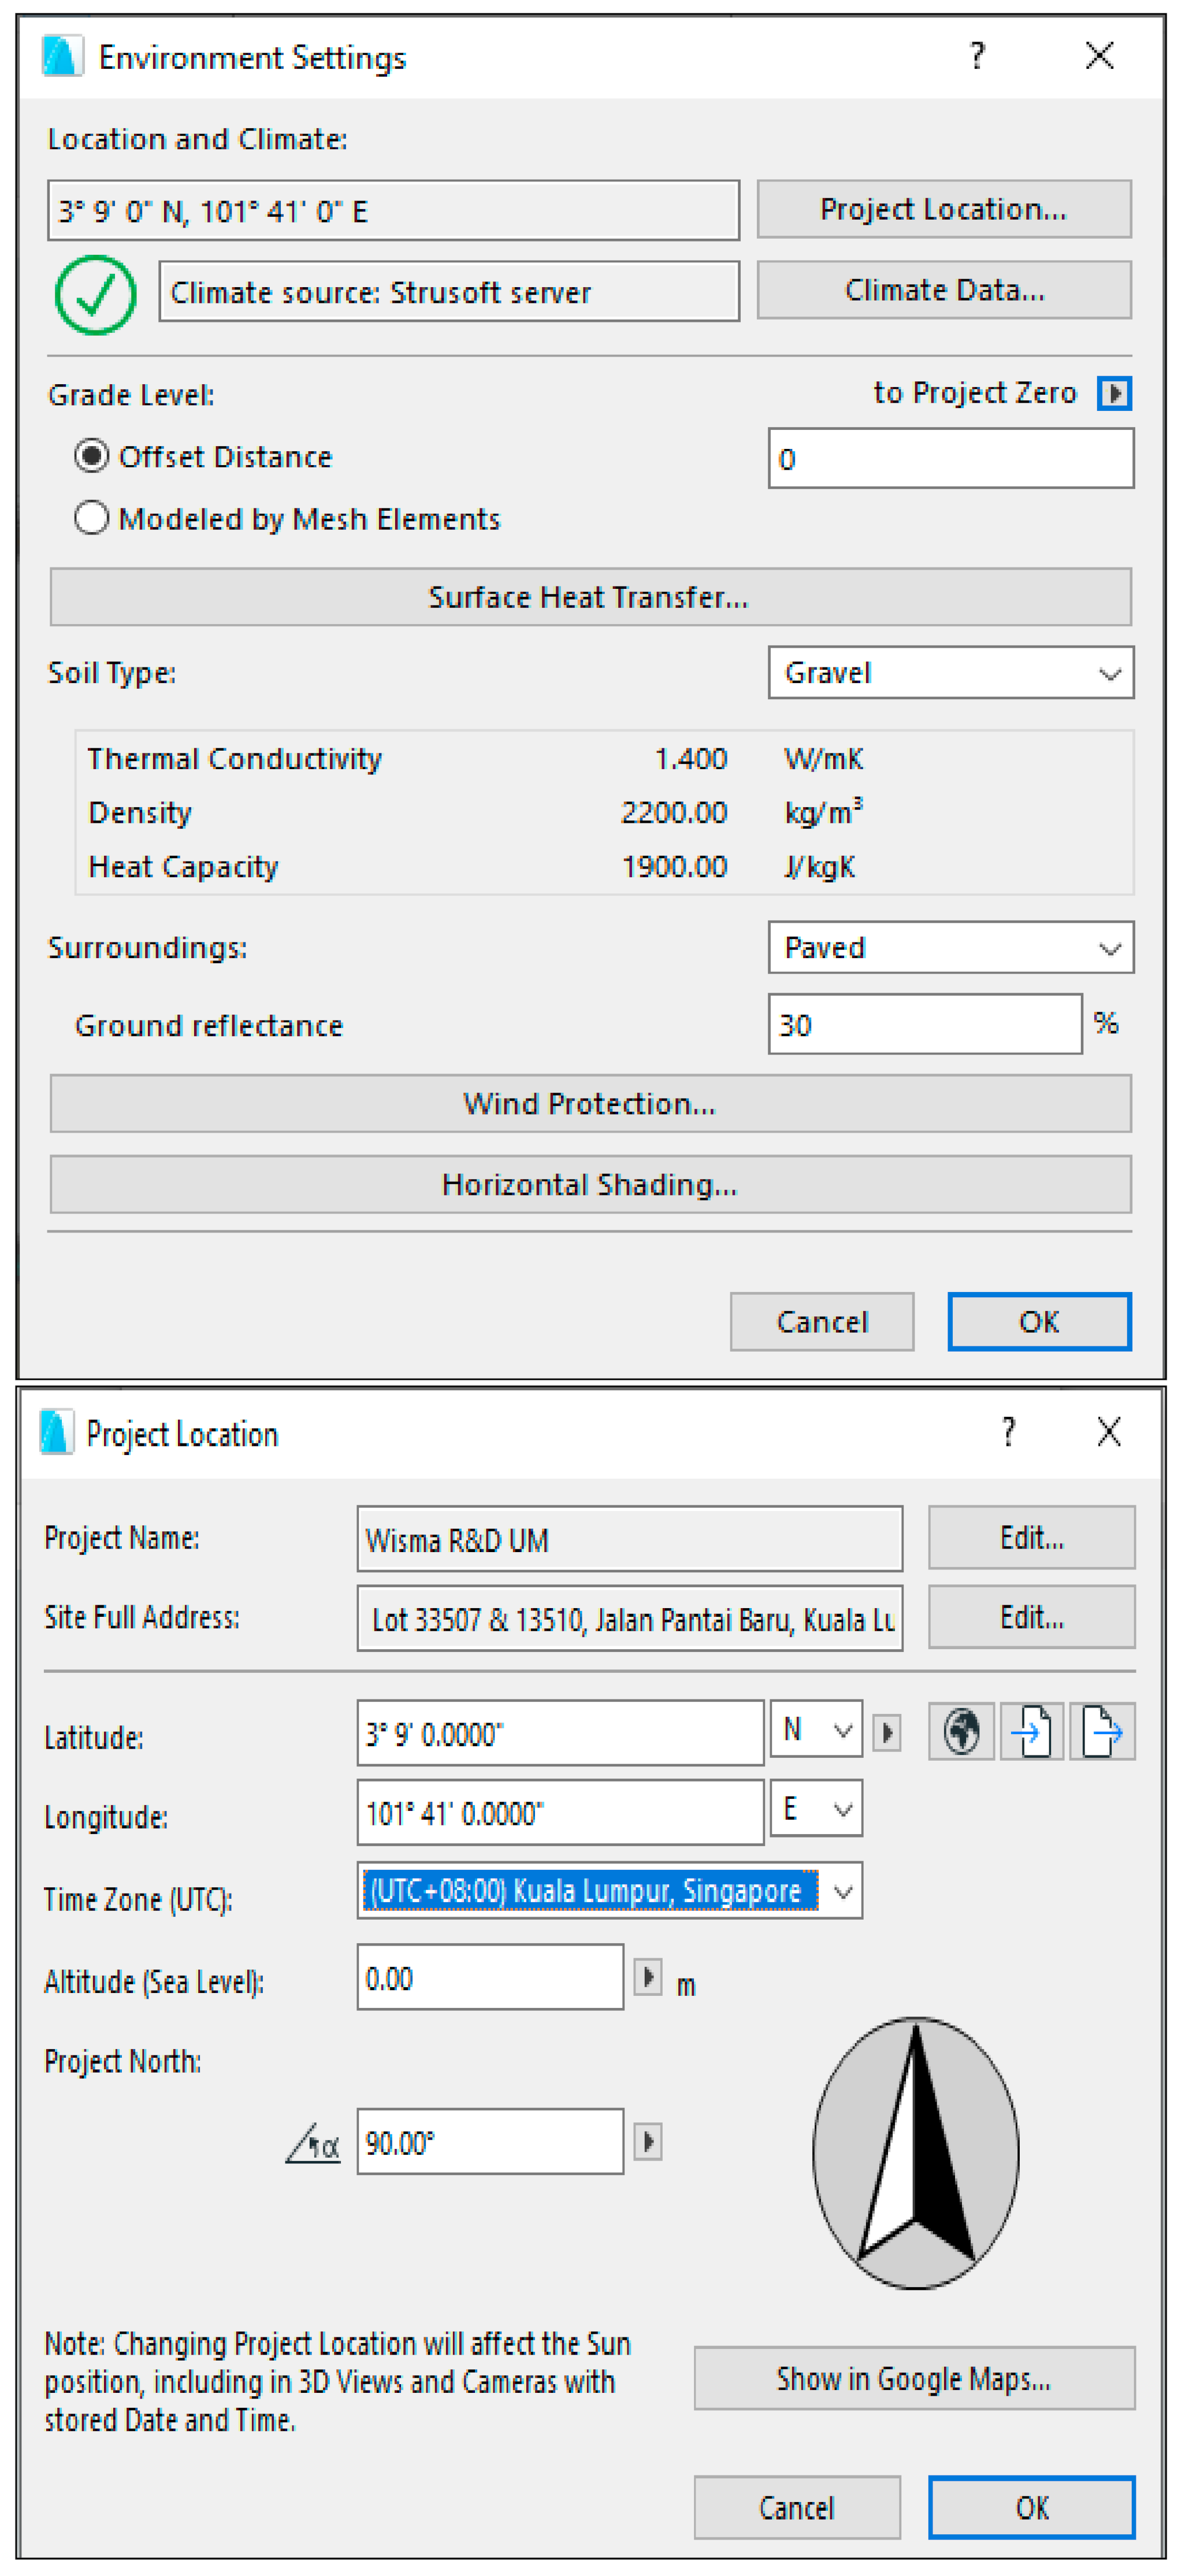
3.3.2. Environmental Settings

The extensive energy evaluation function in ArchiCAD software has allowed researchers and building professionals to experience the detailed energy performances of one building. Besides various parameters placed under the operation profile setup, the Environmental Settings and Climate Data features allow the reference building to be placed at the exact location. This is one of the excellent features embedded in ArchiCAD to best suit building retrofitting purposes. Additionally, this also benefits new building design as it links the environmental-based data such as soil type, wind protection, sun position, and weather parameters, i.e., air temperature, humidity, and wind speed, to the virtual building model during the Energy Performance Evaluation process. This means the results comprise both the direct and indirect parameters of one building. Some of the Environmental Setting features are shown in Figure 2.
In allowing the real environment effect of Wisma R&D, the exact location of this building is set by entering the building address. Apart from the address, the real-location setup can be specified through the latitude and longitude details. Certainly, this can be examined by displaying the location of one building through the google Maps connection. In summary, all the environment settings and climate data parameters remained unchanged except for the shading. The fixed parameters selected for the simulation are listed in Table 5.

3.3.3. Energy Sources and Energy Cost Factor

Building performances are concluded from various aspects of energy dimensions. In this research, the decision to use the ArchiCAD software has allowed the other various energy measures to be evaluated, such as the energy source and cost, which then lead to the final energy consumption of one building and the environmental impact, specifically CO2. Practically, the built-in features available in the software allow the building professionals to review and analyse the energy cost and the CO2 emission from both the passive and active elements of a building. Furthermore, it has also assisted in analysing the impact on both the energy cost and the CO2 emission for each building parameter setup. The only limitation of the energy cost function in ArchiCAD is it allows a single energy price to be set. Hence, the result produced from the Energy Performance Evaluation report will not be near to the one obtained from the TNB’s utility bill. Thus, the cost needs to be recalculated manually based on the energy consumption result.
Figure 3 depicts the proportion of resources used in electricity generation in Malaysia. The primary energy factor values for various resources are available in the default setup. According to Malaysia Energy Statistic Handbook 2016 [51], the primary energy factor for electricity is measured at 2.5. One of the most important setups required in energy evaluation in ArchiCAD is the proportion of the electricity sources. Hence, four types of main resources for electricity generation in Malaysia are selected. As shown, 44%, 43%, 9%, and 4% were entered as the proportion for natural gas (NG), coal, hydro (water), and unknown’ resources that were used for electricity production in Malaysia, respectively. These setups will later contribute to the electricity consumption, cost, and CO2 emission published in the Energy Performance Evaluation report. The annual fuel consumption (kWh/m2), primary energy (kWh/m2), and fuel cost (RM/m2) values will be displayed in the report as well, which result from the resources selection and the electricity cost paid by the respective building. As Wisma R&D is categorised as Tariff C1 commercial building, the tariff charges inserted in the software are RM 0.365/kWh.
The overall modelling and simulation processes are illustrated in the flow chart shown in Figure 4.

4. Results and Discussion

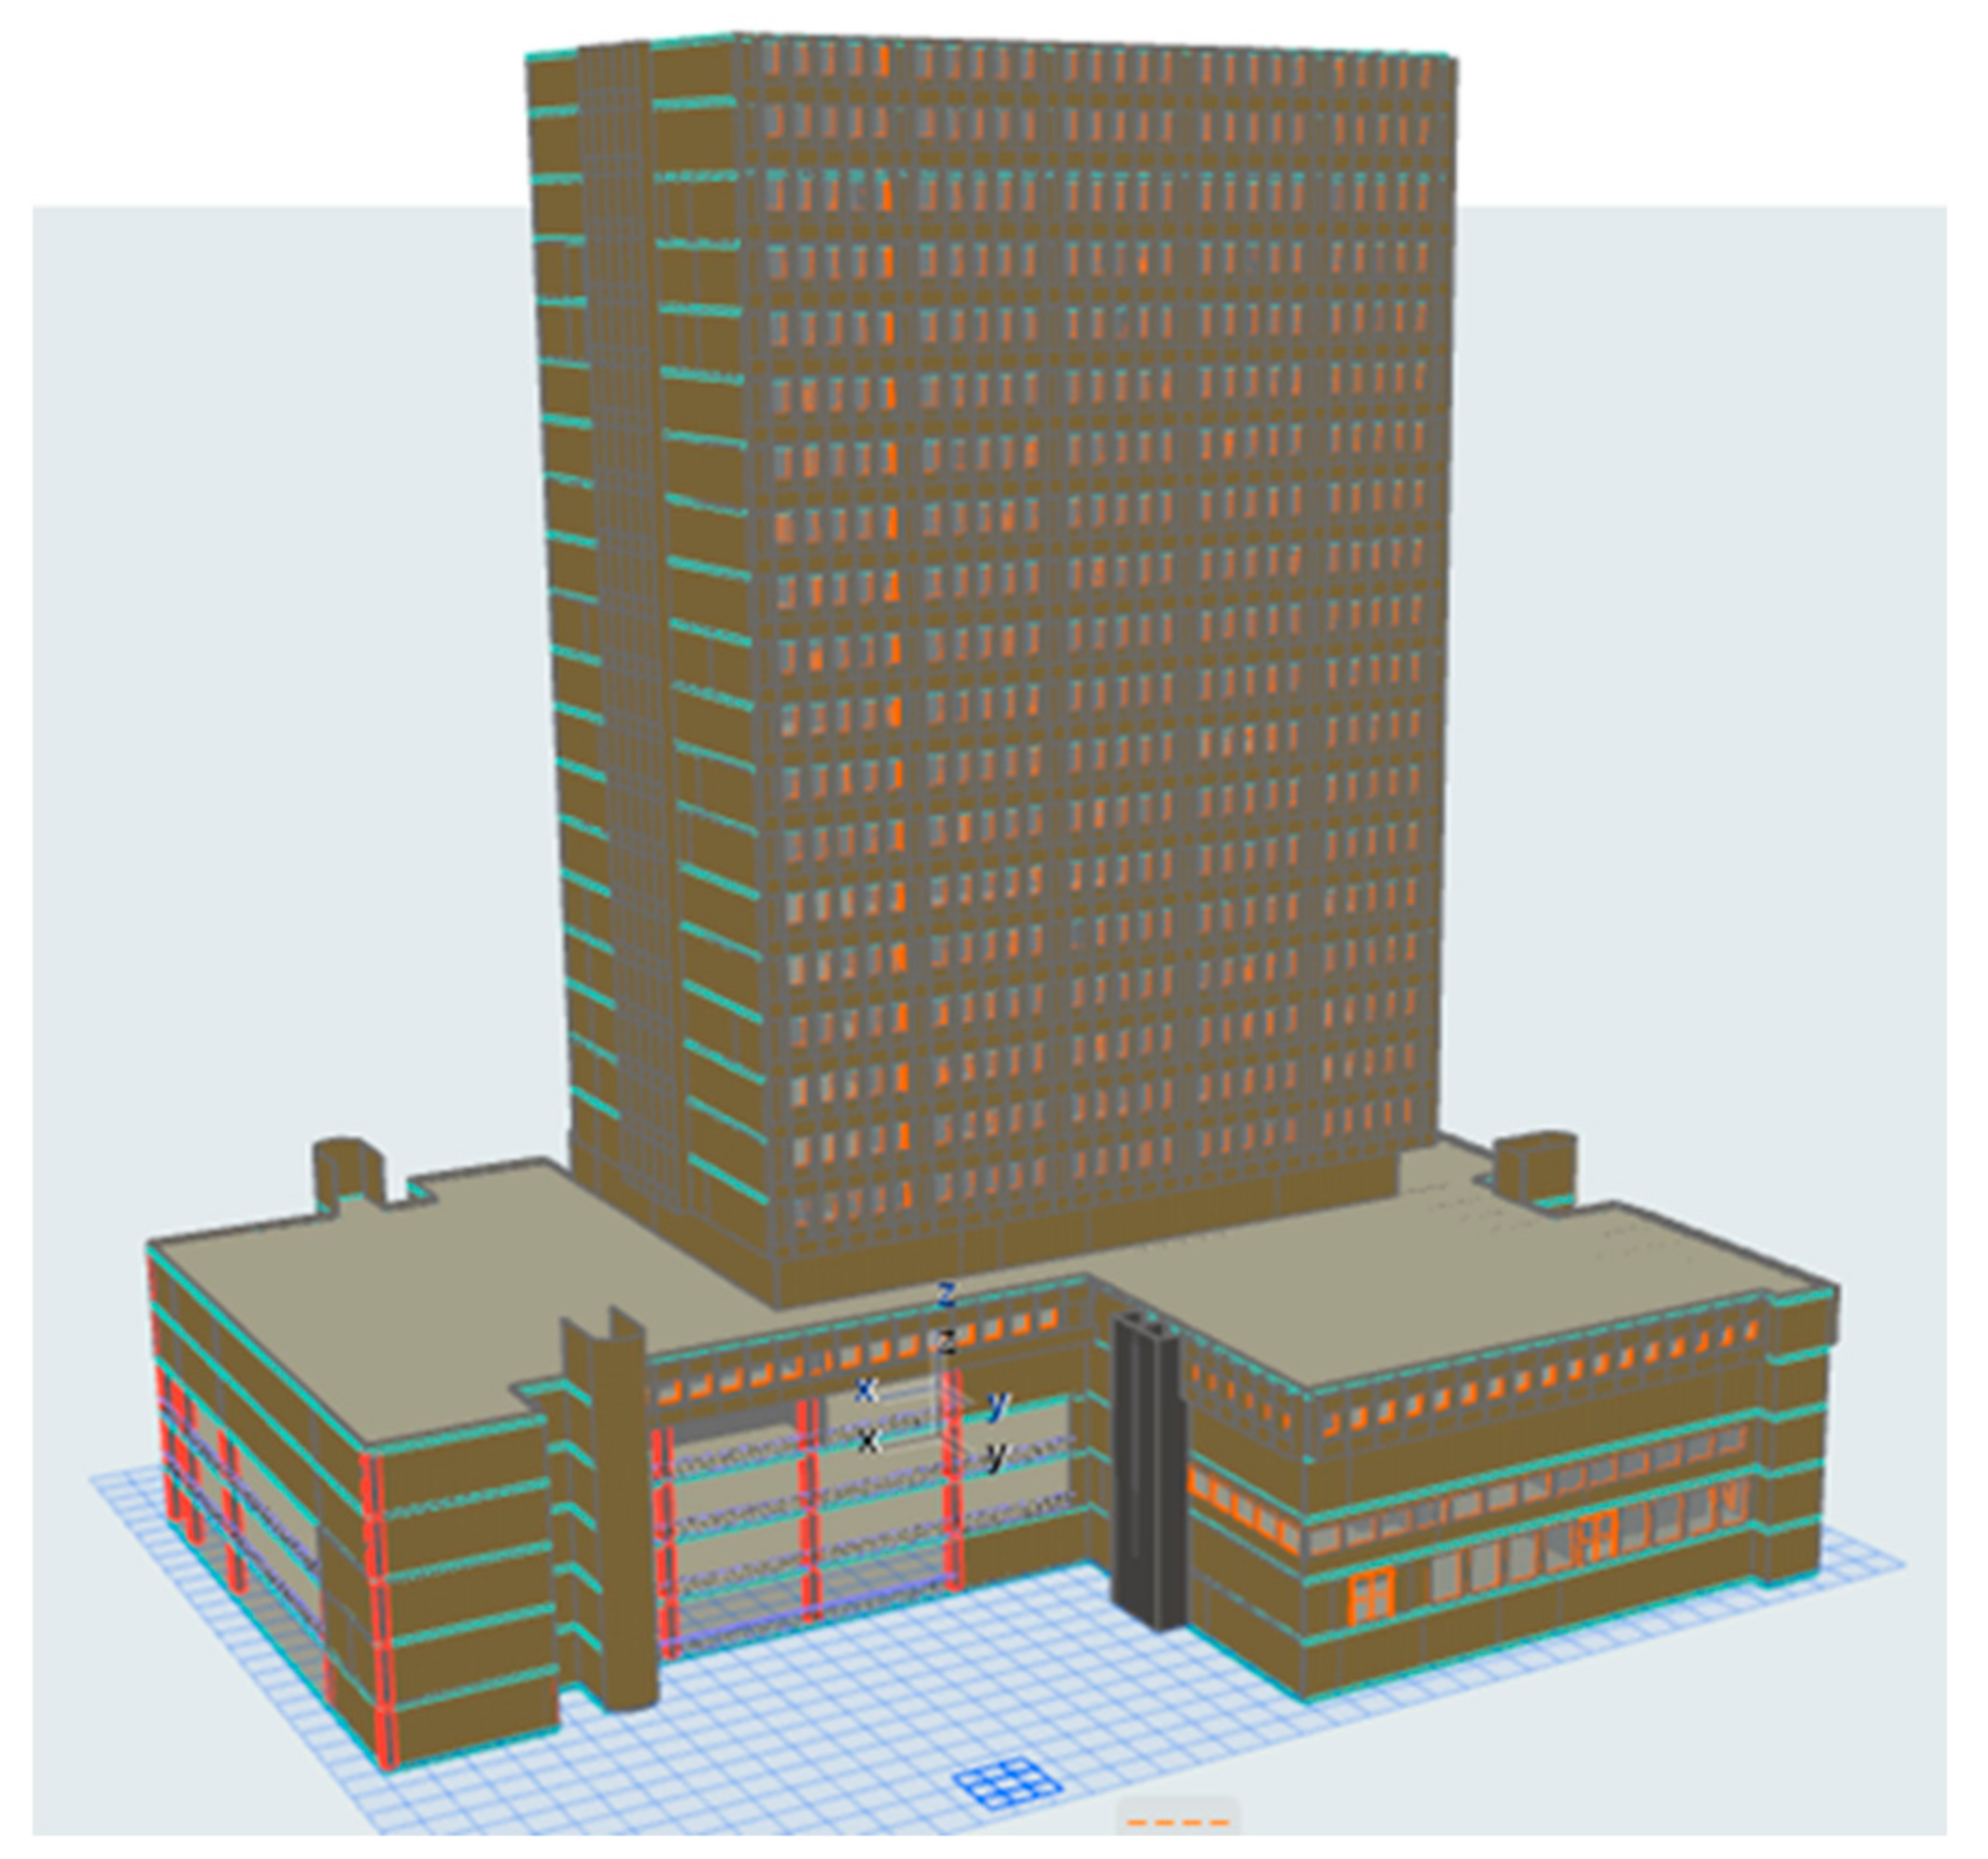
4.1. The Virtual Building Model

Figure 5 is the complete 3D depiction of Wisma R&D, which is modelled in ArchiCAD. Before the Energy Performances Evaluation is conducted on the existing building parameters (A0), it is crucial to ensure that all the building specifications, opening material, thermal blocks, and building systems are defined in the virtual model. This is important to ensure that the Energy Performance Evaluation could be as accurate as the Energy Audit (EA) and the utility bill outcomes. In ArchiCAD, before any Energy Performance Evaluation simulation can be performed, the model must be error-free.
The error-free model is included with other related setups such as the Operation Profile, Environmental Setting, Energy Source, and Cost Factor. The complete existing building model is simulated (A0), and the Energy Performance Evaluation results are analysed. To arrive at a more accurate judgement throughout the research, the energy (kWh) resulting from the initial setup (A0) is compared to both the EA and the utility bill. The model is said to be accurate if the kWh value from the simulation is less than 5% of the kWh obtained from the EA and the utility bill. Only then, the most accurate model is finalized and used for other parameter combinations as tabulated in Table 3. All data were recorded and analysed thoroughly.

4.2. Energy Performance Evaluation for Existing Building Parameter (A0)

Results from the simulation of the existing building parameter (A0) include the yearly energy consumption (kWh/m2a), total building area (m2), total heat transfer coefficients (u value), building shell performance data (infiltration), yearly CO2 footprint (kg/m2a), and many others. In this research, information such as the annual energy consumption (kWh/m2a) and total building area (m2) was used as references to ensure that the virtual model reflects close enough to the existing building.
The result from the existing building parameter (A0) simulation setup from three different approaches is simplified in Table 6. The gross area (m2) of the virtual building is very little different from the building layout, estimated at around 2% different. In Energy Performance Evaluation, it is crucial to ensure that the design of the virtual building is as close as the real building which is analysed. This will lead to a more precise result from the simulation approach. It is later used to estimate the amount of energy saving from the retrofitting exercise. On top of the building area, the annual energy consumption (kWh) was compared between the values obtained from the ArchiCAD simulation, EA, and 2018’s TNB utility bill. In this research, the difference between annual energy consumption from ArchiCAD simulation with EA and the utility bill is 17% and 3.6%, respectively. Table 6 shows the details. In this case, the authors had decided to proceed with the other combination of design parameters and the results are discussed in the later section.

4.3. Infiltration (ACH) and Heat Transfer Coefficients (u-Value and R-Value)

Three different window design parameters are combined through various combinations (refer to Table 3). These combinations were selected due to their material availability in the market and the possibility to include in retrofitting initiatives for Wisma R&D. The results which were obtained from the ArchiCAD simulation are shown in Table 7.
As this research aims to link the window system performances with the cooling load demand, the infiltration and the heat transfer coefficient (u and R values) are recorded from the simulation. The simulation concluded that there is no effect shown on the infiltration and heat transfer coefficient values from different shading types. This applies to all fourteen combinations. This research supports the finding by the authors of [54], who claimed that effective shading devices are highly dependent on the solar orientation of a particular building façade. Specifically, effective shading is mainly for the south-facing windows when sun angles are high. Due to this, it was proven that there was no effect on both infiltration and the heat transfer coefficient even though different types of glazing materials are selected on the Wisma R&D building model as most of its windows are facing north and west. From the total window glazed and opaque area, only 943.92 m2 is a south-facing window, which is estimated to be around 35% of the total window area for Wisma R&D. On a different aspect, the simulation data shown in Table 6 proved that the total envelope area is 11,115.06 m2 which is equivalent to about 26% of the total gross area. Hence, it is wise to focus on the glazing and opaque materials of the windows compared to the shading as the percentage of the south-facing window is considerably small. This finding was in line with the study by the authors of [55], who claimed that shading is highly suitable for a building with large glazed surfaces. In addition, the high-performance glazing’s material, which is now available in the market, is normally embedded with very low shading coefficients, hence reducing the need for exterior shading devices [54].
The obvious changes were seen only after the initial glazing material (single) was substituted with the double glazing (Basic Air-Filled clear). The heat transfer coefficient had drastically improved from 6.92–7.58 W/m2K to 4.18–7.09 W/m2K for the u-value and from 0.132–0.144 m2K/W to 0.141–0.23 m2K/W for the R-value. Even though the substitute glazing material had shown an effect on the heat transfer coefficient, which directly impacts the internal heat rate of a building, there was no effect on the infiltration until the window frame (opaque material) was replaced from steel to aluminium. The simulation proved that the infiltration reduces down to 50% (from 0.87 to 0.44 ACH) only with the aluminium frame type.
The simulation continues with two additional types of double-glazing materials, i.e., Basic-Air filled dark and Standard-argon fill dark low E. The results showed that there is zero impact on both the infiltration and heat transfer coefficient when the Basic-Air filled clear (A2) glazing material is replaced with the Basic-Air-filled dark (A3). Both the infiltration and heat transfer coefficients remain unchanged. Only upon changing the glazing material to the Standard-argon fill type did the heat transfer coefficient improve significantly. It is proven that the argon-filled double-glazed window material, which is one of the most common fenestration products in the market [56] is excellent in reducing the internal heat of a building, especially during the summer season, and is suitable for a country like Malaysia. It can prevent the high external temperature from penetrating through the building. In this research, the result from the simulation showed that the overall u-value has reduced by 44% (A4) with the double-glazed argon-filled window and further improved to less than 76% with a better aluminium frame material (A5). Later, the combination of the argon-filled glazed window and aluminium ultimate frame material reduced the infiltration of the building to 0.31 ACH. In short, the lower the air infiltration within a building, the better the tightness of the building enclosure as well as the air conditioning system operation [35]. Moreover, it is known that envelope air leakage is one of the major characteristics which describes a building’s air infiltration. In addition, infiltration is determined by the extent and distribution of leaks over the building envelope and the pressure differences across these leaks. Hence, the type of glazing and opaque materials selected had proof of the direct effect on the air infiltration during the simulation. This research has compared the result of the infiltration for Wisma R&D with the infiltration performances (a function of airtightness) outlined in the ASHRAE handbook [36]. It is summarized that the best combination of window building material was identified in A5 with an infiltration value is 0.31. Based on the ASHRAE handbook, infiltration read between 0.33–0.38 ACH is considered to have a good airtightness within the building. In summary, A0 and A1 combinations are considered to have loose airtightness, and A2, A3, and A4 have medium airtightness. Thus, a retrofitting initiative on the window material is an effective move in enhancing the building energy performance for the short and long term as it assists in improving the air tightness of a building and the infiltration rate. The selection from the presented combinations is much dependent on the management’s energy conservation target and the capital investment capability. This requires a detailed ROI analysis and it is highly recommended for any future research pertaining to building energy performances.

4.4. Potential Energy Conservation Measure for Wisma R&D

The presented results have outlined the potential energy conservation initiatives for the management to review the need for a suitable retrofitting exercise for Wisma R&D. It is important that the building is capable of reducing its cooling load, which, thus far, contributed to the biggest energy consumption (34%) throughout the building operation. As the building is experiencing high electricity costs and low load factor performances [18], it is crucial to look into the most effective energy conservation measure that will provide a significant impact on energy consumption, energy cost, and CO2 emission.
As noted in [29], the infiltration is responsible for approximately 3% to 4% of the building cooling load. However, various studies on window glazing have claimed that saving from single clear to double low E glazed material has shown a reduction of 6% in the annual cooling energy saving [28,56]. As this research analysed the effect of the infiltration and heat transfer coefficient in parallel, the authors decided to analyse the effect of a 3% reduction on the cooling load based on the best window material combination (A5) presented in Table 7. The reduced load value for the air-conditioning system was further introduced in the virtual building simulation. The 3% reduction from the existing air-conditioning system load is around 7500 kW; therefore, the new air-conditioning load added in the ArchiCAD building model is 242,500 kW. It is important to analyse the impact of the cooling load reduction on energy consumption (kWh), energy cost (RM), and CO2 emission (kg/m2a). Due to the limitation in ArchiCAD, the cost presented in the software is only presenting the fuel cost and not the building energy consumption cost. Hence, the energy cost is calculated based on the TNB’s tariff for commercial buildings.
Table 8 tabulates the energy consumption, energy cost, and CO2 emission comparison between the existing (A0) parameters and the 3% cooling load reduction resulting from the ArchiCAD’s Energy Performance Evaluation. The annual energy cost was calculated based on the C1 TNB’s commercial tariff, which price per unit is RM 0.365/kWh. The calculated energy cost is lesser than 2018’s utility bill (RM 1.045, 006.98) as the maximum demand charge was excluded from the calculation. If the 0.833% saving was accounted for the real utility bill, a saving of RM 8705 is obtained by the building every year from retrofitting initiatives from A0 to A5 window design parameters. The annual CO2 emission is reduced by 0.3%.

4.5. Optimal Window Selection for Sustainable Building Operation

It is wise to select the most suitable window design parameters in any retrofit initiatives to ensure the building cooling load could be optimized. In this research, the decision was made based on two conditions. First, as shown in Figure 6, [36,57], Y and Z are the optimal thermal resistance point (R-value) where the total heating and cooling energy is at minimum. From the graph, the Y value is approximately 0.8 m2K/W or 1.2 W/m2K and the Z value is approximately 0.77 m2K/W or 1.29 W/m2K. This thermal resistance value matched the A5 parameters of the simulation. Secondly, the infiltration rate at this point (A5) provides the lowest ACH, which is proved to represent a tight opening. Hence, based on this research finding, Argon-filled double-glazed windows with the aluminium ultimate metal frame make the best window system performances that can provide the optimal thermal resistance and the best airtightness for Wisma R&D, which later reduces the cooling load demand for the building.

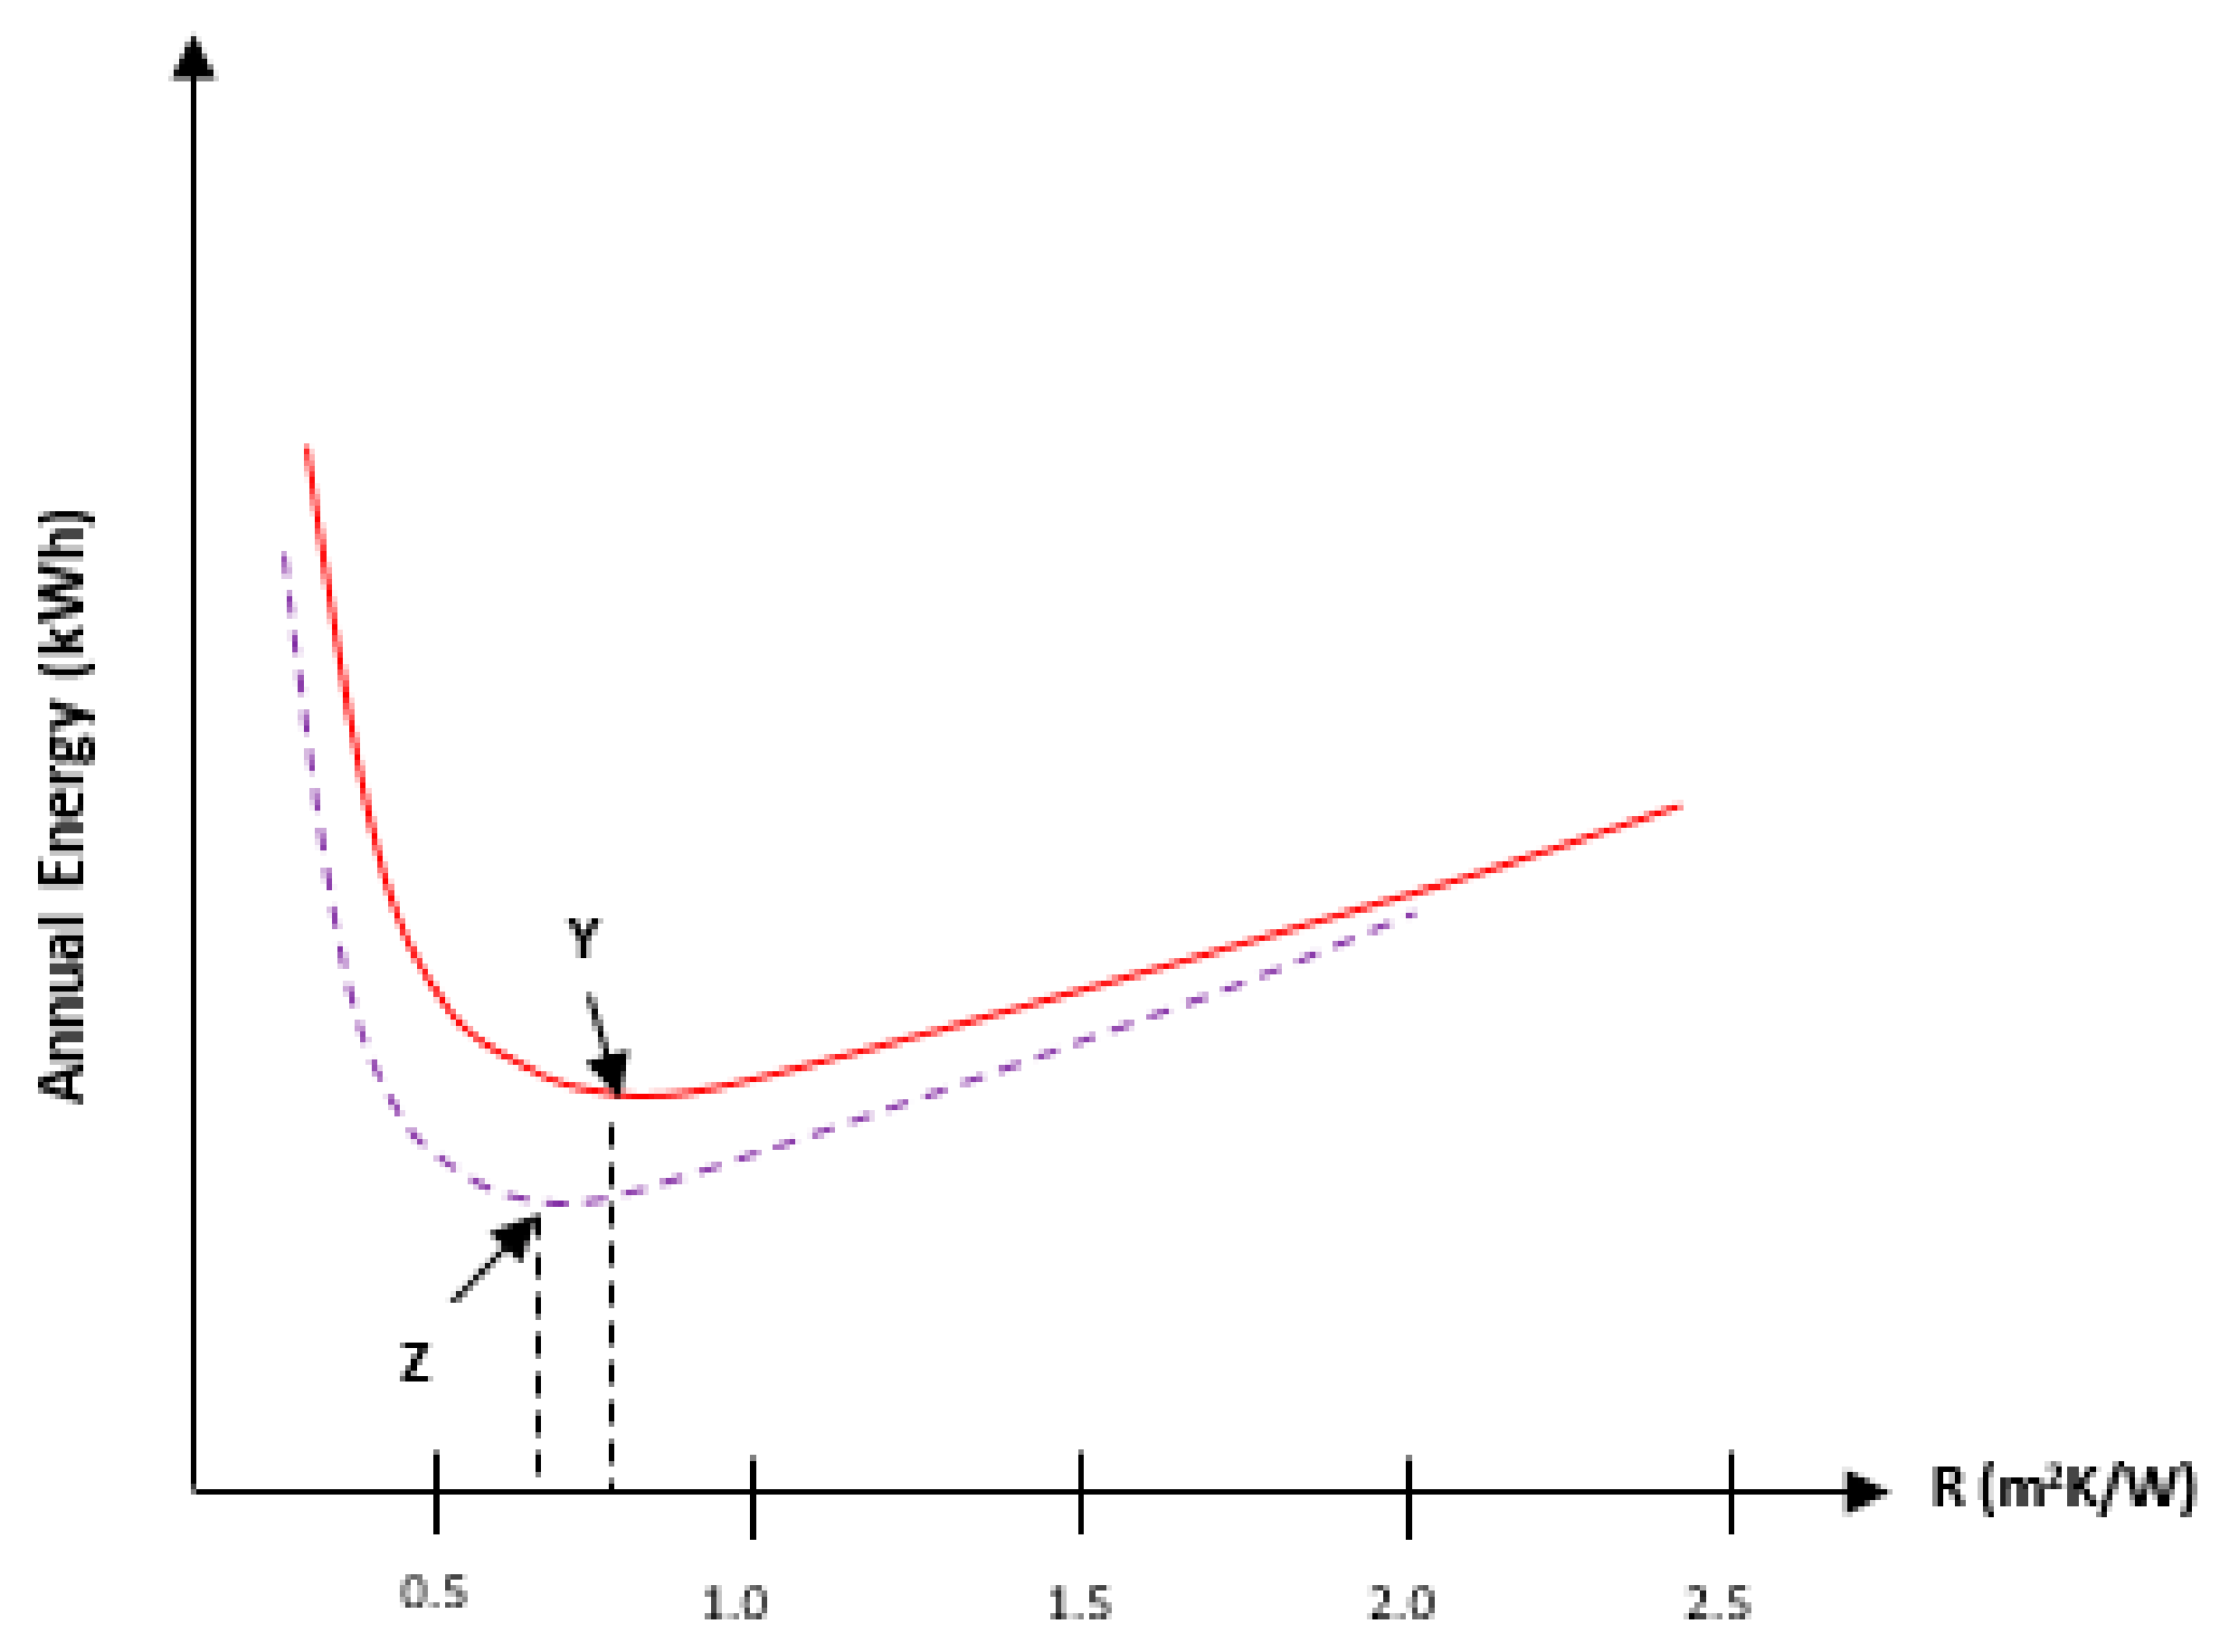
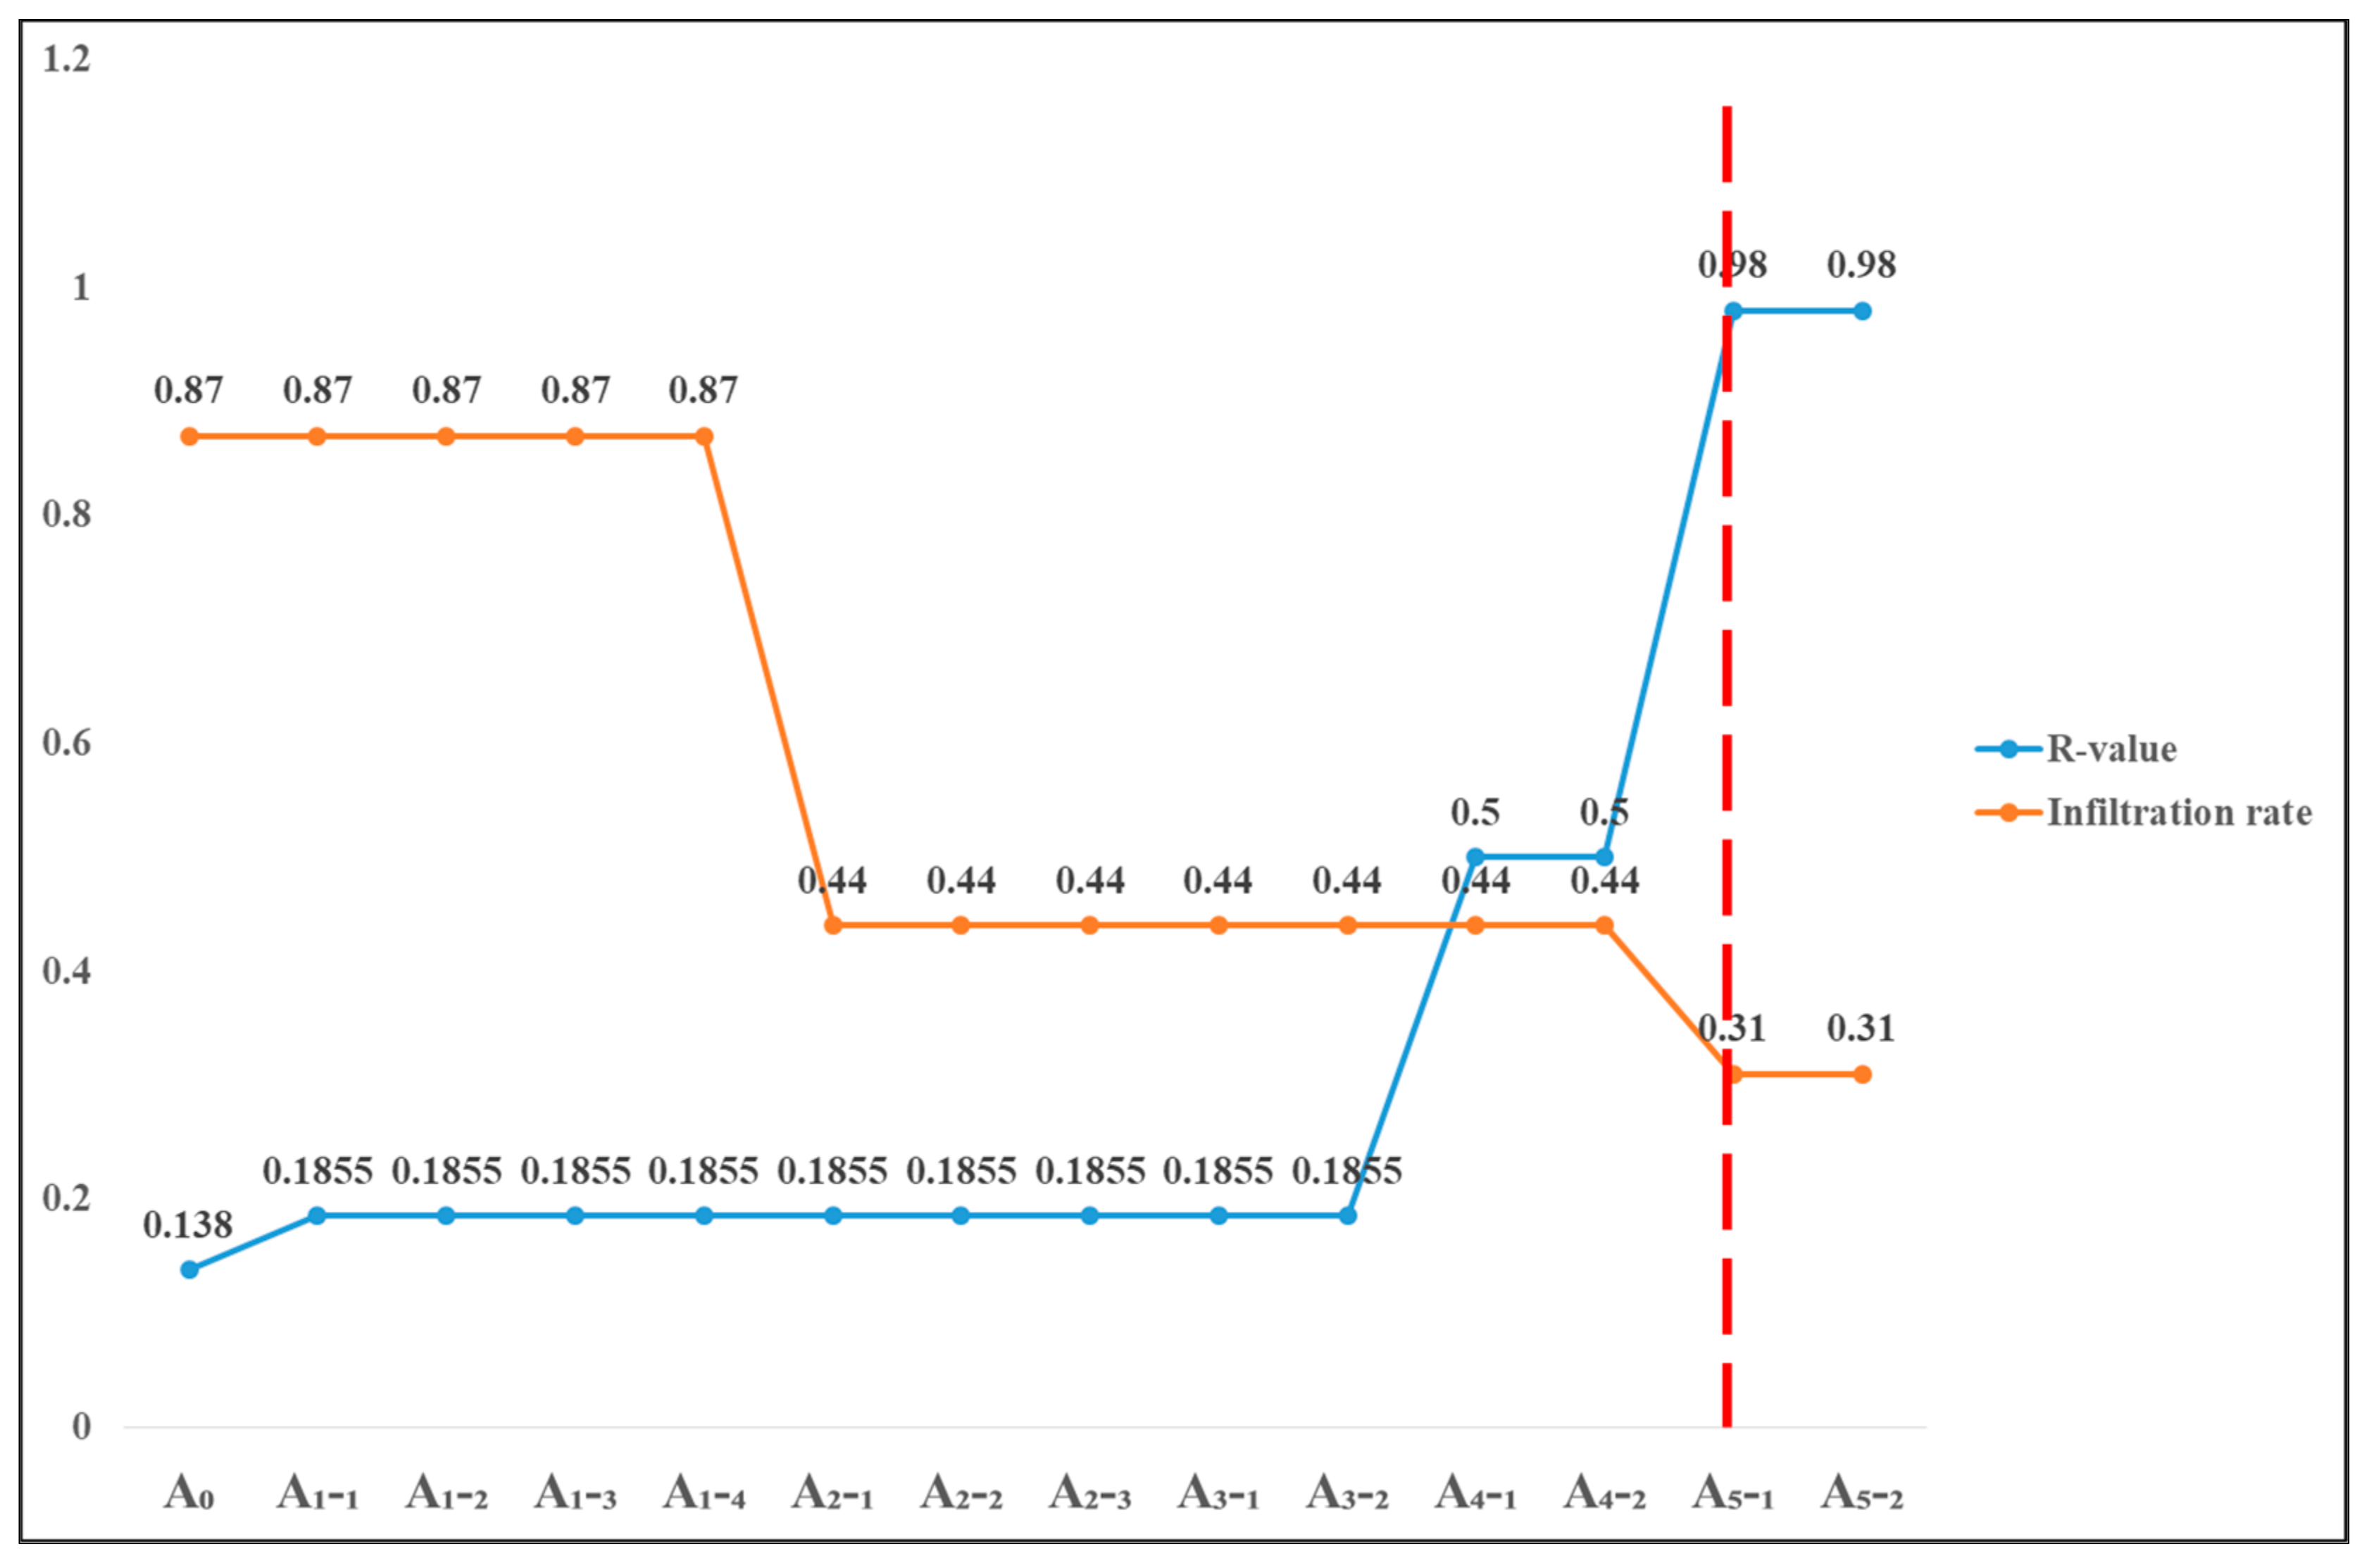
4.6. The Linkages between Heat Transfer Coefficient (R-Value) and Infiltration Rate on the Cooling Load Demand

As stated in the earlier section, the A5 window parameters combination provides the optimum improvement to the cooling load demand. The reason is due to the obvious impact on the infiltration rate upon replacing the opaque from aluminium standard to aluminium ultimate material (A4). A good air tightness within a building is achieved when the infiltration rate is measured between 0.33 to 0.38; therefore, the A5 window parameter combination is recommended for Wisma R&D. By achieving an infiltration rate of 0.31, the cooling load reduction of 3% is assumed. Figure 7 illustrates the linkages between the R-value and the infiltration rate. It shows the exact point where the R-value provides a significant effect on the infiltration rate. The R-value was obtained from the Energy Performance Evaluation simulation outcome in ArchiCAD based on the window parameters combination outlined in Table 3. The graphical illustration further demonstrates the importance of the simulation-based approach to ineffective retrofitting initiatives. For instance, the combination labelled as A4 would not significantly provide any reduction to the cooling load, as the infiltration rate remains unchanged even though the total R-value improved.
Over and above that, this study supports the optimum thermal resistance for comfortable heat gain in a building that was suggested by Spielvogel in Figure 6. The only additional point here, this study revealed the optimum thermal resistance for Wisma R&D is 0.98 m2K/W instead of 0.8 m2K/W. This should be used as a guideline for retrofitting a high-rise building with a similar operating profile to Wisma R&D. Furthermore, this thermal resistance value could be added to the existing MS1529 guideline.
In summary, it can be concluded that the sustainable development goal from the building sectors could only be achieved through detailed modelling and analysis.

4.7. Future Research and Recommendations

As this study encompasses a thorough study on building energy performance and came out with an effective retrofitting initiative, it would not completely assist the building owner until it comes along with the ROI. Hence, future research will analyse the cost and investment impact. The outcome may differ from the current result as cost always be the push factor in any sustainable development success.
In addition, future research would include replacing the lighting feature with Light Emitting Diode (LED) as this will reduce the internal heat effect for the building which later leads to a lower cooling load demand.

5. Conclusions

In any building energy simulation research, it is important to ensure the virtual building model is highly accurate before the Energy Performance Evaluation is conducted. One of the recommended methods is by comparing the initial simulation outcome (A0) with the building utility bill or Energy Audit exercise. This is important to ensure that the output from the building energy simulation could be used in determining the best retrofitting initiatives. In particular, this research discusses the linkages of three different window design parameters with the cooling load demand of a building. The simulation was carried out based on 14 different combinations set up on the virtual building modelled in ArchiCAD. For Wisma R&D, as most of its glazed opening is facing north and west, there is no effect found on both infiltration and thermal resistance from the shading material/design. However, the optimisation of building energy conservation could be achieved from suitable glazing and opaque material. In addition, this research proved that the improvement in the window design performances could assist in better infiltration and thermal resistance (u-value and R-value) of a building. Indirectly, the improvement of infiltration and thermal resistance have impacted the reduction of cooling load demand during the building operation. In conclusion, the following are some points drawn from the research.
  • Virtual building simulation is one of the sensible solutions in retrofitting initiatives. It is important to assist the building owner/management in analysing the potential saving from the retrofitting exercise and selecting the best building parameters to be retrofitted;
  • Most of the available software has embedded the Energy Performance Evaluation feature. Hence, building professionals need to expose themselves to these important features and work hand-in-hand to optimise the utmost benefit, especially through retrofitting initiatives;
  • For an optimal solution to enhance the building energy performance, it is important to analyse the heat transfer coefficients from the selected window’s glazing and opaque materials. In addition, the infiltration rate should receive equal attention. As it affects the window tightness, the opaque material selection proved to be the factor in enhancing the infiltration rate of a building;
  • An improvement in the infiltration rate of one building could assist the management to consider a reduction in the cooling load which leads to a reduction in total energy consumption and energy cost, as well as carbon emission;
  • The double-glazed window is proven to be better than the single glazed material. Triple-glazed is unnecessary as the double-glazed plus efficient frame material can meet the optimal window performances outlined in the ASHRAE’s guideline;
  • BIM is an important process that all the building professionals should apply to ensure the performance of a new building/retrofitting initiative could be reviewed before it is approved;
  • An annual energy saving of 0.8% could be achieved by Wisma R&D when the existing window is replaced with the double-glazed argon type with an ultimate aluminium frame. Without optimizing the window parameters combination, the estimated saving could not be achieved through retrofitting initiatives;
  • Shading elements are not a practical and significant solution for Wisma R&D. The main reason was due to the small window area on the south-position façade of the building. Furthermore, the building is initially equipped with some extent of shading block, hence shading is not an effective approach for retrofitting the building;
  • The linkage between the heat transfer coefficient and the infiltration rate is very important in the retrofitting decision-making. In this study, the decision on A3 versus A4 combination and A4 versus A5 makes a lot of difference to the final outcome, mainly on the cooling load consumption;
  • Available guidelines like ASHRAE and MS1525 should be used as references only. To optimize the result of retrofitting initiatives, the building owners need to conduct a thorough evaluation based on the multivariate model. As a consequence, the level of accuracy resulting from the Energy Performance Evaluation is found to be better.

Author Contributions

Conceptualization, S.B.M.A. and A.M.; methodology, S.B.M.A.; software, S.B.M.A. and A.M.; validation, S.B.M.A., M.H., and N.A.R.; formal analysis, S.B.M.A.; investigation, S.B.M.A.; resources, S.B.M.A. and N.S.J.; data curation, S.B.M.A.; writing—original draft preparation, S.B.M.A.; writing—review and editing, S.B.M.A., M.H., and N.S.J.; visualization, S.B.M.A.; supervision, M.H. and N.A.R.; project administration, S.B.M.A. and N.S.J.; funding acquisition, S.B.M.A., N.S.J., M.H., and N.A.R. All authors have read and agreed to the published version of the manuscript.

Funding

This research was funded by UM Power Energy Dedicated Advanced Centre (UMPEDAC) and the Higher Institution Centre of Excellence (HICoE) Program Research Grant, UMPEDAC-2020 (MOHE HICOE-UMPEDAC), Ministry of Education Malaysia, RU003-2020, RU002-2021, University of Malaya and the GPNS grant No. GPNS/18-01-UNISEL050 awarded by the Selangor state through Universiti Selangor and Centre for Research and Industrial Linkages (CRIL), Universiti Selangor (UNISEL).

Informed Consent Statement

Not applicable.

Data Availability Statement

Not applicable.

Acknowledgments

The authors thank the technical and financial assistance of UM Power Energy Dedicated Advanced Centre (UMPEDAC) and the Higher Institution Centre of Excellence (HICoE) and UNISEL’s Centre of Research and Industrial Linkages administrative for the support.

Conflicts of Interest

The authors declare no conflict of interest.

References and Note

  1. IEA. Energy Technology Perspective 2017; IEA: Paris, France, 2018; p. 441. [Google Scholar]
  2. Abanda, F.H.; Byers, L. An investigation of the impact of building orientation on energy consumption in a domestic building using emerging BIM (Building Information Modelling). Energy 2016, 97, 517–527. [Google Scholar] [CrossRef]
  3. Jagarajan, R.; Asmoni, M.N.A.M.; Mohammed, A.H.; Jaafar, M.N.; Mei, J.L.Y.; Baba, M. Green retrofitting–A review of current status, implementations and challenges. Renew. Sustain. Energy Rev. 2017, 67, 1360–1368. [Google Scholar] [CrossRef]
  4. Gumbarević, S.; Dunović, I.B.; Milovanović, B.; Gaši, M. Method for Building Information Modeling Supported Project Control of Nearly Zero-Energy Building Delivery. Energies 2020, 13, 5519. [Google Scholar] [CrossRef]
  5. McCadden, L. USGBC Announces International Ranking of Top 10 Countries for LEED. 2016. Available online: https://www.usgbc.org/articles/usgbc-announces-international-ranking-top-10-countries-leed (accessed on 21 January 2019).
  6. Tahmasebinia, F.; Jiang, R.; Sepasgozar, S.; Wei, J.; Ding, Y.; Ma, H. Implementation of BIM Energy Analysis and Monte Carlo Simulation for Estimating Building Energy Performance Based on Regression Approach: A Case Study. Buildings 2022, 12, 449. [Google Scholar] [CrossRef]
  7. Sadrzadehrafiei, S.; Sopian, K.; Mat, S.; Lim, C.; Hashim, H.S.; Zaharim, A. Potential Energy and Emission Reduction through Application of Triple Glazing. In Proceedings of the 6th International Conference on Energy and Development—Environment—Biomedicine (EDEB’12), Athens, Greece, 7 March 2012. [Google Scholar]
  8. Mun, T.L. The Development of GBI Malaysia (GBI). 2009.
  9. Hashim, S.Z.; Zakaria, I.B.; Ahzahar, N.; Yasin, F.; Aziz, A.H. Implementation of Green Building Incentives for Construction Key Players in Malaysia. Int. J. Eng. Technol. 2016, 8, 6. [Google Scholar]
  10. Solla, M.; Elmesh, A.; Memon, Z.A.; Ismail, L.H.; Kazee, M.F.A.; Latif, Q.B.A.I.; Yusoff, N.I.M.; Alosta, M.; Milad, A. Analysis of BIM-Based Digitising of Green Building Index (GBI): Assessment Method. Buildings 2022, 12, 429. [Google Scholar] [CrossRef]
  11. Love, P.; Bullen, P.A. Towards the sustainable adaptation of existing facilities. Facilities 2009, 27, 357–367. [Google Scholar] [CrossRef]
  12. Ma, Z.; Cooper, P.; Daly, D.; Ledo, L. Existing building retrofits: Methodology and state-of-the-art. Energy Build. 2012, 55, 889–902. [Google Scholar] [CrossRef]
  13. Noris, F.; Adamkiewicz, G.; Delp, W.W.; Hotchi, T.; Russell, M.; Singer, B.C.; Spears, M.; Vermeer, K.; Fisk, W.J. Indoor environmental quality benefits of apartment energy retrofits. Build. Environ. 2013, 68, 170–178. [Google Scholar] [CrossRef] [Green Version]
  14. Berardi, U. Aerogel-enhanced systems for building energy retrofits: Insights from a case study. Energy Build. 2018, 159, 370–381. [Google Scholar] [CrossRef]
  15. EPU. E.P.U. 11th Malaysia Plan; EPU: Kuala Lumpur, Malaysia, 2016. [Google Scholar]
  16. Walter, T.; Sohn, M.D. A regression-based approach to estimating retrofit savings using the Building Performance Database. Appl. Energy 2016, 179, 996–1005. [Google Scholar] [CrossRef] [Green Version]
  17. Yiing, C.F.; Yaacob, N.M.; Hussein, H. Achieving Sustainable Development: Accessibility of Green Buildings in Malaysia. Procedia-Soc. Behav. Sci. 2013, 101, 120–129. [Google Scholar] [CrossRef]
  18. Ali, S.B.M.; Hasanuzzaman, M.; Rahim, N.A. Investigation on the load factor performance at Wisma R&D universiti Malaya building. In Proceedings of the 5th IET International Conference on Clean Energy and Technology (CEAT2018), Kuala Lumpur, Malaysia, 5–6 September 2018. [Google Scholar]
  19. Ali, S.B.M.; Hasanuzzaman, M.; Rahim, N.A.; Mamun, M.A.A.; Obaidellah, U.H. Analysis of energy consumption and potential energy savings of an institutional building in Malaysia. Alex. Eng. J. 2021, 60, 805–820. [Google Scholar]
  20. Shaikh, P.H.; Nor, N.B.M.; Sahito, A.A.; Nallagownden, P.; Elamvazuthi, I.; Shaikh, M.S. Building energy for sustainable development in Malaysia: A review. Renew. Sustain. Energy Rev. 2017, 75, 1392–1403. [Google Scholar] [CrossRef]
  21. Magazzino, C.; Mele, M.; Schneider, N.; Shahzad, U. Does export product diversification spur energy demand in the APEC region? Application of a new neural networks experiment and a Decision Tree model. Energy Build. 2022, 258, 111820. [Google Scholar] [CrossRef]
  22. EC. National Energy Balance 2018; Energy Commission, Ed.; Energy Commission: Putrajaya, Malaysia, 2018; p. 86. [Google Scholar]
  23. Ghaffarianhoseini, A.; Tookey, J.; Ghaffarianhoseini, A.; Naismith, N.; Azhar, S.; Efimova, O.; Raahemifar, K. Building Information Modelling (BIM) uptake: Clear benefits, understanding its implementation, risks and challenges. Renew. Sustain. Energy Rev. 2017, 75, 1046–1053. [Google Scholar] [CrossRef]
  24. Bryde, D.; Broquetas, M.; Volm, J.M. The project benefits of Building Information Modelling (BIM). Int. J. Proj. Manag. 2013, 31, 971–980. [Google Scholar] [CrossRef] [Green Version]
  25. Wilkinson, S. Analysing sustainable retrofit potential in premium office buildings. Struct. Surv. 2012, 30, 398–410. [Google Scholar] [CrossRef]
  26. Changsaar, C.; Abidin, N.I.; Khoso, A.R.; Luenhui, L.; Yaoli, X.; Hunchuen, G. Optimising energy performance of an Eco-Home using Building Information Modelling (BIM). Innov. Infrastruct. Solut. 2022, 7, 140. [Google Scholar] [CrossRef]
  27. Zhao, H.-X.; Magoulès, F. A review on the prediction of building energy consumption. Renew. Sustain. Energy Rev. 2012, 16, 3586–3592. [Google Scholar] [CrossRef]
  28. Alajmi, A. Energy audit of an educational building in a hot summer climate. Energy Build. 2012, 47, 122–130. [Google Scholar] [CrossRef]
  29. Sadrzadehrafiei, S.; Sopian, K.; Mat, S.; Lim, C. Energy consumption and energy saving in Malaysian office buildings. Models Methods Appl. Sci. 2011, 75, 1392–1403. [Google Scholar]
  30. Menezes, A.C.; Cripps, A.; Buswell, R.A.; Wright, J.; Bouchlaghem, D. Estimating the energy consumption and power demand of small power equipment in office buildings. Energy Build. 2014, 75, 199–209. [Google Scholar] [CrossRef] [Green Version]
  31. IEA. Air Conditioning Use Emerges as One of the Key Drivers of Global Electricity-Demand Growth; IEA: Paris, France, 2018. [Google Scholar]
  32. Yuan, L.; Ruan, Y.; Yang, G.; Feng, F.; Li, Z. Analysis of Factors Influencing the Energy Consumption of Government Office Buildings in Qingdao. Energy Procedia 2016, 104, 263–268. [Google Scholar] [CrossRef]
  33. Gasparella, A.; Pernigotto, G.; Cappelletti, F.; Romagnoni, P.; Baggio, P. Analysis and modelling of window and glazing systems energy performance for a well insulated residential building. Energy Build. 2011, 43, 1030–1037. [Google Scholar] [CrossRef]
  34. Hee, W.J.; Alghoul, M.A.; Bakhtyar, B.; Elayeb, O.; Shameri, M.A.; Alrubaih, M.S.; Sopian, K. The role of window glazing on daylighting and energy saving in buildings. Renew. Sustain. Energy Rev. 2015, 42, 323–343. [Google Scholar] [CrossRef]
  35. Han, G.; Srebric, J.; Enache-Pommer, E. Different modeling strategies of infiltration rates for an office building to improve accuracy of building energy simulations. Energy Build. 2015, 86, 288–295. [Google Scholar] [CrossRef]
  36. ASHRAE. The 2001 Ashrae Handbook; ASHRAE: Atlanta, GA, USA, 2001; p. 892. [Google Scholar]
  37. Ng, L.C.; Dols, W.S.; Emmerich, S.J. Evaluating potential benefits of air barriers in commercial buildings using NIST infiltration correlations in EnergyPlus. Build. Environ. 2021, 196, 107783. [Google Scholar] [CrossRef]
  38. Liu, X.; Zhang, T.; Liu, X.; Li, L.; Jiang, Y. Energy saving potential for space heating in Chinese airport terminals: The impact of air infiltration. Energy 2021, 215, 119175. [Google Scholar] [CrossRef]
  39. Tahir, M.Z.; MNawi, N.M.; Rajemi, M.F. Building Energy Index: A Case Study of Three Government Office Buildings in Malaysia. Adv. Sci. Lett. 2015, 21, 1798–1801. [Google Scholar] [CrossRef]
  40. Moghimi, S.; Azizpour, F.; Mat, S.; Lim, C.H.; Salleh, E.; Sopian, K. Building energy index and end-use energy analysis in large-scale hospitals—case study in Malaysia. Energy Effic. 2014, 7, 243–256. [Google Scholar] [CrossRef]
  41. Huat, N.B.; Akasah, Z.A. An overview of Malaysia Green Technology Corporation Office Building: A showcase Energy-Efficient Building Project in Malaysia. J. Sustain. Dev. 2011, 4, 17. [Google Scholar]
  42. Noranai, Z.; Kammalluden, N. Study of Building Energy Index in Universiti Tun Hussein Onn Malaysia. Acad. J. Sci. 2012, 2, 429–433. [Google Scholar]
  43. Sadrzadehrafiei, S.; Sopian, K.; Mat, S.; Lim, C. Application of advanced glazing to mid-rise office buildings in Malaysia. Recent Res. Chem. Biol. Environ. Cult. 2011. Available online: https://docplayer.net/20482989-Application-of-advanced-glazing-to-mid-rise-office-buildings-in-malaysia.html (accessed on 16 June 2022).
  44. Jung, N.; Paiho, S.; Shemeikka, J.; Lahdelma, R.; Airaksinen, M. Energy performance analysis of an office building in three climate zones. Energy Build. 2018, 158, 1023–1035. [Google Scholar] [CrossRef]
  45. Al Qadi, S.; Sodagar, S.B.; Elnokaly, A. Estimating the heating energy consumption of the residential buildings in Hebron, Palestine. J. Clean. Prod. 2018, 196, 1292–1305. [Google Scholar] [CrossRef]
  46. Abanda, F.H.; Vidalakis, C.; Oti, A.H.; Tah, J.H.M. A critical analysis of Building Information Modelling systems used in construction projects. Adv. Eng. Softw. 2015, 90, 183–201. [Google Scholar] [CrossRef]
  47. Tam, W.Y.V.; Le, K.N.; Tran, C.N.N.; Wang, J.Y. A review on contemporary computational programs for Building’s life-cycle energy consumption and greenhouse-gas emissions assessment: An empirical study in Australia. J. Clean. Prod. 2018, 172, 4220–4230. [Google Scholar] [CrossRef]
  48. Liu, S.; Meng, X.; Tam, C. Building information modeling based building design optimization for sustainability. Energy Build. 2015, 105, 139–153. [Google Scholar] [CrossRef]
  49. Ahmad Farin, M.; Jasni, I.; Mazieana, C.A.; Rofizlan, A.; Mohammad Farid, A.H.; Sharifuddin, U.; Azra Fakhiera, S.; Siti Aisah, O.; Nurafizah, A. BIM Projects. In CIDB E-Construct; myBIM Centre: Kuala Lumpur, Malaysia, 2018. [Google Scholar]
  50. Naden, C. Better Building with New International Standards for BIM. 2019. Available online: https://www.iso.org/news/ref2364.html (accessed on 21 January 2019).
  51. Alves, T.; Machado, L.; de Souza, R.G.; de Wilde, P. Assessing the energy saving potential of an existing high-rise office building stock. Energy Build. 2018, 173, 547–561. [Google Scholar] [CrossRef]
  52. Mehdipoor, A. Level of Building Information Modelling (BIM) awareness and readiness among building professional in Malaysia. In Proceedings of the 11th ASEAN Postgraduate Seminar 2017, Kuala Lumpur, Malaysia, 15 November 2017. [Google Scholar]
  53. Graphisoft. Energy Evaluation Workflow: Overview. 2019. Available online: https://helpcenter.graphisoft.com/user-guide/77214/ (accessed on 20 October 2020).
  54. WBDG. Sun Control and Shading Devices 2018. Available online: https://www.wbdg.org/resources/sun-control-and-shading-devices (accessed on 20 October 2020).
  55. Evola, G.; Gullo, F.; Marletta, L. The role of shading devices to improve thermal and visual comfort in existing glazed buildings. Energy Procedia 2017, 134, 346–355. [Google Scholar] [CrossRef]
  56. Cuce, E. Accurate and reliable U-value assessment of argon-filled double glazed windows: A numerical and experimental investigation. Energy Build. 2018, 171, 100–106. [Google Scholar] [CrossRef]
  57. Yuan, J.; Farnham, C.; Emura, K. Optimal combination of thermal resistance of insulation materials and primary fuel sources for six climate zones of Japan. Energy Build. 2017, 153, 403–441. [Google Scholar] [CrossRef]
Figure 1. The operation profile selected for Wisma R&D energy performance evaluation.
Sustainability 14 09780 g001
Figure 2. The Environment Settings feature in ArchiCAD allows various parameters to be set up.
Sustainability 14 09780 g002
Figure 3. The input for the Energy Source Factor features in ArchiCAD for the Wisma R&D building.
Sustainability 14 09780 g003
Figure 4. The flowchart describes the overall process of this research.
Sustainability 14 09780 g004
Figure 5. The 3D depiction of Wisma R&D as modelled in ArchiCAD 22, Graphisoft software (Budapest, Hungary).
Sustainability 14 09780 g005
Figure 6. Optimal Thermal Resistance for Building with Internal heat Gains. Red line Y [36], dotted line Z [57].
Sustainability 14 09780 g006
Figure 7. The linkages between the infiltrate rate and the R-value of the window parameters combination.
Sustainability 14 09780 g007
Table 1. The building properties used in the virtual building model of Wisma R&D.
ParameterDetail Propertiesu-Value (W/m2K)Reference
External wallStructure Brick Double PlasteredThickness: 125 mmSolar absorption: 85%2.74Drawing Layout
Internal wallStud partition1.18Drawing Layout & Energy Audit
Thickness: 100 mm
Concrete block1.74
Thickness: 200 mm
Structure brick wall double plastered2.21
Thickness: 125 mm
SlabStructure Reinforced ConcreteN/ADrawing Layout
Thickness: 310 m
FloorIC: 03 Tile-FloorN/AEnergy Audit
Colour: Light brown
Thickness: 10 mm
RoofFlat roof Thickness: 380 mmN/AEnergy Audit
Table 2. Respective information relating to each thermal block of Wisma R&D.
Thermal BlocksOperation ProfileTotal Area
(m2)
Supply Building System
OfficesGeneral office11,333.42VRF
Circulation and
Common Area
Unconditioned22,928.09VRF
Services & FacilitiesToilets and
Sanitary Facilities
7910.36Fresh air supply
Table 3. The simulation setup parameter for Energy Performance Evaluation of Wisma R&D.
ParameterWindow Details
Glazing MaterialOpaqueShading Element
A0Single glazingFrame metal
[steel basic]
No shading
A1-1Double glazing
[Basic-Air filled clear]
Frame metal
[steel basic]
No shading
A1-2Double glazing
[Basic-Air filled clear]
Frame metal
[steel basic]
80% shading sunscreen
A1-3Double glazing
[Basic-Air filled clear]
Frame metal
[steel basic]
External blind
A1-4Double glazing
[Basic-Air filled clear]
Frame metal
[steel basic]
External louver
A2-1Double glazing
[Basic-Air filled clear]
Frame metal
[Aluminum standard]
No shading
A2-2Double glazing
[Basic-Air filled clear]
Frame metal
[Aluminum standard]
80% shading sunscreen
A2-3Double glazing
[Basic-Air filled clear]
Frame metal
[Aluminum standard]
External blind
A3-1Double glazing
[Basic-Air filled dark]
Frame metal
[Aluminum standard]
No shading
A3-2Double glazing
[Basic-Air filled dark]
Frame metal
[Aluminum standard]
80% shading sunscreen
A4-1Double glazing
[Standard-argon fill dark low E]
Frame metal
[Aluminum standard]
No shading
A4-2Double glazing
[Standard-argon fill dark low E]
Frame metal
[Aluminum standard]
80% shading sunscreen
A5-1Double glazing
[Standard-argon fill dark low E]
Frame metal
[Aluminum ultimate]
No shading
A5-2Double glazing
[Standard-argon fill dark low E]
Frame metal
[Aluminum ultimate]
80% shading sunscreen
Table 4. The fixed Operation Profile parameters in this research.
ParametersDetails
Internal temperatureMin = 16 °C; Max 23 °C
Occupancy dataNon-residential
Operating time8 a.m.–5 p.m. (9 h)
Occupancy counttotal area/1000 persons
Human heat gain120 W/capita
Lighting type & heat gain
Total equipment heat gain
Fluorescent lighting tube; 5 W/m2
Not included
Table 5. The Environment Settings and climate data parameters which are fixed in this research.
ParameterDetails
Project locationKuala Lumpur
Project coordinate3°9′0″ N, 101°41′0″ E
Soil typeGravel
SurroundingPaved
Wind protectionUnprotected
Climate typeMoist
Annual average external temperature28 °C
Table 6. The existing building parameter (A0) setup from three different approaches.
ParameterArchiCAD SimulationEnergy Audit (EA)Utility Bill (2018)
Gross Area (m2)42,171.8741,331.6N/A
Envelope Area (m2)11,115.06N/AN/A
Glazing ratio (%)21%N/AN/A
Infiltration at 50 Pa0.87N/AN/A
Openings u-value (W/m2K)6.92–7.58N/AN/A
Annual energy consumption (kWh)2,177,755.4 [51.64 kWh/m2a]2,646,4182,100,323
CO2 emission (kg/m2a)10.93N/AN/A
Table 7. The infiltration and the heat transfer coefficient obtained from ArchiCAD simulation.
ParameterWindow DetailsOpening u-Value
(W/m2K)
Opening R-Value
(m2K/W)
Infiltration at 50 Pa
(ACH)
Glazing MaterialOpaqueShading Element
A0Single glazingFrame metal [steel basic]No shading6.92–7.580.132–0.1440.87
A1-1Double glazing
[Basic-Air filled clear]
Frame metal [steel basic]No shading4.18–7.090.141–0.230.87
A1-2Double glazing
[Basic-Air filled clear]
Frame metal [steel basic]80% shading sunscreen4.18–7.090.141–0.230.87
A1-3Double glazing
[Basic-Air filled clear]
Frame metal [steel basic]External blind4.18–7.090.141–0.230.87
A1-4Double glazing
[Basic-Air filled clear]
Frame metal [steel basic]External louver4.18–7.090.141–0.230.87
A2-1Double glazing
[Basic-Air filled clear]
Frame metal
[Aluminium standard]
No shading3.06–7.090.141–0.320.44
A2-2Double glazing
[Basic-Air filled clear]
Frame metal
[Aluminium standard]
80% shading sunscreen3.06–7.090.141–0.320.44
A2-3Double glazing
[Basic-Air filled clear]
Frame metal
[Aluminium standard]
External blind3.06–7.090.141–0.320.44
A3-1Double glazing
[Basic-Air filled dark]
Frame metal
[Aluminium standard]
No shading3.06–7.090.141–0.320.44
A3-2Double glazing
[Basic-Air filled dark]
Frame metal
[Aluminium standard]
80% shading sunscreen3.06–7.090.141–0.320.44
A4-1Double glazing
[Standard-argon fill dark low E]
Frame metal
[Aluminium standard]
No shading1.69–2.420.413–0.590.44
A4-2Double glazing
[Standard-argon fill dark low E]
Frame metal
[Aluminium standard]
80% shading sunscreen1.69–2.420.413–0.590.44
A5-1Double glazing
[Standard-argon fill dark low E]
Frame metal
[Aluminium ultimate]
No shading0.78–1.490.67–1.280.31
A5-2Double glazing
[Standard-argon fill dark low E]
Frame metal
[Aluminium ultimate]
80% shading sunscreen0.78–1.490.67–1.280.31
Table 8. Predicted energy conservation and its savings for Wisma R&D.
IndicatorAnnual Energy Consumption
(kWh)
Annual Energy Cost
(RM)
Annual CO2 Emission
(kg)
Existing parameter [A]2,177,755.4794,880.72460,938.54
3% cooling load reduction [B]2,159,621.5788,261.84459,673.38
Saving (A-B)18,133.96618.881265.16
Saving (A-B) in %0.8330.8330.274
Publisher’s Note: MDPI stays neutral with regard to jurisdictional claims in published maps and institutional affiliations.

