
Flood Susceptibility Assessment in Arid Areas: A Case Study of Qatar


Abstract
:1. Introduction
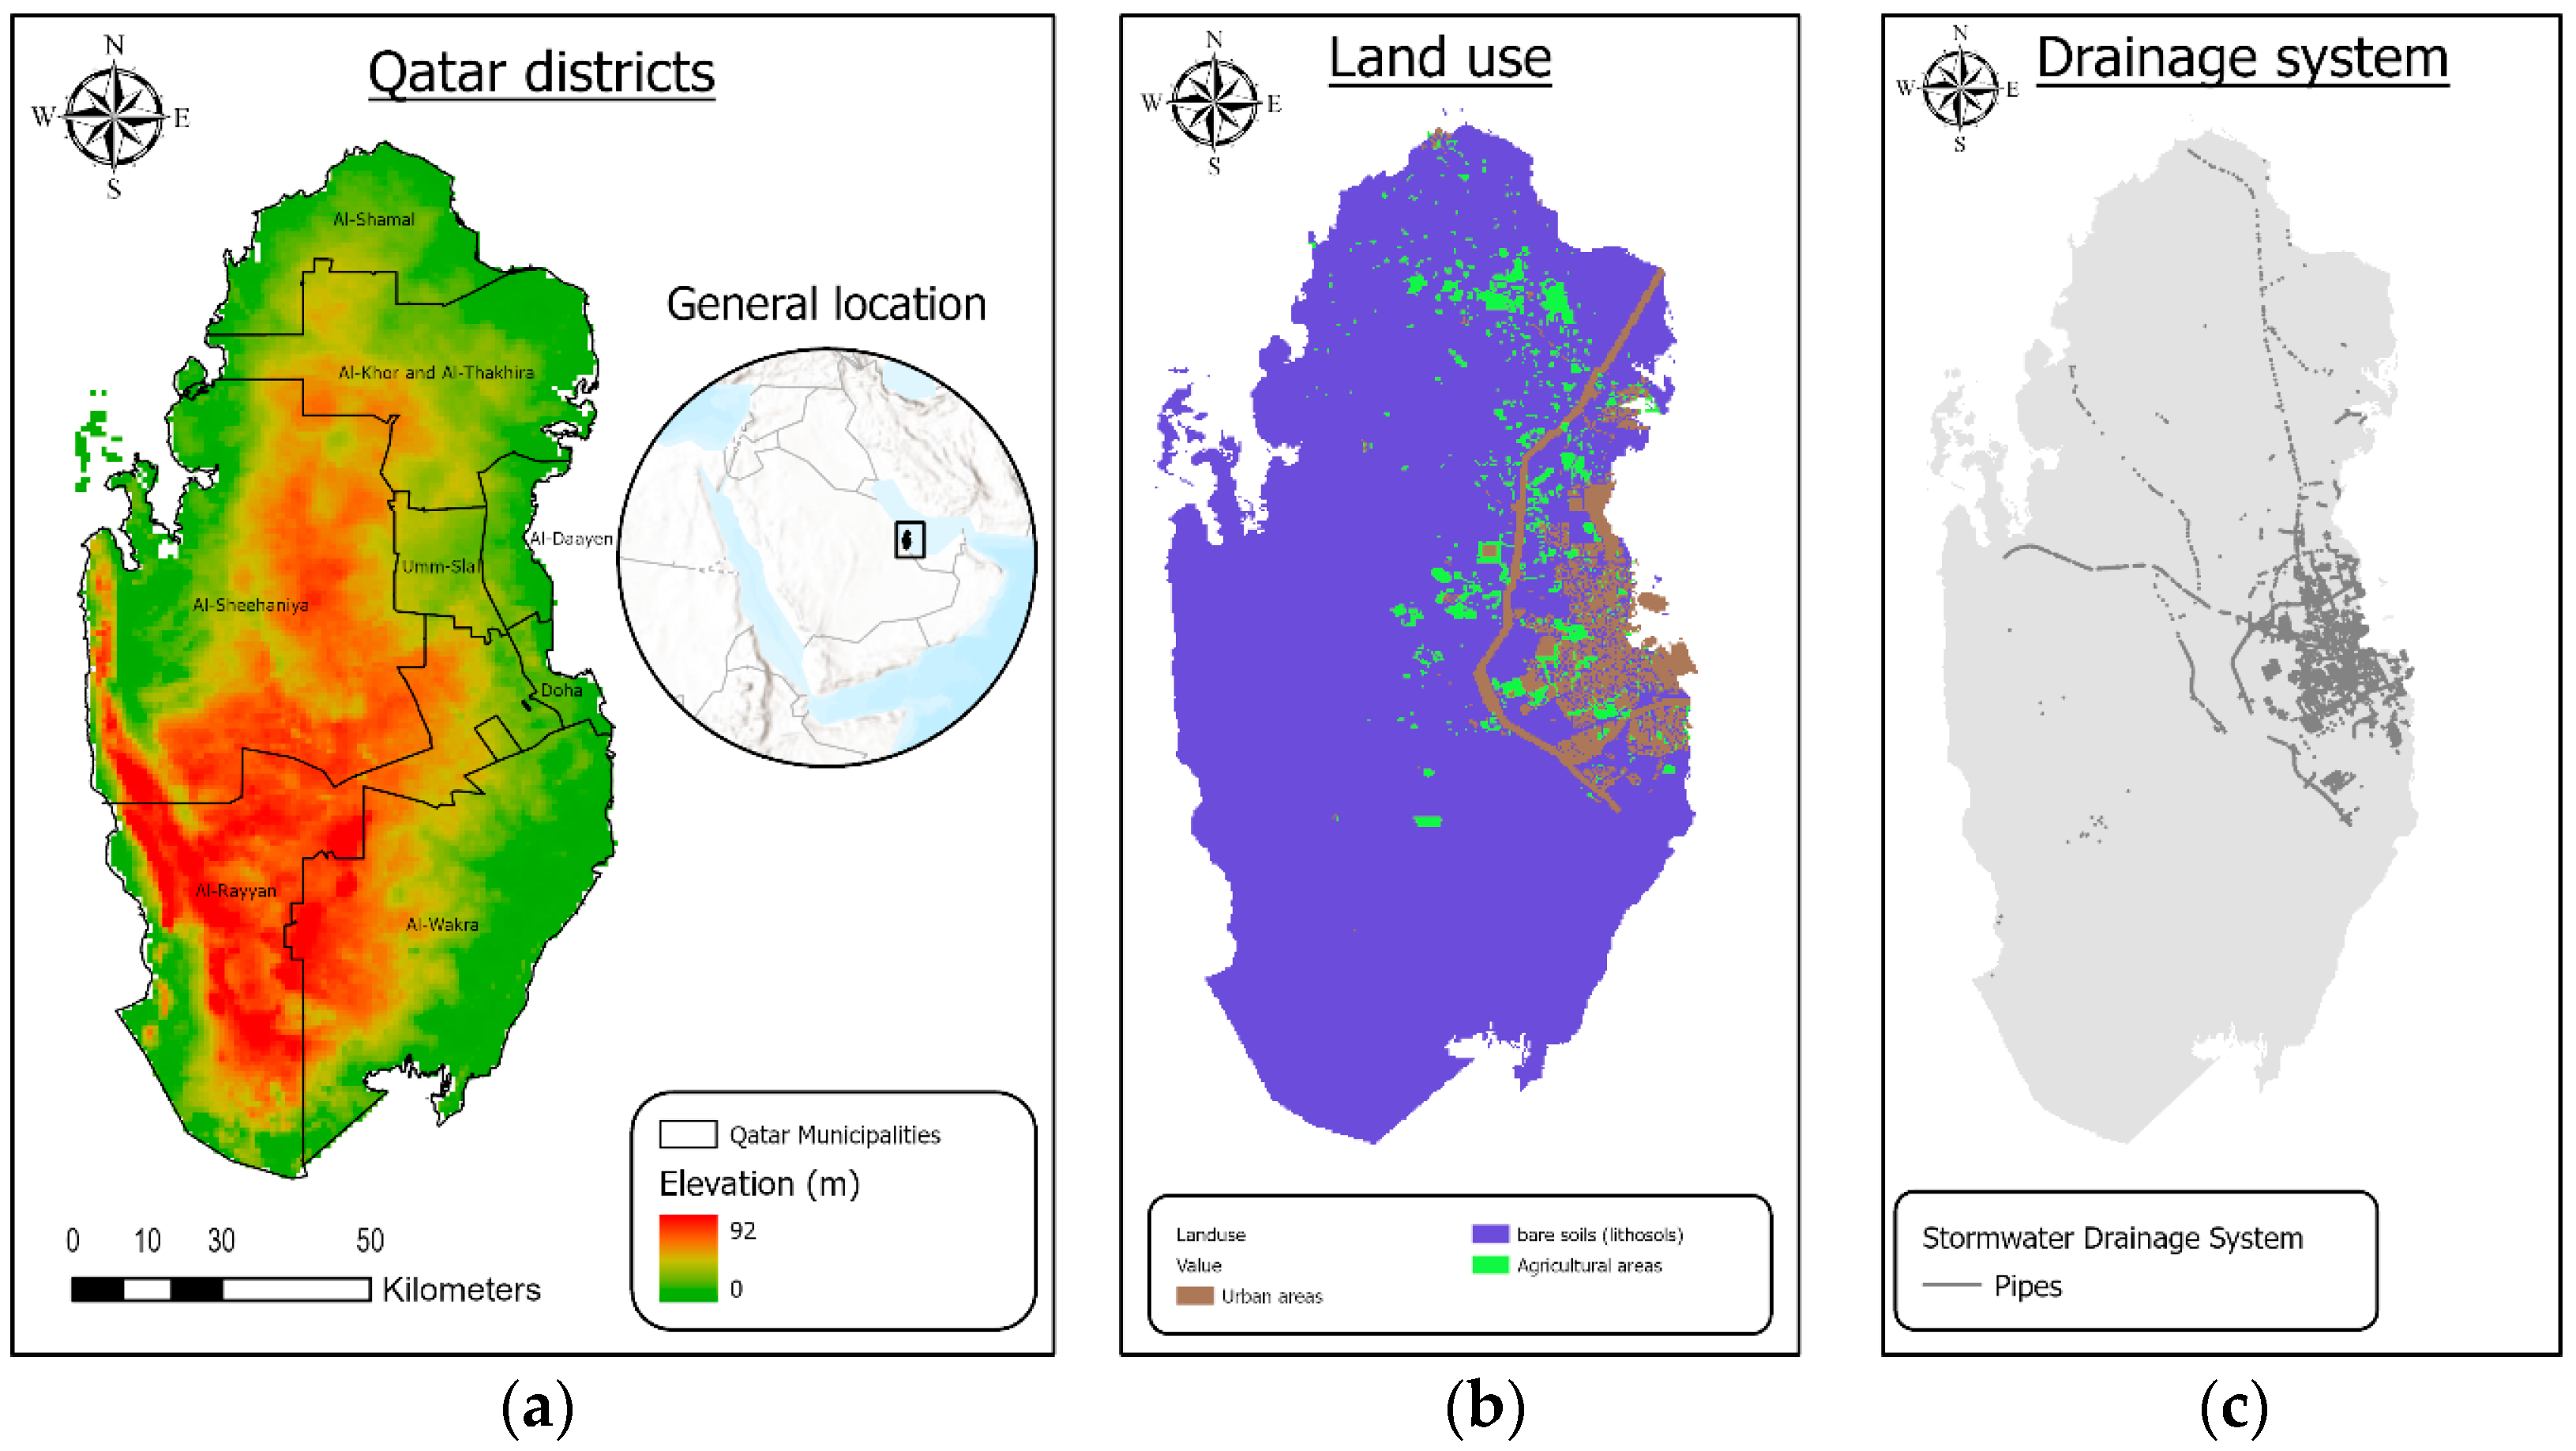
Study Area Description
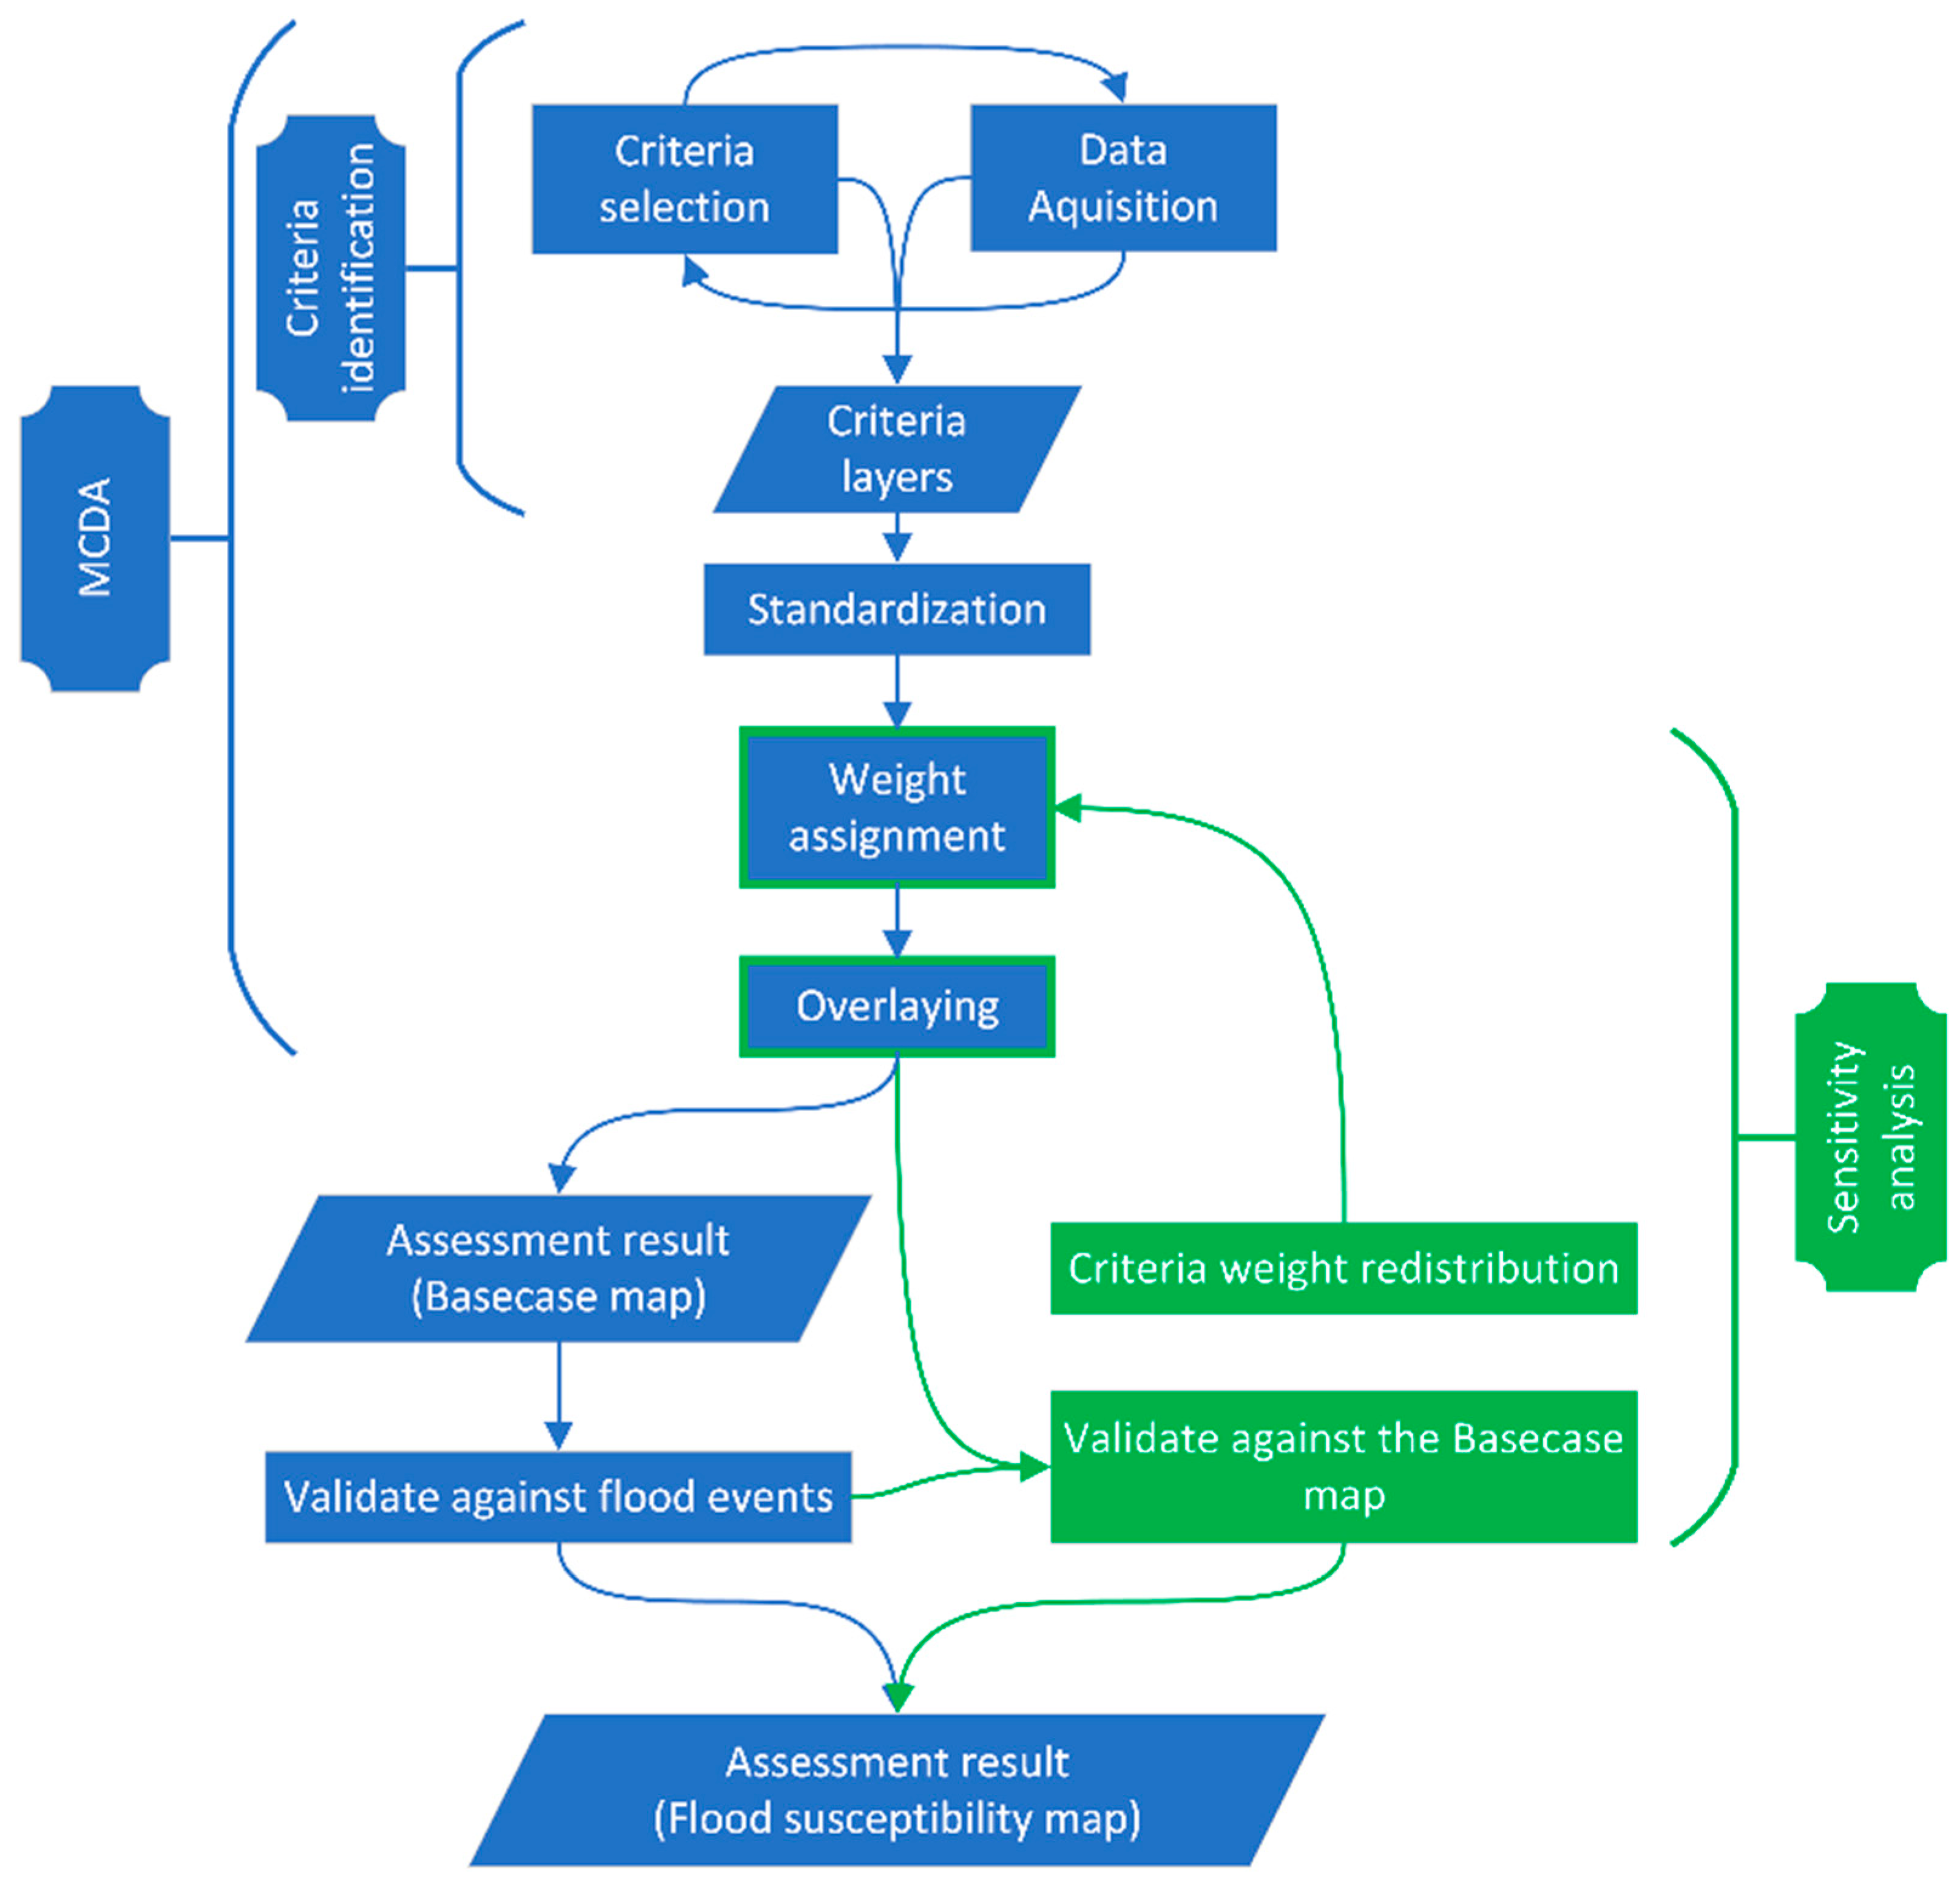
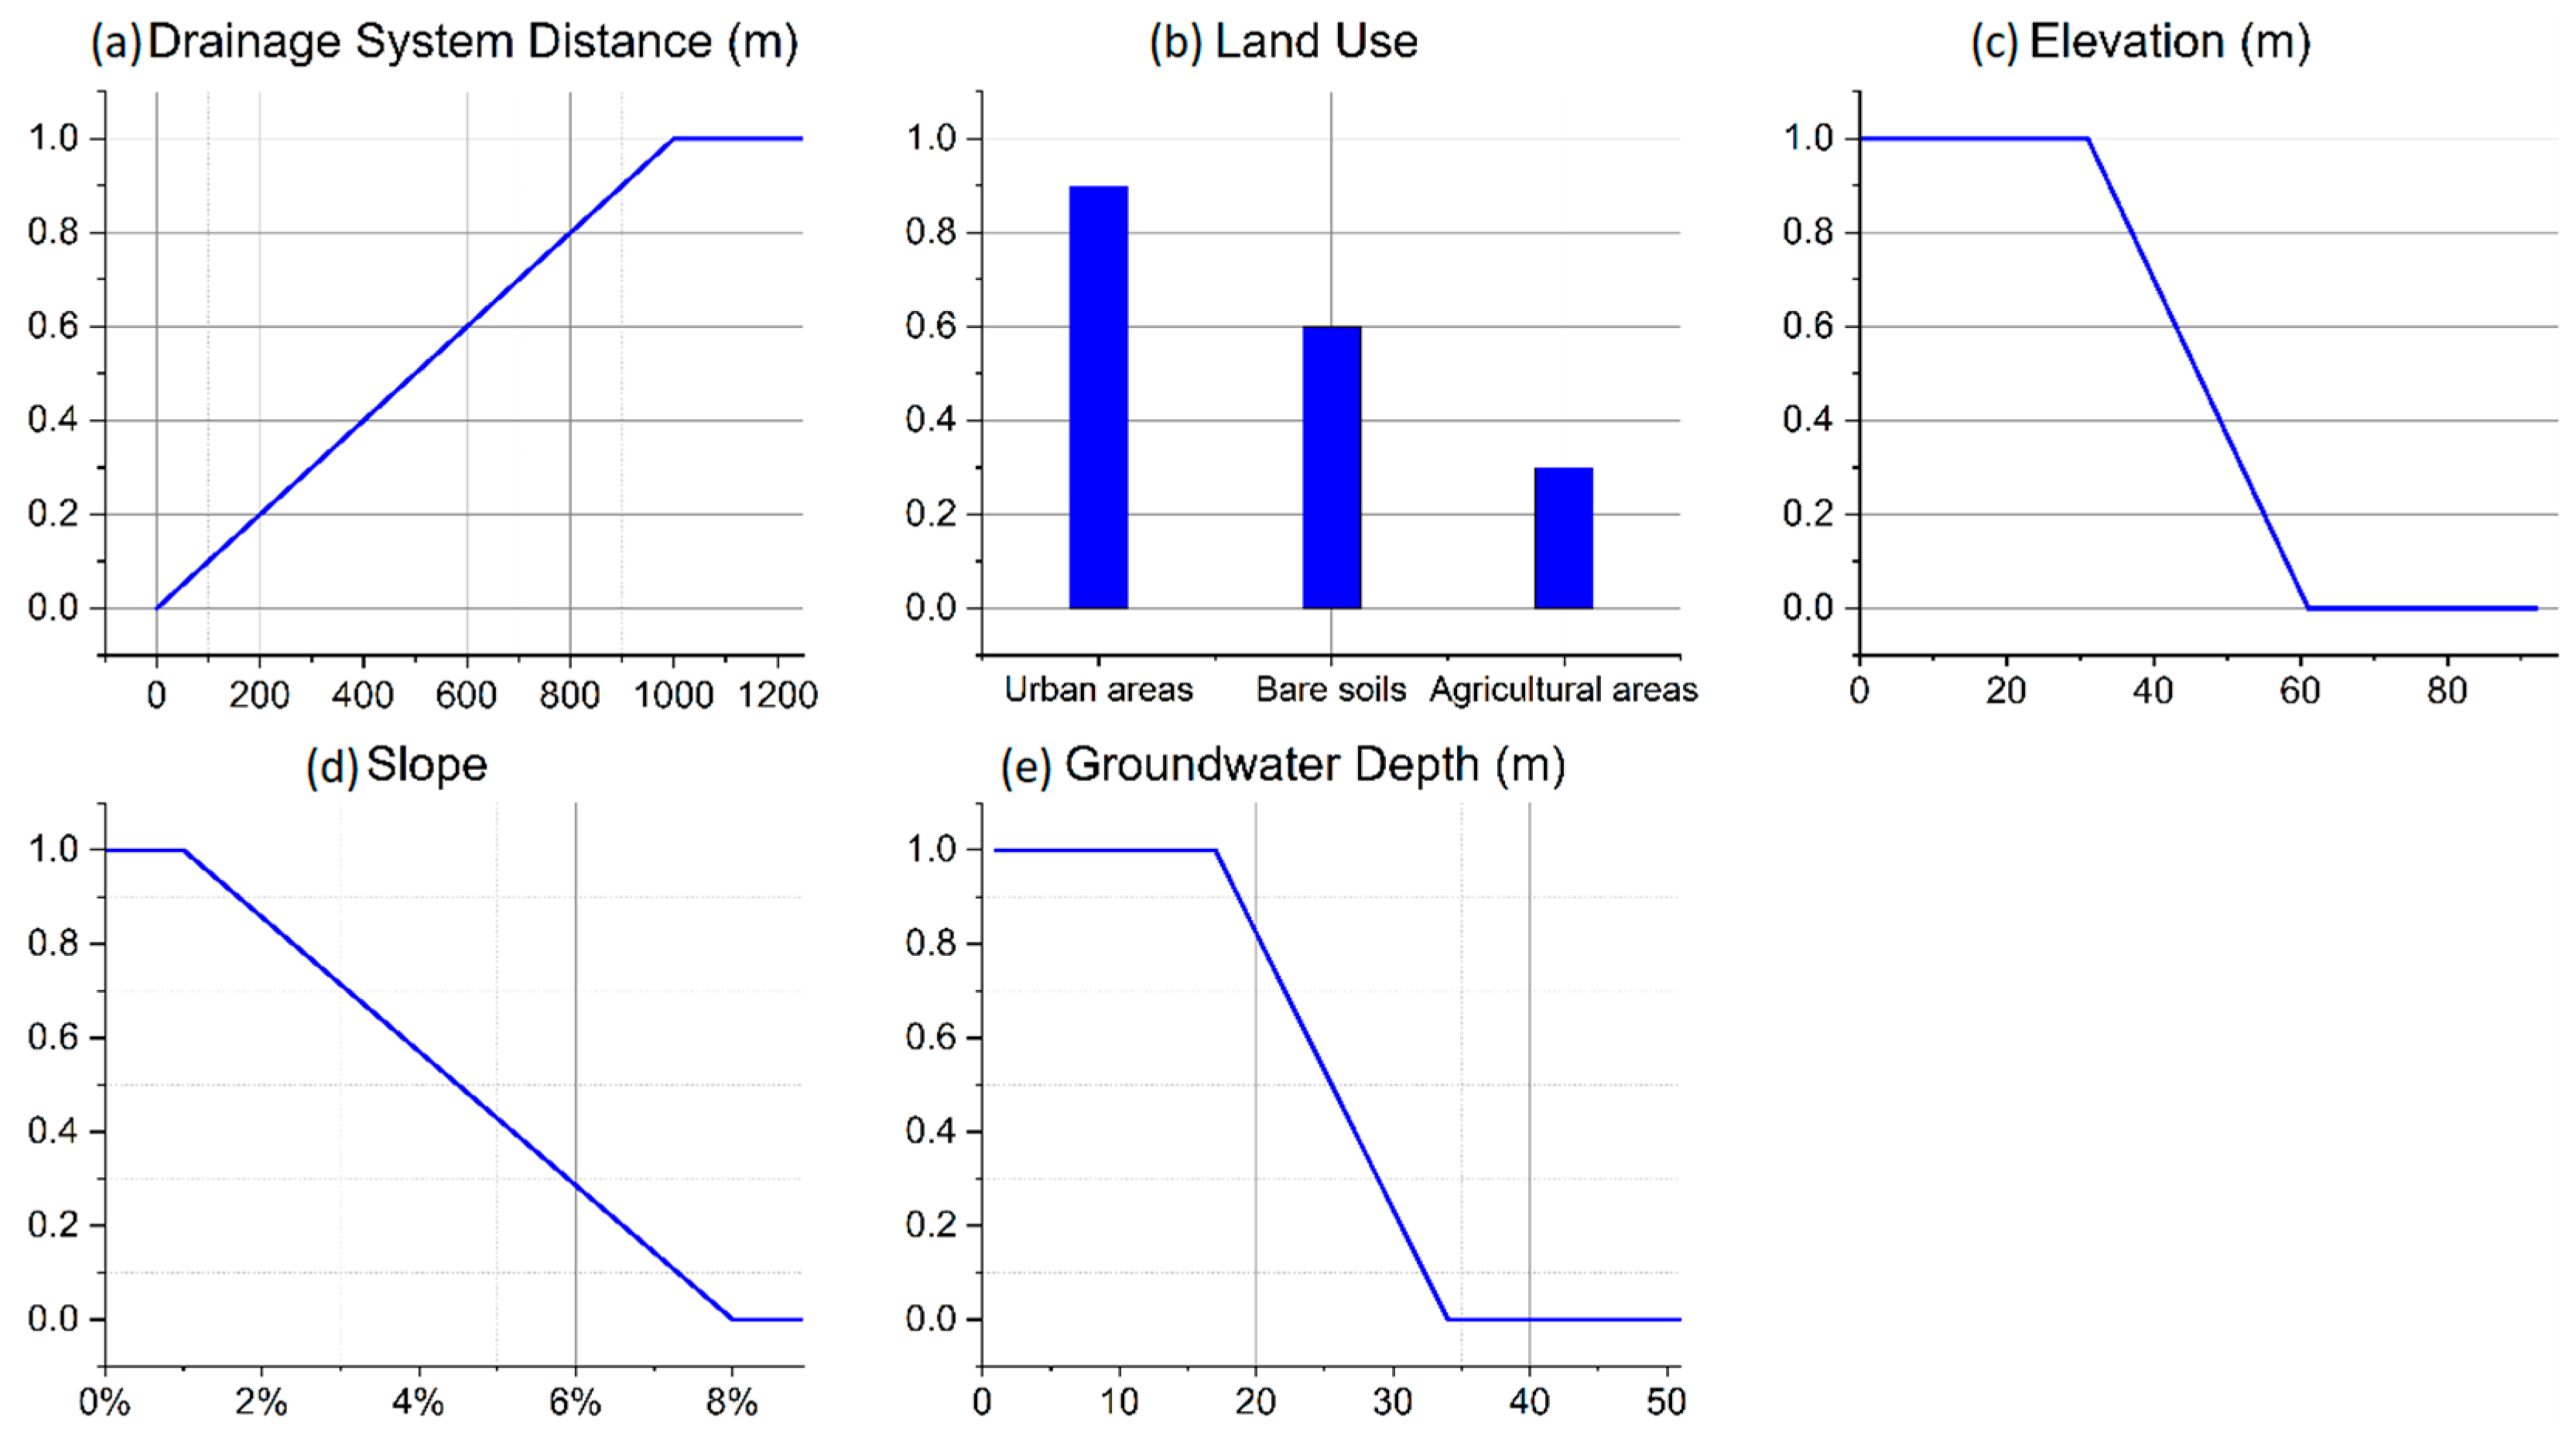
2. Materials and Methods
3. Results and Discussion
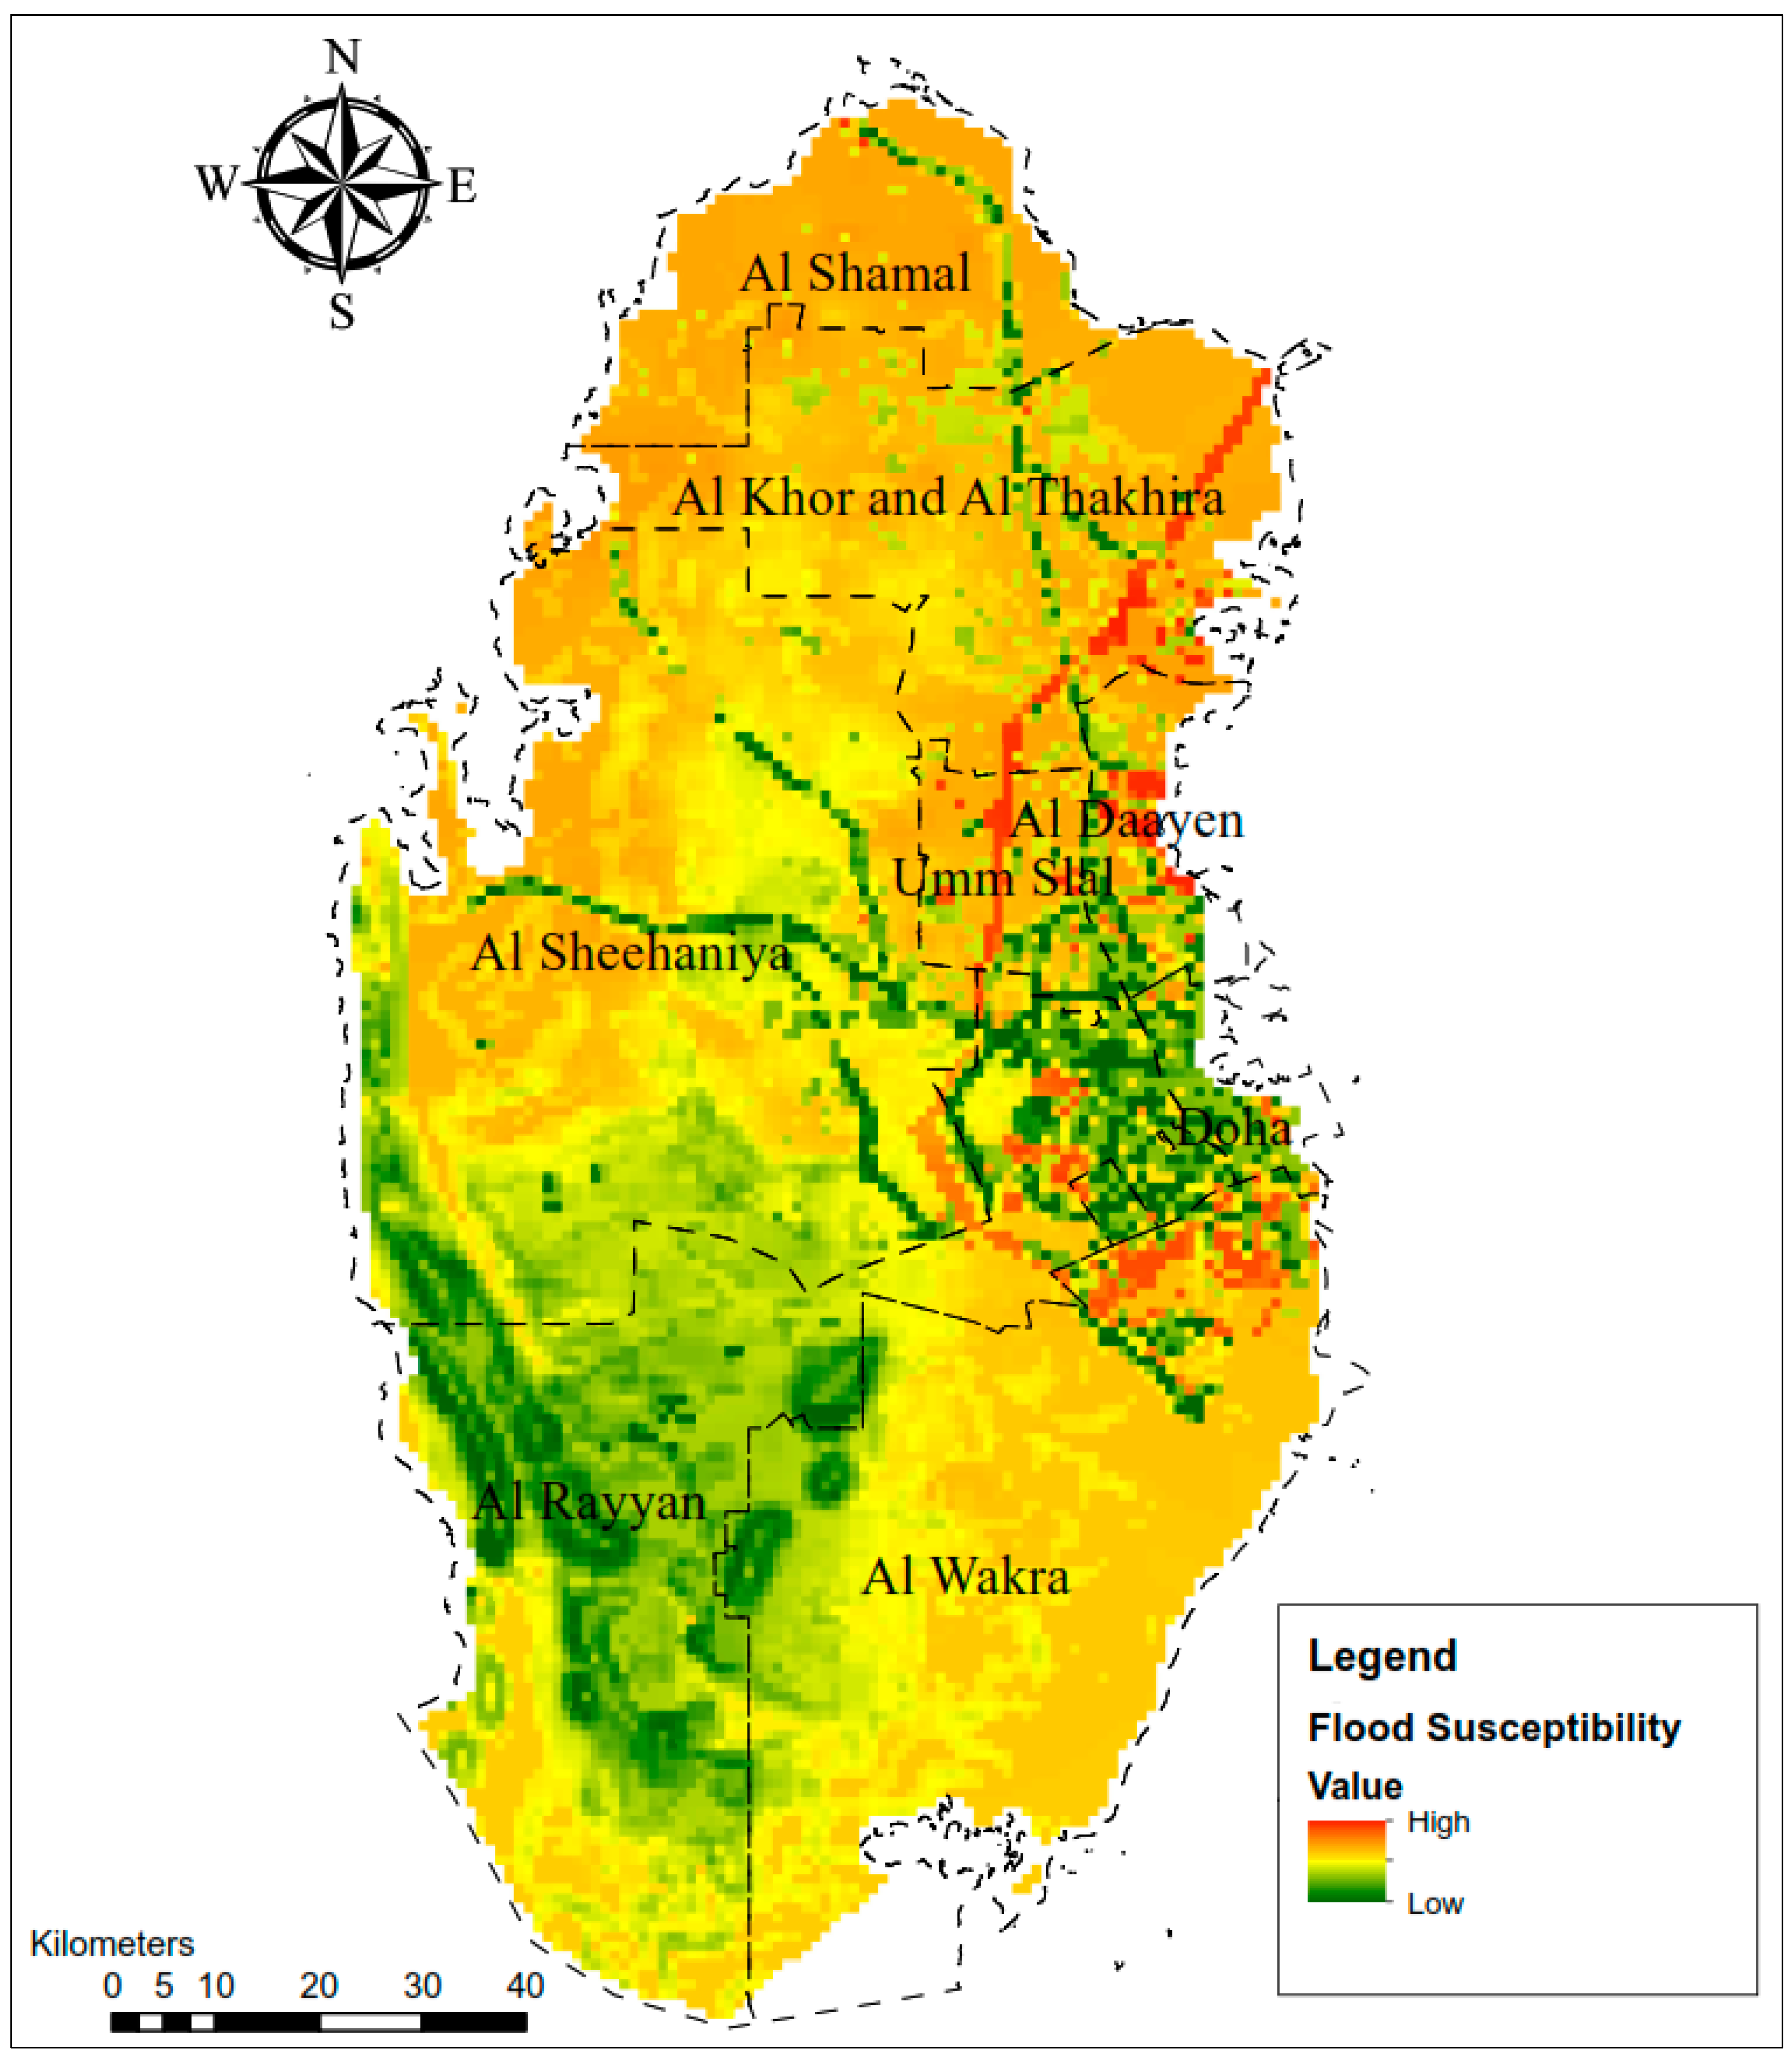
3.1. Flood Susceptibility Assessment
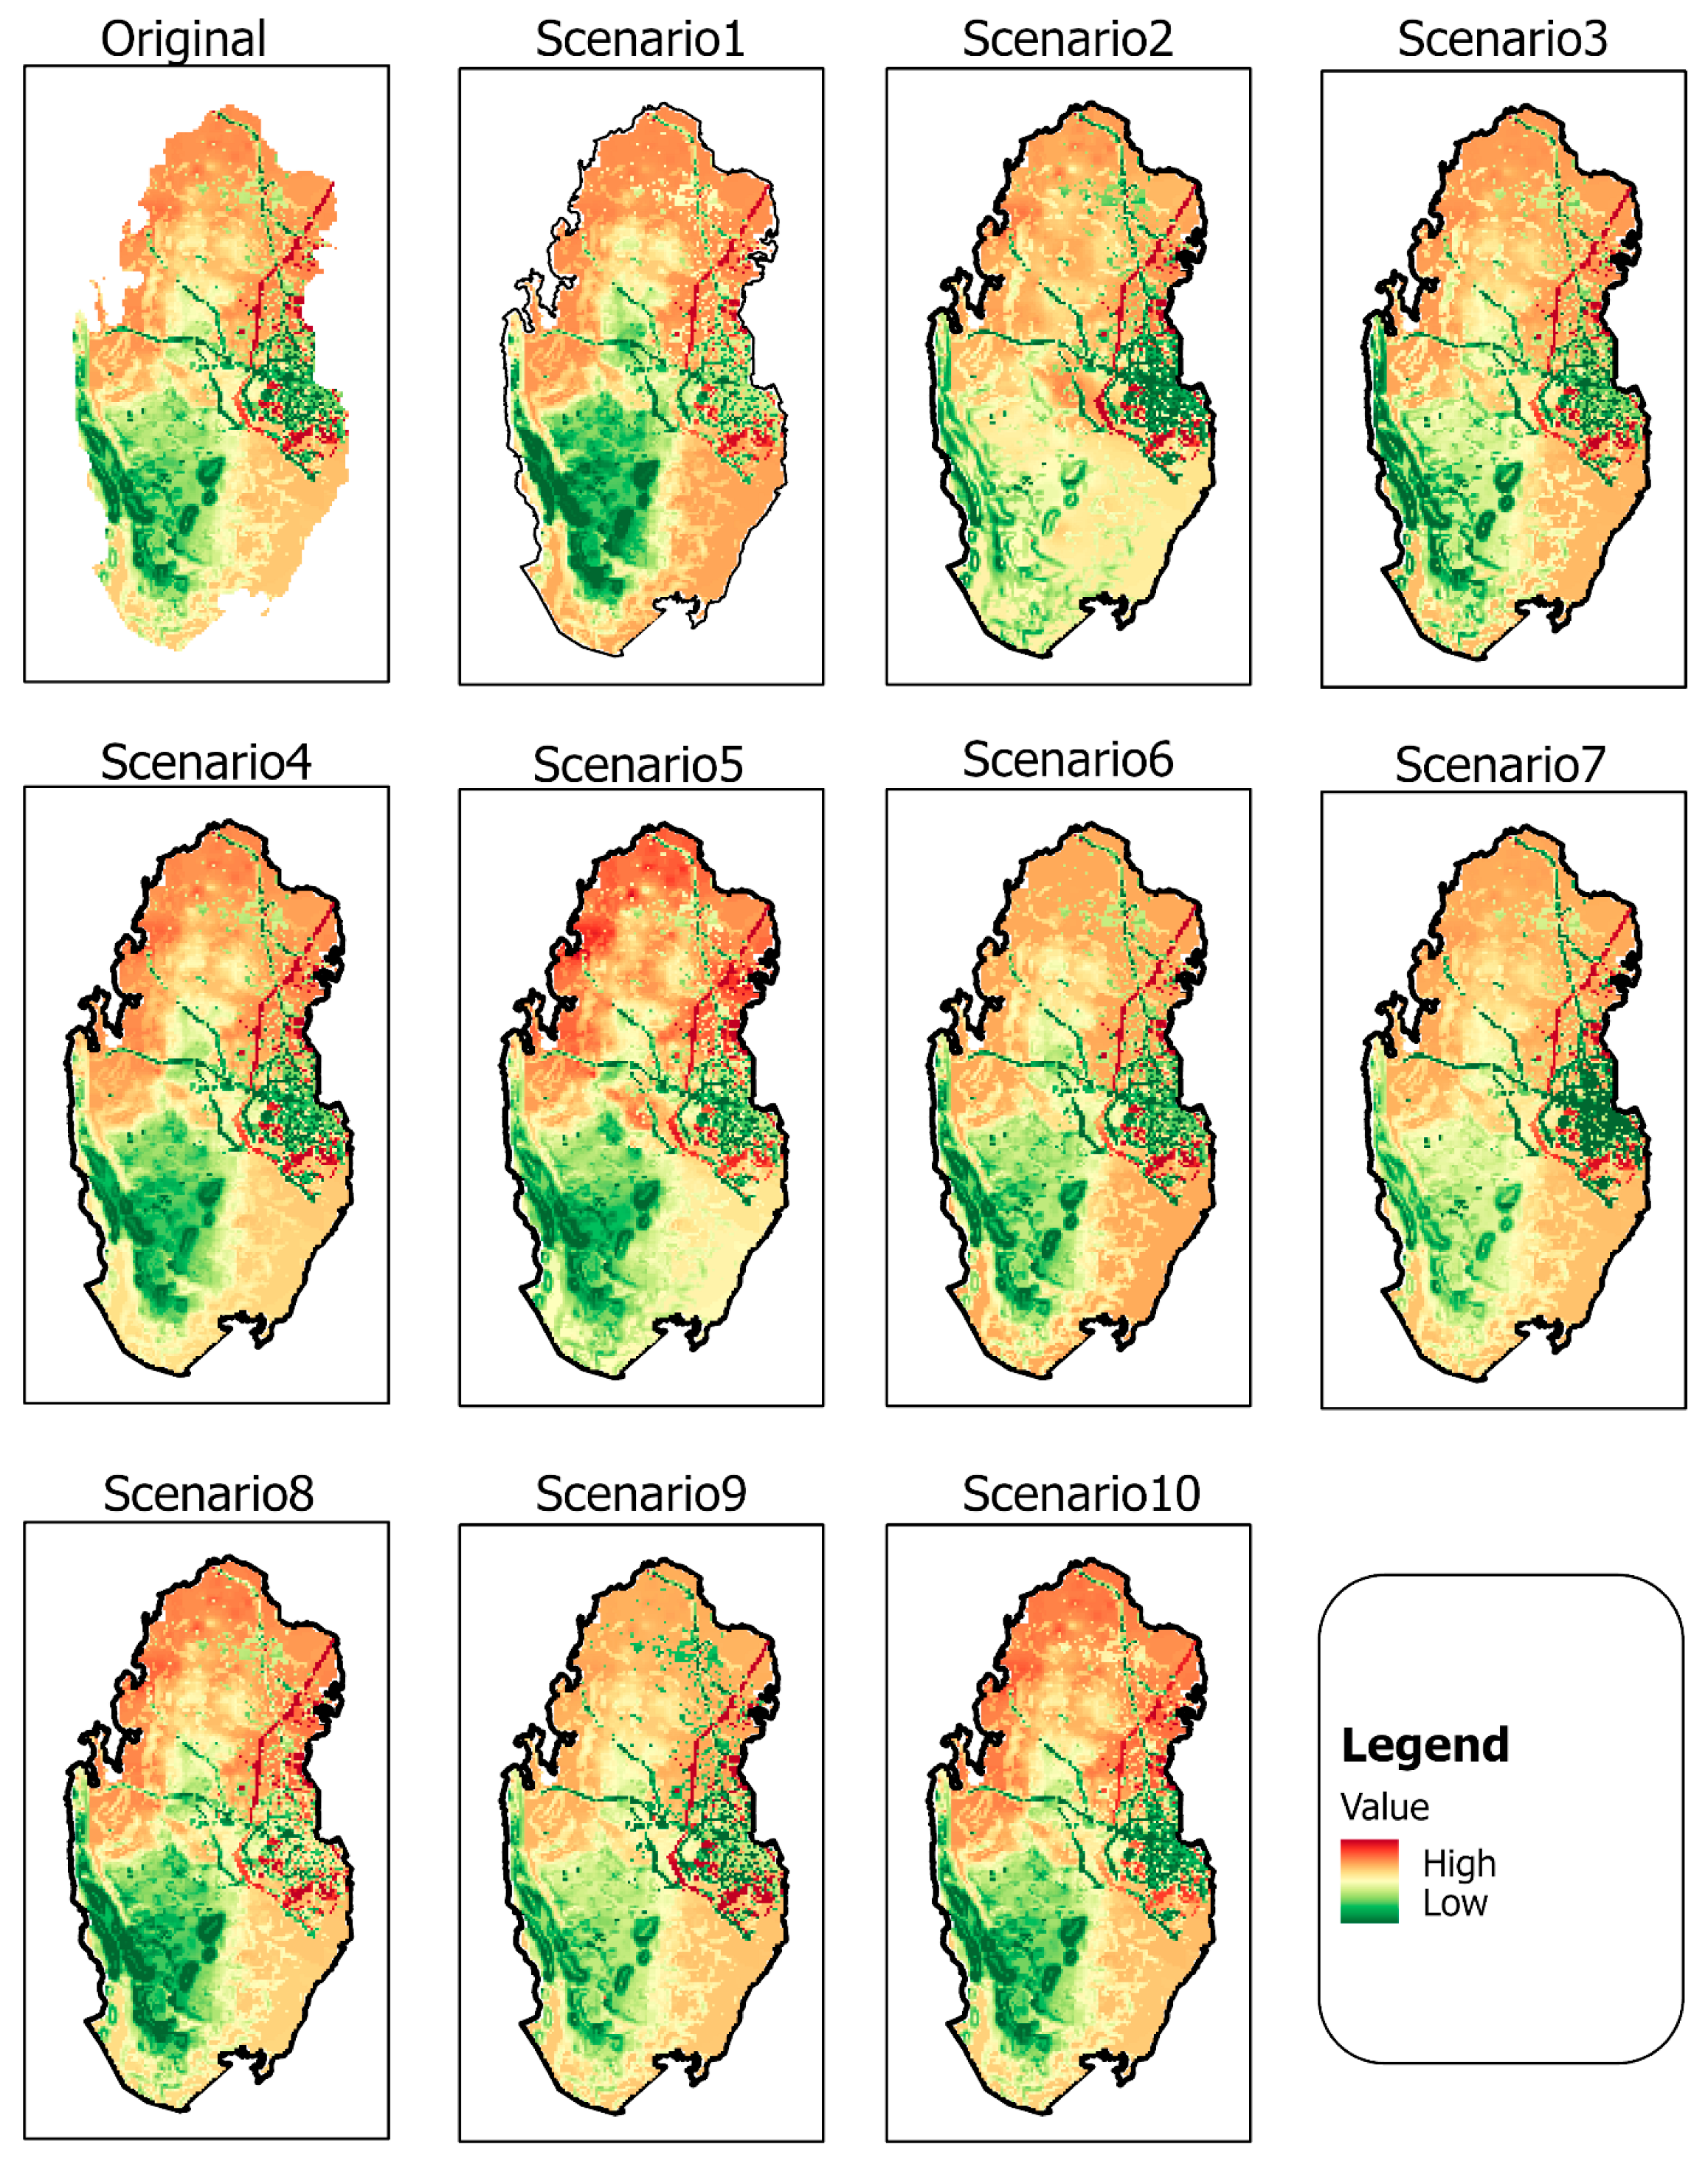
3.2. The Uncertainty Associated with Flood Susceptibility Assessment
4. Conclusions
Author Contributions
Funding
Data Availability Statement
Acknowledgments
Conflicts of Interest
References
- Salimi, M.; Al-Ghamdi, S.G. Climate Change Impacts on Critical Urban Infrastructure and Urban Resiliency Strategies for the Middle East. Sustain. Cities Soc. 2020, 54, 101948. [Google Scholar] [CrossRef]
- Serdar, M.Z.; Al-Ghamdi, S.G. Preparing for the Unpredicted: A Resiliency Approach in Energy System Assessment. In Green Energy and Technology; Ren, J., Ed.; Springer International Publishing: Cham, Switzerland, 2021; pp. 183–201. ISBN 978-3-030-67529-5. [Google Scholar]
- United Nations, Department of Economic and Social Affairs. World Urbanization Prospects: The 2018 Revision; United Nations Publications: New York, NY, USA, 2019. [Google Scholar]
- Ajjur, S.B.; Al-Ghamdi, S.G. Global Hotspots for Future Absolute Temperature Extremes From CMIP6 Models. Earth Space Sci. 2021, 8, e01817. [Google Scholar] [CrossRef]
- The Core Writing Team IPCC. Climate Change 2014: Synthesis Report. Contribution of Working Groups I, II and III to the Fifth Assessment Report of the Intergovernmental Panel on Climate Change; United Nations Department of Economic and Social Affairs: New York, NY, USA, 2015. [Google Scholar]
- Dabbeek, J.; Silva, V.; Galasso, C.; Smith, A. Probabilistic Earthquake and Flood Loss Assessment in the Middle East. Int. J. Disaster Risk Reduct. 2020, 49, 101662. [Google Scholar] [CrossRef]
- Mahmoud, S.H.; Gan, T.Y. Multi-Criteria Approach to Develop Flood Susceptibility Maps in Arid Regions of Middle East. J. Clean. Prod. 2018, 196, 216–229. [Google Scholar] [CrossRef]
- Serdar, M.Z.; Al-Ghamdi, S.G. Resiliency Assessment of Road Networks during Mega Sport Events: The Case of FIFA World Cup Qatar 2022. Sustainability 2021, 13, 12367. [Google Scholar] [CrossRef]
- Yazdani, M.; Mojtahedi, M.; Loosemore, M.; Sanderson, D. A Modelling Framework to Design an Evacuation Support System for Healthcare Infrastructures in Response to Major Flood Events. Prog. Disaster Sci. 2022, 13, 100218. [Google Scholar] [CrossRef]
- Lee Siew Len, N.; Bolong, N.; Roslee, R.; Tongkul, F.; Mirasa, A.K.; Ayog, J.L. Flood Vulnerability of Critical Infrastructures—Review. Malays. J. Geosci. 2018, 2, 34–37. [Google Scholar] [CrossRef]
- Mijalkovic, S.; Cvetković, V.M. Vulnerability of Critical Infrastructure by Natural Disasters; The Academy of Criminalistic and Police Studies: Belgrade, Serbia, 2013. [Google Scholar]
- Morrison, A.; Westbrook, C.J.; Noble, B.F. A Review of the Flood Risk Management Governance and Resilience Literature. J. Flood Risk Manag. 2018, 11, 291–304. [Google Scholar] [CrossRef]
- Kourtis, I.M.; Tsihrintzis, V.A. Adaptation of Urban Drainage Networks to Climate Change: A Review. Sci. Total Environ. 2021, 771, 145431. [Google Scholar] [CrossRef]
- Alfieri, L.; Feyen, L.; Di Baldassarre, G. Increasing Flood Risk under Climate Change: A Pan-European Assessment of the Benefits of Four Adaptation Strategies. Clim. Chang. 2016, 136, 507–521. [Google Scholar] [CrossRef] [Green Version]
- Mudashiru, R.B.; Sabtu, N.; Abustan, I.; Balogun, W. Flood Hazard Mapping Methods: A Review. J. Hydrol. 2021, 603, 126846. [Google Scholar] [CrossRef]
- Messner, F.; Meyer, V. Flood Damage, Vulnerability and Risk Perception—Challenges for Flood Damage Research. In Flood Risk Management: Hazards, Vulnerability and Mitigation Measures; Springer: Dordrecht, The Netherlands, 2007; pp. 149–167. [Google Scholar]
- Smith, K.; Ward, R. Mitigating and Managing Flood Losses. In Floods: Physical Processes and Human Impacts; Wiley: Hoboken, NJ, USA, 1998. [Google Scholar]
- Qi, W.; Ma, C.; Xu, H.; Chen, Z.; Zhao, K.; Han, H. A Review on Applications of Urban Flood Models in Flood Mitigation Strategies. Nat. Hazards 2021, 108, 31–62. [Google Scholar] [CrossRef]
- Hou, J.; Liu, F.; Tong, Y.; Guo, K.; Ma, L.; Li, D. Numerical Simulation for Runoff Regulation in Rain Garden Using 2D Hydrodynamic Model. Ecol. Eng. 2020, 153, 105794. [Google Scholar] [CrossRef]
- Sohn, W.; Kim, J.-H.; Li, M.-H.; Brown, R. The Influence of Climate on the Effectiveness of Low Impact Development: A Systematic Review. J. Environ. Manag. 2019, 236, 365–379. [Google Scholar] [CrossRef]
- Serdar, M.Z.; Koç, M.; Al-Ghamdi, S.G. Urban Transportation Networks Resilience: Indicators, Disturbances, and Assessment Methods. Sustain. Cities Soc. 2022, 76, 103452. [Google Scholar] [CrossRef]
- Teng, J.; Jakeman, A.J.; Vaze, J.; Croke, B.F.W.; Dutta, D.; Kim, S. Flood Inundation Modelling: A Review of Methods, Recent Advances and Uncertainty Analysis. Environ. Model. Softw. 2017, 90, 201–216. [Google Scholar] [CrossRef]
- Nguyen, P.; Thorstensen, A.; Sorooshian, S.; Hsu, K.; AghaKouchak, A.; Sanders, B.; Koren, V.; Cui, Z.; Smith, M. A High Resolution Coupled Hydrologic–Hydraulic Model (HiResFlood-UCI) for Flash Flood Modeling. J. Hydrol. 2016, 541, 401–420. [Google Scholar] [CrossRef] [Green Version]
- Fernández-Pato, J.; García-Navarro, P. Development of a New Simulation Tool Coupling a 2D Finite Volume Overland Flow Model and a Drainage Network Model. Geosciences 2018, 8, 288. [Google Scholar] [CrossRef] [Green Version]
- Khosravi, K.; Shahabi, H.; Pham, B.T.; Adamowski, J.; Shirzadi, A.; Pradhan, B.; Dou, J.; Ly, H.-B.; Gróf, G.; Ho, H.L.; et al. A Comparative Assessment of Flood Susceptibility Modeling Using Multi-Criteria Decision-Making Analysis and Machine Learning Methods. J. Hydrol. 2019, 573, 311–323. [Google Scholar] [CrossRef]
- de Brito, M.M.; Evers, M. Multi-Criteria Decision-Making for Flood Risk Management: A Survey of the Current State of the Art. Nat. Hazards Earth Syst. Sci. 2016, 16, 1019–1033. [Google Scholar] [CrossRef] [Green Version]
- Papaioannou, G.; Vasiliades, L.; Loukas, A. Multi-Criteria Analysis Framework for Potential Flood Prone Areas Mapping. Water Resour. Manag. 2015, 29, 399–418. [Google Scholar] [CrossRef]
- Chandio, I.A.; Matori, A.N.B.; WanYusof, K.B.; Talpur, M.A.H.; Balogun, A.-L.; Lawal, D.U. GIS-Based Analytic Hierarchy Process as a Multicriteria Decision Analysis Instrument: A Review. Arab. J. Geosci. 2013, 6, 3059–3066. [Google Scholar] [CrossRef]
- Wang, Y.; Hong, H.; Chen, W.; Li, S.; Pamučar, D.; Gigović, L.; Drobnjak, S.; Bui, D.T.; Duan, H. A Hybrid GIS Multi-Criteria Decision-Making Method for Flood Susceptibility Mapping at Shangyou, China. Remote Sens. 2018, 11, 62. [Google Scholar] [CrossRef] [Green Version]
- Fernández, D.S.; Lutz, M.A. Urban Flood Hazard Zoning in Tucumán Province, Argentina, Using GIS and Multicriteria Decision Analysis. Eng. Geol. 2010, 111, 90–98. [Google Scholar] [CrossRef]
- Al-Maskari, J. How the National Forecasting Centre in Oman Dealt with Tropical Cyclone Gonu. Trop. Cyclone Res. Rev. 2012, 1, 16–22. [Google Scholar] [CrossRef]
- Mahmoud, M. Cyclone Shaheen: A Reminder of the Arabian Peninsula’s Vulnerability to Extreme Weather Events|Middle East Institute. Available online: https://www.mei.edu/publications/cyclone-shaheen-reminder-arabian-peninsulas-vulnerability-extreme-weather-events (accessed on 27 November 2021).
- Almazroui, M. Simulation of Present and Future Climate of Saudi Arabia Using a Regional Climate Model (PRECIS). Int. J. Climatol. 2013, 33, 2247–2259. [Google Scholar] [CrossRef]
- Alamri, Y. Emergency Management in Saudi Arabia: Past, Present and Future. In Comparative Emergency Management: Understanding Disaster Policies, Organizations and Initiatives from Around the World; Federal Emergency Management Agency: Washington, DC, USA, 2010; pp. 1–21. ISBN 2197-425X. [Google Scholar]
- Haggag, M.; El-Badry, H. Mesoscale Numerical Study of Quasi-Stationary Convective System over Jeddah in November 2009. Atmos. Clim. Sci. 2013, 3, 73–86. [Google Scholar] [CrossRef] [Green Version]
- Ledraa, T.; Al-Ghamdi, A. Planning and Management Issues and Challenges of Flash Flooding Disasters in Saudi Arabia: The Case of Riyadh City. J. Archit. Plan. 2019, 32, 155–171. [Google Scholar] [CrossRef]
- Almousawi, D.; Almedeij, J.; Alsumaiei, A.A. Impact of Urbanization on Desert Flash Flood Generation. Arab. J. Geosci. 2020, 13, 441. [Google Scholar] [CrossRef]
- Aldosari, D.; Almedeij, J.; Alsumaiei, A.A. Update of Intensity–Duration–Frequency Curves for Kuwait Due to Extreme Flash Floods. Environ. Ecol. Stat. 2020, 27, 491–507. [Google Scholar] [CrossRef]
- Hassan, A.; Albanai, J.; Goudie, A. Modeling and Managing Flash Flood Hazards in the State of Kuwait. Preprints 2021, 2021070011. [Google Scholar] [CrossRef]
- Elhakeem, M. Flood Prediction at The Northern Region of UAE. MATEC Web Conf. 2017, 103, 04004. [Google Scholar] [CrossRef] [Green Version]
- Al-Awadhi, T.; Charabi, Y.; Choudri, B.S. Pathways for Building Urban Resilience to Climate Change in Oman. Dev. Pract. 2019, 29, 594–605. [Google Scholar] [CrossRef]
- Serdar, M.Z.; Koc, M.; Al-Ghamdi, S.G. Urban Infrastructure Resilience Assessment During Mega Sport Events Using a Multi-Criteria Approach. Front. Sustain. 2021, 2, 673797. [Google Scholar] [CrossRef]
- Al Mamoon, A.; Regan, B.; Sylianteng, C.; Rahman, A.; Alkader, A.A.A. Flood study in Qatar: Challenges and opportunities. In Proceedings of the 36th Hydrology And Water Resources Symposium (Hwrs 2015): The Art And Science Of Water, Hobart, Tasmania, 7–10 December 2015. [Google Scholar]
- Davies, R. Qatar—Flash Floods after Year’s Worth of Rain in One Day—FloodList. Available online: https://floodlist.com/asia/qatar-floods-october-2018 (accessed on 28 November 2021).
- Al Mamoon, A. Flood Risk Assessment and Protection Guidelines for Infrastructure Planning in Qatar. In Proceedings of the International Conference on Civil Infrastructure and Construction (CIC 2020), Doha, Qatar, 2–5 February 2020; Qatar University Press: Doha, Qatar, 2020; pp. 621–627. [Google Scholar]
- Al Mamoon, A.; Rahman, A. Rainfall in Qatar: Is It Changing? Nat. Hazards 2017, 85, 453–470. [Google Scholar] [CrossRef]
- Ajjur, S.B.; Al-Ghamdi, S.G.; Baalousha, H.M. Sustainable Development of Qatar Aquifers under Global Warming Impact. Int. J. Glob. Warm. 2021, 25, 323–338. [Google Scholar] [CrossRef]
- Tahir, F.; Baloch, A.A.B.; Ali, H. Resilience of Desalination Plants for Sustainable Water Supply in Middle East; Springer: Cham, Switzerland, 2020; pp. 303–329. [Google Scholar]
- Ajjur, S.B.; Al-Ghamdi, S.G. Evapotranspiration and Water Availability Response to Climate Change in the Middle East and North Africa. Clim. Chang. 2021, 166, 28. [Google Scholar] [CrossRef]
- Ajjur, S.B.; Al-Ghamdi, S.G. Seventy-Year Disruption of Seasons Characteristics in the Arabian Peninsula. Int. J. Climatol. 2021, 41, 5920–5937. [Google Scholar] [CrossRef]
- Kazakis, N.; Kougias, I.; Patsialis, T. Assessment of Flood Hazard Areas at a Regional Scale Using an Index-Based Approach and Analytical Hierarchy Process: Application in Rhodope–Evros Region, Greece. Sci. Total Environ. 2015, 538, 555–563. [Google Scholar] [CrossRef]
- Ajjur, S.B.; Mogheir, Y.K. Flood Hazard Mapping Using a Multi-Criteria Decision Analysis and GIS (Case Study Gaza Governorate, Palestine). Arab. J. Geosci. 2020, 13, 44. [Google Scholar] [CrossRef]
- Yaseen, A.; Lu, J.; Chen, X. Flood Susceptibility Mapping in an Arid Region of Pakistan through Ensemble Machine Learning Model. Stoch. Environ. Res. Risk Assess. 2022. [Google Scholar] [CrossRef]
- Mohammadi, A.; Kamran, K.V.; Karimzadeh, S.; Shahabi, H.; Al-Ansari, N. Flood Detection and Susceptibility Mapping Using Sentinel-1 Time Series, Alternating Decision Trees, and Bag-ADTree Models. Complexity 2020, 2020, 1–21. [Google Scholar] [CrossRef]
- Msabi, M.M.; Makonyo, M. Flood Susceptibility Mapping Using GIS and Multi-Criteria Decision Analysis: A Case of Dodoma Region, Central Tanzania. Remote Sens. Appl. Soc. Environ. 2021, 21, 100445. [Google Scholar] [CrossRef]
- Rahmati, O.; Zeinivand, H.; Besharat, M. Flood Hazard Zoning in Yasooj Region, Iran, Using GIS and Multi-Criteria Decision Analysis. Geomat. Nat. Hazards Risk 2016, 7, 1000–1017. [Google Scholar] [CrossRef] [Green Version]
- Tien Bui, D.; Pradhan, B.; Nampak, H.; Bui, Q.-T.; Tran, Q.-A.; Nguyen, Q.-P. Hybrid Artificial Intelligence Approach Based on Neural Fuzzy Inference Model and Metaheuristic Optimization for Flood Susceptibilitgy Modeling in a High-Frequency Tropical Cyclone Area Using GIS. J. Hydrol. 2016, 540, 317–330. [Google Scholar] [CrossRef]
- Chapi, K.; Singh, V.P.; Shirzadi, A.; Shahabi, H.; Bui, D.T.; Pham, B.T.; Khosravi, K. A Novel Hybrid Artificial Intelligence Approach for Flood Susceptibility Assessment. Environ. Model. Softw. 2017, 95, 229–245. [Google Scholar] [CrossRef]
- Al Muraikhi, R.; Al-Shafi, M. Video Showing Heavy Rain on Outskirts of Al Khor Goes Viral. Available online: https://s.thepeninsula.qa/nbgdyd (accessed on 16 January 2022).
- Yazdani, M.; Mojtahedi, M.; Loosemore, M.; Sanderson, D.; Dixit, V. Hospital Evacuation Modelling: A Critical Literature Review on Current Knowledge and Research Gaps. Int. J. Disaster Risk Reduct. 2021, 66, 102627. [Google Scholar] [CrossRef]
- Lim, H.; Lim, M.B.; PIANTANAKULCHAI, M. A Review of Recent Studies on Flood Evacuation Planning. J. East. Asia Soc. Transp. Stud. 2013, 10, 147–162. [Google Scholar] [CrossRef]


| Study | Selected Criteria |
|---|---|
| [51] | “(1) flow accumulation, (2) distance from the drainage network, (3) elevation, (4) land use, (5) rainfall intensity, and (6) geology” |
| [52] | “(1) distance to stormwater drainage network, (2) land use (cover), (3) height, (4) slope, and (5) groundwater depth” |
| [53] | “(1) elevation, (2) slope, (3) curvature, (4) Stream Power Index (SPI), (5) Topographic Wetness Index (TWI), (6) rainfall, (7) lithology, (8) soil type, (9) distance from stream, (10) stream density, (11) Normalized Difference Vegetation Index (NDVI), and (12) land use” |
| [54] | “(1) elevation, (2) normalized difference’s vegetation index, (3) slope, (4) topographic wetness index, (5) aspect, (6) curvature, (7) stream power index, (8) lithology, (9) drainage density, (10) proximities to river, (11) soil type, and (12) rainfall” |
| [55] | “(1) slope, (2) geology, (3) flow accumulation, (4) land use/cover, (5) drainage density, (6) elevation, (7) stream order, and (8) soil” |
| [56] | “(1) slope percent, (2) distance from rivers, (3) land use/land cover, and (4) and altitude” |
| Criterion | Source | Related Details |
|---|---|---|
| Elevation and Slope | Digital Elevation Model (DEM) from Ministry of Municipality and Environment (MME) in Qatar | Cell size 30 × 30 m, received on 20 September 2021, |
| Land use | MME | received on 20 September 2021, |
| Groundwater depth | Fieldwork by Schlumberger Water Service in 2019 for the MME | received on 20 September 2021, |
| Stormwater drainage system | ASHGHAL | received on 10 February 2022, |
| Criteria | Original | Scenarios | |||||||||
|---|---|---|---|---|---|---|---|---|---|---|---|
| 1 | 2 | 3 | 4 | 5 | 6 | 7 | 8 | 9 | 10 | ||
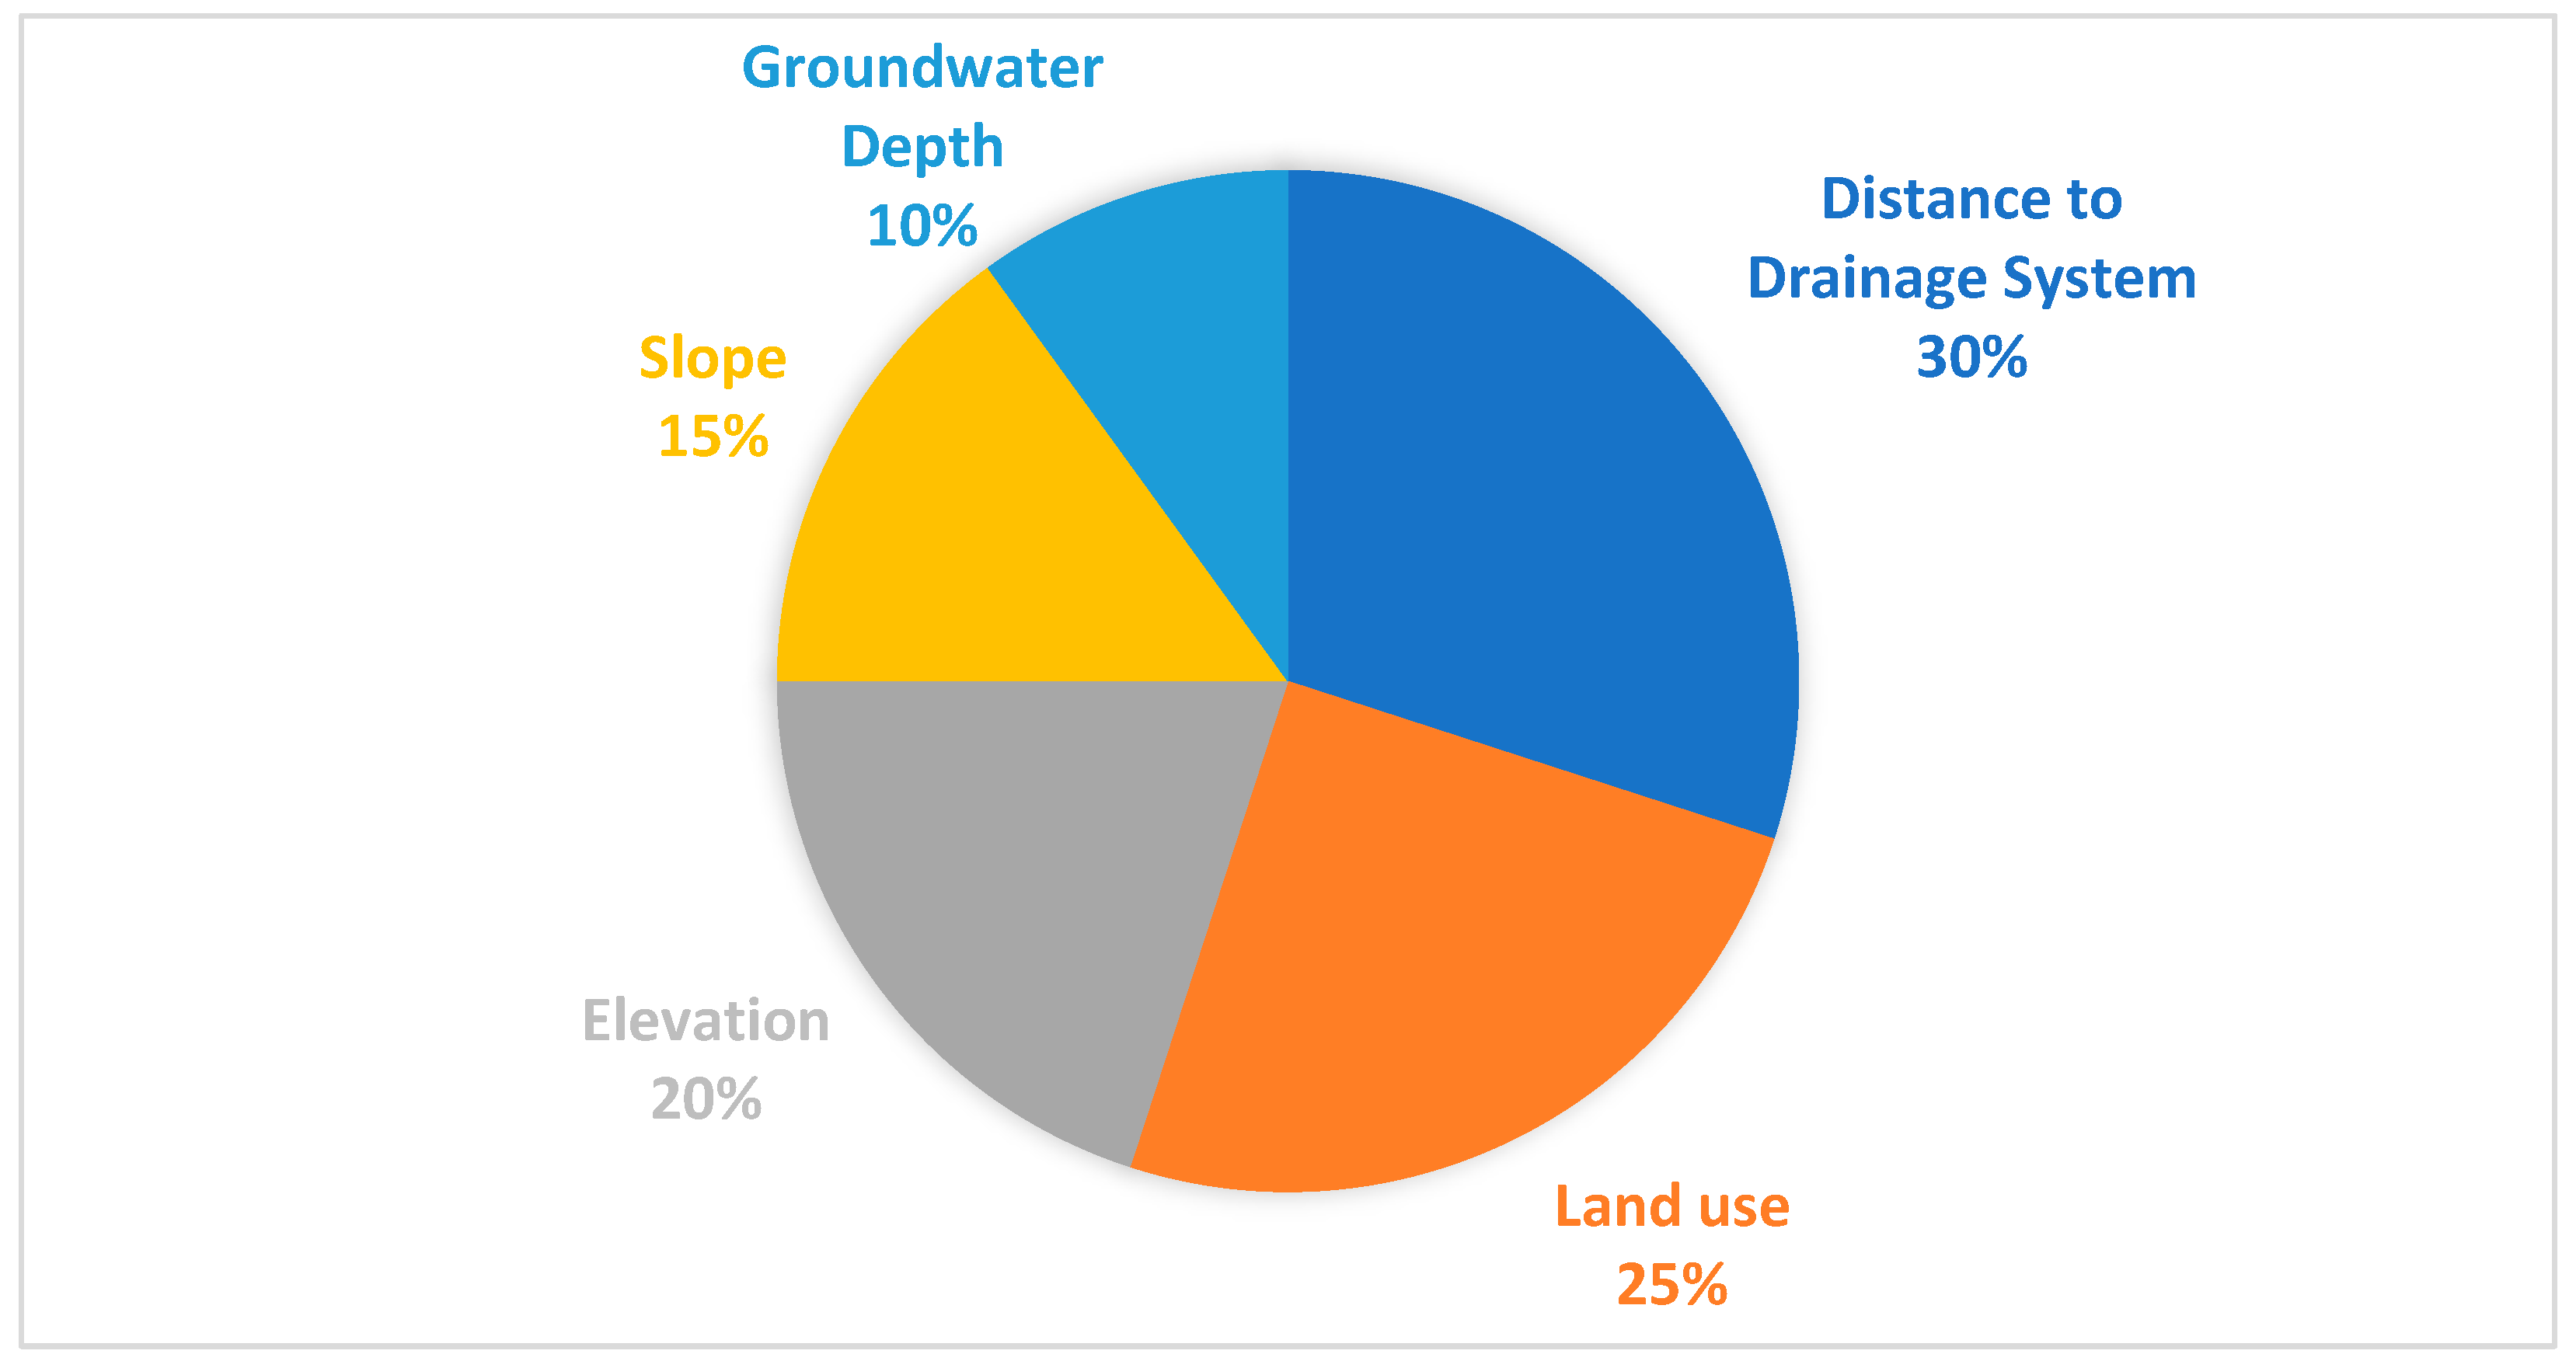
| Elevation | 20% | 30% | 10% | 17.5% | 22.5% | 17.5% | 22.5% | 17.5% | 22.5% | 17.5% | 22.5% |
| Slope | 15% | 12.5% | 17.5% | 25% | 5% | 12.5% | 17.5% | 12.5% | 17.5% | 12.5% | 17.5% |
| Groundwater depth | 10% | 7.5% | 12.5% | 7.5% | 12.5% | 20% | 0% | 7.5% | 12.5% | 7.5% | 12.5% |
| Distance to drainage system | 30% | 27.5% | 32.5% | 27.5% | 32.5% | 27.5% | 32.5% | 40% | 20% | 27.5% | 32.5% |
| Land use | 25% | 22.5% | 27.5% | 22.5% | 27.5% | 22.5% | 27.5% | 22.5% | 27.5% | 35% | 15% |
| Sum | 100% | 100% | 100% | 100% | 100% | 100% | 100% | 100% | 100% | 100% | 100% |
Publisher’s Note: MDPI stays neutral with regard to jurisdictional claims in published maps and institutional affiliations. |
© 2022 by the authors. Licensee MDPI, Basel, Switzerland. This article is an open access article distributed under the terms and conditions of the Creative Commons Attribution (CC BY) license (https://creativecommons.org/licenses/by/4.0/).
Share and Cite
Serdar, M.Z.; Ajjur, S.B.; Al-Ghamdi, S.G. Flood Susceptibility Assessment in Arid Areas: A Case Study of Qatar. Sustainability 2022, 14, 9792. https://doi.org/10.3390/su14159792
Serdar MZ, Ajjur SB, Al-Ghamdi SG. Flood Susceptibility Assessment in Arid Areas: A Case Study of Qatar. Sustainability. 2022; 14(15):9792. https://doi.org/10.3390/su14159792
Chicago/Turabian StyleSerdar, Mohammad Zaher, Salah Basem Ajjur, and Sami G. Al-Ghamdi. 2022. "Flood Susceptibility Assessment in Arid Areas: A Case Study of Qatar" Sustainability 14, no. 15: 9792. https://doi.org/10.3390/su14159792
APA StyleSerdar, M. Z., Ajjur, S. B., & Al-Ghamdi, S. G. (2022). Flood Susceptibility Assessment in Arid Areas: A Case Study of Qatar. Sustainability, 14(15), 9792. https://doi.org/10.3390/su14159792