Article

Physical Activity and Healthy Habits Influence Mood Profile Clusters in a Lithuanian Population

by
Peter C. Terry
1,*,†,
Renée L. Parsons-Smith
2,3,
Albertas Skurvydas
4,5,
Aušra Lisinskienė
4,
Daiva Majauskienė
4,
Dovilė Valančienė
4,
Sydney Cooper
6 and
Marc Lochbaum
4,7,†
1
Centre for Health Research, University of Southern Queensland, Toowoomba, QLD 4350, Australia
2
School of Psychology and Wellbeing, University of Southern Queensland, Toowoomba, QLD 4350, Australia
3
School of Health and Behavioural Sciences, University of the Sunshine Coast, Sippy Downs, QLD 4556, Australia
4
Institute of Educational Research, Education Academy, Vytautas Magnus University, 44248 Kaunas, Lithuania
5
Department of Rehabilitation, Physical and Sports Medicine, Institute of Health Sciences, Faculty of Medicine, Vilnius University, 03101 Vilnius, Lithuania
6
Department of Kinesiology and Sport Management, Honors College, Texas Tech University, Lubbock, TX 79409, USA
7
Department of Kinesiology and Sport Management, Texas Tech University, Lubbock, TX 79409, USA
*
Author to whom correspondence should be addressed.
These authors contributed equally to this work.
Sustainability 2022, 14(16), 10006; https://doi.org/10.3390/su141610006
Submission received: 15 July 2022 / Revised: 4 August 2022 / Accepted: 9 August 2022 / Published: 12 August 2022
(This article belongs to the Special Issue Physical Activity and Healthy Habits for Sustainable Well-Being)

Abstract

:
Moods have been investigated previously in a range of cultural contexts. In our study, we investigated if six mood profiles previously identified, termed the iceberg, inverse Everest, inverse iceberg, shark fin, submerged, and surface profiles, were also evident among a Lithuanian sample. A Lithuanian translation of the Brunel Mood Scale (BRUMS-LTU) was completed by a sample of 746 participants (male = 199, female = 547) aged from 17–78 years (M = 41.8 years, SD = 11.4 year). Seeded k-means cluster analysis clearly identified the six hypothesized mood profiles, the prevalence of which reflected previous findings. Cluster prevalence varied significantly by sex, age, exercise and smoking status, frequency of overeating, and self-rated health of participants. Male participants and older adults were under-represented for the inverse Everest profile and over-represented for the iceberg profile. Those who reported more healthy habits (i.e., exerciser, non-smoker, rarely overeat) and those reporting better self-rated health were over-represented for the iceberg profile and under-represented for negative mood profiles; namely, the inverse Everest, inverse iceberg, and shark fin profiles. Findings supported the cross-cultural invariance of the mood profile clusters and confirmed the link between unhealthy habits and negative mood profiles.

1. Introduction

Moods and other affective constructs act as a barometer for psychological well-being and mental health status [1]. With about 1 in 8 of the world’s population now living with a mental health disorder [2], most often depression and anxiety, maintaining mental health and preventing mental ill-health is a significant challenge in contemporary society, which has only been made worse by the global COVID-19 pandemic [3,4,5]. Sustaining mental health is a concern in Lithuania, with subjective well-being lower than the European Union (EU) average [6] and mental health support services regarded as suboptimal [7,8]. The development of simple methods of monitoring mental health status, including the recently translated version of the Brunel Mood Scale (BRUMS) [9,10] into Lithuanian [11], adds to the available resources. The assessment of changes in mood over time is often used to monitor mental health [12], while the prevalence of mental health challenges globally increases the importance of research into risk indicators. For the purposes of our study, we defined mood as “a set of feelings, ephemeral in nature, varying in intensity and duration, and usually involving more than one emotion” [13]. Moods are seen to be of longer duration and lesser intensity than emotions, and are often unrelated to an identifiable cause [14,15].
Measures of mood, including the Profile of Mood States (POMS) [16,17] and the BRUMS, are frequently used to facilitate mood profiling, whereby the subscale scores of an individual are plotted against normative scores to give a graphical representation of mood. The 65-item POMS was originally targeted at psychiatric outpatients and hence assesses more negative than positive moods; namely, the six mood dimensions of Anger, Confusion, Depression, Fatigue, Tension, and Vigor [16]. Some researchers have been critical of the negative orientation of the POMS and have noted that the scale offers a limited rather than a comprehensive assessment of mood [18]. However, POMS profiles have shown value as an early indicator of mental health issues [12,19] and for predicting performance in sport contexts, for example, where negative moods can have a debilitating effect [20,21]. Morgan’s mental health model [12] predicts that a mood profile with a high score for Vigor and low scores for Tension, Depression, Anger, Fatigue, and Confusion, which is referred to as an iceberg profile, indicates positive mental health, while a profile with a low score for Vigor combined with high scores for Tension, Depression, Anger, Fatigue, and Confusion, which is referred to as an inverse iceberg profile [22], associates with poor mental health outcomes. Another distinct mood profile, known as the Everest profile, is an extremely positive profile characterized by a maximum or almost maximum Vigor score and minimum or almost minimum scores for the other five subscales, and is proposed to associate with good performance in sports and other domains [23].
Using the 24-item BRUMS to assess mood, additional profiles have been described more recently which, based on their shapes and continuing the nautical/mountain theme, are known as the inverse Everest, shark fin, submerged, and surface profiles [24,25]. The first of these, the inverse Everest profile, is represented by high scores for Tension and Fatigue, very high scores for Depression, Anger, and Confusion, and a low score for Vigor. The very high scores on negative mood dimensions reflect elevated risk of mental health disorders [26]. The next profile, referred to as the shark fin, is represented by a very high Fatigue score, combined with below-average scores for Tension, Depression, Anger, Vigor, and Confusion. The shark fin profile has been shown to associate with a lack of adherence to safety procedures in the mining and construction industries [27] and is also somewhat predictive of athletic injury [28]. The third profile is represented by average scores on all mood dimensions and is known as the surface profile. The final profile is represented by scores on all six mood dimensions that sit below the population average. The submerged profile, as it is known, may relate to good performance in activities that require individuals to remain calm and unemotional [29]. These four profiles, plus the inverse iceberg and iceberg profiles, have been identified in several different languages and cultural contexts, including Brazilian [30], Chinese [31], English [24,25,32], Italian [33], and Singaporean [34] but have not yet been investigated in a Lithuanian context.
The BRUMS is used widely in a mental health context to, for example, screen military personnel in South Africa for post-traumatic stress disorder [26]; monitor well-being among cardiac rehabilitation patients and assess the risk of mental ill-health in Brazil [35,36], prevent injury and reduce performance anxiety in Japanese ballet dancers [37]; and evaluate American adolescents for risk of suicide [38].
Moods tend to vary according to biological sex and gender identity, with men reporting higher Vigor scores and lower Tension, Depression, Anger, Fatigue, and Confusion scores than women [5,32]. As a nation, Lithuania ranks poorly (i.e., 20 of 27 countries in the EU) for gender equality [39], indicating that investigation of gender differences in the prevalence of specific mood profiles is warranted among our sample of Lithuanian participants. Age is also associated with mood differences, in that adults tend to report more positive moods as age increases [32,40]. Such age-related variations may be explained in part by age-related differences in emotion-regulation strategies. Younger adults tend to use less effective coping strategies, instead resorting to maladaptive strategies such as avoidance, rumination, or suppression [41]. By comparison, older adults tend to engage more in more adaptive coping strategies such as mindfulness [42,43,44]. Given the reported age-related differences in mood, we also explored the prevalence of specific mood profiles according to age group.
The self-medication hypothesis of addictive disorders [45] posits that the use of illicit or unhealthy substances is a way of coping with stress, anxiety, or depression [46]. Smoking, alcohol consumption, and overeating are common forms of self-medication that can be considered as unhealthy habits and potential threats to sustainable mental health. Hence, all three are addressed in our study as potential influences on mood. Firstly, there is a well-established link between smoking and mood disorders [47]. For example, adults diagnosed with depression are twice as likely to smoke as adults without depression, and mental ill-health contributes to both smoking initiation and higher levels of smoking [48].
Secondly, there is considerable evidence that alcohol consumption and mental health are linked. Although drinking alcohol in moderation was long regarded as a contributor to positive mental health [49], more recent evidence has tended to identify a range of threats of alcohol consumption to sustainable well-being. For example, alcohol consumption to alleviate negative moods was associated with a more than threefold increase in the probability of developing alcohol dependence and of that dependence persisting over time, among a sample of 43,093 participants in the United States [50]. Similarly, among a sample of 2275 Finnish participants, alcohol use was linked to indicators of poor mental health, especially psychological distress, as well as to poor life satisfaction [51]. Thirdly, overeating is another maladaptive coping strategy linked to negative mood and risk of mental health issues [52], as well as serious threats to physical health [53]. Overeating appears to be precipitated by increased stress and may lead to clinical conditions, including depression, binge eating disorder, and obesity [53,54].
The final potential influence on mood examined in our study is related to exercise. Mental health status is linked to levels of physical activity and sedentary behavior. For example, Chekroud et al. [55] analyzed data from more than 1.2 million adults in the USA. Exercisers had 43.2% fewer days of poor mental health than non-exercisers. Further, a wide range of epidemiological studies have shown that sedentary behavior negatively affects physical and mental health, regardless of the level of physical activity [56]. Moreover, the deleterious effects of lockdowns related to COVID-19 on reduction of both planned and unplanned physical activity, increases in sedentary behavior, and a concomitant decline in mental well-being, were reported in a multi-nation study across four countries [57].
The first aim of our study was to assess whether six mood profile clusters reported previously; namely, the iceberg, inverse Everest, inverse iceberg, shark fin, submerged, and surface profiles, would also be identified in Lithuanian-speaking participants. The second aim of our study was to quantify the relative prevalence of the six mood profiles and whether their prevalence varied by a range of demographic and lifestyle variables: namely, sex, age, education, residence, smoking, alcohol consumption, eating behaviors, physical activity, and self-rated health.

2. Materials and Methods

2.1. Participants

We recruited 746 individuals to participate in the study. A total of 199 (26.7%) identified as men and 547 (73.3%) identified as women. The age range of participants was 17 to 79 years (M = 41.8 ± 11.4 years). Most participants had a tertiary education, with 583 (78.2%) having a university degree, and 163 (21.8%) being educated to a non-degree level. Most participants resided in urban environments, with 457 (61.3%) living in cities > 100,000 residents, and 289 (38.7%) living in smaller towns or rural locations. A total of 142 (19%) identified as smokers and 604 (81%) as non-smokers. A total of 121 (16.2%) reported they never drank alcohol and 625 (83.8%) did drink alcohol. Regarding eating behaviors, 117 (15.7%) indicated they never overate, 495 (66.4%) indicated they rarely overate, and 134 (18.0%) indicated they often overate. As for physical activity, a total of 544 participants (72.9%) identified as exercisers (including participation in sport) and 202 (27.1%) as non-exercisers. Finally, regarding self-rated health status, 133 reported being in great health (17.8%), 420 in good health (56.3%), 173 in satisfactory health (23.2%), and 20 in bad health (2.7%) compared to others their age.

2.2. Measures

Mood was assessed using the Brunel Mood Scale (BRUMS), a 24-item measure originally developed for use with adolescents and athletes. The validation of the BRUMS has since been extended for use with the general population and adults [9,10]. The BRUMS is adapted from the POMS [16,17], and has four items in each of six subscales. Items of the Tension scale are nervous, anxious, worried, and panicky. Items of the Depression scale are unhappy, miserable, depressed, and downhearted. Items of the Anger scale are bitter, angry, annoyed, and energetic. Items of the Vigor scale are energetic, active, lively, and alert. Items of the Fatigue scale are exhausted, tired, worn out, and sleepy. Items of the Confusion scale are mixed up, muddled, uncertain, and confused. A 5-point response scale is used, ranging from 0 = not at all, 1 = a little, 2 = moderately, 3 = quite a bit, and 4 = extremely. Total subscale scores can range from 0–16. Participants respond to the question, “How do you feel right now?” with reference to the 24 items. Cronbach alpha coefficients in the 0.74 to 0.90 range [9,10] supported the internal consistency of the subscales. The psychometric integrity of the measure was supported using multi-sample confirmatory factor analysis, which demonstrated the invariance of the factor structure among adolescent athletes, schoolchildren, adult athletes, and adult students [9,10].
Translation and re-validation studies of the BRUMS have occurred in many languages and cultural contexts. These include Afrikaans [58], Bangla [59], Brazilian Portuguese [60], Chinese [61], Czech [62], French [63], Hungarian [64], Italian [64,65], Japanese [66], Malay [67,68], Persian [69], Serbian [70], Singaporean [71], Spanish [72], Turkish [73], and most recently Lithuanian [11]. Researchers should note that the BRUMS measures six mood dimensions only, assesses the construct of depressed mood rather than clinical depression, and is not a diagnostic tool.
We used the Lithuanian-language version of the BRUMS, which is known as the BRUMS-LTU. In a recent validation study [11], the BRUMS-LTU demonstrated strong psychometric properties. Confirmatory factor analysis supported the hypothesized measurement model (CFI = 0.954, TLI = 0.944, RMSEA = 0.060 [CI 0.056, 0.064], SRMR = 0.070). The configural, metric, scalar, and residual invariance was supported for both men and women using simultaneous multi-sample analysis. Two concurrent measures translated and validated in the Lithuanian language; namely, the Perceived Stress Scale [74] and the Big Five Personality Test [75], were shown to correlate with BRUMS-LTU scores as predicted, which supported both the convergent and divergent validity of the scale. The Cronbach alpha coefficients for the BRUMS-LTU subscales exceeded standard benchmarks [76], ranging from 0.83 to 0.89 (see Table 1). The present study involved conducting further analyses on the dataset collected during the validation study [11] to address additional research questions related to the presence of distinct mood profile clusters and variations in their prevalence when participants were grouped by sex, age, education, residence, smoking, alcohol consumption, eating behaviors, physical activity, and self-rated health.

2.3. Procedure

Participants received the BRUMS-LTU as an online questionnaire through Facebook using Google Forms. Participation was anonymous and no email addresses or names were collected. The data collection period ran from May 2021 to September 2021, which coincided with the end of the second COVID-19 wave in Lithuania, followed by a lull in reported cases and then the third wave of infections. The study was conducted in accordance with the Declaration of Helsinki, and the Human Research Ethics Committee at Vytautas Magnus University granted approval for the study to be conducted. Participants provided informed consent by clicking “continue” after reading the details of the research and its purpose.

2.4. Data Analysis

Data were compiled for analysis using SPSS for Windows, Version 27, IBM Corporation, Armonk, NY, USA [77]. We applied cluster analysis techniques to investigate whether six mood profile clusters previously identified, known as the iceberg, inverse Everest, inverse iceberg, shark fin, submerged, and surface profiles [24,25] were evident among a Lithuanian population. Hierarchical clustering is superior for delineating previously undefined natural groupings, whereas k-means clustering is better for determining exclusive cluster membership. When prior knowledge of clusters exists, as in our case, the k-means procedure is recommended [78]. Hence, we used seeded k-means clustering to improve clustering performance [79] and then compared the clusters identified to those previously described [24,25] to assess external validity [80]. We subsequently conducted a discriminant function analysis to assess the strength of the cluster structures. Finally, we conducted chi-squared analyses to identify whether cluster prevalence varied significantly by sex (male/female), age (17–30 year/31–40 year/41–50 year/51+ year), residence (urban: >100,000 people/non-urban: <100,000 people), education (university degree/no university degree), exercise (exerciser/non-exerciser), smoking (smoker/non-smoker), overeating (never/rarely/often), and self-rated health status (bad/satisfactory/good/great).

3. Results

3.1. Data Screening and Descriptive Statistics

Our dataset showed some nonnormal distributions. For example, the distributions of scores for Tension, Depression, Anger, and Confusion were positively skewed due to a high proportion of very low scores reported with fewer scores at the upper end. This is frequently the case for indicators of negative mood [9,10]. Similar nonnormality related to kurtosis values was shown for Depression, Anger, and Confusion scores, which is also common for these subscales [9,10]. A total of 15 multivariate outliers were identified among the dataset using the Mahalanobis statistic, but all cases implicated were judged to represent plausible responses and to be free of response bias [81,82]. Hence, no data transformations were used. For all subscales, the full range of possible scores was reported (range = 0–16), except for Tension (range = 0–15). Table 1 includes descriptive statistics for all subscales of the BRUMS-LTU.

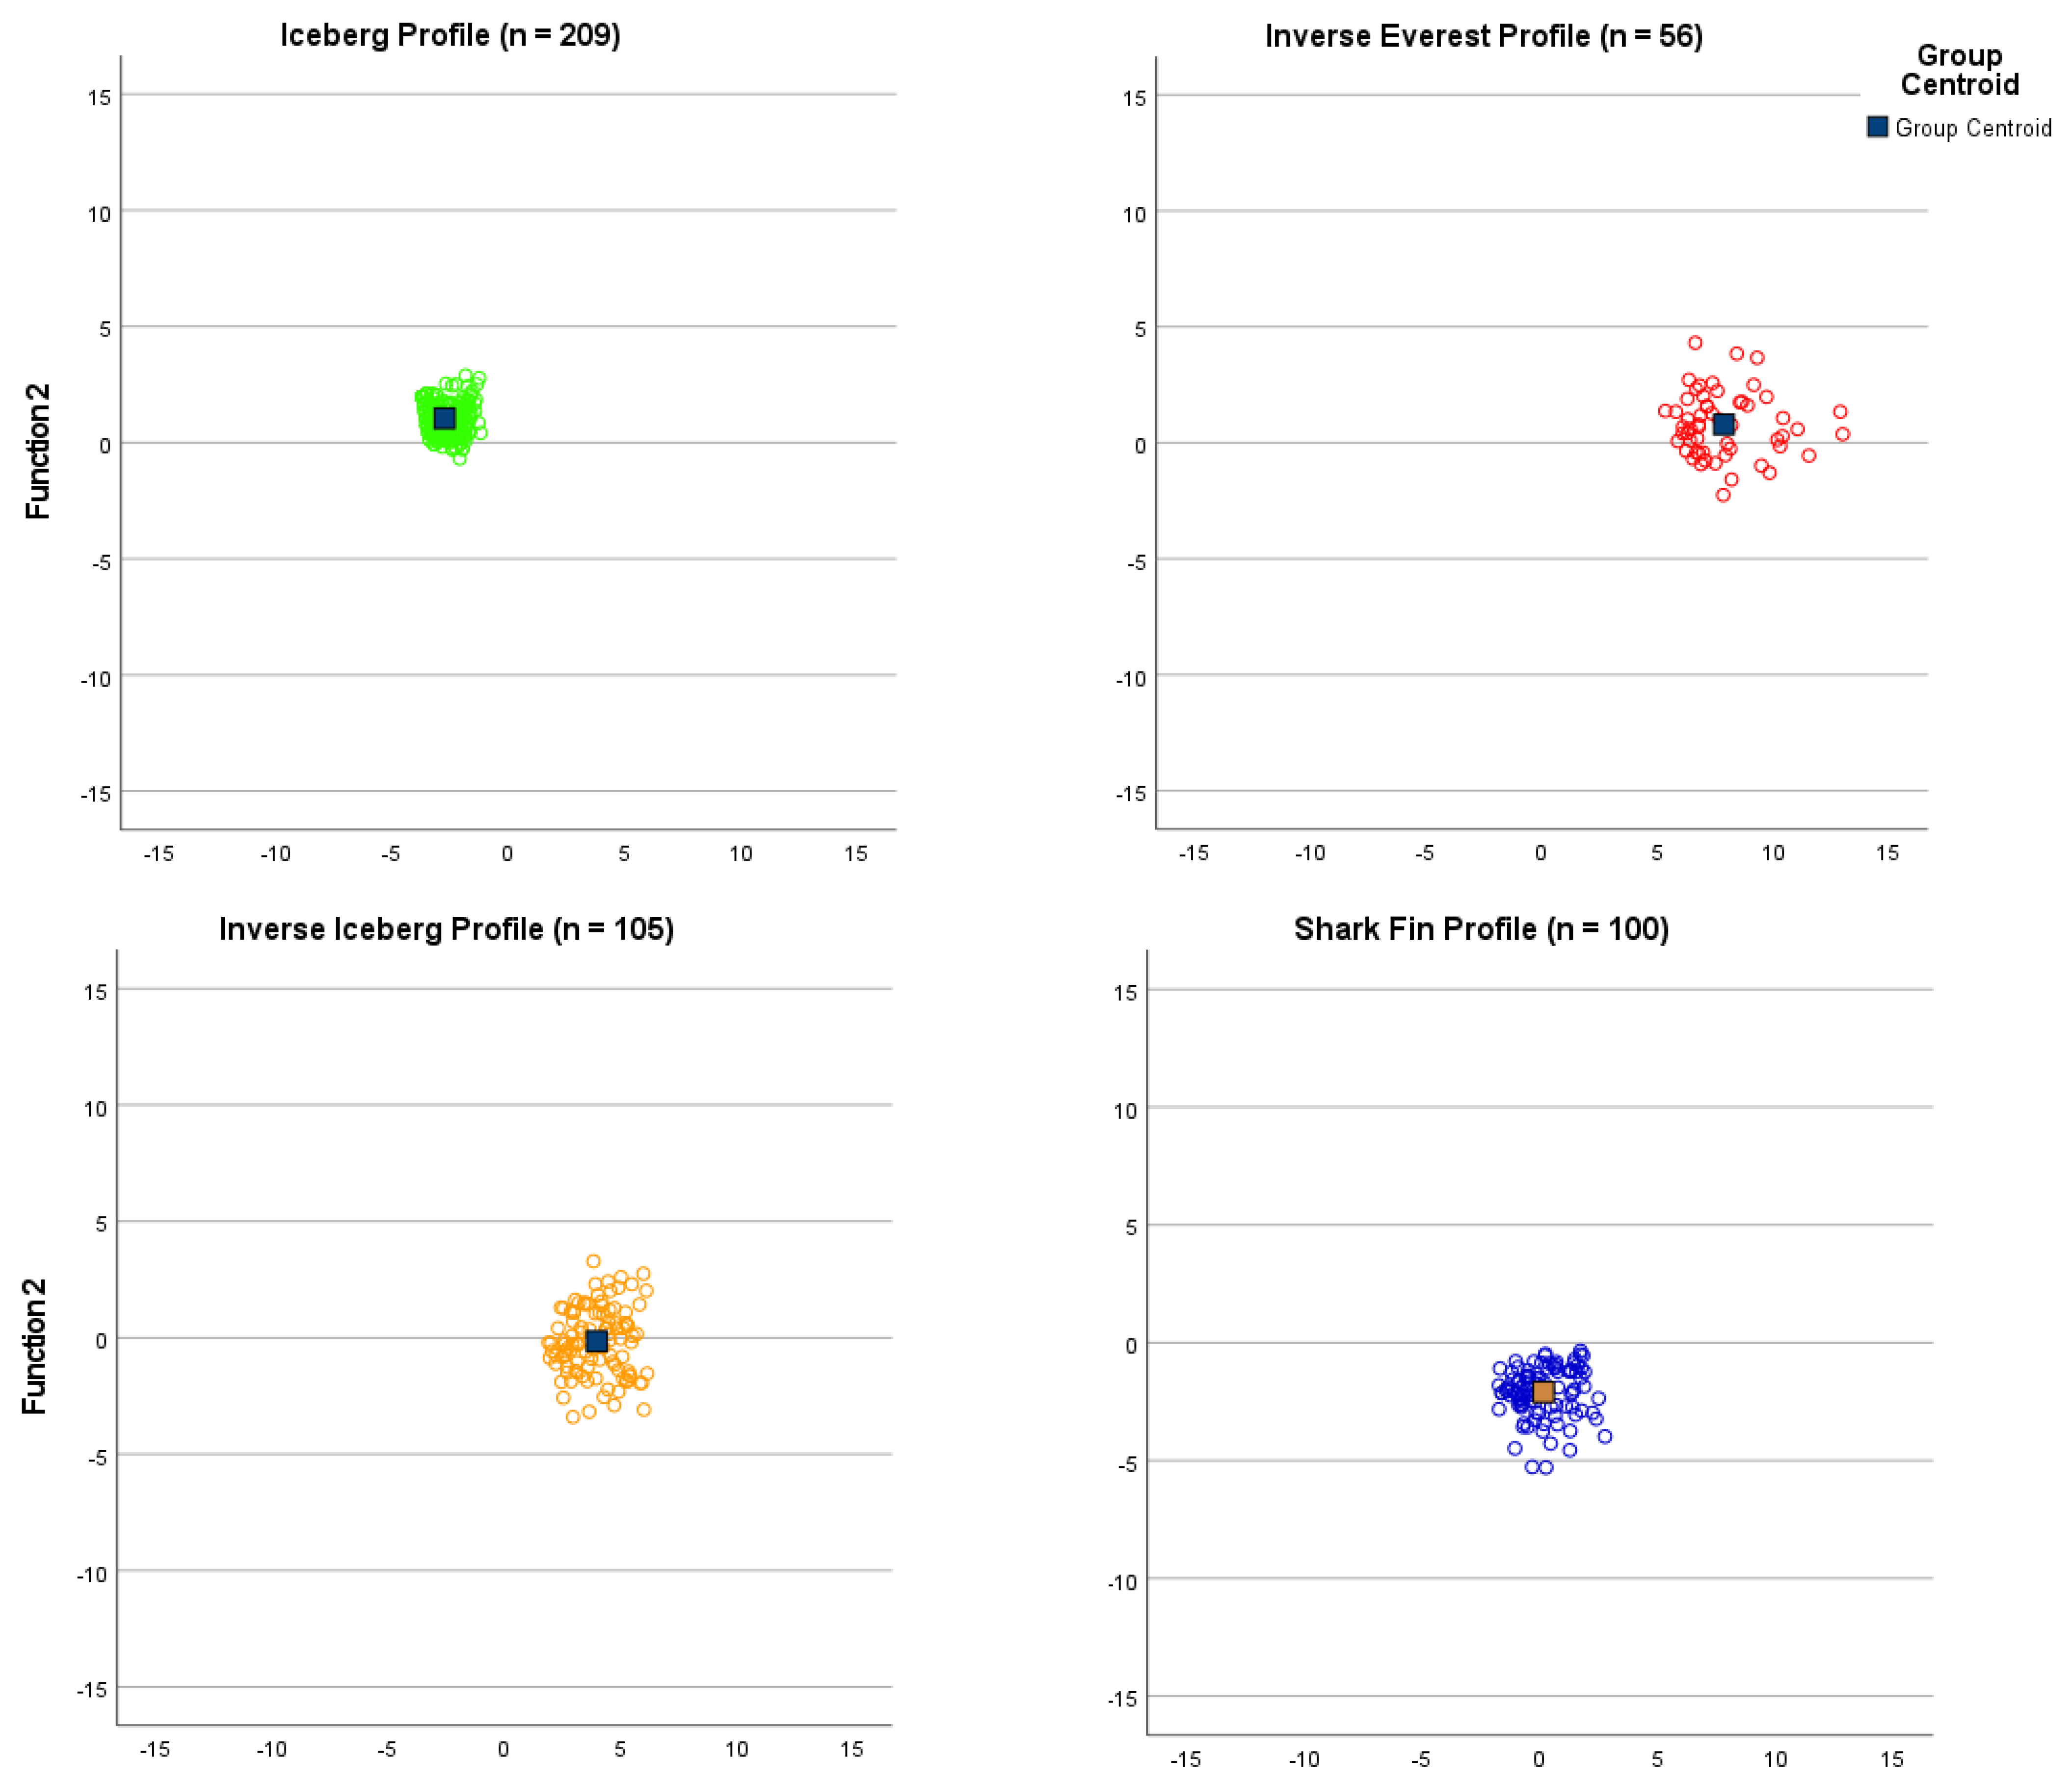
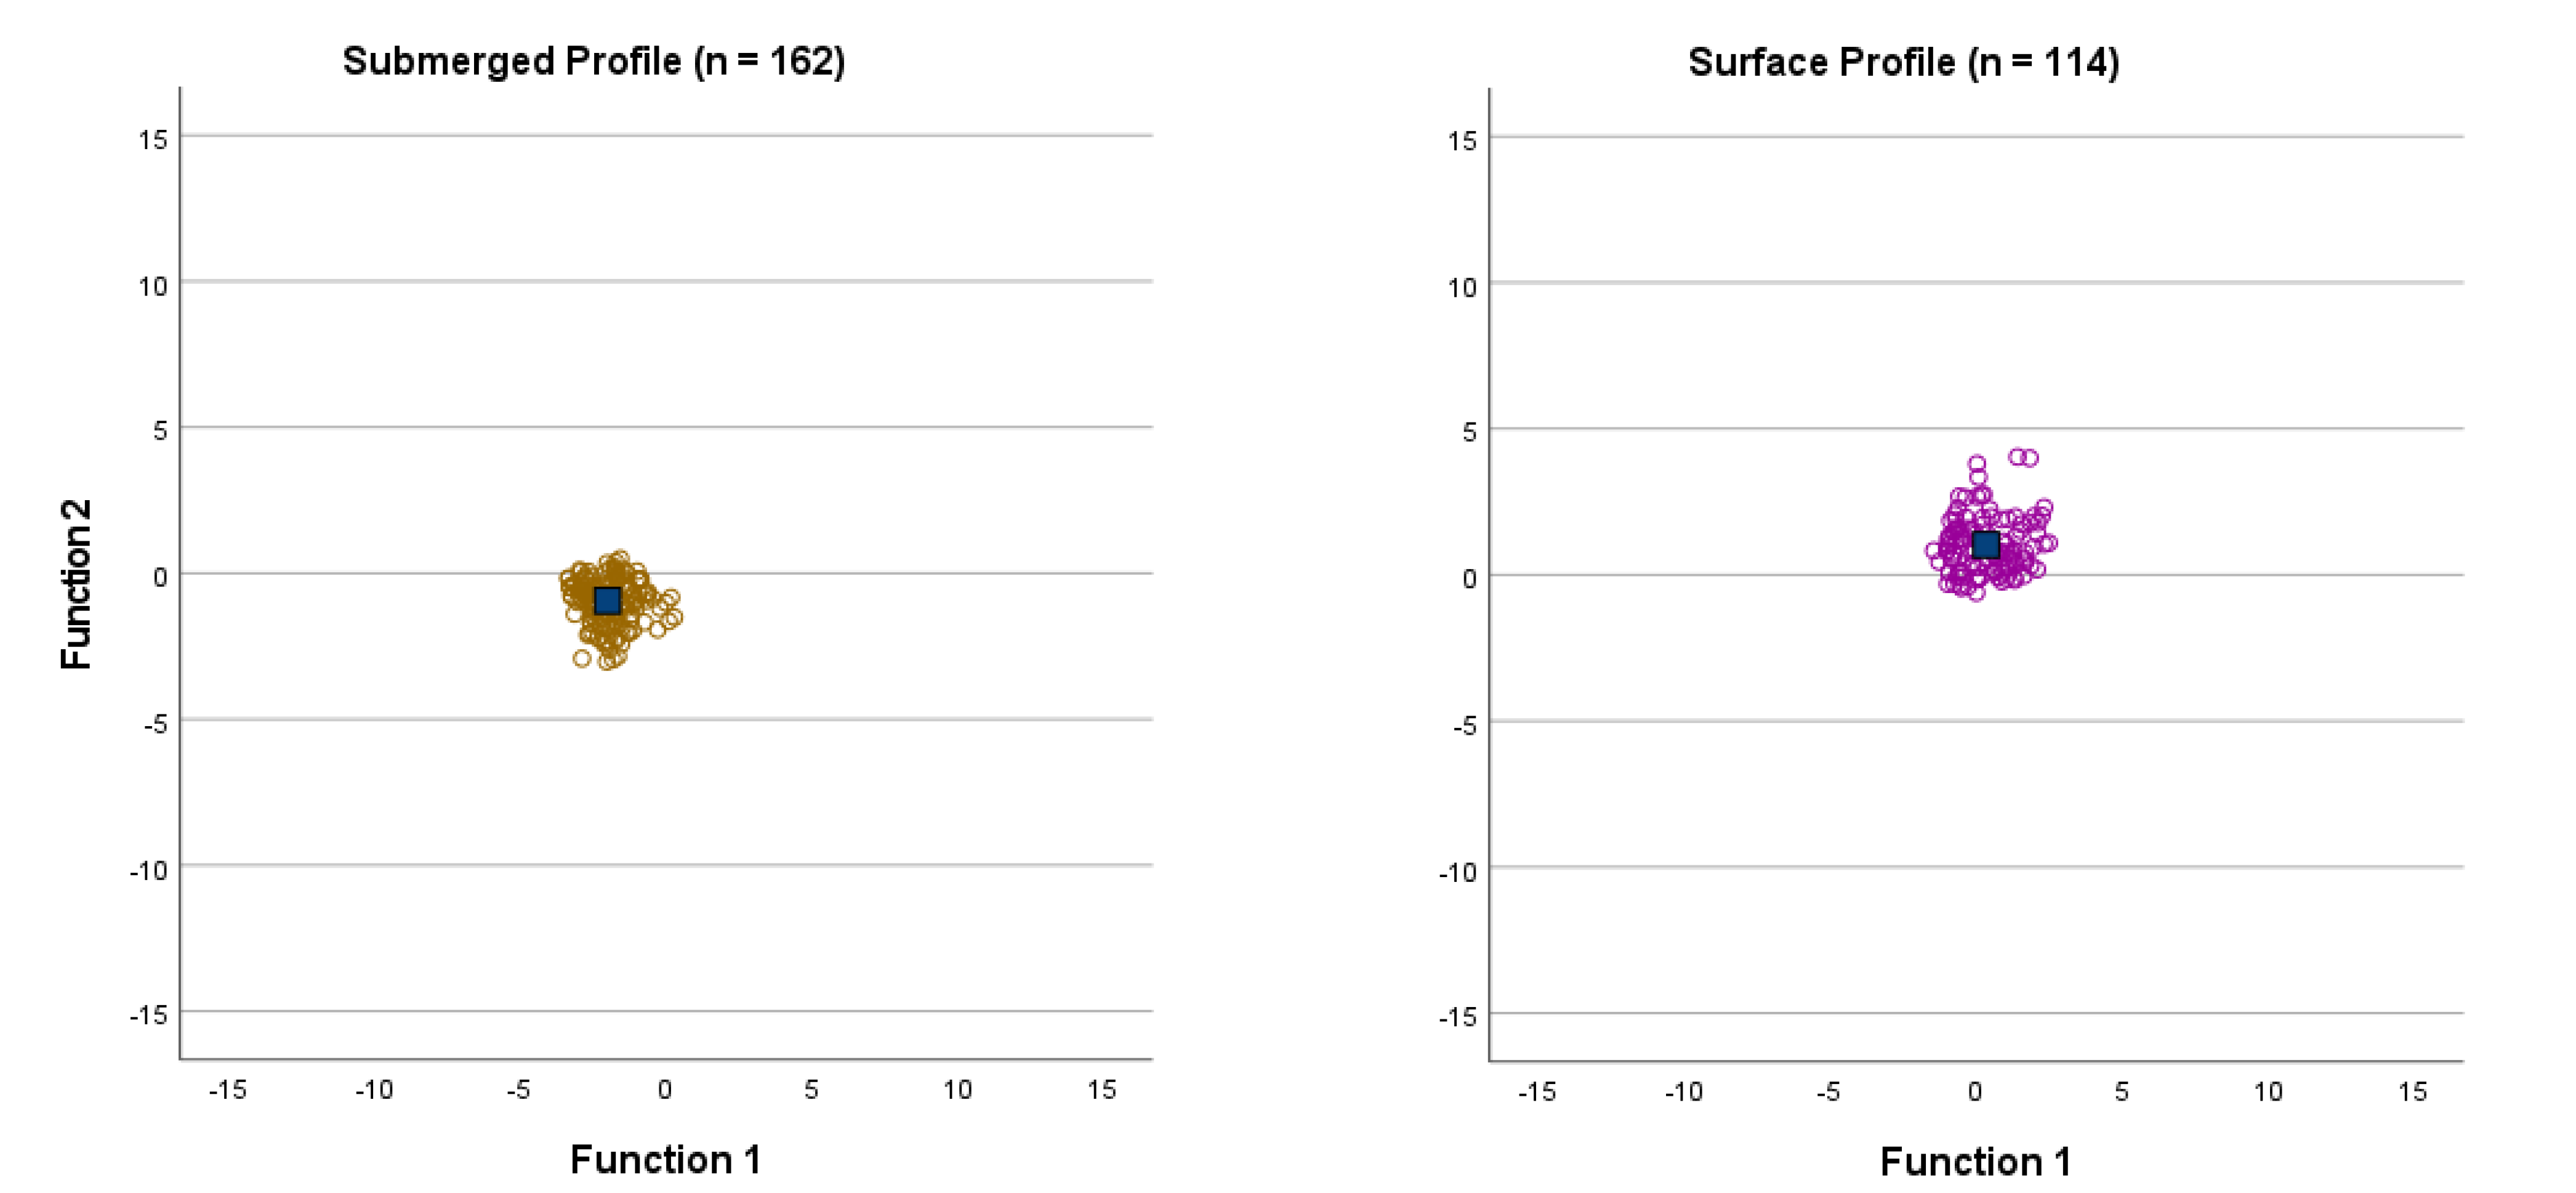
3.2. Cluster Analysis

To investigate the clustering of mood responses, we conducted a seeded k-means cluster analysis prescribing a 6-cluster solution. All six clusters identified in the literature [24,25] were identified in our dataset: namely, the iceberg profile, inverse Everest profile, inverse iceberg profile, shark fin profile, submerged profile, and surface profile. Descriptive statistics related to the 6-cluster solution among the Lithuanian sample are shown in Table 2. The mood profile clusters are shown graphically in Figure 1. The most prevalent mood cluster was the iceberg (28.0%), which is the most positive profile of the six profiles, and the least prevalent were the more negative profiles, the inverse iceberg (14.1%), shark fin (13.4%), and the inverse Everest (7.5%), which is the profile most closely associated with risk of psychopathology.

3.3. Cluster Strength

The results of a discriminant function analysis to determine the accuracy of the cluster structures are shown in Table 3. A total of 94.4% of cases were re-classified into their original groupings and the result of a cross-validation test showed 93.6% accuracy. The first three functions accounted for 99.4% of the cumulative variance (i.e., 86.1%, 11.3%, and 1.9%, respectively), and a significant Wilks’ Lambda test (p ≤ 0.001) signaled a high degree of discriminatory power for each function. Function 1 accounted for 90.8% of between-group variance, while functions 2 and 3 accounted for 56.7% and 18.0%, respectively. Canonical discriminant plots (see Figure 2) showed that cases were compressed around the group centroids, with the iceberg, submerged, and surface profiles showing the highest degree of compaction. Taken together, the results of the discrimination function analysis suggest that the k-means cluster solution has excellent predictive accuracy and is a good fit to data.

3.4. Cluster Prevalence

The results of chi-squared analyses to determine whether mood profile cluster prevalence varied by demographic and lifestyle groupings are shown in Table 4. Adjusted residuals identified which groups varied significantly, using critical values of ±1.96, ±2.58, and ±3.29 to indicate significant differences at p < 0.05, p < 0.01, and p < 0.001, respectively [83]. Cluster prevalence varied by the sex of participants in that males had a higher prevalence of the iceberg profile and a lower prevalence of the inverse iceberg and shark fin profiles, whereas females had a higher prevalence of the inverse iceberg and shark fin profiles and a lower prevalence of the iceberg profile.
For age, the 17–30 year group had the lowest prevalence of the iceberg profile than other age groups and the highest prevalence of the surface profile. The 31–40 year group similarly had a lower prevalence of the iceberg profile than older age groups but the highest prevalence of the inverse iceberg profile. The 41–50 year group had the highest prevalence of the iceberg profile. The 51+ year group had the lowest prevalence of the inverse Everest and inverse iceberg profiles than other age groups and the highest prevalence of the submerged profile.
Those who smoked cigarettes showed a lower prevalence of the submerged profile and a higher prevalence of the surface profile, whereas non-smokers had a higher prevalence of the submerged profile and a lower prevalence of the surface profile. Exercisers had a higher prevalence of the iceberg and surface profiles than non-smokers, and a lower prevalence of the inverse Everest, inverse iceberg, and shark fin profiles. Non-exercisers showed the opposite, being under-represented for the iceberg and surface profiles, and over-represented for the inverse Everest, inverse iceberg, and shark fin profiles. Those who overate often had the lowest prevalence of the iceberg profile and the highest prevalence of the inverse Everest and inverse iceberg profiles, whereas those who overate rarely had the lowest prevalence of the inverse iceberg profile.
For self-rated health status, those who rated themselves as in great health had the highest prevalence of the iceberg profile and lowest prevalence of the inverse Everest and inverse iceberg profiles. Those who rated themselves as in good health were under-represented for the inverse Everest profile and had the highest prevalence of the surface profile. Those who rated themselves as in satisfactory health were under-represented for the iceberg profile, over-represented for the inverse iceberg profile, and had the highest prevalence of the inverse Everest profile. Finally, those who rated themselves as in bad health had the lowest prevalence of the iceberg profile and the highest prevalence of the inverse iceberg profile. Cluster prevalence did not vary significantly according to the residential location (urban vs. non-urban), level of education (university degree vs. no university degree), and alcohol consumption (alcohol drinker vs. non-alcohol drinker) status of the participants.

4. Discussion

Our primary aim was to assess whether six mood profiles identified in the literature; namely, the iceberg, inverse Everest, inverse iceberg, shark fin, submerged, and surface profiles [24,25,30,31,32] would also be evident among a sample of 746 Lithuanian-speaking participants. As the first research aim was met, our secondary aim was to assess if the prevalence of the six mood profiles was moderated by the gender, age, residence, and education level of participants, and by the lifestyle characteristics of smoking, exercise, alcohol consumption, and frequency of overeating.
Compared to men, women were significantly more likely to report an inverse iceberg profile or shark fin profile, and significantly less likely to report an iceberg profile. This finding aligns with the general trend for women to report more negative mood profiles than men [5,32], explained partly by hormonal fluctuations associated with reproductive considerations [84,85] but primarily by the disadvantage women face in life compared to men, especially in the areas of family responsibilities, education, and careers [86,87]. It should be noted that data collection occurred during a relatively high point of the COVID-19 pandemic, during which time women bore a higher proportion of the domestic and emotional labor required to maintain family life [88], which was reflected in more negative mood profiles among women [5].
Regarding age, participants in the 41–50 year group were significantly more likely to report an iceberg profile than those in the 17–30 year group and 31–40 year group. Also reflecting the tendency for older adults to report more positive moods than their younger counterparts, those in the 51+ year group were significantly less likely to report an inverse Everest profile or inverse iceberg profile than other age groups. Such age-related mood differences are generally consistent with the literature and are typically explained by emotion-regulation strategies becoming better developed and more effective as people age [41,42,43,44]. Extending investigation of the prevalence of the six mood profile clusters to youth participants would be a worthwhile focus for future research.
Several significant differences were identified in the prevalence of mood profile clusters related to lifestyle variables. Firstly, compared to non-smokers, smokers were more likely to report a surface profile and less likely to report a submerged profile. These differences are more meaningful when viewed in conjunction with other profiles, wherein smokers were more likely to report an inverse Everest profile and less likely to report an iceberg profile than non-smokers. These latter two differences were not statistically significant but reflect a tendency for non-smokers to report more positive moods than smokers, which is consistent with previous evidence that smokers have a higher risk of mental health issues [89]. A potential mechanism for this link relates to the stimulative effect of nicotine on dopamine release, which triggers positive feelings in the short term. Longer term, however, smoking tends to depress the natural production of dopamine, rendering smokers more vulnerable to depression and anxiety [89], although the nature of the causal relationship (i.e., does smoking cause mental health problems or do those with mental health issues turn to smoking?) is likely bidirectional. The complex relationship between smoking, mood, and mental ill-health is further illustrated by research that highlights the pivotal role of depression symptoms in moderating the smoking and mood relationship [90,91].
Secondly, those who engaged in exercise or sport were more likely to report an iceberg profile or a surface profile than those who did not exercise, and less likely to report an inverse Everest profile, an inverse iceberg profile, or a shark fin profile. This reflects a very clear pattern for exercisers to report more positive moods than non-exercisers and adds to an already strong evidence base for the preventive effects of exercise on mental ill-health [92,93]. The mechanisms by which the beneficial effect of exercise on mood occurs include an increase in blood circulation to the brain that influences the hypothalamic-pituitary-adrenal (HPA) axis and thereby reduces reactivity to stress [93], although the social interaction, self-efficacy, and distraction effects of exercise may also partially explain the benefit [93].
Thirdly, it was shown that those who often overate were less likely to report an iceberg profile than those who rarely or never overate, and more likely to report an inverse Everest or an inverse iceberg profile. The link between overeating (leading to being overweight or obese) and the risk of mental ill-health is well-established in the literature [94,95] and stress-related mood disturbance is recognized as a risk factor for obesity [52]. Overeating and mental ill-health operate as a vicious cycle, whereby weight increase leads to declining self-esteem and negative affect, which promotes more binge eating [96]. Also, some medications prescribed to counter mental health conditions can cause weight gain as a side effect [54], reinforcing the overeating-mental ill-health relationship.
The most notable findings from our study were the clear relationships found between mood profiles and self-rated health status. Those who rated themselves as in great health or good health were far more likely to report an iceberg profile than those who rated themselves as in satisfactory health or bad health. Conversely, those in bad health or satisfactory health were more likely to report an inverse Everest or inverse iceberg profile than those in good health or great health. The link between mood profiles and health status, albeit self-reported, highlights the value of the BRUMS-LTU as a screening tool for use in Lithuania. Once more data is generated, it would be beneficial to produce norms for the BRUMS-LTU as a valid reference point to assist with the interpretation of scores derived from the scale. The gender differences in mood profiles identified in the present study suggest that separate tables of normative data for men and women would be advantageous.
It was unsurprising that the prevalence of the six mood profiles did not vary according to the residential location (urban vs. non-urban) and education level (degree vs. non-degree) of participants, considering the general lack of association previously reported in the literature between mood and place of residence or level of education. More unexpected, however, was the lack of a significant association between mood profiles and alcohol consumption, especially given the established link between alcohol consumption and mental ill-health [50,51]. Nevertheless, based on our data derived from a Lithuanian population, alcohol consumption was not associated with a high prevalence of negative mood profiles that would signal an elevated risk of mental health disorders.
Publication of the BRUMS-LTU [11] represented a methodological advancement. Provision of a validated measure of mood for use with Lithuanian speakers avoids the need for the time-consuming retranslation of items and helps prevent measurement errors caused by incorrect comprehension [97,98]. The present study added another step forward methodologically by providing evidence of the prevalence of six distinct mood profiles, thereby adding new reference points for future mood research in Lithuania. However, it is acknowledged that the online questionnaire methodology has some inherent limitations. Accessing any questionnaire via the internet reduces participation by marginalized and lower socio-economic groups [99]. Also, the fact that our sample was mainly university educated might also be seen as a limitation, although notably, Lithuania has one of the highest graduation rates in the world, with 54% having a tertiary qualification [100]. The mean age of participants (41.8 years) might also be considered a limitation of the present study. While the mean age was approximately the same as the median age of the Lithuanian population in 2020 (44.5 years) [101], no one under the age of 17 years participated. Another potential limitation concerns gender representation, given that 73.3% of our sample identified as women, whereas in 2020, 53.7% of Lithuanians were women [102]. Furthermore, only 19% of our sample identified as smokers, whereas a recent survey showed that 28% of Lithuanians smoke [103]. Collectively, these limitations suggest caution when generalizing the findings of the present study to the broader population of Lithuania.
Finally, the debate has raged for many decades about whether parametric statistical procedures can be used legitimately with ordinal data derived from Likert-type scales, such as the BRUMS-LTU. Although statistical purists claim this is a misuse of the data [104], there is compelling evidence [105,106,107] that such use is acceptable given the robustness of the statistical procedures involved, “Parametric statistics can be used with Likert data, with small sample sizes, with unequal variances, and with non-normal distributions, with no fear of ‘coming to the wrong conclusion’. These findings are consistent with empirical literature dating back nearly 80 years” [107] (p. 631).
Putting our findings into a broader perspective, public and primary health approaches to promoting sustainable health and well-being [108] should highlight the mood benefits associated with smoking cessation, engaging in physical activity, and not overeating. The key messages to be emphasized are that ceasing to smoke and overeat, while engaging in more physical activity will likely promote mood benefits in the form of increased vigor, reduced fatigue, tension, depression, confusion, and anger, and help avoid negative mood profiles most closely associated with mental ill-health. Global [109] and national [110,111] well-being advice invariably includes the need for more healthy lifestyle choices but does not usually refer to their mood benefits.
Using mood profiling to screen large numbers of individuals for risk of mental ill-health offers a simple, quick, and inexpensive method of identifying those who might be appropriate candidates for a follow-up interview by clinicians. Access to a free mood profiling system for completion and scoring of the BRUMS, including an instant report on how reported mood may influence performance [20,21] and other behaviors, plus evidence-based strategies for regulating mood, is available online [112]. Our paper provides evidence to support the notion that healthy habits, in the form of exercising and not smoking or overeating, are associated with positive moods that, in turn, signal a reduced risk of mental ill-health and a greater likelihood of sustainable mental health.

Author Contributions

Conceptualization, M.L., A.S., A.L., D.M. and D.V.; Data Curation, M.L., P.C.T., S.C. and R.L.P.-S.; Formal Analysis, M.L., P.C.T., S.C. and R.L.P.-S.; Funding Acquisition, M.L.; Investigation, M.L. and A.S.; Methodology, A.S., A.L., D.M., D.V. and M.L.; Project Administration, A.S., A.L., D.M., D.V. and M.L.; Resources, A.S., A.L., D.M., D.V. and M.L.; Software M.L., R.L.P.-S. and P.C.T.; Supervision, M.L., P.C.T. and A.S.; Validation, P.C.T., R.L.P.-S. and M.L.; Visualization, P.C.T., R.L.P.-S. and M.L.; Writing—Original Draft Preparation, P.C.T.; Writing—Review and Editing, P.C.T., R.L.P.-S. and M.L. All authors have read and agreed to the published version of the manuscript.

Funding

The Center for Transformative Undergraduate Experiences at Texas Tech University funded the involvement of S.C. in this study.

Institutional Review Board Statement

The Vytautas Magnus University, Human Research Ethics Committee approved the study in accordance with the Declaration of Helsinki. Details of the research purpose and evidence of ethical approval (No. STIMC-BTMEK-08) were presented to participants, who provided informed consent by clicking “continue”.

Informed Consent Statement

Informed consent was obtained from all subjects involved in the study.

Data Availability Statement

Data are available from the last author upon reasonable request.

Conflicts of Interest

The authors declare no conflict of interest. The funders had no role in the design of the study; in the collection, analyses, or interpretation of data; in the writing of the manuscript; or in the decision to publish the results.

References

  1. Gross, J.J.; Uusberg, H.; Uusberg, A. Mental illness and well-being: An affect regulation perspective. World Psychiat. 2019, 18, 130–139. [Google Scholar] [CrossRef]
  2. Ritchie, H.; Roser, M. Mental Health. 2018. Available online: https://ourworldindata.org/mental-health (accessed on 6 January 2022).
  3. Ammar, A.; Chtourou, H.; Boukhris, O.; Trabelsi, K.; Masmoudi, L.; Brach, M.; Bouaziz, B.; Bentlage, E.; How, D.; Ahmed, M.; et al. COVID-19 home confinement negatively impacts social participation and life satisfaction: A worldwide multicenter study. Int. J. Environ. Res. Public Health 2020, 17, e6237. [Google Scholar] [CrossRef]
  4. Pappa, S.; Ntella, V.; Giannakas, T.; Giannakoulis, V.G.; Papoutsi, E.; Katsaounou, P. Prevalence of Depression, anxiety, and insomnia among healthcare workers during the COVID-19 pandemic: A systematic review and meta-analysis. Brain Behav. Immun. 2020, 88, 901–907. [Google Scholar] [CrossRef]
  5. Terry, P.C.; Parsons-Smith, R.L.; Terry, V.R. Mood responses associated with COVID-19 restrictions. Front. Psychol. 2020, 11, e589598. [Google Scholar] [CrossRef] [PubMed]
  6. Gataūlinas, A. Subjective well-being of Lithuanian society in the context of European Union countries. Vilniaus Univ. 2013, 1, 1–36. Available online: https://epublications.vu.lt/object/elaba:1822140/index/html (accessed on 8 August 2022).
  7. Puras, D.; Germanavicius, A.; Povilaitis, R.; Veniute, M.; Jasilionis, D. Lithuania mental health country profile. Int. Rev. Psychiat. 2004, 16, 117–125. [Google Scholar] [CrossRef]
  8. Puras, D.; Kolaitis, G.; Tsiantis, J. Child and adolescent mental health in the enlarged European Union: Overview of the CAMHEE project. Int. J. Ment. Health Prom. 2010, 12, 3–9. [Google Scholar] [CrossRef]
  9. Terry, P.C.; Lane, A.M.; Lane, H.J.; Keohane, L. Development and validation of a mood measure for adolescents. J. Sport Sci. 1999, 17, 861–872. [Google Scholar] [CrossRef]
  10. Terry, P.C.; Lane, A.M.; Fogarty, G.J. Construct validity of the Profile of Mood States–Adolescents for use with adults. Psychol. Sport Exerc. 2003, 4, 125–139. [Google Scholar] [CrossRef]
  11. Terry, P.C.; Skurvydas, A.; Lisinskiene, A.; Majauskiene, D.; Valanciene, D.; Cooper, S.; Lochbaum, M. Validation of a Lithuanian-language version of the Brunel Mood Scale: The BRUMS-LTU. Int. J. Environ. Res. Public Health 2022, 19, e4867. [Google Scholar] [CrossRef]
  12. Morgan, W.P. Selected psychological factors limiting performance: A mental health model. In Limits of Human Performance; Clarke, D.H., Eckert, H.M., Eds.; Human Kinetics: Champaign, IL, USA, 1985; pp. 70–80. [Google Scholar]
  13. Lane, A.M.; Terry, P.C. The nature of mood: Development of a conceptual model with a focus on depression. J. Appl. Sport Psychol. 2000, 12, 16–33. [Google Scholar] [CrossRef]
  14. Beedie, C.J.; Terry, P.C.; Lane, A.M. Distinctions between emotion and mood. Cogn. Emot. 2005, 19, 847–878. [Google Scholar] [CrossRef]
  15. Siemer, M. Mood experience: Implications of a dispositional theory of moods. Emot Rev. 2009, 1, 256–263. [Google Scholar] [CrossRef]
  16. McNair, D.M.; Lorr, M.; Droppelman, L.F. Manual for the Profile of Mood States; Educational and Industrial Testing Services: San Diego CA, USA, 1971. [Google Scholar]
  17. McNair, D.M.; Lorr, M.; Droppelman, L.F. Revised Manual for the Profile of Mood States; Educational and Industrial Testing Services: San Diego CA, USA, 1992. [Google Scholar]
  18. Ekkekakis, P. The Measurement of Affect, Mood, and Emotion: A Guide for Health-Behavioral Research; Cambridge University Press: New York, NY, USA, 2013. [Google Scholar]
  19. Morgan, W.P.; Brown, D.R.; Raglin, J.S.; O’Connor, P.J.; Ellickson, K.A. Psychological monitoring of overtraining and staleness. Br. J. Sports Med. 1987, 21, 107–114. [Google Scholar] [CrossRef] [PubMed]
  20. Beedie, C.J.; Terry, P.C.; Lane, A.M. The Profile of Mood States and athletic performance: Two meta-analyses. J. Appl. Sport. Psychol. 2000, 12, 49–68. [Google Scholar] [CrossRef]
  21. Lochbaum, M.; Zanatta, T.; Kirschling, D.; May, E. The Profile of Moods States and athletic performance: A meta-analysis of published studies. Eur. J. Investig. Health Psychol. Educ. 2021, 11, 50–70. [Google Scholar] [CrossRef]
  22. Budgett, R. Fatigue and underperformance in athletes: The overtraining syndrome. Br. J. Sports Med. 1988, 32, 107–110. [Google Scholar] [CrossRef]
  23. Terry, P.C. The efficacy of mood state profiling with elite performers: A review and synthesis. Sport Psychol. 1995, 9, 309–324. [Google Scholar] [CrossRef]
  24. Parsons-Smith, R.L.; Terry, P.C.; Machin, M.A. Identification and description of novel mood profile clusters. Front. Psychol. 2017, 8, e1958. [Google Scholar] [CrossRef]
  25. Terry, P.C.; Parsons-Smith, R.L. Identification and incidence of mood profile clusters among sport participants. J. Sci. Med. Sport. 2019, 22, S100. [Google Scholar] [CrossRef]
  26. Van Wijk, C.H.; Martin, J.H.; Hans-Arendse, C. Clinical utility of the Brunel Mood Scale in screening for post-traumatic stress risk in a military population. Mil. Med. 2013, 178, 372–376. [Google Scholar] [CrossRef] [PubMed]
  27. Galambos, S.A.; Terry, P.C.; Moyle, G.M.; Locke, S.A. Psychological predictors of injury among elite athletes. Br. J. Sports Med. 2005, 39, 351–354. [Google Scholar] [CrossRef] [PubMed]
  28. Parsons-Smith, R.L. In the Mood: Online Mood Profiling, Mood Response Clusters and Mood-Performance Relationships in High-Risk Vocations. Ph.D. Thesis, University of Southern Queensland, Darling Heights, QLD, Australia, 2015. Unpublished. [Google Scholar]
  29. Sobhani, V.; Rostamizadeh, M.; Hosseini, S.; Hashemi, S.; Refoyo Román, I.; Mon-López, D. Anthropometric, physiological, and psychological variables that determine the elite pistol performance of women. Int. J. Environ. Res. Public Health 2022, 19, 1102. [Google Scholar] [CrossRef]
  30. Brandão, R.F.; Correa, M.; Sermarine, M.; Angelo, D.L.; Parsons-Smith, R.L.; Terry, P.C. Psychometric re-evaluation of the Brazil Mood Scale and evidence of mood profile clusters among youth athletes in Brazil. In Proceedings of the International Society of Sport Psychology (ISSP) 15th World Congress Proceedings, Taipei, Taiwan, 30 September–4 October 2021; pp. S183–S184. [Google Scholar] [CrossRef]
  31. Terry, P.C.; Parsons-Smith, R.L.; Zhang, C.Q.; Si, G.; Chung, P.K. Mood profile clusters among Chinese athletes and nonathletes. In Proceedings of the International Society of Sport Psychology (ISSP) 15th World Congress Proceedings, Taipei, Taiwan, 30 September–4 October 2021; pp. S182–S183. [Google Scholar] [CrossRef]
  32. Terry, P.C.; Parsons-Smith, R.L.; King, R.; Terry, V.R. Influence of sex, age, and education on mood profile clusters. PLoS ONE 2021, 16, e0245341. [Google Scholar] [CrossRef]
  33. Quartiroli, A.; Parsons-Smith, R.L.; Fogarty, G.J.; Kuan, G.; Terry, P.C. Cross-cultural validation of mood profile clusters in a sport and exercise context. Front. Psychol. 2018, 9, e1949. [Google Scholar] [CrossRef]
  34. Han, C.; Parsons-Smith, R.L.; Terry, P.C. Mood profiling in Singapore: Cross-cultural validation and potential applications of mood profile clusters. Front. Psychol. 2020, 11, e665. [Google Scholar] [CrossRef]
  35. Brandt, R.; Herrero, D.; Massetti, T.; Crocetta, T.B.; Guarnieri, R.; Monteiro, C.B.D.M.; Viana, M.D.S.; Bevilacqua, G.G.; de Abreu, L.C.; Andrade, A. The Brunel Mood Scale rating in mental health for physically active and apparently healthy populations. Health 2016, 8, 125–132. [Google Scholar] [CrossRef]
  36. Sties, S.W.; Gonzáles, A.I.; Netto, A.S.; Wittkopf, P.G.; Lima, D.P.; Carvalho, T. Validation of the Brunel Mood Scale for cardiac rehabilitation program. Br. J. Sports Med. 2014, 20, 281–284. [Google Scholar] [CrossRef]
  37. Yatabe, K.; Yui, N.; Kasuya, S.; Fujiya, H.; Tateishi, K.; Terawaki, F.; Yoshida, A.; Yoshioka, H.; Terauchi, K.; Miyano, H.; et al. Anxiety and Mood among Ballet Dancers: A Pilot Study on Effects of a Medical Approach Involving Periodic Intervention. 2014. Available online: https://www.researchgate.net/publication/272791152 (accessed on 6 January 2021).
  38. Gould, M.S.; Marrocco, F.A.; Kleinman, M.; Thomas, J.G.; Mostkoff, K.; Côté, J.; Davies, M. Evaluating iatrogenic risk of youth suicide screening programs: A randomized controlled trial. JAMA 2005, 29, 1635–1643. [Google Scholar] [CrossRef]
  39. European Institute for Gender Equality. Gender Equality Index 2021—Lithuania. Available online: https://eige.europa.eu/gender-equality-index/2021/country/LT (accessed on 1 February 2022).
  40. GBD 2019 Mental Disorders Collaborators. Global, regional, and national burden of 12 mental disorders in 204 countries and territories, 1990–2019: A systematic analysis for the Global Burden of Disease Study 2019. Lancet Psychiat. 2022, 9, 137–150. [Google Scholar] [CrossRef]
  41. Aldao, A.; Nolen-Hoeksema, S.; Schweizer, S. Emotion-regulation strategies across psychopathology: A meta-analytic review. Clin. Psychol. Rev. 2010, 30, 217–237. [Google Scholar] [CrossRef] [PubMed]
  42. Remmers, C.; Topolinski, S.; Koole, S.L. Why being mindful may have more benefits than you realize: Mindfulness improves both explicit and implicit mood regulation. Mindfulness 2016, 7, 829–837. [Google Scholar] [CrossRef]
  43. Bravo, A.J.; Boothe, L.G.; Pearson, M.R. Getting personal with mindfulness: A latent profile analysis of mindfulness and psychological outcomes. Mindfulness 2016, 7, 420–432. [Google Scholar] [CrossRef]
  44. Ford, C.G.; Wilson, J.M.; Altman, N.; Strough, J.; Shook, N.J. Profiles of mindfulness across adulthood. Mindfulness 2020, 11, 1557–1569. [Google Scholar] [CrossRef]
  45. Khantzian, E.J. The self medication hypothesis of substance use disorders: A reconsideration and recent applications. Harv. Rev. Psychiatry 1997, 4, 231–244. [Google Scholar] [CrossRef]
  46. Turner, S.; Mota, N.; Bolton, J.; Sareen, J. Self-medication with alcohol or drugs for mood and anxiety disorders: A narrative review of the epidemiological literature. Depress. Anxiety 2018, 35, 851–860. [Google Scholar] [CrossRef]
  47. Mojtabai, R.; Crum, R.M. Cigarette smoking and onset of mood and anxiety disorders. Am. J. Public Health 2013, 103, 1656–1665. [Google Scholar] [CrossRef]
  48. Lawrence, D.; Mitrou, F.; Zubrick, S.R. Smoking and mental illness: Results from population surveys in Australia and the United States. BMC Public Health 2009, 9, 285. [Google Scholar] [CrossRef]
  49. Baum-Baicker, C. The psychological benefits of moderate alcohol consumption: A review of the literature. Drug Alcohol. Depend. 1985, 15, 305–322. [Google Scholar] [CrossRef]
  50. Crum, R.M.; Mojtabai, R.; Lazareck, S.; Bolton, J.M.; Robinson, J.; Sareen, J.; Green, K.M.; Stuart, E.A.; La Flair, L.; Alvanzo, A.A.H.; et al. A prospective assessment of reports of drinking to self-medicate mood symptoms with the incidence and persistence of alcohol dependence. JAMA Psychiatry 2013, 70, 178–726. [Google Scholar] [CrossRef]
  51. Mäkelä, P.; Raitasalo, K.; Wahlbeck, K. Mental health and alcohol use: A cross-sectional study of the Finnish general population. Eur. J. Public Health. 2015, 25, 225–231. [Google Scholar] [CrossRef] [PubMed]
  52. Stein, R.I.; Kenardy, J.; Wiseman, C.V.; Dounchis, J.Z.; Arnow, B.A.; Wilfley, D.E. What’s driving the binge in binge eating disorder? A prospective examination of precursors and consequences. Int. J. Eat. Disord. 2007, 40, 195–203. [Google Scholar] [CrossRef] [PubMed]
  53. Razzoli, M.; Pearson, C.; Crow, S.; Bartolomucci, A. Stress, overeating, and obesity: Insights from human studies and preclinical models. Neurosci. Biobehav. Rev. 2017, 76 Pt A, 154–162. [Google Scholar] [CrossRef]
  54. Bradshaw, T.; Mairs, H. Obesity and serious mental ill health: A critical review of the literature. Healthcare 2014, 2, 166–182. [Google Scholar] [CrossRef]
  55. Chekroud, S.R.; Gueorguieva, R.; Zheutlin, A.B.; Paulus, M.; Krumholz, H.M.; Krystal, J.H.; Chekroud, A.M. Association between physical exercise and mental health in 1.2 million individuals in the USA between 2011 and 2015: A cross-sectional study. Lancet Psychiatry 2018, 5, 739–746. [Google Scholar] [CrossRef]
  56. de Rezende, L.F.; Rodrigues Lopes, M.; Rey-López, J.P.; Matsudo, V.K.; Luiz, O. Sedentary behavior and health outcomes: An overview of systematic reviews. PLoS ONE 2014, 9, e105620. [Google Scholar] [CrossRef]
  57. Karageorghis, C.I.; Bird, J.M.; Hutchinson, J.C.; Hamer, M.; Delevoye-Turrell, Y.N.; Guérin, S.M.R.; Mullin, E.M.; Mellano, K.T.; Parsons-Smith, R.L.; Terry, V.R.; et al. Physical activity and mental well-being under COVID-19 lockdown: A cross-sectional multination study. BMC Public Health 2021, 21, 988. [Google Scholar] [CrossRef]
  58. Terry, P.C.; Potgieter, J.R.; Fogarty, G.J. The Stellenbosch Mood Scale: A dual-language measure of mood. Int. J. Sport Exerc. Psychol. 2003, 1, 231–245. [Google Scholar] [CrossRef]
  59. Hasan, M.M.; Khan, M.H.A. Bangla version of the Brunel Mood Scale (BRUMS): Validity, measurement invariance and normative data in non-clinical sample. Heliyon 2022, 8, e09666. [Google Scholar] [CrossRef]
  60. Rohlfs, I.C.P.M.; Rotta, T.M.; Luft, C.B.; Andrade, A.; Krebs, R.J.; Carvalho, T. Brunel Mood Scale (BRUMS): An instrument for early detection of overtraining syndrome. Rev. Br. Med. Esporte 2008, 14, 176–181. [Google Scholar] [CrossRef]
  61. Zhang, C.Q.; Si, G.; Chung, P.K.; Du, M.; Terry, P.C. Psychometric properties of the Brunel Mood Scale in Chinese adolescents and adults. J. Sport Sci. 2014, 32, 1465–1476. [Google Scholar] [CrossRef] [PubMed]
  62. Květon, P.; Jelínek, M.; Burešová, I.; Bartošová, K. Czech adaptation of the Brunel Mood States for adolescent athletes. Studia Sport. 2020, 14, 47–57. Available online: https://journals.muni.cz/studiasportiva/article/viewFile/12758/11609 (accessed on 6 January 2021). [CrossRef]
  63. Rouveix, M.; Duclos, M.; Gouarne, C.; Beauvieux, M.C.; Filaire, E. The 24h urinary cortisol/cortisone ratio and epinephrine/norepinephrine ratio for monitoring training in young female tennis players. Int. J. Sport Med. 2006, 27, 856–863. [Google Scholar] [CrossRef]
  64. Lane, A.M.; Soos, I.; Leibinger, E.; Karsai, I.; Hamar, P. Validity of the Brunel Mood Scale for use with UK, Italian and Hungarian athletes. In Mood and Human Performance: Conceptual, Measurement, and Applied Issues; Lane, A.M., Ed.; Nova Science: Hauppauge, NY, USA, 2007; pp. 119–130. [Google Scholar]
  65. Quartiroli, A.; Terry, P.C.; Fogarty, G.J. Development and initial validation of the Italian Mood Scale (ITAMS) for use in sport and exercise contexts. Front. Psychol. 2017, 8, e1483. [Google Scholar] [CrossRef] [PubMed]
  66. Yatabe, K.; Oyama, T.; Fujiya, H.; Kato, H.; Seki, H.; Kohno, T. Development and validation of the preliminary Japanese version of the Profile of Mood States for adolescents. St. Marian. Med. J. 2006, 32, 539–547. [Google Scholar]
  67. Hashim, H.A.; Zulkifli, E.Z.; Yusof, H.A. Factorial validation of Malaysian adapted Brunel Mood Scale in an adolescent sample. Asian J. Sport Med. 2010, 1, 185. Available online: https://www.ncbi.nlm.nih.gov/pmc/articles/PMC3289187/ (accessed on 6 January 2021).
  68. Lan, M.F.; Lane, A.M.; Roy, J.; Hanin, N.A. Validity of the Brunel Mood Scale for use with Malaysian athletes. J. Sport Sci. Med. 2012, 11, 131. Available online: https://www.ncbi.nlm.nih.gov/pmc/articles/PMC3737843/ (accessed on 6 January 2021).
  69. Terry, P.C.; Malekshahi, M.; Delva, H.A. Development and initial validation of the Farsi Mood Scale. Int. J. Sport Exerc. Psychol. 2012, 10, 112–122. [Google Scholar] [CrossRef]
  70. Rajkovic, I. Translation and Validation of Brunel Mood Scale for Serbian Athlete Population. Master’s Thesis, University of Jyväskylä, Jyväskylä, Finland, 2014. Available online: https://www.semanticscholar.org/paper/Translation-and-validation-of-Brunel-Mood-Scale-for-Rajkovic/a483f94ab78daad71eb070e336079b756b8dc35f (accessed on 1 February 2022).
  71. Han, C.; Parsons-Smith, R.L.; Fogarty, G.J.; Terry, P.C. Psychometric properties of the Brunel Mood Scale in a Singaporean sporting context. Int. J. Sport Exerc. Psychol. 2022, 20, 698–714. [Google Scholar] [CrossRef]
  72. Cañadas, E.; Monleón, C.; Sanchis, C.; Fargueta, M.; Blasco, E. Spanish validation of BRUMS in sporting and non-sporting populations. Eur. J. Hum. Move. 2017, 38, 105–117. Available online: http://www.eurjhm.com/index.php/eurjhm/article/view/413/608 (accessed on 6 January 2021).
  73. Çakiroğlu1, A.A.; Demir, E.; Güçlü, M. The validity and reliability study of the Brunel Mood Scale with the adult athletes (Turkish Adaptation). Int. J. Appl. Exerc. Physiol. 2020, 9, 126–140. Available online: http://www.ijaep.com/index.php/IJAE/issue/view/36 (accessed on 1 February 2022).
  74. Malinauskas, R.; Malinauskiene, V.; Dumciene, A. Burnout and perceived stress among university coaches in Lithuania. J. Occup. Health 2010, 52, 302–307. [Google Scholar] [CrossRef] [PubMed]
  75. Bunevičius, A.; Birbilaitė, I.; Katkutė, A. Validity of Lithuanian version of the Modern Personality Assessment based on the Big-Five Personality Dimensions Questionnaire. Biol. Psychiat. Psychopharm. 2008, 10, 27–30. Available online: https://www.researchgate.net/publication/274137424_Validity_of_Lithuanian_version_of_the_Modern_Personality_Assesment_based_on_the_Big-Five_personality_dimensions_questionnaire (accessed on 1 February 2022).
  76. Tabachnick, B.L.; Fidell, L.S. Using Multivariate Statistics, 7th ed.; Pearson Education: Boston, MA, USA, 2019. [Google Scholar]
  77. IBM Corp. IBM SPSS Statistics for Windows, Version 27.0; IBM Corp: Armonk, NY, USA, 2020. [Google Scholar]
  78. Wagstaff, K.; Cardie, C.; Rogers, S.; Schroedl, S. Constrained k-means clustering with background knowledge. Int. Conf. Mach. Learn. 2001, 1, 577–584. Available online: http://www.cs.cmu.edu/~./dgovinda/pdf/icml-2001.pdf (accessed on 1 February 2022).
  79. Bair, E. Semi-supervised clustering methods. Wiley Interdisc. Rev. Computat. Stat. 2013, 5, 349–361. [Google Scholar] [CrossRef]
  80. Jain, A.K. Data clustering: 50 years beyond k-means. Pattern Recog. Lett. 2010, 31, 651–666. [Google Scholar] [CrossRef]
  81. Leiner, D.J. Too fast, too straight, too weird: Non-reactive indicators for meaningless data in internet surveys. Surv. Res. Meth. 2019, 13, e7403. [Google Scholar] [CrossRef]
  82. Meisenberg, G.; Williams, A. Are acquiescent and extreme response styles related to low intelligence and education? Pers. Indiv. Diff. 2008, 44, 1539–1550. [Google Scholar] [CrossRef]
  83. Field, A. Discovering Statistics Using SPSS, 3rd ed.; Sage: London, UK, 2009. [Google Scholar]
  84. Amin, Z.; Canli, T.; Epperson, C.N. Effect of estrogen-serotonin interactions on mood and cognition. Behav. Cog. Neuro. Rev. 2005, 4, 43–58. [Google Scholar] [CrossRef]
  85. Ruigrok, A.N.V.; Salimi-Khorshidi, G.; Lai, M.C.; Baron-Cohen, S.; Lombardo, M.V.; Tait, R.J.; Suckling, J. A meta-analysis of sex differences in human brain structure. Neurosci. Biobehav. Rev. 2014, 39, 34–50. [Google Scholar] [CrossRef]
  86. Dorius, S.F.; Firebaugh, G. Trends in global gender inequality. Soc. Force. 2010, 88, 1941–1968. [Google Scholar] [CrossRef]
  87. Stamarski, C.S.; Son Hing, L.S. Gender inequalities in the workplace: The effects of organizational structures, processes, practices, and decision makers’ sexism. Front. Psychol. 2015, 6, e1400. [Google Scholar] [CrossRef] [PubMed]
  88. UN Women. Whose Time to Care? Unpaid Care and Domestic Work during COVID-19; UN Women: New York, NY, USA; Available online: https://data.unwomen.org/sites/default/files/inline-files/Whose-time-to-care-brief_0.pdf (accessed on 17 June 2022).
  89. Fluharty, M.; Taylor, A.E.; Grabski, M.; Munafò, M.R. The association of cigarette smoking with depression and anxiety: A systematic review. Nicotine Tob. Res. 2017, 19, 3–13. [Google Scholar] [CrossRef]
  90. Rubin, L.F.; Haaga, D.A.F.; Pearson, J.L.; Gunthert, K.C. Depression as a moderator of the prospective relationship between mood and smoking. Health Psychol. 2020, 39, 99–106. [Google Scholar] [CrossRef]
  91. Fucito, L.M.; Juliano, L.M. Depression moderates smoking behavior in response to a sad mood induction. Psychol. Addict. Behav. 2009, 23, 546–551. [Google Scholar] [CrossRef]
  92. Sharma, A.; Madaan, V.; Petty, F.D. Exercise for mental health. Prim. Care Companion J. Clin. Psychiatry 2006, 8, 106. [Google Scholar] [CrossRef]
  93. Peluso, M.A.; Andrade, L.H. Physical activity and mental health: The association between exercise and mood. Clinics 2005, 60, 61–70. [Google Scholar] [CrossRef]
  94. Prentice, A.M. Overeating: The health risks. Obes. Res. 2001, 9 (Suppl. 4), 234S–238S. [Google Scholar] [CrossRef]
  95. Robinson, E.; Boyland, E.; Chisholm, A.; Harrold, J.; Maloney, N.G.; Marty, L.; Mead, B.R.; Noonan, R.; Hardman, C.A. Obesity, eating behavior and physical activity during COVID-19 lockdown: A study of UK adults. Appetite. 2021, 156, 104853. [Google Scholar] [CrossRef]
  96. Striegel-Moore, R.H.; Dohm, F.A.; Kraemer, H.C.; Schreiber, G.B.; Taylor, C.B.; Daniels, S.R. Risk factors for binge-eating disorders: An exploratory study. Int. J. Eat. Disord. 2007, 40, 481–487. [Google Scholar] [CrossRef]
  97. Behr, D.; Shishido, K. The translation of measurement instruments for cross-cultural surveys. In The SAGE Handbook of Survey Methodology; Wolf, C., Joye, D., Smith, T.W., Fu, Y., Eds.; Sage: London, UK, 2016; pp. 269–287. [Google Scholar]
  98. Sha, M.; Immerwahr, S. Survey translation: Why and how should researchers and managers be engaged? Surv. Pract. 2018, 11, e0016. [Google Scholar] [CrossRef]
  99. Robinson, L.; Cotten, S.R.; Ono, H.; Quan-Haase, A. Digital inequalities and why they matter. Information 2015, 18, 569–582. [Google Scholar] [CrossRef]
  100. Kimalainen, S. 13 Countries with the Highest Percentage of College Graduates in 2018. Available online: https://www.insidermonkey.com/blog/13-countries-with-the-highest-percentage-of-college-graduates-in-2018-658240/?singlepage=1 (accessed on 29 September 2021).
  101. Index Mundi. Lithuania Median Age—Demographics. Available online: https://www.indexmundi.com/lithuania/median_age.html (accessed on 29 September 2021).
  102. Statista. Population of Lithuania from 1950 to 2020, by Gender. Available online: https://www.statista.com/statistics/1016406/male-female-population-lithuania-1950-2020/ (accessed on 3 August 2022).
  103. Statista. Share of Individuals Who Currently Smoke Cigarettes, Cigars, Cigarillos or a Pipe in Selected European Countries in 2020. Available online: www.statista.com/statistics/433390/individuals-who-currently-smoke-cigarettes-in-european-countries/ (accessed on 3 August 2022).
  104. Jamieson, S. Likert scales: How to (ab)use them. Med. Educ. 2004, 38, 1217–1218. [Google Scholar] [CrossRef] [PubMed]
  105. Carifio, L.; Perla, R. Resolving the 50-year debate around using and misusing Likert scales. Med. Educ. 2008, 42, 1150–1152. [Google Scholar] [CrossRef]
  106. Gaito, J. Measurement scales and statistics: Resurgence of an old misconception. Psychol. Bull. 1980, 87, 564–567. [Google Scholar] [CrossRef]
  107. Norman, G. Likert scales, levels of measurement and the “laws” of statistics. Adv. Health Sci. Educ. 2010, 15, 625–632. [Google Scholar] [CrossRef]
  108. Pereira, M.A.; Marques, R.C.; Ferreira, D.C. An incentive-based framework for analyzing the alignment of institutional interventions in the public primary healthcare sector: The Portuguese case. Healthcare 2021, 9, 904. [Google Scholar] [CrossRef]
  109. Health and Wellbeing Queensland. Making Healthy Happen. 2020. Available online: https://hw.qld.gov.au/make-healthy-happen/health-wellbeing-initiatives/ (accessed on 3 August 2022).
  110. Victoria Department of Health. Public Health and Wellbeing Planning. 2021. Available online: https://www.health.vic.gov.au/health-strategies/public-health-and-wellbeing-planning (accessed on 3 August 2022).
  111. World Health Organization. Promoting Well-being. 2021. Available online: https://www.who.int/activities/promoting-well-being (accessed on 3 August 2022).
  112. Terry, P.C.; Lim, J.; Parsons-Smith, R.L. In The Mood: An Online Mood Assessment Based on the Brunel Mood Scale. 2013. Available online: www.moodprofling.com (accessed on 6 January 2021).
Figure 1. Graphical representation of the 6-cluster solution (n = 746).
Sustainability 14 10006 g001
Figure 2. Graphical representation of the Canonical Discriminant Functions (n = 746).
Sustainability 14 10006 g002aSustainability 14 10006 g002b
Table 1. Descriptive statistics for BRUMS-LTU subscales (n = 746).
VariableMSDSEMMinMaxSkewnessKurtosisα
Tension3.433.560.130151.100.510.83
Depression2.623.530.130161.541.750.88
Anger2.353.200.120161.702.700.86
Vigor9.133.700.14016−0.20−0.500.88
Fatigue5.124.220.150160.59−0.590.89
Confusion2.843.460.130161.411.550.85
Table 2. Descriptive statistics of the 6-cluster solution (n = 746).
SourceIceberg (n = 209; 28.0%)Inverse Everest (n = 56; 7.5%)Inverse Iceberg (n = 105; 14.1%)
MSD95% CIMSD95% CIMSD95% CI
Tension43.223.75[42.56, 43.88]70.986.29[69.70, 72.26]61.646.29[60.71, 62.58]
Depression43.672.40[43.02, 44.32]72.988.29[71.73, 74.24]61.446.85[60.52, 62.35]
Anger44.143.10[43.40, 44.89]73.0110.32[71.57, 74.46]58.888.30[57.83, 59.93]
Vigor60.224.93[59.35, 61.10]39.478.14[37.79, 41.16]43.558.60[42.32, 44.78]
Fatigue40.843.78[40.12, 41.56]65.247.23[63.84, 66.63]60.207.16[59.18, 61.22]
Confusion43.986.63[43.23, 44.73]72.258.27[70.80, 73.70]59.167.67[58.10, 60.22]
SourceShark Fin(n = 100; 13.4%)Submerged(n = 162; 21.7%)Surface(n = 114; 15.3%)
MSD95% CIMSD95% CIMSD95% CI
Tension47.655.29[46.69, 48.60]43.443.85[42.69, 44.19]52.795.35[51.90, 53.69]
Depression47.875.29[46.93, 48.81]44.182.77[43.44, 44.92]49.935.14[49.05, 50.81]
Anger46.574.45[45.49, 47.65]44.302.94[43.46, 45.15]52.365.91[51.36, 53.37]
Vigor42.337.25[41.07, 43.59]45.835.53[44.84, 46.82]55.025.94[53.84, 56.20]
Fatigue59.195.46[58.14, 60.23]45.394.57[44.57, 46.21]48.405.47[47.42, 49.38]
Confusion46.615.18[45.53, 47.70]44.123.64[43.27, 44.97]52.996.81[51.98, 54.01]
Table 3. Classification of discriminant functions (n = 746).
ClusterPredicted Group Membershipn%
123456
120900000209100
204880005685.7
30110210110597.1
40018611210086.0
59000153016294.4
65011110611493.0
Note. 1 = Iceberg, 2 = Inverse Everest, 3 = Inverse iceberg, 4 = Shark fin, 5 = Submerged, 6 = Surface.
Table 4. Distribution of clusters by demographic and lifestyle variables (n = 746).
SourceCluster
1%2%3%4%5%6%
Sex χ2(5) = 16.58 §
  Male (n = 199)73 §+36.7157.519 *9.518 *9.03919.63517.6
  Female (n = 547)136 §−24.9417.586 *+15.782 *+15.012322.57914.4
Age group (year) χ2(15) = 47.62
  17–30 (n = 243)27 *19.71410.22216.11611.72619.032 §+23.4
  31–40 (n = 263)45 *22.42110.440 §+19.93316.43517.42713.4
  41–50 (n = 236)80 *+33.9156.42912.33213.64719.93314.0
  51+ (n = 172)5733.16 *3.514 §−8.11911.054 †+31.42212.8
Smoking χ2(5) = 15.78 §
  No (n = 604)17729.3437.18413.98113.4140 *+23.279 13.1
  Yes (n = 142)3222.5139.22114.81913.422 *15.535 †+24.6
Exercise χ2(5) = 59.17
  No (n = 202)25 12.425 §+12.440 §+19.841 †+20.35326.218 §−8.9
  Yes (n = 544)184 †+33.831 §−5.765 §−11.959 10.810920.096 §+17.6
Overeating χ2(10) = 43.83
  Never (n = 117)4034.243.41613.71210.32924.81613.7
  Rarely (n = 495)156 §+31.5336.759 *11.96813.710821.87114.3
  Often (n = 134)13 9.719 §+14.230 §+22.42014.92518.72720.1
Health Status χ2(15) = 117.65
  Bad (n = 20)0 §−0.0315.09 †+45.0420.0315.015.0
  Satisfactory (n = 173)19 11.030 †+17.338 †+22.02514.54123.72011.6
  Good (n = 420)12429.522 §−5.25112.15713.69221.974 *+17.6
  Great (n = 133)66 †+49.61 0.87 §−5.31410.52619.51914.3
Note. 1 = Iceberg, 2 = Inverse Everest, 3 = Inverse iceberg, 4 = Shark fin, 5 = Submerged, 6 = Surface; + = over-represented, − = under-represented; p < 0.001; § p < 0.01; * p < 0.05.
Publisher’s Note: MDPI stays neutral with regard to jurisdictional claims in published maps and institutional affiliations.

