Abstract
Identifying causes of food waste at grocery retail level is crucial for the development of effective measures to reduce waste. Frontline employees manage food waste in their day-to-day operations; however, there is a paucity of research that draws attention to their knowledge of and approach to causes and measures to reduce food waste. In this empirical study, a mixed methods approach is adopted, using multiple interviews and participatory observations with employees, and primary quantitative data on fruit and vegetable waste for one year from the supermarkets. The results illuminate the fact that the role of employees is central for reducing food waste, and from their perspective, the causes and measures can be divided into four different main themes covering policy, practice, people and product. The analysis involves 73 different fruit and vegetables categories, and the fruit and vegetables waste at the three supermarkets is 60 tonnes. The results also reveal different causes for different fruit and vegetables categories, implying that generic descriptions of causes are not enough to use as bases for planning reduction measures. The paper provides a base for planning and implementing reduction measures for the grocery retail sector, which contribute to a sustainable food supply chain.
Keywords:
food waste; fruit and vegetables; retail; supermarket; causes; measures; employee; packaging; organic; store operations 1. Introduction
Food waste is a huge global environmental problem creating about 10 percent of the annual carbon dioxide emissions [1]. Avoidance and reduction of food waste should be prioritised to reduce the associated environmental, economic and social burdens [2,3,4]. Food retailers have an important role to play in efforts to implement reduction measures for food waste due to their central position in the food system [5,6], since they can influence both upstream suppliers and downstream consumers [7,8]. Studies have quantified food waste and suggested reduction measures in the entire food supply chain [9,10,11], mapped and recommended improved routines for recording retail food waste [10], and mapped and suggested preventive measures on a general retail level [11].
In a grocery store, the fresh fruit and vegetables (FV) department is where a large part of the food waste within the store occurs [12,13,14,15,16,17]. The waste quotas for FV range from 3 to 9% [12,13,14,15,16]. Additionally, the FV department has a special position, as many customers tend to choose a retail store based on their perception and experience of the department [18]. Therefore, management and maintenance of the FV department is important for many stores and retail chains. Nevertheless, managing an FV department is difficult and complex, as many of the products are perishable with a limited shelf-life, have sensitive logistical characteristics, and involve erratic demand patterns [19]. Investigations of retail store operations in relation to food waste carried out through interviews of store managers and managers at regional and headquarter levels have shown that the absence of proper work routines has a negative effect on food waste [19,20,21,22,23]. The employees are often portrayed as a negative factor in this regard, for instance, due to lack of training, knowledge and commitment, and incorrect handling [14,24,25]. However, a cost benefit analysis has shown that it can be cost-effective to spend more personnel time on waste management activities to accomplish waste reduction [26], and retail staff are considered to be a suitable group of informants for further examining causes of food waste [20]. Extant literature on food waste from the perspective of frontline employees is limited, and to the best of the knowledge of the authors of this paper, thus far, no research has been carried out to explore the contributions employees can make to the reduction of food waste. Previous studies have focused on the perspective of managers and there is a scarcity of research that draws attention to the knowledge and approach of employees, and how food waste is actually managed in their day-to-day operations. Since employees and their perspectives have been overlooked, some important aspects may not have been covered, and consequently, focusing on frontline employees will provide additional insights.
General causes of food waste at a retail level have been addressed in the literature [11,15,27,28], including appearance and shape, lack of coordination, lack of waste measurement, inadequate demand forecasting, and customers’ behaviour and demands. Inadequate packaging has also been identified as a cause of food waste, including damage during transportation, improper handling, and confusion regarding labelling of dates [29,30]. Within meat and dairy categories, organic products have a higher percentage waste vis-à-vis their conventional counterparts, and low turnover, short shelf-life and large wholesale packaging size were identified as the main reasons [31]. Many studies have examined causes of food waste in stores on an aggregated level [24], but nonetheless, general descriptions of causes are not necessarily applicable to all departments within a store and there is a paucity of specific knowledge about what is valid in each department. Furthermore, supplementary in-depth information on causes for different products and descriptions of the impact on food waste of different packaging solutions are absent [25].
Food waste at retail store level is a multifaceted research area with a multiplicity of influencing factors [24,32]. To gain a better understanding of the complexities involved in the occurrence and management of retail food waste, both qualitative and quantitative sources of data are needed, and the combination of these different data sources is often lacking in previous research [24,25]. There is also a need for empirical work with primary data collection, as well as more in-depth analyses of food waste at the retail level [33,34]. In this paper, a mixed methods approach is adopted, the perspectives of frontline employees are gleaned and first-hand data on food waste are analysed. This research aims to: (1) examine and categorise causes of and measures to reduce food waste from the perspective of frontline employees; (2) collect, compile and calculate the amount of food waste and waste quota for all FV categories, and create a top list with the products that cause 80% of the retail FV waste; (3) compile and calculate the amounts of food waste for both packaged and unpackaged products as well as for organic and conventional products on the top list; (4) use both quantitative and qualitative data to identify and explain product-specific causes of FV waste.
The paper makes two original contributions to the research literature on retail food waste. First, the findings cover the perspectives of the frontline employees and highlight the importance of their knowledge and practices since they prevent and reduce food waste on a daily basis. Second, the paper contributes to research literature by showing the product-specific differences and that different practices should be adapted for different products. The findings provide a better understanding of general and product-specific causes of food waste, and can thus support the planning and implementation of effective waste reduction strategies. Reduction of food waste at supermarkets saves resources and obviates financial losses, and is in accordance with the first and second steps of EU waste hierarchy [35]. Additionally, the findings can support food retailers’ work in addressing the UN Agenda 2030 SDGs [36] and the EU Action Plan for circular economy [37].
2. Materials and Methods
To answer the research questions in a comprehensive manner, a mixed-methods sequential explanatory design [38] was considered to be suitable to generate in-depth insights about the causes of food waste and measures to reduce food waste.
2.1. Mixed Methods Research Design
To understand the store environment and comprehend how food waste occurs, three different methods were used. The research design was based on mixed methods [38,39] and the design was uniform for all stores. Information about the employees’ daily work routines and waste management was gathered by conducting semi-structured interviews [40] with staff, and through participatory observation [41] during the work in the FV department. The authors obtained existing quantitative data from databases on food waste for one year that each store keeps. The methods complemented each other, and methodological triangulation [42] gave a more diverse description of the research problem.
2.2. Descriptions of the Stores
The three stores included in the study are located in different municipalities in Central Sweden. The sales area range between 4050 and 7000 square meters and the stores belonged to the hypermarket segment [43]. Two of the stores are proximal to the respective city centres, and the third store is adjacent to an external shopping centre. The stores are part of the same retail chain, called ICA, and the franchise is owned by different individuals. The ICA Group is one of the Nordic region’s leading retail companies and the largest player in the Swedish food retail market, with a market share of 36% [44]. At the time of this study, the three stores had the same main supplier of FV, had similar product ranges, used the same computerised ordering tool, had similar storage and cooling facilities, and received similar support from the retail chain’s headquarter. The waste that was generated in the stores was collected by a waste company and used for biogas production or was incinerated for energy recovery. In cases of food donation, it occurred after the food had been registered as in-store waste, meaning that there was no unrecorded food waste [45].
Each storeowner selected a contact person in their FV department, and in all the three stores, the employee responsible for the department was chosen. Those persons were also the most experienced among the personnel, and were considered specialists. One or two more employee/s from the FV departments from each store was/were involved on site for participatory observations.
2.3. Data Collection
On-site investigations were made at the supermarkets in their FV departments. The work in the FV departments was conducted independently of this study, in the sense that the work was performed before the study started and continued after the study ended. Before the main study commenced, an exploratory series of semi-structured interviews and participating observations with employees at one supermarket was executed. Based on the gleanings, an interview guide and a protocol for participating observations were developed.
2.3.1. Field Visits
With the intention of not disturbing the work routines, the store visits were planned in collaboration with the employees, and they were asked not to change their daily work routines for the visits. During the store visits, days and times were chosen to cover all parts of the work in each store, and each visit lasted for half-a–work-day. Seven employees from the FV departments (2–3 from each store) were interviewed and/or observed. Moreover, telephone conversations to follow up on the field visits were conducted, and respondent validations were executed. In total, 9 interviews, 19 observations, 3 follow-up calls and 3 respondent validations were performed. For more information about the respondents and data collection, see Table 1.

Table 1.
Information about respondents at the supermarkets and data collection.
Sequence of conducting field visits and data collection at each store:
- Store visit 1: interview in the back office of the store (1 employee), participating observations in the FV department (2 employees), field notes and photos on site, compiling memory notes;
- Store visit 2: interview in the back office of the store (1 employee), participating observations in the FV department (2 employees), interview in the FV department (1 employee), field notes and photos on site, compiling memory notes;
- Collecting data from the database on food waste kept by the store;
- Follow-up telephone call (1 employee), compiling memory notes;
- Processing and analysis of qualitative data (interviews and observations);
- Processing and analysis of quantitative data (waste data from the stores);
- Respondent validation: presentation and discussion of results (1 employee), compiling memory notes.
The first author conducted all interviews and observations, and in at least one of the visits to each store, the second author attended. To control for any distortion caused by the influence of any of the researchers, the findings were compared and discussed after the field visits.
2.3.2. Semi-Structured Interviews
The interviews were conducted face-to-face, and a semi-structured interview guide [41] was employed to ensure that the same questions were asked in all three stores. The main questions in the interview guide covered daily work routines, detailed questions about general and product-specific causes of waste, measures to prevent and reduce waste, and the decision-making process in each store. During the interviews, the employees gave both descriptions and interpretations of their work. When the interview was completed, the employee and the researchers jointly went to the FV department and the employee had the opportunity to demonstrate examples of practices that were touched on during the interview, especially if something was difficult to describe only by words. During the second and third interview, follow-up questions were sometimes asked to clarify parts of the previous interview, and elements from the preceding participating observation could also be brought up.
2.3.3. Participatory Observations
Participatory observations were carried out when the employees performed daily work routines. The observations were based on an observation protocol [41] and this approach ensured uniformity across all three stores, and to control and confirm what was stated during the interviews. Participatory observations took place together with the employee that was interviewed and with one or two more employees from the FV departments. During the observations, the researchers participated in all store operations, and photographs were taken to support the field notes. The observations revealed aspects of the work that had not been dwelt upon earlier during the interview, and enabled acquisition of detailed information about specific issues for each product. At times, it was possible to ask something directly during the work, and in other cases, the question was raised in a subsequent interview. To deepen the insights about the employees and what they were doing and why, the researchers spent many hours interacting with the employees in the supermarkets with the observation protocol but also with a high degree of flexibility in order to follow the employees, inspired by the Gioia method [46]. The Gioia method emphasises the importance of “get in there and get your hands dirty-research—madly making notes on what the informants are telling us, conscientiously trying to use their terms, not ours, to help us understand their lived experience”. During the field visits, the researchers also participated in internal store meetings where figures on food waste were presented and discussed among all departments.
In the pre-study, the authors sensed some reservations and anxiety from the employees during the interviews and observations, as well as around sharing sensitive information about food waste figures. Existing literature shows that interviewees can experience an interview as an inconvenient situation [47]. To reduce the inconvenience and distance between the interviewer and the interviewee, and consequently create data with larger nuances [48], the interviews and participating observations were carried out without any audio recordings. As a result, it was necessary to document the facts regularly and smaller breaks during the field visits were planned to reconsolidate and write down facts, comments and reflections from the interviews. All interviews and observations were documented through field notes the same day as the field visits. There was also a mutual agreement with the employees regarding follow-up telephone calls to confirm and seek clarification if anything from the visits was unclear. The extensive field notes with photos and follow-up calls reduced the need for audio recording.
2.3.4. Waste Data from the Stores
Data of in-store food waste were provided by each store for one year, from 1 December 2018 to 30 November 2019, in the form of records from the databases maintained by the stores. The staff registered all items that were unsaleable and were removed from the FV department. This procedure has been used for many years by the stores for internal follow-up and was performed independently of this study. In waste data, different types of information were registered such as what type of fruit or vegetable, information on whether it was sold in bulk, packaged or in pieces, the weight or amount, and the purchase price. In total, for all three stores, data from 43,137 waste registrations were analysed for this study.
2.4. Data Analyses
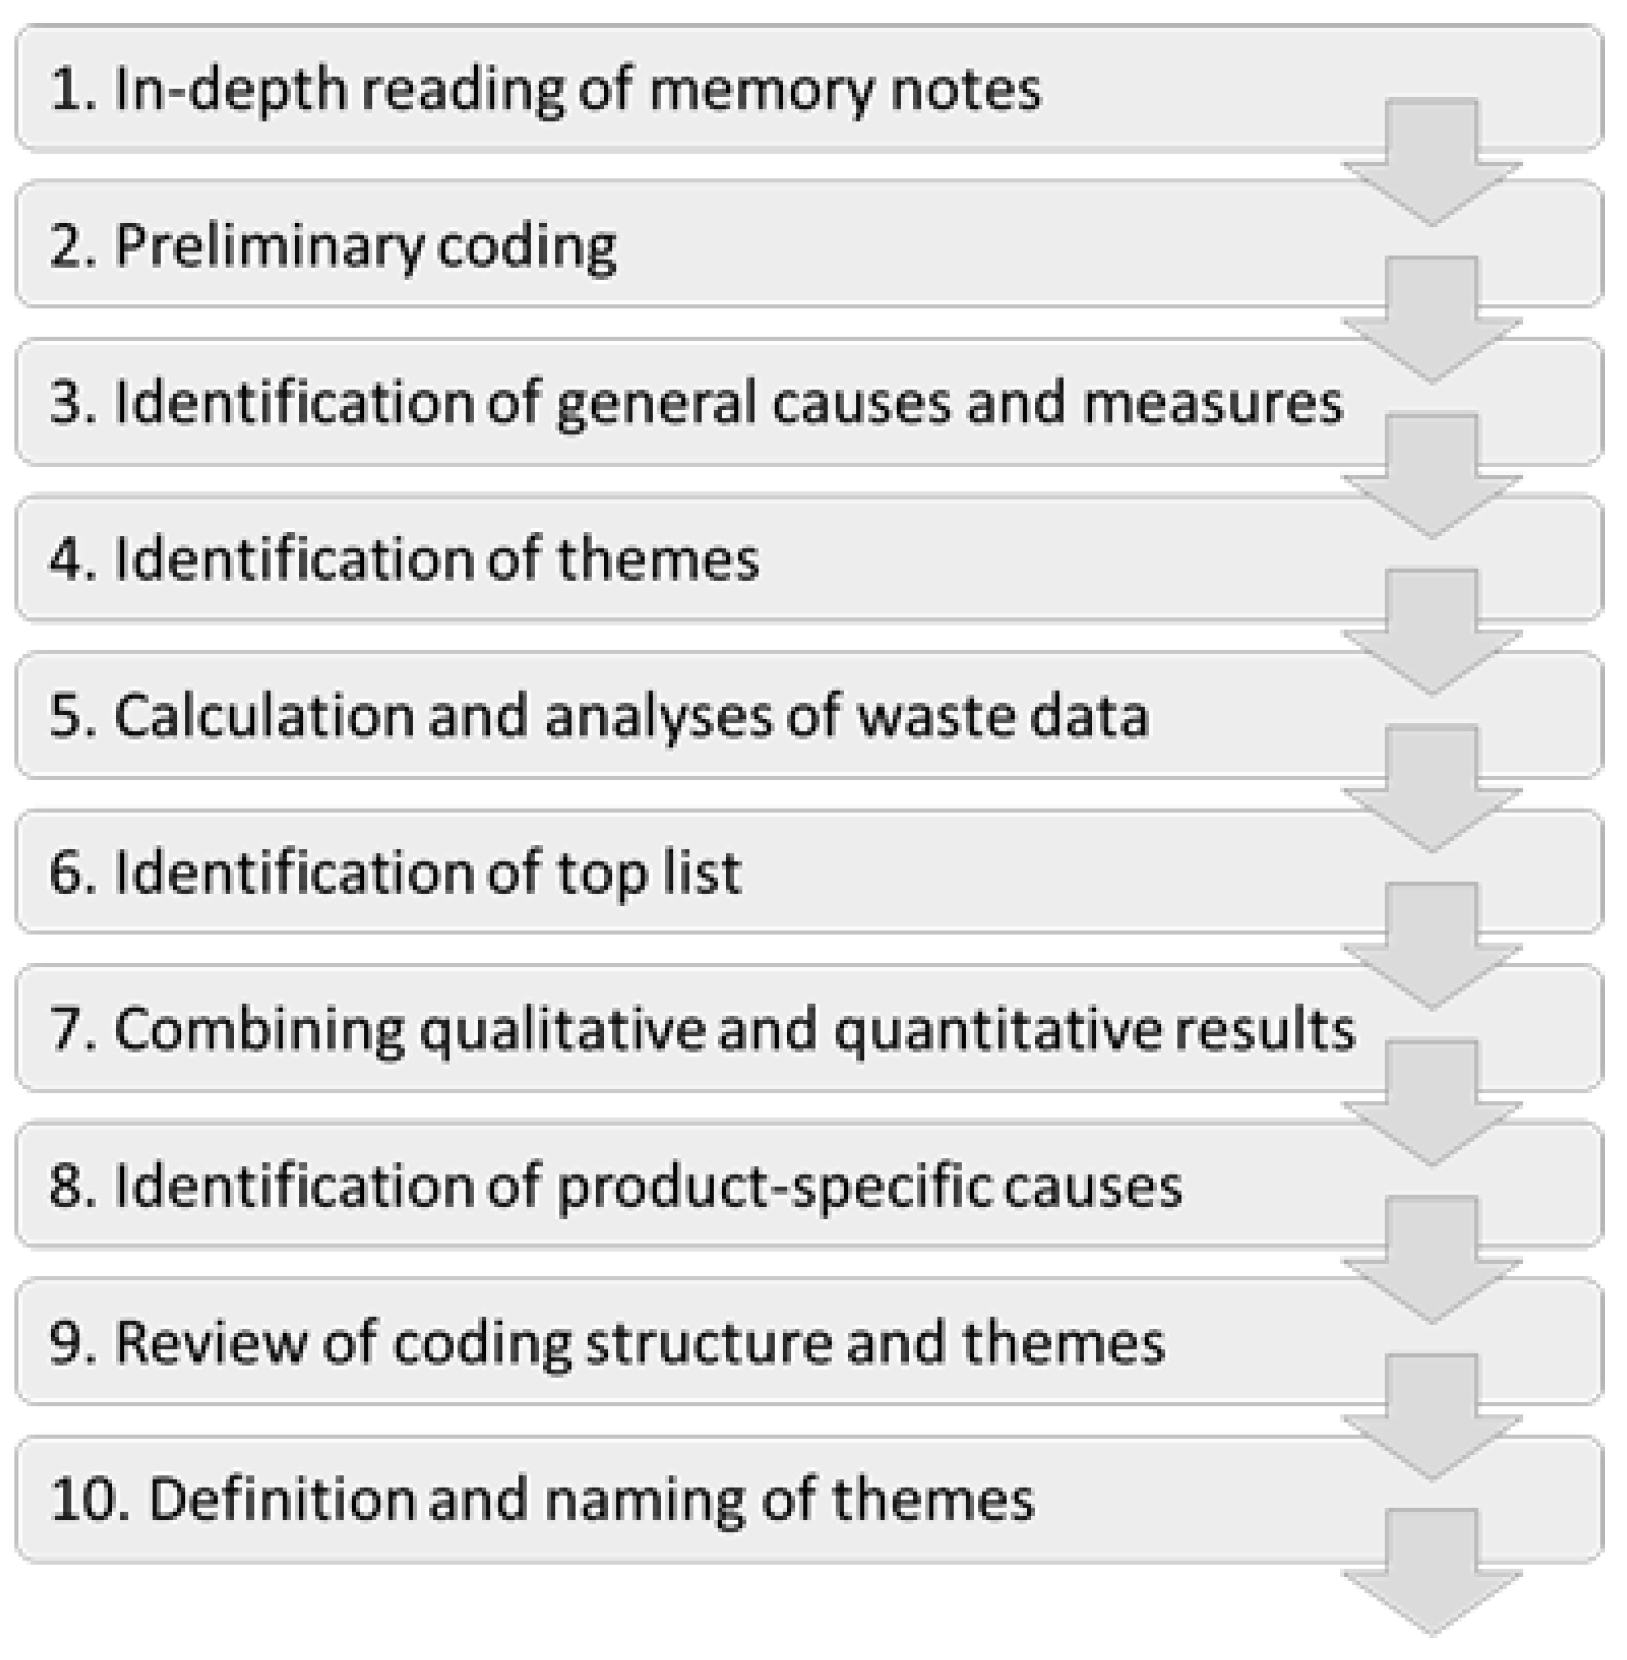
The data analyses were divided into three different main steps. At first, the qualitative analyses were performed, followed by the quantitative analyses, and lastly both qualitative and quantitative analyses were conducted. Analyses were made in an iterative process; moving back and forth between different data, a schematic figure of the different steps in the analysis process is presented in Figure 1.

Figure 1.
Schematic overview of the analysis process.
The qualitative data consisted of memory notes of interviews, observations and telephone conversations as well as photographs. Initially, the memory notes were examined in detail on several occasions to create familiarity with the content. Subsequently, the analytical coding and categorisation were inspired by the analysis in grounded theory [49]. A direct content analysis approach was applied as a preliminary coding scheme [50]. The themes were organised in two different tracks; the first track followed various activities and factors related to food waste management at the department, and the second track followed the different FV categories and their causes of waste. The qualitative data were reviewed several times before reaching a stage of saturation, at which no further themes emerged from the processes [51].
The quantitative data were processed and analysed using Excel spreadsheets. In the data processing, the same type of fruit or vegetable constituted one category; for example, all different varieties of apples became an apple category. The same procedure was performed with all types of fruits and vegetables. For each category, data about waste weight and waste quota were calculated. The waste quota was defined as the waste in store in relation to the sold quantity and was calculated with the equation: Waste quota = Waste weight/(Waste weight + Sold weight). Before detailed analysis of the waste data was conducted, the information was checked manually, and any errors and inconsistencies were followed up. Whenever possible, data were corrected and in other cases, the inaccurate data were excluded from further analysis. The waste weight of the excluded products corresponded to 0.01% of the total waste weight and none of the FV categories were overrepresented. When calculations were completed for all FV categories, the top categories that together corresponded to 80% of the total amount of waste were identified. For each FV category at the top list, special attention was paid to the differences of waste between packaged/unpackaged and organic/conventional products. If the share of packaged or organic products was less than 5% for any of the FV categories, no figures were reported since the proportion was considered to be too small to warrant an analysis.
In the final phase, both qualitative and quantitative results were analysed in order to identify product-specific causes of waste. For every FV category on the top list, data pertaining to food waste were examined in relation to qualitative data about the specific product. The process was iterative and new themes related to general and product-specific causes of waste emerged until saturation was reached.
2.5. Delimitations
Only fresh fruits and vegetables were included in the study. Preserved, dried or frozen products were excluded. No distinction was made between edible or non-edible food waste since the products, including the peel and haulm, were sold as whole products and the weight of the whole products was reported as waste by the stores. Only in-store waste was studied, so pre-store waste [52], take-back agreements [53] and other in-store operations for unsaleable products [54] are beyond the scope of this study.
2.6. Ethical Considerations
The respective storeowners agreed that their store would be included in the study; they facilitated interviews and observations in the FV department, gave access to the waste data, and consented to the publication of the results. All the respondents gave their consent to use their answers in this paper, on the condition of anonymity. The study has been communicated to the stores in an open and transparent manner. The outcome has been presented to and discussed with the storeowners and employees.
3. Results
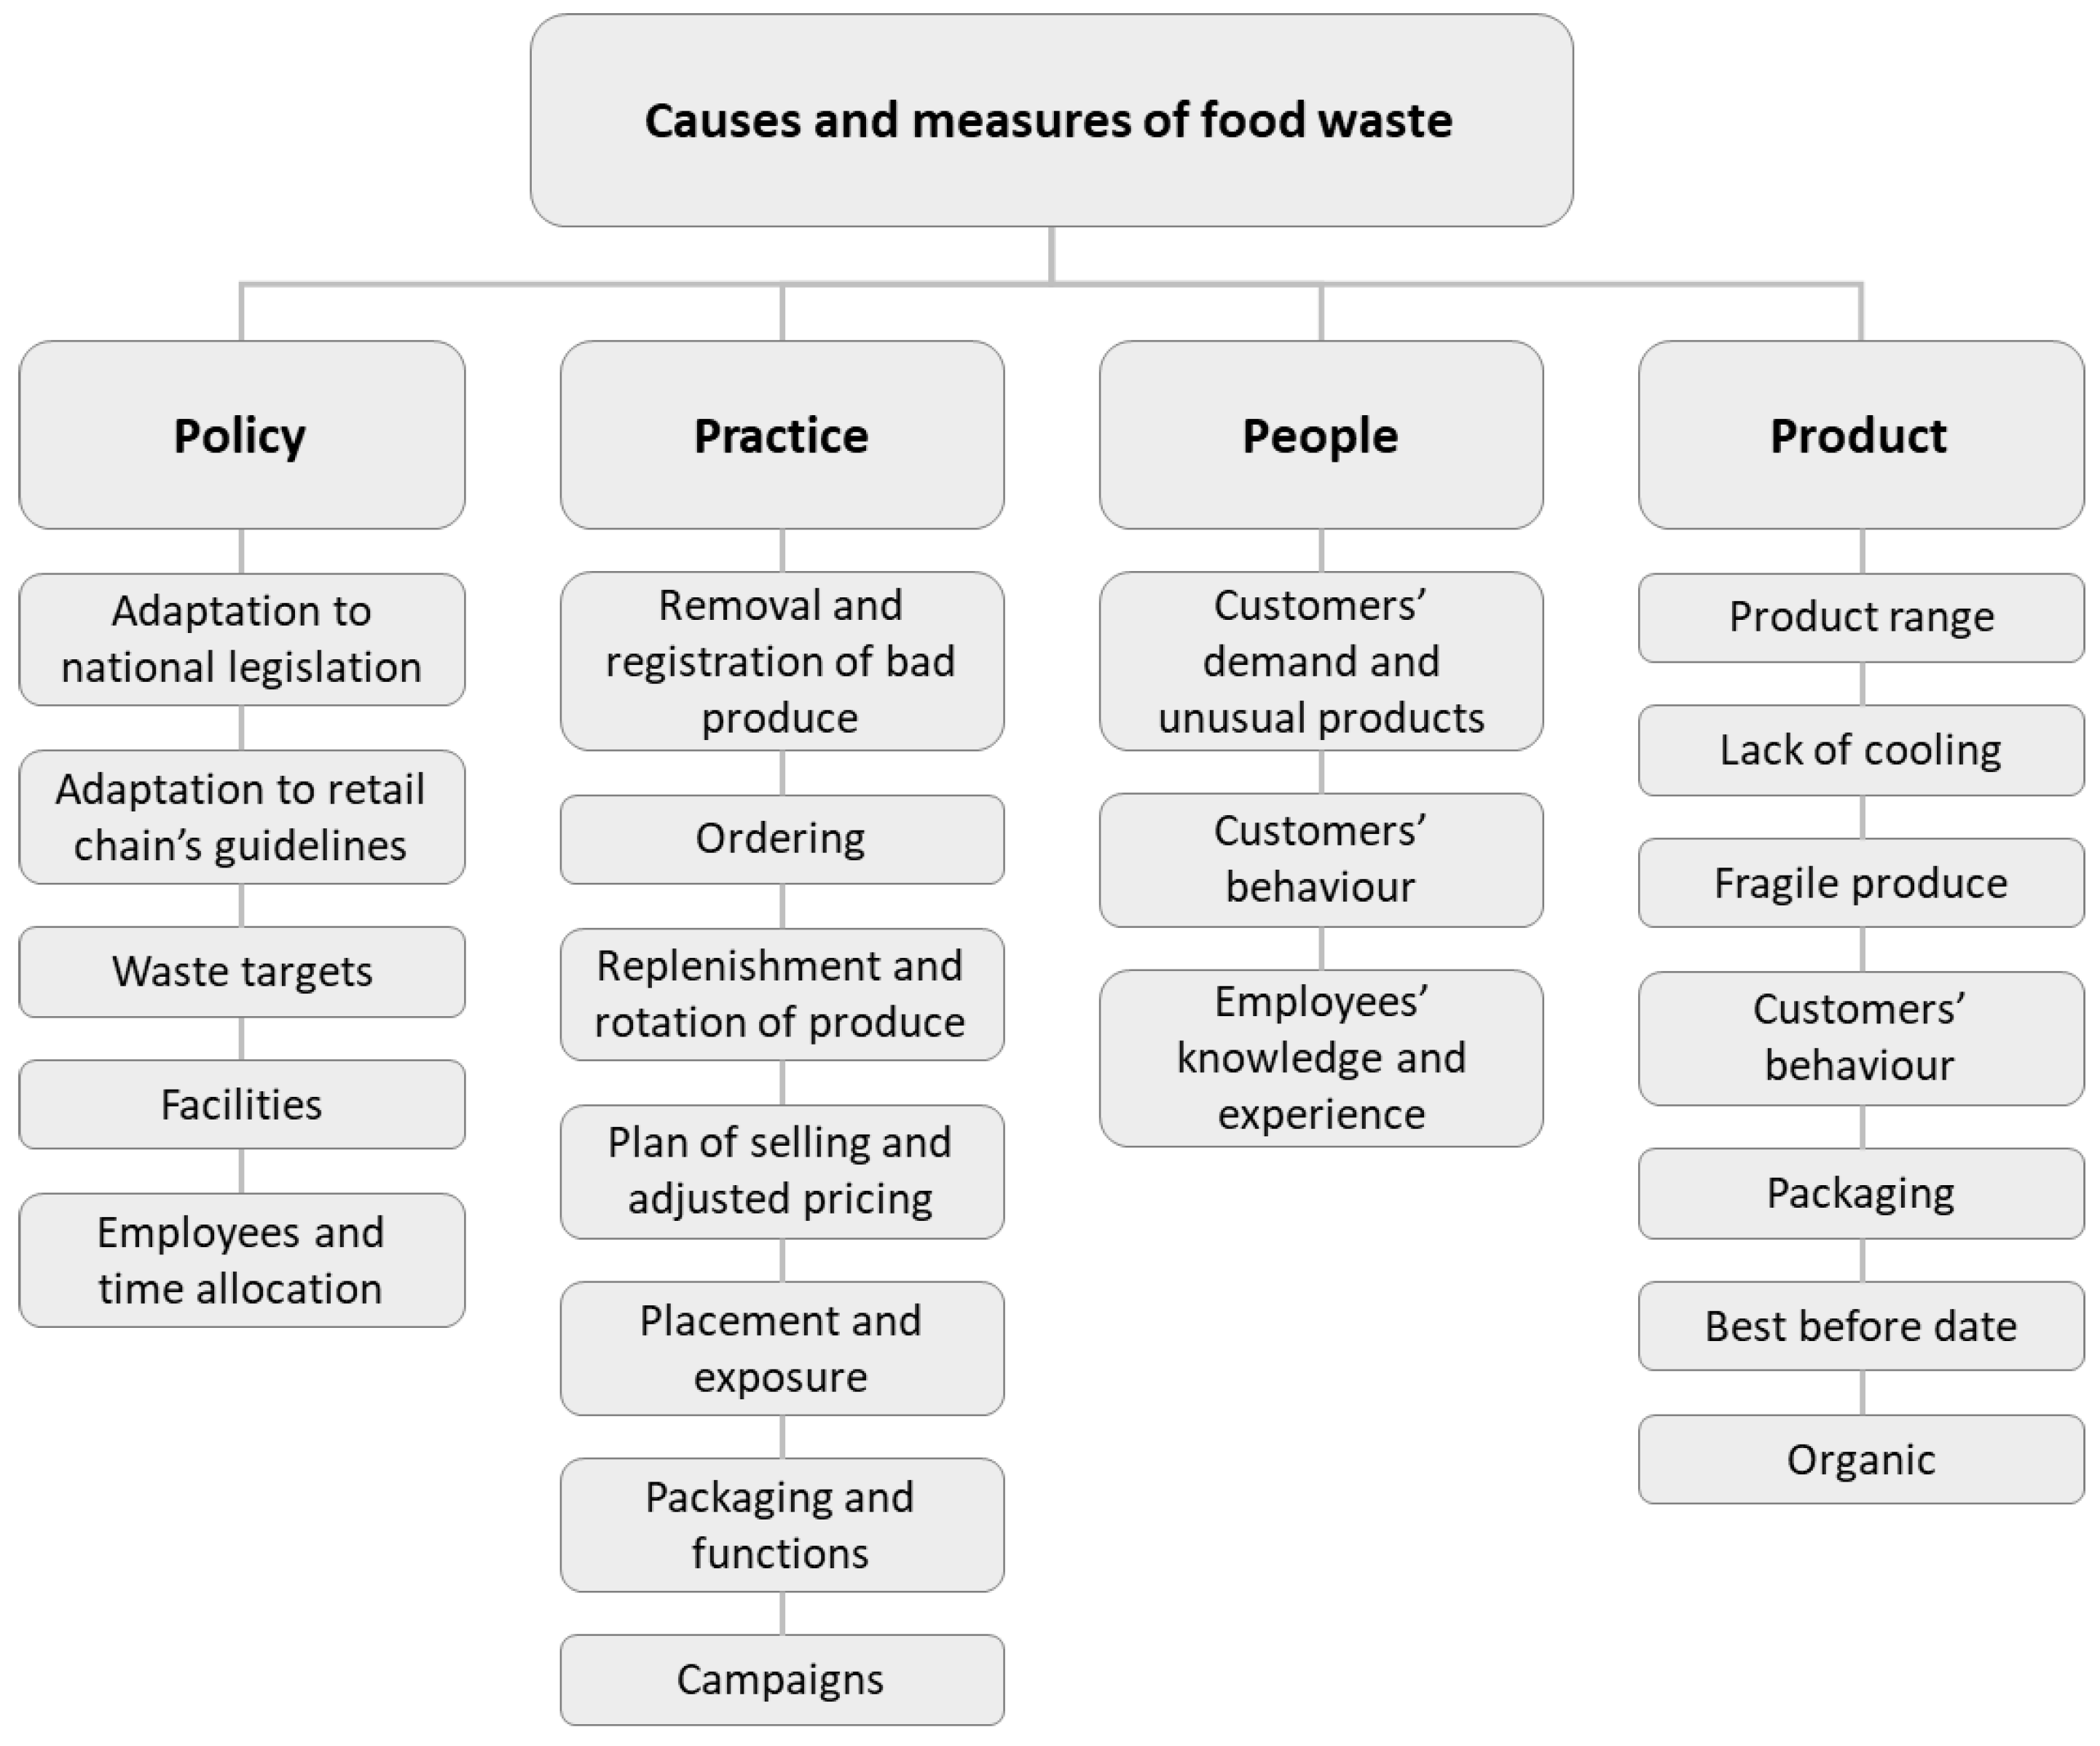
Food waste in the FV departments was not a result of a single cause, but rather combinations and interactions of multiple causes. Based on the employees’ perspective from semi-structured interviews and participating observations, and data on waste, provided by the stores, four main themes emerged that describe different aspects of causes and measures of food waste at supermarkets. The themes were policy, practice, people, and product. No hierarchy has been detected among these four main themes, but they were all connected and dependent on each other, and sometimes the themes partially overlapped each other. Each theme consists of several sub-themes, and the themes will be elaborated in sections further down. An illustration of all themes and sub-themes is presented in Figure 2.

Figure 2.
Causes of and measures to reduce food waste at supermarkets’ fruit and vegetables department from the employees’ perspective, categorised thematically.
3.1. Policy
Based on the employees’ perspective, one theme that influenced the causes of and measures to reduce food waste was policy. It includes guidelines describing how the employees should deal with different areas; adaptation of national legislation, adaptation of the retail chain’s guidelines, internal waste targets, waste information feedback, size of storage and cooling facilities, design of FV department and display units, participation in campaigns, number of staff and time allocation. The employees did not make any decisions about these areas, since it was rather the responsibility of the managers. Nevertheless, the employees had been delegated the responsibility to operate the FV department, and had a pronounced mandate to execute daily work routines and make their own decisions within the framework of the policies.
3.2. Practice
The theme of practice, which also emerged from the employees’ perspective, contained well-defined and agreed-upon in-store operations. The practices among the three supermarkets were uniform since they belong to the same retail chain following the same guidelines. According to the staff, certain tasks and handling of different situations were directly decisive for food waste, and they considered the practices as combinations of both causes of food waste and measures to prevent food waste. The analysis of qualitative data identified several general causes and measures within this theme. The results have been presented hereunder in the order in which the tasks were usually performed in the FV department.
3.2.1. Removal and Registration of Bad Produce
Frequent removal of bad produce was an important part of the work routines to reduce waste, since it minimised the risk of bad produce contaminating other produce. As a daily duty before opening, the employees always made a waste round in the morning. The employees controlled the quality of the fruits and vegetables and removed those that did not meet the quality criteria. When they removed bad produce from the shelf, they asked themselves, “Would I buy this myself?” If the answer was “No”, the produce was removed. Minor details in the assessment differed; however, the differences among colleagues were considered to be an advantage, since customers also have different requirements. Information about the food waste, such as type, weight or amount, was fed into a small hand device, which later was connected to a computer and the database on food waste kept by the store. Only the regular employees did waste registrations in order to minimise mistakes. The registered information was used for internal waste targets and waste figures were reported at weekly internal meetings.
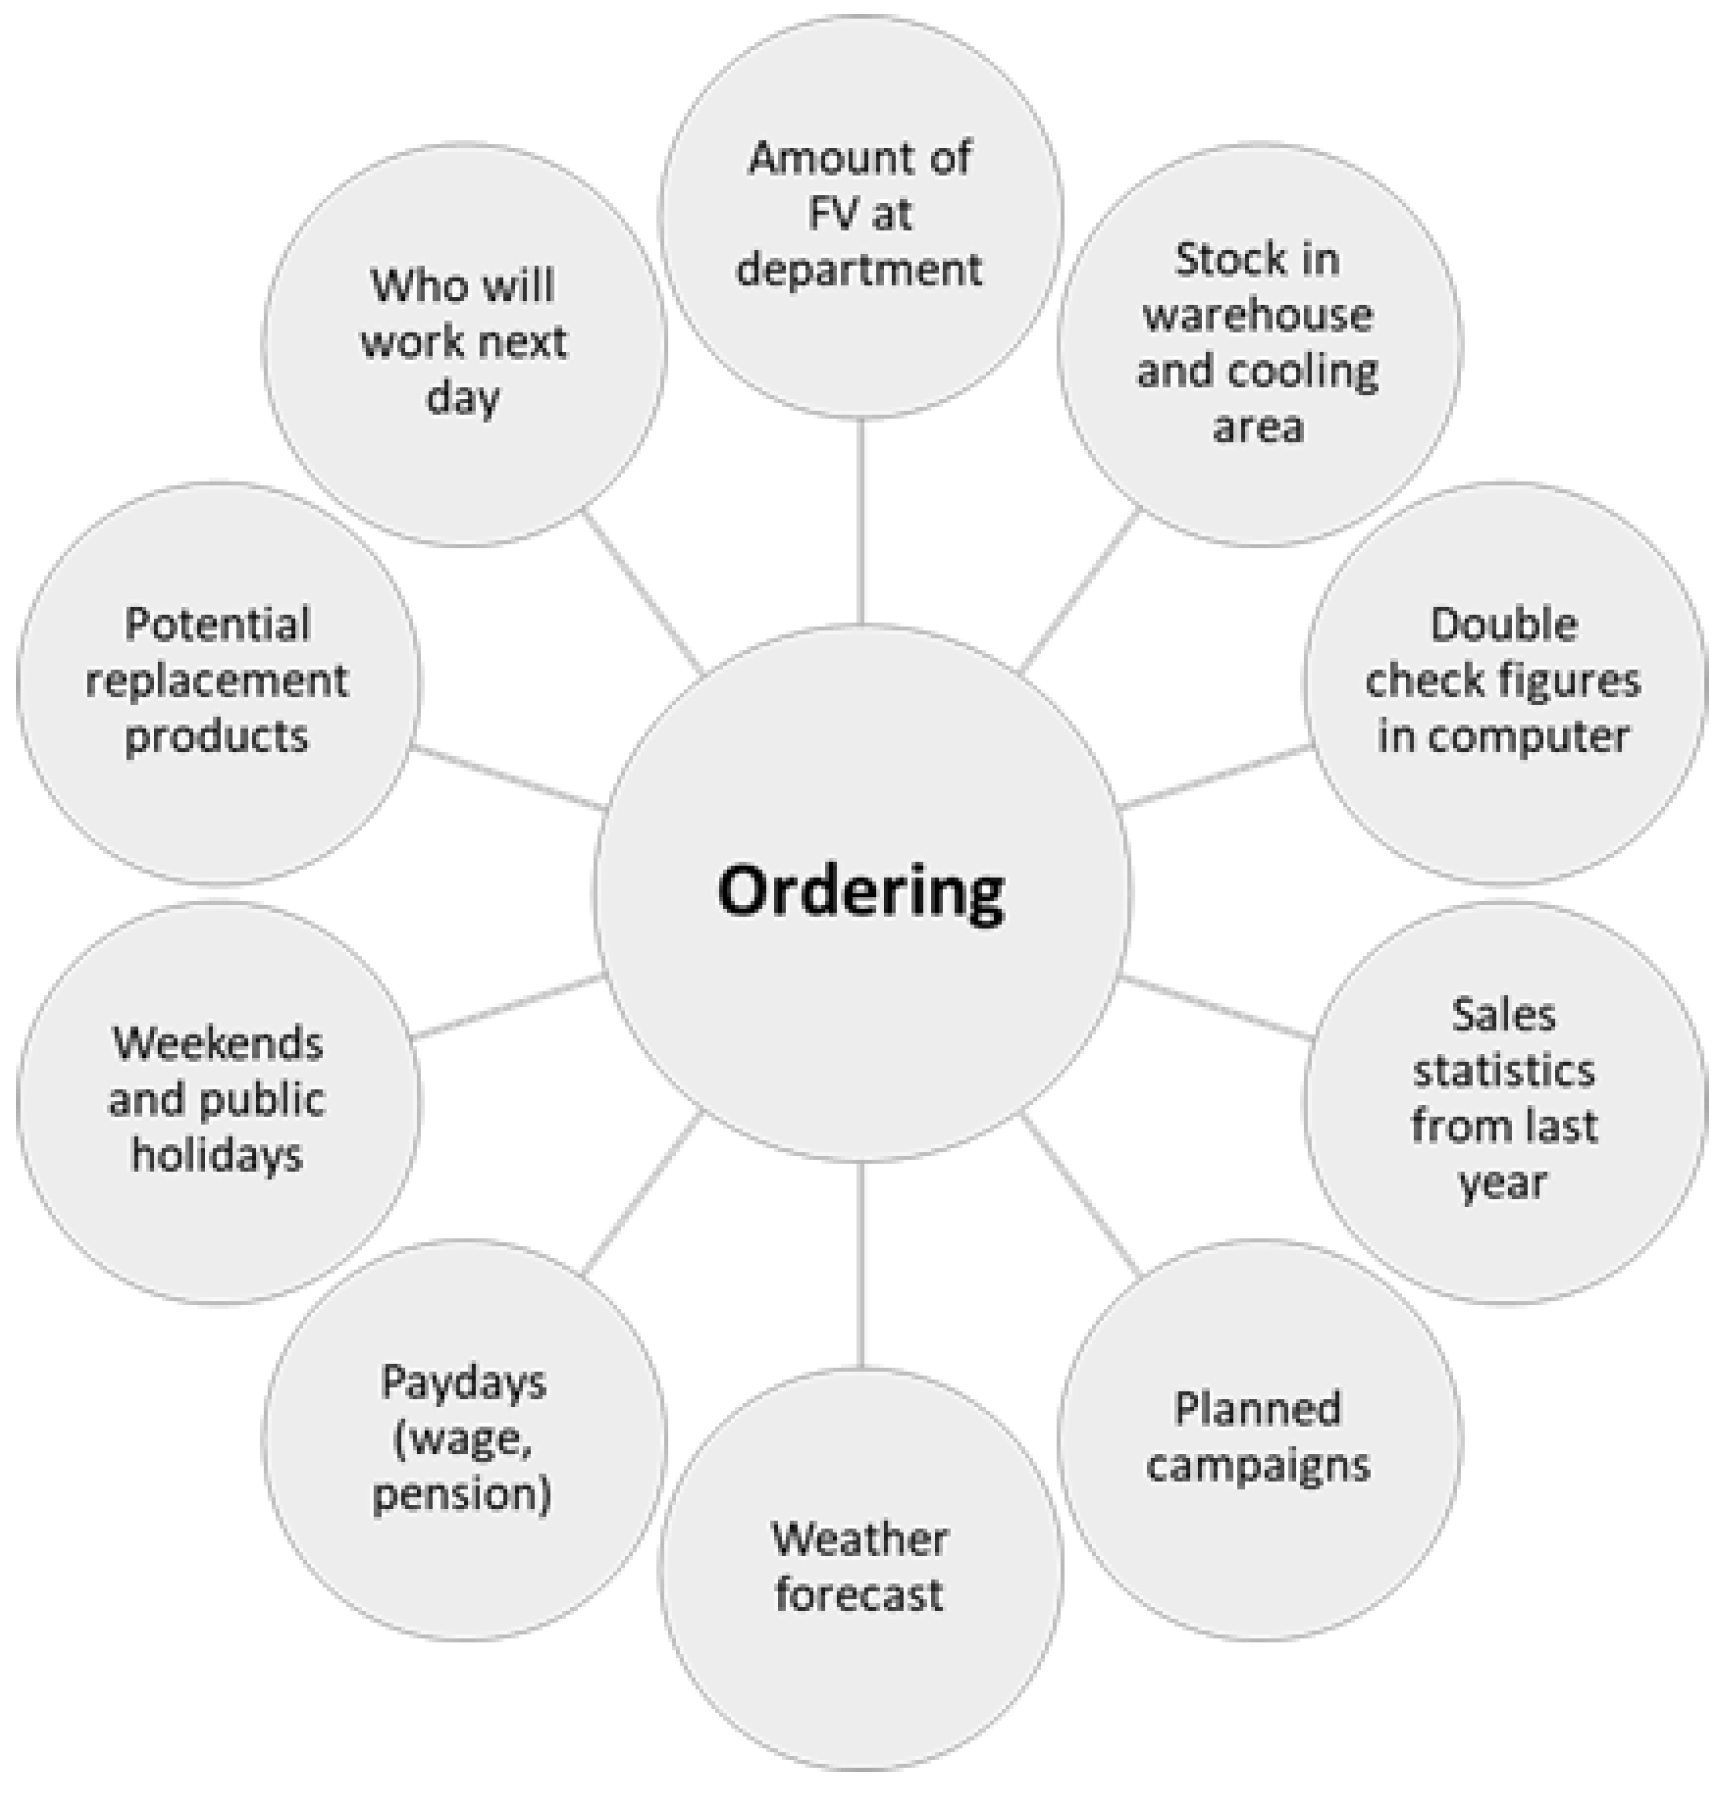
3.2.2. Ordering
Making accurate orders affected the amount of waste. The employees considered that placing correct orders was the foundation of having low levels of waste. Orders were placed on a daily basis, and even though all members in the FV department could do so, it was usually one of the most experienced employees who did it. To order the right quantity, the employees needed to consider up to ten different factors before making an order, as illustrated in Figure 3. Initially, the employees checked the department, warehouse and cooling area to make an inventory of the stock. The stores had a digital ordering tool that took into account how much of an item was in stock as well as sales statistics from the corresponding period of the previous year, and based on that, suggested the quantity to order. Due to thefts and errors from the self-scanning, the employees still had to verify the balance of certain items. Additionally, the employees needed to take into account campaigns, the weather forecast, paydays and public holidays, since different occurrences affected customers’ demands. The employees also considered if the product had any replacement products; for instance, if the sweet peppers in bulk would go out of stock, there should be packaged sweet peppers to buy instead. The last factor to consider was to check who was going to work the following day, since regular and experienced personnel could handle large deliveries more easily.
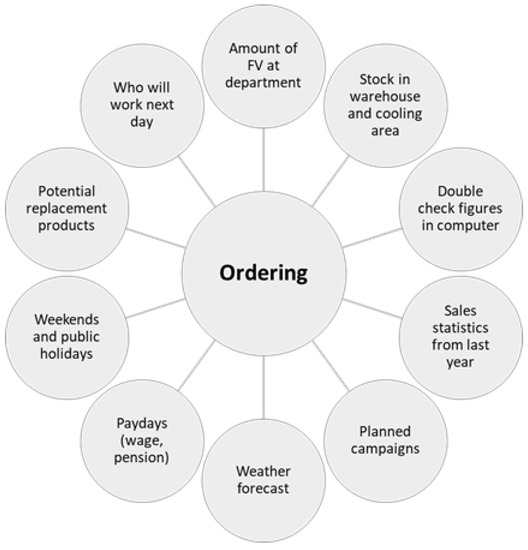
Figure 3.
The employees had to consider up to ten factors when making orders of fruits and vegetables.
3.2.3. Replenishment and Rotation of Produce
An important work routine at the FV department was the replenishment and rotation of products. New products were replenished from the upper part of the display units, and products with best before dates were replenished from behind so that those with earlier dates could be sold first for the purpose of reducing food waste, following the first in first out model. The replenishment was carefully conducted to avoid damaging the products. The secondary packaging was replaced regularly to avoid contamination.
3.2.4. Plan of Selling and Adjusted Pricing
Having a plan of selling and adjusting the price when needed kept the sales volume high and waste level low. The employees always planned the selling and pricing. If a product approached its best before date, and/or there was a surplus of a product in stock, the staff could adjust the price downward to increase sales and in that way prevent waste.
3.2.5. Placement and Exposure
The placement and exposure of products could increase shelf-life and sales volume, and thereby reduce the amount of waste. Shelf-life of some products could be lengthened if refrigerated, while some others were more durable at room temperature. It was sometimes a balance of decisions; for instance, peaches lasted longer in cooler temperatures, but the sales volume was higher outside since the exposure was better and it was easier for the customers to find the peaches. If products that preferred lower temperature could not be placed in a refrigerator, it was important that the turnover was high, so that the produce was not kept at a suboptimal temperature for too long. Proper placement and display were also essential for some products that were pressure-sensitive and for products which could not be kept in close proximity to certain others to obviate faster ripening.
3.2.6. Packaging and Functions
Packaging contributed both to a reduction of waste in some cases, and to an increase of waste in some others. The packaging system had large variation. The material of primary packaging varied but plastic dominated. Several products were sold both in bulk and with primary packaging. Primary packaging was important for protection of vegetables such as sweet pepper and tomato. The disadvantage with some packaging solutions, such as grapes or pears packed in plastic boxes, was that if one or two items turned out to be bad, the entire box was often discarded. Time constraints disallowed the employees to remove the defective pieces and retain the box for sale. In some other cases, primary packaging was used mainly for convenience for the customers, for instance in the sense that it was easier and faster for customers to grab a number of oranges in a plastic mesh bag or a number of pears in a plastic box without a lid wrapped in mesh net instead of picking several individual items. The weaknesses of such convenience packaging were twofold: it did not offer any protection, and there was no possibility to open, remove the bad produce and reseal. Packaged products with best before dates had a higher waste quota compared to other products belonging to the same FV category. It was also time-consuming for the employees to check, rearrange and remove products with a best before date.
Secondary packaging mainly consisted of cardboard boxes or plastic crates. These types of secondary packaging could be placed directly at the display units, or the products could be moved into another tray or shelf in the store. One problem with secondary packaging was the amount/quantity of the contents. For example, secondary packaging with mini carrots contained 16 plastic bags, which was more than the stores could sell before the carrots lost their freshness. The staff stated that they would have liked to have the option to order smaller amounts (quantities), even if it meant the payment of a higher (unit) purchase price.
3.2.7. Campaigns
Products on campaign resulted in more waste. The stores had a policy that a product on campaign should never run out and thereby deliberately placed large orders so that availability could be guaranteed. The employees spent more time on products on campaign because they needed to be refilled continuously. Another detrimental side effect of campaigns was that they often lowered the sales of similar products.
3.3. People
Based on the employees’ perspective, the qualitative analysis identified people as one theme, including both employees and customers. Employees were central actors in relation to keeping the level of waste down due to their knowledge, experience, mandate, awareness of product-specific causes and meeting customers’ requirements. Customers affected the waste through their behaviour, demands and careless handling.
3.3.1. Customers’ Demand and Unusual Products
Products with uneven demand and unusual products often had high waste, and employees had to handle trade-offs between customers satisfaction and waste reduction. The stores had therefore chosen to remove some of the unusual products, such as various exotic fruits, from their regular product range and only order them for particular weekends and holidays. The demand for fresh herbs was uneven, they periodically had high waste and the sales margin was low. Despite that, the stores had chosen to offer these products to customers. The low profit margins were acceptable in light of the fact that customer service was paramount and these products were difficult to replace. The stores also sold organic products at a lower profit margin, vis-à-vis conventional products. The stores still wanted to retain a low selling price with the customers’ interest in mind, and they argued that if there were no cheap organic products, the store might lose the customer completely. On a regular basis, the staff inspected what products had high waste and low sales volume and occasionally removed those products from the range. When new products were brought into the department, the staff expected it to take some time before customers would find them, and higher waste in the initial phase was then accepted.
3.3.2. Customers’ Behaviour
Customers’ behaviour affected the amount of waste and the working routines. Theft and customers’ mistakes committed during self-scanning of weight and price posed a challenge to the stores. Such anomalies resulted in an incorrect balance and could lead to inaccurate orders being placed. Another example of undesirable customers’ behaviour involved selecting or handling fragile products such as avocados, in which case some customers squeezed the avocados to determine the level of maturity in a way that damaged the avocados and caused them to be discarded.
3.3.3. Employees’ Knowledge and Experience
Employees affected the amount of waste. The complexity of the daily work at the FV department required skilful employees, and it was in this department that the management often placed the most experienced and committed employees. The role of employees was central, since most of the decisions were made and executed by employees. Their ability was affected by their knowledge, experience, time, and well-defined and established daily working routines. The employees’ mandate and assignment of responsibility also influenced how they solved certain tasks during the day. For instance, if the employees noticed that they had too much packaged lettuce that was about to reach the best before date, they could independently decide to change the exposure and pricing of the lettuce in order to increase sales. The employees also played a central role in the daily work at the department since it required constant supervision. They had to refill products that had run out, rearrange display units and shelves to make them look neat and tidy, and be available to customers. The employees often noticed changes in orderliness and a mismatch between orders and actual need after a period when a non-regular member of staff had been working. The employees explained several trade-off situations, for example, between maximising sales volumes and efforts to reduce food waste. The employees were updated and aware of how much waste the FV department generated. Waste figures of each department were discussed once a week at internal meetings and each department had internal waste goals. The employees regularly participated in training and group meetings arranged by the central organisation of the retail chain.
3.4. Product
The final theme was product. During the semi-structured interviews and participating observations, the employees highlighted and showed that different products have different preconditions in terms of sensitivity and durability, and therefore adjustments of practices were needed based on what product it was. Therefore, as a complement to the qualitative data, quantitative data were needed to capture the details of different products. To begin with, the quantitative data were analysed, including waste quotas and the differences of waste between packaged/unpackaged and organic/conventional products. Subsequently, both quantitative and qualitative results were analysed in order to identify product-specific causes of waste.
3.4.1. Amount of Food Waste
The total amount of FV waste at the three stores was 60 tonnes, with an average waste quota of 1.4%, and involved 73 different FV categories. The top FV categories that together corresponded to 80% of the total amount of waste were identified and consisted of 19 FV categories. Waste data for the 19 FV categories were analysed with special attention to packaged and unpackaged products as well as organic and conventional products, and are presented in Table 2. The total share of packaged products was 39% and the total share of organic products was 10%.
Table 2.
Accumulated waste data for three supermarkets and the top 19 fruit and vegetable categories that together corresponded to 80% of the total waste, and the share of packaged and unpackaged products and organic and conventional products. Note: When the share was smaller than 5%, no data are provided and the field is marked with *.
3.4.2. Product-Specific Causes
When analysing and combining qualitative and quantitative results for each FV category, several causes of waste appeared. Policies and practices affected almost all products, for example, accurate orders and regular rotation of produce. In addition to these general causes, there were also specific causes for the different FV categories. An overview of product-specific causes is presented in Table 3 and is further elaborated upon below.
Table 3.
Overview of product-specific causes. Qualitative and quantitative results were analysed to describe the product-specific causes of waste for each of the 19 fruit and vegetable categories.
A broad product range was kept by all three stores. For example, one store offered 49 different variants of lettuce and 32 different variants of tomatoes throughout the year, and the large selection increased the risk of waste because of difficulties in predicting the demand and making correct orders. Potato also had a large product range that made the demand difficult to predict. The waste quota of cabbage, carrot and onion was low, however, while some of the more unusual types with low demand within the same FV category had higher waste quotas. Berries have irregular demand from time to time, causing a high waste quota, but the stores still wanted to prioritise customer service and still offered the products. The case of cucumber differed, in the sense that it had high turnover and had few varieties. On the other hand, compared to, for instance, tomato that had many different varieties, the product could not be substituted with a similar product, and therefore the stores ordered some extra to make sure that they would always had cucumbers in stock.
Lack of cooling made several FV products lose their freshness quickly. Cooling prolonged shelf-life and resulted in lower waste. Potato, melon, sweet pepper, grape, carrot and lemon were usually placed in the cold, but due to a lack of cooling areas, there was always a compromise as to which products were placed in the refrigerator.
Some products were more sensitive and for fragile produce it was especially important to have correct execution of employees’ practices. Banana was a sensitive product and required gentle replenishment and stacking. Pears and nectarines had a thin peel and needed thorough controls and removal of damaged products to avoid bad produce contaminating others. Other products considered sensitive were sweet pepper, berries, avocado and some types of cabbages. Tomatoes, apples and melons could be bruised by the employees when replenishing unpackaged products if not treated with care.
Customers’ behaviour could cause food waste. For instance, it often happened that customers divided a bunch of bananas and single bananas were left on the displays. Customers were demanding and wanted green to yellow bananas and often rejected yellow ones with small brown dots. Moreover, customers often chose products, such as lettuce, with the longest best before date, leaving bags with fewer days on the shelves. Pears had thin and sensitive peel and the product could easily be damaged by customers when treated improperly. It was also common that customers damaged avocados when they tried to decide their maturity by squeezing them, and many items were discarded due to this behaviour. It happened frequently that customers took apples that were more expensive but self-weighed and labelled them as a variety with a lower price. This could lead to incorrect figures in the ordering system and in turn cause incorrect orders.
Products with primary packaging gave both higher and lower waste. An explanation for the high waste of packaged pear, grape, nectarine and onion was that if one piece of fruit was damaged, the entire lot was wasted. The waste quotas for packaged orange, clementine and lemon were higher than for the unpackaged alternatives. The packaging for these products was a mesh polypropylene bag, which did not have any protective function but made it easier for customers to grab a bag and move on. If one clementine, for instance, turned bad, the whole package was wasted. The waste quota for packaged clementine was 2.4% and for unpackaged, it was 0.6%. Some of the banana types were packaged in plastic bags and condensation was formed, which turned the bananas bad. For some other products, the packaging reduced the waste. The waste quota of packaged tomatoes was 0.9% and for unpackaged, it was 1.6%. The plastic clam shells dominated the packaging of tomatoes, but there were other plastic and cardboard packaging solutions available occasionally. Tomatoes were sensitive and could be bruised by the employees when replenishing unpackaged tomatoes, and the packaging protected the produce from damage. The waste quota for packaged sweet peppers was 2.1%, and unpackaged sweet pepper was 4%, indicating that the protective function of the plastic around the produce played a role in reducing waste from both handling and evaporation. The same case goes for carrots, as the waste quota of packaged carrots was 0.5% and for the unpackaged 2%.
Best before date was mainly used on washed and packaged products. The waste for potatoes depended mainly on the best before date. Packaged potatoes were removed when the best before date came close to expiring. Melons and some cabbages were sold cut and packaged in plastic wrapping. Produce cut at the department was forced by law to have a best before date label, which shortened the shelf-life and increased the waste. The store provided the service to households that did not want to buy an entire melon or cabbage. The lettuce also had a best before date and it was removed one or two days before the date expired. This increased the food waste. For lettuce, the waste quota for products with a whole plant and no best before date was 0.9%, and for packaging with lettuce leaves and a best before date, the waste quota was 5.1%.
Organic products often had higher waste quotas compared to their conventional counterparts. This was true for banana, apple, tomato, lettuce, orange, cabbage, and onion. Purchase prices for organic products often fluctuated over the course of the year, and the effect of pricing affected the willingness of customers to pay, while making it difficult to predict the demand.
4. Discussion
General causes of food waste at retail level have been addressed in the literature on an aggregated level [24] and the store owners’ and store managers’ perspective on food waste have been examined [19,21,22,23]. Nevertheless, there is a lack of research that explores the knowledge and approach of frontline employees and also studies where qualitative and detailed quantitative data are combined [24,25], as well as more in-depth analyses of food waste at the retail level [33,34]. In this study, frontline employees’ perspective on cases of and measures to reduce waste was studied and a mixed methods approach was adopted, using data from interviews and observations and in-depth analyses of waste figures. This resulted in new insights into food waste at supermarkets. The key findings are that employees with experience and mandate are crucial for reduced food waste. Furthermore, when developing waste reduction strategies, detailed knowledge about different products and an understanding of their respective causes are required. Based on the employees’ point of view, four main themes explain the causes of food waste: policy, practice, people and product. The four main themes and their respective sub-themes are illustrated in Figure 2.
4.1. The Central Role of Employees
The employees have a critical role in the FV departments, as they actively manage the causes of food waste and are equipped to take a variety of precautionary measures to avoid and reduce food waste. The results in this study illuminate how complex the work in an FV department is, and highlight the need for well-defined and established operational activities. On a daily basis, employees must take into account the effort of the store to make a high profit, make customers satisfied and keep low waste figures. To handle the contradictory demands, the employees have some mandate to make their own decisions about several activities and find a balance between different needs.
An example of new detailed insights concerns how to make accurate orders, which is not as simple as other studies have suggested [11,15,27], nor have these previous studies appreciated the realities and complexities of this task. This study reveals that the employees have up to ten different factors to consider when making orders, as illustrated in Figure 3. In the ordering process, many decisions are made that can prevent food waste. It is therefore important with time allocated [26] for the ordering process and experienced employees. The results of this paper contribute to better understanding of the role of employees in preventing food waste, and demonstrate the positive consequences of granting members of staff more agency. Other studies [19,23] have highlighted the need for efficient store operations regarding replenishment and price adjustments for products close to expiration. The present study confirms that replenishment and adjusted price are of importance, and additionally, it elaborates on how employees can be involved in several other store operations to avoid and reduce waste. Staff are often portrayed negatively and presented as a root cause of food waste [14,24,25], but our results show the opposite. Employees who have knowledge, experience and mandate contribute actively to the monitoring of food waste and are crucial actors for reducing it, and the recommendation is to support the employees with training and time allocated to execute their tasks. This result is in line with a recent study [55] that highlights the role of training as the second most important strategy for food loss and waste mitigation. Since sustainability work can attract and engage employees [56], strategies and systematic work for reducing food waste can be important for the supermarkets to keep employees.
4.2. Product-Specific Causes
As fresh FV deteriorate for a number of reasons, it is important to adjust work routines for different products and further develop efficient waste reduction strategies and measures. Previous studies on the causes of food waste at stores have often presented findings on an aggregated level [24,25], that is, not adapted to different departments or products. The results show that previous general descriptions of the causes of retail food waste are not detailed enough for planning reduction measures. This study contributes with detailed descriptions of product-specific causes based on both qualitative and quantitative methods. It is important to be acquainted with the different product-specific causes, as described in Table 3, in order to reduce waste.
The results for products with primary packaging are ambiguous, as shown in Table 2. Different types of packaging have different purposes, and therefore it is precarious to draw any general conclusions. The impact of packaging must be examined on a case-by-case basis. In some cases, packaging protects the products and generates a lower waste quota, for instance as regards tomatoes, sweet peppers and carrots. In some other cases, packaged products have a higher waste quota, for instance as regards pears, oranges, clementine, nectarines and lemons. Nonetheless, this study shows that packaging solutions with the only purpose of convenience for the customers and without protection increase waste. Many organic products, such as apples, tomatoes and oranges, have a higher waste quota compared to conventional products, and this could be explained by a lower turnover, uneven product range, price fluctuations and lack of cooling. However, if both supply and demand of organic products increase, the waste quotas may decrease.
The authors did not find any other studies in literature that have investigated causes of and measures to reduce waste for different FV categories, so in that sense it is difficult to compare our results with other studies. Nonetheless, other studies on in-store waste for FV have reported figures (3–7% in Mena et al., 2011 [15]; 4.3% in Eriksson et al., 2012 [52]; 8–9% in Beretta et al., 2013 [9]) that indicate higher levels of waste compared to the stores included in this study with an average of 1.4%. The general focus on food waste and the development in supermarkets in the past ten years can probably explain part of the lower waste quota in this study. Another possible explanation is the experienced personnel, well-developed store operations, and high turnover in the studied supermarkets.
4.3. An Overview of Causes and Measures: Policy, Practice, People, Product
In order to develop comprehensive strategies for reducing food waste at the retail store level, four different aspects should be included: policy, practice, people, and product. Previous studies have mostly focused the reduction strategies on policies and practices [24]. In this study, the authors have highlighted the fact that while policies and practices are important, the results also show that the role of employees, customers’ behaviour and details about the products must be taken into account to handle the causes and measures. Our results complement and extend the findings from prior literature on food waste causes and waste reduction practices. The authors have not been able to find a hierarchy between the four different aspects, since they interact and influence each other both positively and negatively. Some of the aspects are more important and relevant than others depending on what product is examined, but all aspects are needed to develop a comprehensive strategy to prevent retail food waste. Taking into account all four aspects when planning the work also provides the department with a security system against food waste, meaning that if one part fails, the other parts will mitigate the mistake. For instance, if an order is made that exceeds the need, there are other routines that well-trained employees can apply to prevent waste, such as ensuring correct handling and storage and boosting sales through temporary price adjustments and changes in exposure. Just as the causes are manifold, the solutions to problems which arise are also multifarious. Policy, practice, people and product are crucial parts of the effective implementation of waste-reducing practices.
4.4. The Use of Results and Future Work
The results are relevant for understanding of causes and measures to reduce food waste at the retail store level. From a practical point of view, the description of causes can support the planning and implementation of food waste reduction strategies. The results capture that it is of high importance with experienced and committed employees, so they can handle complex situations with effective practice. This study focused on FV departments; however, some of the conclusions can probably be applied to other store departments with fresh food products and can support their efforts to plan cost-effective strategies and cut waste-related costs. Further development of the findings through supplementary research about the role of employees and behaviour change [57] at the FV department, along with the role of organisation and learning loops [58], is recommended. Additional research about the impact and efficiency of different measures is needed to further develop and implement effective waste prevention strategies.
4.5. Limitations of the Study
Due to the commercially sensitive nature of sharing information about food waste, and to reduce the inconvenience and distance between the interviewer and the interviewee, the interviews and observations were conducted without any audio recordings. To counteract that limitation, interviews and observations with the same employee were performed on several occasions by two researchers, and the findings were compared and discussed after every field visit. Another effort to minimise uncertainties was undertaken through respondent validations where the results were reviewed and verified by the employees at the FV departments. The supermarkets included in this study are part of the same retail chain and belong to the hypermarket segment, and are not representative of all grocery stores. Studies in other retail chains and smaller store formats are likely to have different waste patterns, due to different policies, practices, product range and turnover. Future studies in other retail chains, in smaller store formats and in other countries need to be undertaken to provide a more complete understanding of the grocery retail sector.
5. Conclusions
The grocery retail sector plays an important role in contributing to a sustainable food supply chain due to its central position in the food system. Identifying causes of food waste at the retail level is crucial for the development of effective measures to reduce waste. To generate in-depth insights about causes and reduction measures of fruit and vegetable waste at supermarkets, a mixed-methods approach was adopted, including qualitative data from the employees’ perspective and primary quantitative data on food waste. The employees provided a different point of view and the results reveal some new insights. First, staff members are often portrayed as a root cause of food waste; the main results show the opposite. The employees are key actors as they manage causes and take a variety of precautionary measures to avoid and reduce food waste. The reality at the department is complex, for instance, the employees have up to ten different factors to take into account when making orders. The practices of the employees are closely intertwined with the policies of the management, the time allocation, knowledge and the trust they are given. Second, amount and causes of waste for several fruits and vegetables were studied in detail and there is no one solution that fits all. To develop efficient waste reduction measures at retail store level, detailed knowledge about different products and an understanding of their respective causes are preconditions. The findings reveal that a generic description of causes of food waste is not enough to use as a base when planning reduction measures; practices should be adapted for different products. Other factors affecting the waste are packaging, which in some cases reduces the waste, and in other cases increases it. This indicates that a nuanced approach and careful analysis of the different products and its packaging are required for providing good solutions. Third, to develop comprehensive strategies for reducing food waste, aspects of policy, practice, people and products need to be included and finely tuned.
The role of the employees has been neglected in earlier research and therefore ought to be given much more attention in future research on food waste reduction at the retail level. Employees who have knowledge, experience and mandate contribute actively to the monitoring of food waste and are crucial actors for reducing it, and the recommendation is to support the employees with training and time allocated to execute their tasks. The findings provide better understanding of general and product-specific causes of food waste and can support the planning and implementation of effective reduction strategies.
Author Contributions
Conceptualisation, L.M.; Methodology, L.M.; Formal analysis, L.M. and H.W; Investigation, L.M. and H.W.; Data curation, L.M.; Writing—original draft preparation, L.M.; Writing—review and editing, L.M. and H.W.; Visualisation, L.M. and H.W.; Supervision, H.W.; Funding acquisition, L.M. All authors have read and agreed to the published version of the manuscript.
Funding
This research was partly funded by the Swedish Retail and Wholesale Council.
Informed Consent Statement
Informed consent was obtained from all subjects involved in the study.
Data Availability Statement
Data are not publicly available, though the data may be made available on request from the corresponding author.
Acknowledgments
We acknowledge the owners of the retail stores for granting access to the field, and we give a special thanks to the employees for sharing their experiences and insights.
Conflicts of Interest
The authors declare no conflict of interest. The funder had no role in the design of the study; in the collection, analyses, or interpretation of data; in the writing of the manuscript; or in the decision to publish the results.
References
- IPCC. Climate Change and Land: An IPCC Special Report on Climate Change, Desertification, Land Degradation, Sustainable Land Management, Food Security, and Greenhouse Gas Fluxes in Terrestrial Ecosystems; Shukla, J.S.P.R., Calvo Buendia, E., Masson-Delmotte, V., Pörtner, H.-O., Roberts, D.C., Zhai, P., Slade, R., Connors, S., van Diemen, R., Ferrat, M., et al., Eds.; IPCC: Geneva, Switzerland, 2019. [Google Scholar]
- Papargyropoulou, E.; Lozano, R.; Steinberger, J.K.; Wright, N.; bin Ujang, Z. The food waste hierarchy as a framework for the management of food surplus and food waste. J. Clean. Prod. 2014, 76, 106–115. [Google Scholar] [CrossRef]
- Al-Obadi, M.; Ayad, H.; Pokharel, S.; Ayari, M.A. Perspectives on food waste management: Prevention and social innovations. Sustain. Prod. Consum. 2022, 31, 190–208. [Google Scholar] [CrossRef]
- Jeswani, H.K.; Figueroa-Torres, G.; Azapagic, A. The extent of food waste generation in the UK and its environmental impacts. Sustain. Prod. Consum. 2021, 26, 532–547. [Google Scholar] [CrossRef]
- Aschemann-Witzel, J.; de Hooge, I.; Amani, P.; Bech-Larsen, T.; Oostindjer, M. Consumer-Related Food Waste: Causes and Potential for Action. Sustainability 2015, 7, 6457–6477. [Google Scholar] [CrossRef]
- Kulikovskaja, V.; Aschemann-Witzel, J. Food Waste Avoidance Actions in Food Retailing: The Case of Denmark. J. Int. Food Agribus. Mark. 2017, 29, 328–345. [Google Scholar] [CrossRef]
- FAO. Global Food Losses and Food Waste—Extent, Causes and Prevention; Food and Agriculture Organization of the United Nations (FAO): Rome, Italy, 2011. [Google Scholar]
- Vadakkepatt, G.G.; Winterich, K.P.; Mittal, V.; Zinn, W.; Beitelspacher, L.; Aloysius, J.; Ginger, J.; Reilman, J. Sustainable Retailing. J. Retail. 2021, 97, 62–80. [Google Scholar] [CrossRef]
- Beretta, C.; Stoessel, F.; Baier, U.; Hellweg, S. Quantifying food losses and the potential for reduction in Switzerland. Waste Manag. 2013, 33, 764–773. [Google Scholar] [CrossRef] [PubMed]
- Cicatiello, C.; Franco, S.; Pancino, B.; Blasi, E. The value of food waste: An exploratory study on retailing. J. Retail. Consum. Serv. 2016, 30, 96–104. [Google Scholar] [CrossRef]
- Lebersorger, S.; Schneider, F. Food loss rates at the food retail, influencing factors and reasons as a basis for waste prevention measures. Waste Manag. 2014, 34, 1911–1919. [Google Scholar] [CrossRef]
- Brancoli, P.; Rousta, K.; Bolton, K. Life cycle assessment of supermarket food waste. Resour. Conserv. Recycl. 2017, 118, 39–46. [Google Scholar] [CrossRef]
- Cicatiello, C.; Franco, S.; Pancino, B.; Blasi, E.; Falasconi, L. The dark side of retail food waste: Evidences from in-store data. Resour. Conserv. Recycl. 2017, 125 (Suppl. C), 273–281. [Google Scholar] [CrossRef]
- Goodman-Smith, F.; Mirosa, M.; Skeaff, S. A mixed-methods study of retail food waste in New Zealand. Food Policy 2020, 92, 101845. [Google Scholar] [CrossRef]
- Mena, C.; Adenso-Diaz, B.; Yurt, O. The causes of food waste in the supplier? Retailer interface: Evidences from the UK and Spain. Resour. Conserv. Recycl. 2011, 55, 648–658. [Google Scholar] [CrossRef]
- Scholz, K.; Eriksson, M.; Strid, I. Carbon footprint of supermarket food waste. Resour. Conserv. Recycl. 2015, 94, 56–65. [Google Scholar] [CrossRef]
- Bilska, B.; Piecek, M.; Kołożyn-Krajewska, D. A Multifaceted Evaluation of Food Waste in a Polish Supermarket—Case Study. Sustainability 2018, 10, 3175. [Google Scholar] [CrossRef]
- Bech-Larsen, T.; Esbjerg, L. The Garden of the Self-Service Store. J. Food Prod. Mark. 2006, 12, 87–102. [Google Scholar] [CrossRef]
- Teller, C.; Holweg, C.; Reiner, G.; Kotzab, H. Retail store operations and food waste. J. Clean. Prod. 2018, 185, 981–997. [Google Scholar] [CrossRef]
- Cicatiello, C.; Blasi, E.; Giordano, C.; Martella, A.; Franco, S. “If only I Could Decide”: Opinions of Food Category Managers on in-Store Food Waste. Sustainability 2020, 12, 8592. [Google Scholar] [CrossRef]
- Horoś, I.K.; Ruppenthal, T. Avoidance of Food Waste from a Grocery Retail Store Owner’s Perspective. Sustainability 2021, 13, 550. [Google Scholar] [CrossRef]
- Filimonau, V.; Gherbin, A. An exploratory study of food waste management practices in the UK grocery retail sector. J. Clean. Prod. 2017, 167, 1184–1194. [Google Scholar] [CrossRef]
- Gruber, V.; Holweg, C.; Teller, C. What a Waste! Exploring the Human Reality of Food Waste from the Store Manager’s Perspective. J. Public Policy Mark. 2016, 35, 3–25. [Google Scholar] [CrossRef]
- De Moraes, C.C.; de Oliveira Costa, F.H.; Pereira, C.R.; Da Silva, A.L.; Delai, I. Retail food waste: Mapping causes and reduction practices. J. Clean. Prod. 2020, 256, 120124. [Google Scholar] [CrossRef]
- Chauhan, C.; Dhir, A.; Akram, M.U.; Salo, J. Food loss and waste in food supply chains. A systematic literature review and framework development approach. J. Clean. Prod. 2021, 295, 126438. [Google Scholar] [CrossRef]
- Mattsson, L.; Williams, H.; Berghel, J. Waste of fresh fruit and vegetables at retailers in Sweden—Measuring and calculation of mass, economic cost and climate impact. Resour. Conserv. Recycl. 2018, 130, 118–126. [Google Scholar] [CrossRef]
- Priefer, C.; Jörissen, J.; Bräutigam, K.-R. Food waste prevention in Europe—A cause-driven approach to identify the most relevant leverage points for action. Resour. Conserv. Recycl. 2016, 109, 155–165. [Google Scholar] [CrossRef]
- Hanssen, O.J.; Stenmarck, A.; Werge, M.; Silvennoinen, K.; Katajajuuri, J.-M. Initiatives on Prevention of Food Waste in the Retail and Wholesale Trades; IVL Swedish Environmental Research Institute Ltd.: Stockholm, Sweden, 2011. [Google Scholar]
- Thyberg, K.L.; Tonjes, D.J. Drivers of food waste and their implications for sustainable policy development. Resour. Conserv. Recycl. 2016, 106, 110–123. [Google Scholar] [CrossRef]
- Verghese, K.; Lewis, H.; Lockrey, S.; Williams, H. Packaging’s Role in Minimizing Food Loss and Waste Across the Supply Chain. Packag. Technol. Sci. 2015, 28, 603–620. [Google Scholar] [CrossRef]
- Eriksson, M.; Strid, I.; Hansson, P.-A. Waste of organic and conventional meat and dairy products—A case study from Swedish retail. Resour. Conserv. Recycl. 2014, 83, 44–52. [Google Scholar] [CrossRef]
- Aschemann-Witzel, J.; de Hooge, I.; Normann, A. Consumer-Related Food Waste: Role of Food Marketing and Retailers and Potential for Action. J. Int. Food Agribus. Mark. 2016, 28, 271–285. [Google Scholar] [CrossRef]
- Xue, L.; Liu, G.; Parfitt, J.; Liu, X.; Van Herpen, E.; Stenmarck, Å.; O’Connor, C.; Östergren, K.; Cheng, S. Missing Food, Missing Data? A Critical Review of Global Food Losses and Food Waste Data. Environ. Sci. Technol. 2017, 51, 6618–6633. [Google Scholar] [CrossRef]
- Huang, I.Y.; Manning, L.; James, K.L.; Grigoriadis, V.; Millington, A.; Wood, V.; Ward, S. Food waste management: A review of retailers’ business practices and their implications for sustainable value. J. Clean. Prod. 2021, 285, 125484. [Google Scholar] [CrossRef]
- European Commission. Directive 2008/98/EC of the European Parliament and of the Council of 19 November 2008 on Waste and Repealing Certain Directives. 2008. Available online: https://ec.europa.eu/environment/topics/waste-and-recycling/waste-framework-directive_en (accessed on 4 May 2022).
- United Nations. Resolution Adopted by the General Assembly on 25 September 2015. 2015. Available online: http://www.un.org/ga/search/view_doc.asp?symbol=A/RES/70/1&Lang=E (accessed on 4 May 2022).
- European Commission. A New Circular Economy Action Plan For a Cleaner and More Competitive Europe COM/2020/98 Final. 2020. Available online: https://www.eea.europa.eu/policy-documents/com-2020-98-final-a (accessed on 22 June 2022).
- Ivankova, N.V.; Creswell, J.W.; Stick, S.L. Using Mixed-Methods Sequential Explanatory Design: From Theory to Practice. Field Methods 2006, 18, 3–20. [Google Scholar] [CrossRef]
- Creswell, J.W.; Plano Clark, V.L.; Gutmann, M.L.; Hanson, W.E. An Expanded Typology for Classifying Mixed Methods Research into Designs. In Handbook of Mixed Methods in Social and Behavioral Research; Tashakkori, A., Teddlie, C., Eds.; SAGE Publications, Inc.: Thousand Oaks, CA, USA, 2003. [Google Scholar]
- Kvale, S.; Brinkmann, S. Den Kvalitativa Forskningsintervjun; Studentlitteratur: Lund, Sweden, 2014. [Google Scholar]
- Yin, R.K. Case Study Research: Design and Methods; SAGE: London, UK, 2009. [Google Scholar]
- Denscombe, M. The Good Research Guide: For Small-Scale Research Projects, 5th ed.; McGraw-Hill Education: Maidenhead, UK, 2014. [Google Scholar]
- Guy, C.M. Classifications of retail stores and shopping centres: Some methodological issues. GeoJournal 1998, 45, 255–264. [Google Scholar] [CrossRef]
- ICA. ICA Sweden. 2022. Available online: https://www.icagruppen.se/en/about-ica-gruppen/our-operations/ica-sweden/ (accessed on 5 August 2022).
- Cicatiello, C.; Franco, S. Disclosure and assessment of unrecorded food waste at retail stores. J. Retail. Consum. Serv. 2020, 52, 101932. [Google Scholar] [CrossRef]
- Gioia, D.A.; Corley, K.G.; Hamilton, A.L. Seeking Qualitative Rigor in Inductive Research: Notes on the Gioia Methodology. Organ. Res. Methods 2013, 16, 15–31. [Google Scholar] [CrossRef]
- Schwalbe, M.L.; Wolkomir, M. Interviewing men. In Handbook of Interview Research; Gubrium, J.F., Holstein, J.A., Eds.; SAGE Publications, Inc.: Thousand Oaks, CA, USA, 2001. [Google Scholar]
- Hoffmann, E.A. Open-Ended Interviews, Power, and Emotional Labor. J. Contemp. Ethnogr. 2007, 36, 318–346. [Google Scholar] [CrossRef]
- Glaser, B.G.; Strauss, A.L. The Discovery of Grounded Theory: Strategies for Qualitative Research; Aldine: London, UK, 1967. [Google Scholar]
- Krippendorff, K. Content Analysis: An Introduction to Its Methodology, 3rd ed.; SAGE: Thousand Oaks, CA, USA, 2013. [Google Scholar]
- Saunders, B.; Sim, J.; Kingstone, T.; Baker, S.; Waterfield, J.; Bartlam, B.; Burroughs, H.; Jinks, C. Saturation in qualitative research: Exploring its conceptualization and operationalization. Qual. Quant. 2018, 52, 1893–1907. [Google Scholar] [CrossRef]
- Eriksson, M.; Strid, I.; Hansson, P.-A. Food losses in six Swedish retail stores: Wastage of fruit and vegetables in relation to quantities delivered. Resour. Conserv. Recycl. 2012, 68, 14–20. [Google Scholar] [CrossRef]
- Eriksson, M.; Ghosh, R.; Mattsson, L.; Ismatov, A. Take-back agreements in the perspective of food waste generation at the supplier-retailer interface. Resour. Conserv. Recycl. 2017, 122, 83–93. [Google Scholar] [CrossRef]
- Holweg, C.; Teller, C.; Kotzab, H. Unsaleable grocery products, their residual value and instore logistics. Int. J. Phys. Distrib. Logist. Manag. 2016, 46, 634–658. [Google Scholar] [CrossRef]
- Magalhães, V.S.; Ferreira, L.M.D.; Silva, C. Prioritising food loss and waste mitigation strategies in the fruit and vegetable supply chain: A multi-criteria approach. Sustain. Prod. Consum. 2022, 31, 569–581. [Google Scholar] [CrossRef]
- Whelan, T.; Fink, C. The Comprehensive Business Case for Sustainability. Harv. Bus. Rev. 2016, 2–8. [Google Scholar]
- Michie, S.; Van Stralen, M.M.; West, R. The behaviour change wheel: A new method for characterising and designing behaviour change interventions. Implement. Sci. 2011, 6, 42. [Google Scholar] [CrossRef] [PubMed]
- Argyris, C. On Organizational Learning, 2nd ed.; Blackwell: Hoboken, NJ, USA, 1999. [Google Scholar]
Publisher’s Note: MDPI stays neutral with regard to jurisdictional claims in published maps and institutional affiliations. |
© 2022 by the authors. Licensee MDPI, Basel, Switzerland. This article is an open access article distributed under the terms and conditions of the Creative Commons Attribution (CC BY) license (https://creativecommons.org/licenses/by/4.0/).