Article

Land Use-Based Participatory Assessment of Ecosystem Services for Ecological Restoration in Village Tank Cascade Systems of Sri Lanka

1
Applied Agricultural Remote Sensing Centre, School of Science and Technology, University of New England, Armidale, NSW 2351, Australia
2
Ministry of Environment, Battaramulla 10120, Sri Lanka
3
School of Humanities, Arts, and Social Sciences, University of New England, Armidale, NSW 2351, Australia
4
Faculty of Agriculture, Rajarata University of Sri Lanka, Mihintale 50300, Sri Lanka
5
The Alliance of Bioversity International and the International Center for Tropical Agriculture (CIAT), Via di San Domenico, 1, 00153 Rome, Italy
6
East Coast Geospatial Consultants, Armidale, NSW 2350, Australia
7
Faculty of Agriculture and Plantation Management, Wayamba University of Sri Lanka, Gonawila 60170, Sri Lanka
8
School of Environmental and Rural Science, University of New England, Armidale, NSW 2351, Australia
9
Natural Resources Management Centre, Department of Agriculture, Peradeniya 20400, Sri Lanka
*
Author to whom correspondence should be addressed.
Sustainability 2022, 14(16), 10180; https://doi.org/10.3390/su141610180
Submission received: 10 June 2022 / Revised: 10 August 2022 / Accepted: 11 August 2022 / Published: 16 August 2022

Abstract

:
Village Tank Cascade System (VTCS) landscapes in the dry zone of Sri Lanka provide multiple ecosystem services (ESs) and benefits to local communities, sustaining the productivity of their land use systems (LUSs). However, there is a lack of adequate scientific research on the ESs of LUSs, despite the recent land use changes that have greatly impacted the provisioning of ESs. Collection of baseline ESs data is a pre-requisite for decision making on ESs-based ecological restoration and management of the VTCS. Thus, this study aimed at assessing ESs of the Mahakanumulla VTCS (MVTCS) located in the Anuradhapura district of Sri Lanka by using a participatory approach involving the integration of local knowledge, expert judgements and LUSs attribute data to assess the ESs. The methodology was designed to integrate the biodiversity and land degradation status of LUSs in a way that is directly linked with the supply of ESs. The study identified twenty-four ESs of the MVTCS based on community perceptions. The identified ESs were assessed as a function of LUSs to develop an ecosystem service supply (ESS) and demand (ESD) matrix model. The results reveal that the current overall ESD for regulating and supporting ESs is higher than the ESS capacity of MVTCS. The assessment also revealed that land degradation and biodiversity deterioration reduce the capacity to provide ESs. Downstream LUSs of the meso-catchment were found to be more vulnerable to degradation and insufficient to provide ESs. Further, the study established that ESs in the MVTCS are generated through direct species-based and biophysical-based providers. In addition, it emerged that social and cultural engagements also played an important role in association with both providers to generate certain types of ESs. Therefore, it can be concluded that VTCS ecological restoration depends on the extent to which integrated effort addresses the levels of ecological complexity, as well as the social engagement of communities and stakeholders. The results of this study provide a scientific basis that can inform future land use decision making and practices that are applicable to successful ESs-based ecological restoration and management of the VTCSs in the dry zone of Sri Lanka.

1. Introduction

In Sri Lanka, the Village Tank Cascade Systems (VTCSs) are considered unique social-ecological systems (SESs) that have also been recently recognised as one of the Globally Important Agricultural Heritage Systems (GIAHSs) attributed to complex hydrological and social-ecological relationships at different spatial scales [1]. Land use systems (LUSs) of VTCSs have evolved through unique biophysical-social interactions and are inexorably linked with rich biodiversity and ecosystem services (ESs) for their sustainability and resilience [2,3]. Ecosystem services provide the foundation for food and nutrition security to smallholder farming communities in the VTCSs by maintaining and improving ecosystem health and climate change resilience [4]. Over the last few years, there has been increased attention in the scientific literature to the value of ESs in SESs, leading to a better understanding of their contribution to human well-being and ecosystem health in the face of global environmental changes [5,6,7,8]. Moreover, after the Millennium Ecosystem Assessment (MEA) [8], the ESs concept has been broadened into a framework and increasingly adopted as a decision-making tool for the sustainable management of natural resources [9]. The VTCSs provide a model of a sustainable landscape in which human well-being was maintained in harmony with nature, despite environmental shocks during the past two millennia [10,11]. Thus, studying the ESs of the VTCSs provides insight into how people interact within a unique social-ecological system (SES) to obtain ESs for their survival and well-being, and helps guide efforts to maintain them into an uncertain future [12].
The Village Tank Cascade System (VTCS) comprises a mosaic of small-scale social-ecological LUSs, including smallholder farming systems and ecologically sensitive areas. About 23.3% of the agricultural lands (approximately 228,000 hectares of paddy lands) of the country are located in VTCSs, therefore sustainable maintenance of VTCSs is of great importance in enhancing the agricultural productivity of the country [13]. However, sustainability of the VTCSs will not be achieved if its ecosystem functions and ESs are not properly maintained and protected within the system. Some of the ESs associated with VTCSs have been identified and economically valued. Provisioning ESs are largely recognised at present, while other ESs—regulating, supporting and cultural services of the VTCSs—have not been adequately assessed and are mostly ignored [14,15,16,17,18].
A critical current challenge for maintaining the sustainability of VTCSs is how to increase their agricultural productivity in an environmentally sustainable way [12]. During the past two decades, devastating land use changes have caused biodiversity loss in VTCS landscapes, which have degraded ESs. Some of the land-use changes have resulted in the irreversible collapse of socio-ecological interactions and LUSs–ESs connections. [10,19,20,21]. Different LUSs may have different capacities for generating ESs [22]. Thus, the supply capacity variations of ESs across LUSs should be well understood in order to initiate sustainable strategies for ecosystem services-based ecological restoration and management of VTCSs. Increasing the ecological productivity of a VTCS through improving ESs could be one of the sustainable solutions for enhancing agricultural productivity [13,23]. In this context, a clear understanding of ESs and their associations with the land use system (LUS) attributes is important. However, research on VTCS ecology, its functions at different levels and the capacity of different ecological components to generate ESs is inadequate. For example, a review of published literature shows only two studies where the biodiversity of the VTCSs has been systematically quantified [24,25].
Ecosystem services assessment and mapping approaches have gained increasing attention, especially since 2000, in the global literature [26]. The essence of the ESs concept is described as the contribution of nature to human well-being [27,28]. Recent studies that have adopted participatory approaches to estimate and map ecosystem service supply and demand include those by Burkhard, Müller [29]; Burkhard, Kroll [30]; Casado-Arzuaga, Madariaga [31]; Burkhard, Kroll [32]; Jacobs, Wolfstein [33]; Burkhard, Kandziora [34]; Reyers, Biggs [35]; Paudyal, Baral [36]; Palomo, Felipe-Lucia [37]; Baral, Keenan [38]; Orsi, Ciolli [39]. Among others, Brück, Abson [9] noted that the majority of ESs assessments have focused on the overall value of ESs for society, rather than the intersection of ecosystem service (ES) values across space, time and user groups. Though there is an increasing trend of ESs assessment studies in Sri Lanka since 2000, research that quantifies the value of ESs through community engagements remains scant in the country [40]. Most ES bundles are generated in social-ecological systems as a result of the integrated outcomes of interacting social, ecological and cultural elements of the system [23,35,37,41,42,43,44]. Fisher, Turner [7] emphasised that people are the most important users and beneficiaries of ESs. Thus, participatory approaches that utilise peoples’ perceptions could be more appropriate because the value of ESs is determined by the beneficiaries of the LUSs. On the other hand, most existing ES studies have focused on biophysical assessment and quantification of ecological and economic impacts due to land use changes in large-scale landscapes through advanced GIS and remote-sensing techniques [45,46]. Limited studies have taken into consideration the quantitative measurement of social perceptions that reflect the real beneficiary value of ESs [26,47] and other important ES components, such as biodiversity [26,45,48] and land health [49,50,51]. Therefore, a mixed approach, with the integration of social factors and local knowledge, is more effective for the assessment and mapping of ESs in a complex small-scale social-ecological system [52,53,54].
The present paper analyses the ESs of different LUSs of Mahakanumulla VTCS in Sri Lanka through community perceptions, expert estimations and biophysical indicators—species diversity and land degradation of LUSs. The specific objectives were to (i) identify and prioritise ESs; (ii) determine ES supply (ESS) and ES demand (ESD) varying across the LUSs; and (iii) map hotspots and bright spots of biodiversity, land degradation and ESS across the LUSs. The findings of this study will provide valuable and much-needed scientific information that could be applied to future land use decision making and practices in regard to ESs-based ecological restoration and management of the VTCSs in Sri Lanka.

2. Materials and Methods
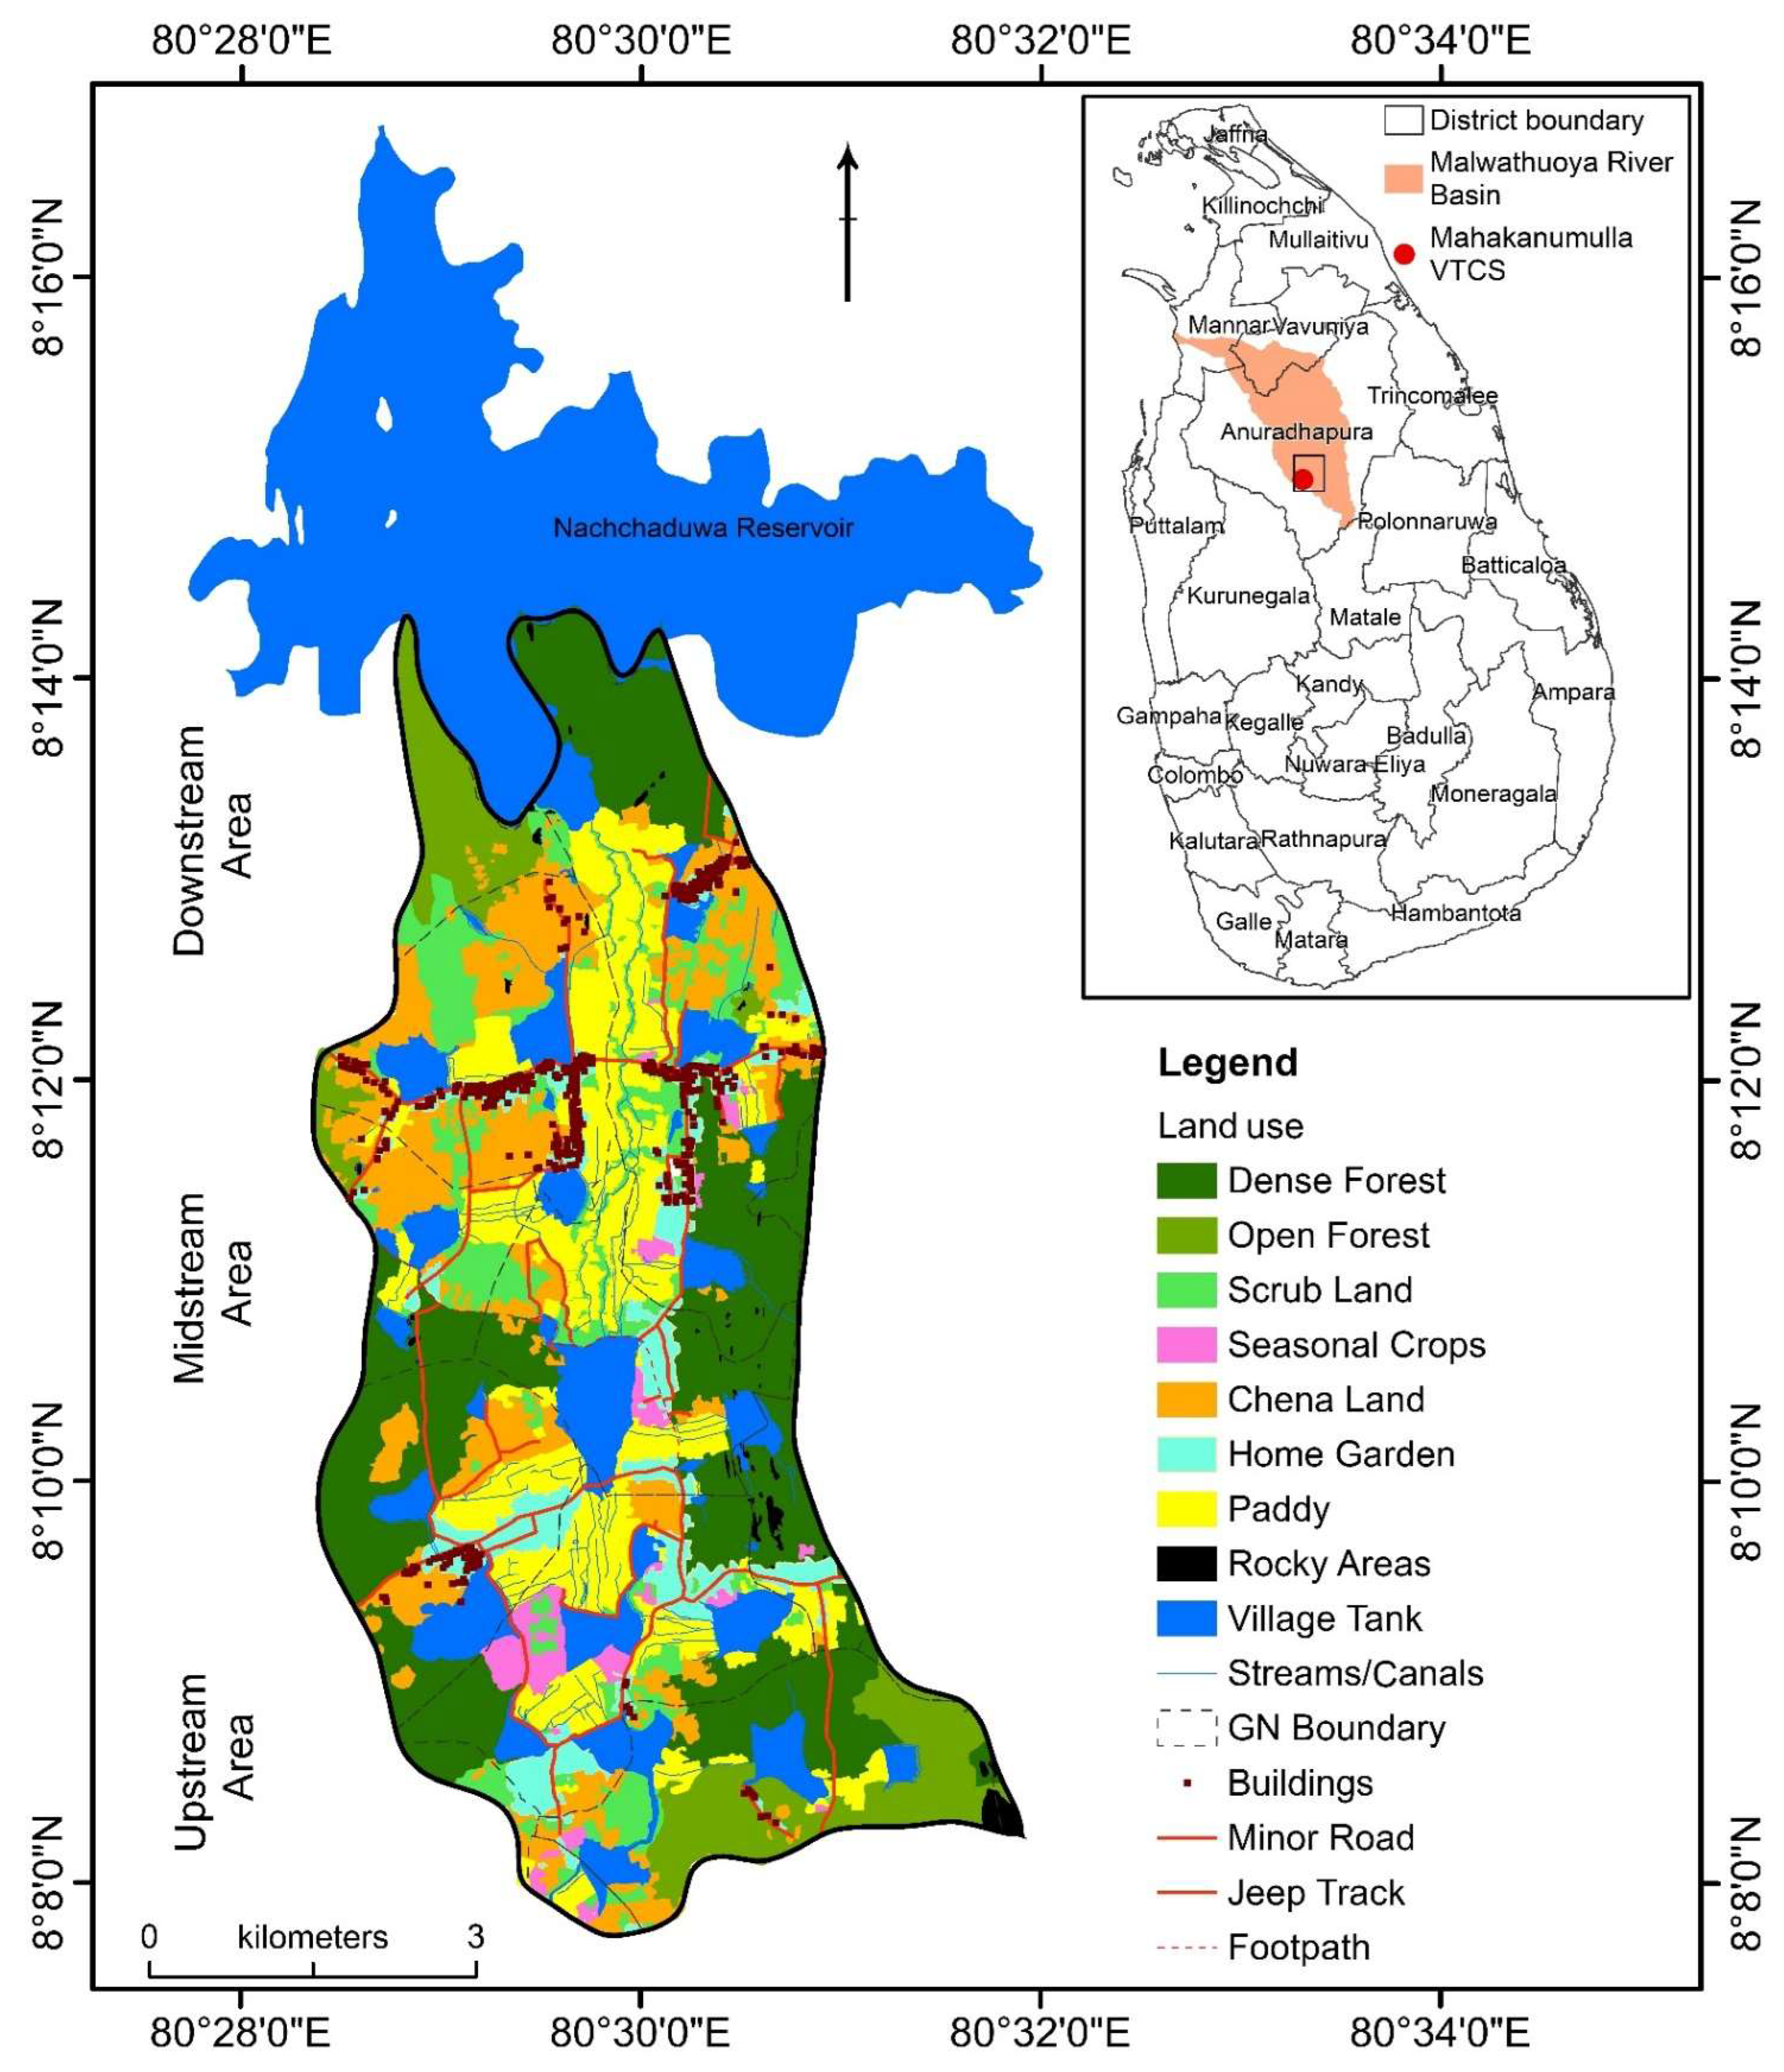
2.1. Study Area

The Mahakanumulla Village Tank Cascade System (MVTCS) is located in the Anuradhapura district within the Malwathuoya River Basin of the north-central province of Sri Lanka (8°5′–8°15′ N and 80°20′–80°35′ E). There are 12 villages and 28 village tanks within the MVTCS, which covers a cascade area of about 4450 ha, with a water surface area of about 557 ha and an irrigation command area of about 758 ha. The population of the area is 3432 (47.8% male and 52.2% female) and 1193 households. There are ten farmer organisations within the MVTCS. The MVTCS landscape is characterised by a tropical monsoonal climate with a well-defined bi-modal rainfall pattern. The annual average rainfall of the area is 1445 mm and the average daily ambient temperature is 27 °C. The terrain of the MVTCS landscape is undulating and is characterised by slopes and valleys which determine the water movement. Three major soil groups (Reddish Brown Earths—Rhodustalfs (60%), Low Humic Gley—Tropaqualfs (30%) and Alluvials (10%)) are found in the area, which create different drainage conditions that provide favourable conditions for farmers to adopt three-fold traditional farming systems (lowland paddy, rain-fed upland and homestead gardens) in the MVTCS. The farming systems of the MVTCS are heavily fragmented and the majority of farm plots are less than two hectares. Intra-annual variation in rainfall (875 to 1875 mm) enables farmers to adapt two major cultivation seasons consisting of combinations of monsoonal and inter-monsoonal climatic seasons. These farming practices have symbiotic relationships with a rich array of biodiversity associated with traditional knowledge and the cultural practices of the area. The above social-ecological, hydrological and geomorphological features of the MVTCS contribute immensely to reducing climate stresses and maintaining sustainable food production. However, long-term land use changes and frequent intra-annual climate variations have impacted significantly the supply of ESs in the study area [12,13]. Altogether, five LUSs and ten major land use types (LUTs) could be identified from a 1:10,000 digital land use map of the study area obtained from the Land Use Policy Planning Department (LUPPD) of Sri Lanka (Table 1 and Figure 1).

2.2. Approach and Data Collection

The study utilised both qualitative and quantitative data collection methodologies. Participatory Rapid Appraisal (PRA) techniques were used to determine community perception of values they consider, while prioritising ESs and assessing the supply and demand of ESs provided by the LUSs of the MVTCS. An on-site field survey was carried out to assess the impact of land degradation on ESS of different LUTs. Biodiversity data were obtained from the biodiversity baseline survey of the MVTCS [55]. Land degradation and biodiversity data were integrated to map the ESS capacities of the MVTCS. Data were analysed using graphical and numerical summary measures and exploratory data analysis methods. On-site field survey data collection and participatory assessments were carried out with the support of the Natural Resources Management Centre (NRMC) of the Department of Agriculture and Wayamba University of Sri Lanka in December 2021 and May 2022, respectively.

2.3. Preparation of LUS Units Field Basemap

The LUSs digital map (1:10,000) layer (shapefile) of the study area was overlaid on the basemap of Google Earth imagery and the study area was selected as a Keyhole Markup Language (KML) file. On-screen digitising was undertaken by employing ArcMap (version 10.8.1) software from the Environmental Systems Research Institute, Redlands, California, USA, to demarcate fine-scale LUS units of the study area using the Google Earth image (KML file) accessed on 20 June 2021. In the basemap, each LUS unit was assigned a unique ID. The completed LUSs units field basemap was (i) uploaded as a KML file into Google Earth to use for navigation purposes through a smartphone to find the location of LUSs units and (ii) used as a reference basemap during on-site field assessment of ESs [56]. The methodological approach used in this study is elaborated in Figure 2.

2.4. Inventorying and Prioritisation of ESs

A review of the literature was first undertaken to screen and list out potential ESs associated with VTCS landscapes. In addition, participatory ESs screening was performed in the community to refine the initial list and prioritise ESs in the MVTCS. The prioritised ESs were organised under four main ESs categories: (i) Provisioning (P); (ii) Regulating (R); (iii) Cultural (C) services; and (iv) Supporting functions (S), based on the Common International Classification of Ecosystem Services (CICES—V5.1) [8,57].
The prioritisation of ESs was carried out through the adoption of a rapid participatory listing and ranking approach through PRA techniques [58,59]. The PRA was conducted by selecting community members of upstream, midstream and downstream areas of the MVTCS meso-catchment. An initial explanation of the ESs and their benefits to society was given by the facilitators. Community members were organised into groups and convened to identify ES indicators linked to different LUSs types; they were asked to score each ecosystem service based on its importance in providing benefits to society and to give reasons for the scores. Validated and analysed perception data were visualised using the ‘ggplot2′ package in R statistical software version 4.1.2 [60].
Often, the community members were uncertain how to convert their perception into a numerical score value, and therefore facilitators had to note down and convert their opinion on a scale of zero to five, where the higher the value, the higher the importance. The results were further validated through key informant interviews (KII), including government authorities and senior community members of the area. The first expert judgement workshop (EJW-i) was conducted to assign weights (%) for each ES based on their knowledge and experience. On-site biodiversity field survey data were analysed to verify the species-based ESs providers. Finally, on-site field verification exercises were conducted parallel to field data collection with the PRA members and experts to further verify the results.

2.5. Assessment of ESs’ Supply and Demand

This study refers to the ESs’ supply (ESS) capacity as the current potential of individual LUS units to provide different ESs bundles to the local beneficiaries. Ecosystem services’ demand (ESD) refers to the amount of all ESs currently consumed or used in both the local area where they are generated or in areas outside local areas over a given period of time [30,53,61]. The study assessed 430 LUS units in the MVTCS which belonged to various macro and micro LUTs (Table 1). Ecosystem services’ supply and demand values for particular LUS units were derived from on-site PRA exercises with key informants. The derived values (scores) were transferred to a pre-defined scale from zero to five—where the higher the value (score), the higher the demand or supply for the quantification of ESD and ESS for a particular LUS unit. All values were arranged in a matrix model to link ESs (y-axis) and the LUTs (x-axis). To reduce the uncertainties and improve the confidence level of perceived values by the community, a second expert judgement workshop (EJW-ii) was conducted to validate the ESS and ESD scores by integrating: (i) on-site observations to ensure real evidence and (ii) expert verification to reach a high level of scientific agreement on the final scores of the matrix model [62], thus increasing the scientific quality of the matrix model outcomes [63]. Validated and analysed perception data were visualised using the ‘ggplot2′ and ‘fmsb’ packages in R statistical software version 4.1.2 [60,64].

2.6. Mapping of ESS Capacity

Ecosystem service supply scores of the matrix were linked with the attributes of LUSs units’ polygons using the ‘unique code field’ of the LUSs units as a common identifier field for the map production process. The mapping of ESs was carried out based on the values of the ESS matrix scores, Biodiversity Value Index (BVI) and Land Degradation Impact Score (LDIS) of each LUSs unit in the ArcMap version 10.8.1 GIS platform. The study used on-site biodiversity field survey data to derive the BVI by calculating the Simpson Diversity Index for shrubs, small plants, trees, crop plants, medicinal plants and aquatic flora and fauna for the LUTs level [65]. Land Degradation Impact Scores for each LUS unit were calculated based on land degradation field assessment survey data. The land degradation assessment adopted LUS-based LADA–WOCAT–QM (Land Degradation Assessment in Drylands–World Overview of Conservation Approaches and Technologies–Questionnaire for Mapping) approach for on-site assessment of the land degradation indicators in the MVTCS [50,66,67]. The study developed the LUTs and ESs matrix for a grid (100 m × 100 m)-based calculation of ESS capacity values. All ESS, BVI and LDIS values were normalised (rescaled) to be between 0 and 1 to develop raster maps of ESS capacity, biodiversity and land degradation hotspot and bright spot areas in the MVTCS landscape (Figure 3).

3. Results

3.1. Informants of the PRA

Community assessments through PRA and KII involved 60 people (68% male and 32% female) who had different interactions with MVTCS, including the village community and local government officers. Expert judgement workshops involved 13 experts from NRMC, LUPPD, academia and research institutions. Among the community members who participated in the assessment, 88% were members and/or office bearers of the farmer organisations established in the MVTCS that were directly involved in the local governance of village tanks and associated livelihood activities in harmony with local government organisations. The age distribution of the informants ranged from 30 to 85 years. Most informants were seniors and had been living in the area for more than two generations, which indicates that they had firsthand information—key informants on the ecosystem benefits being received from the LUSs of the MVTCS. All informants were engaged in paddy cultivation in the MVTCS, while about 74% of them were found to be practicing upland farming, including shifting cultivation and home garden horticulture. The age distribution and the number of generations that the community members had been living in this area are shown in Figure 4.

3.2. Establishment of ESs Priorities

This study revealed that the MVTCS landscape has provided a wide range of ES benefits to the local communities. Participatory listing of ESs by local community members identified twenty-four ESs—nine provisioning services, nine regulating services, four cultural services and two supporting functions. The findings also revealed that the community could identify key providers of ESs and had a strong relationship with biodiversity and biophysical elements of LUSs of the MVTCS. During the EJW-i, experts identified potential indicators to quantify the ESs identified in the participatory listing. The list of ESs perceived by local communities of the MVTCS is given in Table 2. The ranking of the ESs based on the community’s perceived scores and experts’ weighting values are provided in Figure 5.
It was observed that the majority of food provisioning and regulating ESs identified are associated with direct species-based ESs providers (Table 2). Thus, further analysis of the biodiversity baseline survey data revealed that 276 plant species belonging to shrubs, small plants and trees, and 191 faunal species belonging to mammals, reptiles, birds, amphibians, land snails, butterflies and dragonflies, are found in various LUSs of the MVTCS. Many species are found to be common in several LUSs, while some species are multifunctional and multipurpose. Home garden LUSs record the highest number of plant species, while natural forest and downstream reservation areas accommodate many ecologically sensitive plant species important for providing regulating and supporting ESs. The baseline survey data also revealed that MVTCS is rich in agrobiodiversity, including 150 actively managed crop plant species bearing edible components of fruits, seeds, leaf, yam and bark. Most of these species are grown in home gardens and shifting cultivation (Chena) LUSs. Much of the diversity of crop species consists of crop landraces (110 landraces) maintained by the community. The distribution of plants, animals and crop species among different LUTs in MVTCS is visualised in Figure 6.

3.3. Ecosystem Services’ Supply and Demand

The current capacity to supply provisioning ESs ranges from zero to four. Home gardens, paddy fields and tanks are prominent in providing provisioning ESs. As far as the tanks are concerned, they still have some capacity to supply water for agriculture. The supply of ESs by shifting cultivation lands recorded low values. During on-site field verification, it was noticed that farmers practised agro-wells-assisted irrigation for their shifting cultivation for commercial purposes. To the extent that regulating ESs are valued, upstream tree belt (UTB), upstream soil ridge (USR), tanks and catchment forests were identified as ecologically important LUTs. The ESS matrix showed that most of the LUTs in the MVTCS have at least some capacity to maintain supporting ES functions. The tanks, paddy fields and home gardens are reported as the LUTs with the highest capacity to supply cultural ESs (Figure 7a). Demand for provisioning ESs ranged from zero to four. ESD matrix values indicated high demand for irrigation water from tanks to paddy fields. Compared to the demand for provisioning ESs, a fairly high demand for regulating ESs from all LUTs was recorded. There is a high demand from upstream soil ridge (USR) for regulating ESs. It was observed that the fairly high ESD values for regulating ESs were associated with food production LUTs. There were high ESD values that were observed to maintain biodiversity in the LUSs. Out of the four cultural ESs assessed, the most valued cultural ESs were the aesthetic and recreational services arising from particular LUTs (Figure 7b).
The analysis of ESS and ESD trade-offs showed that the ESs’ demand exceeds the supply capacity of the majority of the LUTs in the MVTCS (Figure 8). Negative values indicate occasions where demand exceeds supply (undersupply) and positive values indicate situations where supply exceeds demand (oversupply) (Figure 8c and Figure 9a). Provisioning of all regulating ESs across all LUTs was recorded as undersupply (Figure 8c). There was a comparatively high undersupply of groundwater recharge and soil nutrient regulation ESs in the LUTs recorded (Figure 9b). In addition, the matrix analysis showed a decrease in pollinator services across most of the LUTs (Figure 9a). More importantly, LUTs that are central for generating supporting ES functions in the MVTCS recorded negative trade-off values (Figure 8c). It was observed that the natural forest LUS of the MVTCS has some supply capacity to provide all four ESs categories (Figure 8a). Further, ESD analysis revealed that the demand for tank-associated micro-land uses of upstream water holes (UWH), upstream soil ridges (USR) and downstream reservations (DR) was very high (Figure 8b). The field investigation revealed that the majority of micro-land uses were degraded.

3.4. Spatial Variation in ESS

This study produced ESS capacity maps in different LUTs in MVTCS to understand the spatial variation in current ESS capacities (Figure 10). The spatial pattern in ESS capacities across the MVTCS meso-catchment showed degradation of regulating and supporting ESs towards the downstream and valley bottom areas (Figure 10b,c). Overall, it emerged that the downstream and valley bottom LUSs of the meso-catchment have more capacity to provide provisioning ESs (Figure 10a), while midstream LUSs are important for providing cultural ESs linked with the rich biodiversity of these areas (Figure 10d). Based on the estimation of BVI and LDIS values, the study developed hotspot and bright spot maps of the spatial distribution of BVI and LDIS to understand the impact of biodiversity and land degradation on the ESS capacity of the MVTCS landscape (Figure 11). More hotspot areas impacted by land degradation on ESs were found in downstream and valley bottom areas of the meso-catchment (Figure 11b) and high-value biodiversity areas—bright spots were concentrated in the midstream areas (Figure 11a). Generally, ESS-rich, bright spot areas were found in the midstream areas, while more vulnerable areas of ESs degradation, hotspots, were found towards the downstream areas of the meso-catchment (Figure 11c).

4. Discussion

This study estimated the capacities of twenty-four ESs for the fourteen macro and micro-land use types identified in the MVTCS. The results show that the species-based ESs providers play an important role in generating ESs associated with biophysical elements of the land uses of the MVTCS. The majority of food provisioning ESs were established to be crop-based generated by interaction with biophysical elements of the LUSs in association with social engagements. The community prioritised food and water-related ESs as the straightforward ESS from the LUSs. Further, all regulating ESs identified had a substantial relationship with food and water provisioning in the MVTCS. This could be the reason the community placed considerable weight on most of the regulating services provided by the LUSs [13,68]. It indicated that the community perceptions appeared to favour their land use management practices and related ES benefits from the LUSs [31]. However, they ranked the role of ESs in pests and diseases control and global climate regulation at a lower level. This could be the reason the majority of community members failed to recognise the effectiveness of regulating ESs of the VTCS in terms of global climate change mitigation and biological control of pests and diseases.
Biodiversity and landscape diversity were identified as the key supporting ES functions from the MVTCS during the participatory listing. The study also found that all cultural ESs are generated as an integrated outcome of the biodiversity and social engagements of the VTCS. Further, it was observed that about 50% of the regulating ESs identified are associated with direct species-based ESs providers. This confirms the findings of [69,70,71] who established that, biodiversity and the species composition of LUSs is vital for maintaining the ecological balance of the VTCSs. Regaining the lost biodiversity in the VTCSs could be one of the most important steps in the ecological restoration of ESs that supports sustainable agricultural productivity. The significance of ESs restoration in global LUSs has been recognised by the United Nations (UN), declaring 2021–2030 as the Decade on Ecosystem Restoration [72,73]. Reassembling or re-creation of the original ecological components that once occupied VTCS–LUSs in the past is fundamental to ESs-based ecological restoration and management of VTCSs. This could involve assisting the recovery of degraded or fragmented ecological components of the VTCS land uses with a strong ecosystem structure to generate a variety of ecosystem functions and services [23,72,74,75,76]. However, it could be argued that the restoration of the ecological components/ESs to their past status is unattainable, given social-economic, political, institutional, technological and environmental changes in VTCSs, which in itself is a useful future research question.
Mapping of spatial variation of ESS across the MVTCS–LUSs showed a spatial distribution of areas of high ecological value and social-ecologically important land uses of the MVTCS, which is important in determining future land use and ESs trade-off decisions. Hotspot and bright spot maps of the study area demonstrate that overall ESs’ generation capacity is influenced by biodiversity and the land degradation impacts of the land use. Further, it was observed that the degradation of ESs is high in the downstream and valley bottom areas of the meso-catchment. The high impact of land degradation and high social demand for provisioning ESs in the downstream LUSs could be one of the reasons affecting the downstream ESs. Impacts of land use change on biodiversity often lead to declines in ESs [77,78]. Thus, ESs supply-based land health indicators are important for the assessment of ESS capacity at the landscape level in the context of global change scenarios, such as climate, land use and socio-economic changes [79,80,81,82,83]. Therefore, this research provides an integrative, participatory bottom-up ESs assessment framework to apply in highly fragmented, diverse, small-scale SESs, based on their multifunctional LUSs. The resultant assessments can then inform future ecological restoration decision making and practices in the VTCSs. In contrast to conventional participatory ESs assessments, this study accounted for key ecological and land health indicators of the LUSs that directly link with the supply capacity of ESs.
Pre-testing of the participatory ESs screening questionnaire used in the study showed that prioritisation of ESs varied according to the community knowledge and the awareness of the ESs’ use by the local communities. Participatory appraisal methods, although having both advantages and disadvantages, have been widely adopted in social-ecological research carried out in rural communities over the last two decades [84]. On the contrary, ESs demand–supply matrices have some limitations associated with the need for more quantitative methods to estimate perception scores [62,85]. In addition, although on-site field assessment of ESs is straightforward and maybe more accurate, it takes more resources and time [36]. Therefore, to minimise such biases, initial awareness workshops for informants were conducted and the perception scores cross-validated through on-site field verifications and expert consultations. The diversity, complexity and fragmented nature of the arrangements of MVTCS–LUSs could create challenges to the production of quantitative species-based ESs data in a systematic manner.
Process-based biophysical models and toolkits, such as InVest—Integrated Valuation of Ecosystem Services and Tradeoffs, ARIES—ARtificial Intelligence for Ecosystem Services, MIMES—Multi-scale Integrated Models of Ecosystem Services, SolVES—Social Values for Ecosystem Services and MESH—Mapping Ecosystem Services to Human Well-Being, are popular for systematic modelling of ESs in data-rich, large-scale landscapes [53,78,86,87,88,89,90]. However, limitations were found in using such models for the assessment of ESs in small-scale SESs, such as VTCSs, due to the lack of baseline spatial data on biodiversity and land use systems. Thus, a complete survey of biodiversity associated with all LUSs, especially micro-land uses and aquatic environs, is required for a complete understanding of the vital relationships between land use and species interactions.

5. Conclusions

Ecosystem services are central to the existence and optimal multi-functioning of the LUSs of VTCSs. Thus, a comprehensive understanding of ESs is required to achieve optimum productivity of the VTCSs. This study demonstrated the use of the mixed-methods approach to assess, model and map ESs by integrating local knowledge and scientific estimations of land degradation and biodiversity indicators of LUSs of the VTCSs. The study introduced the process of combining biophysical data (biodiversity and land degradation) with social perception data into the ESs mapping process. Although the ESs mapping exercise is challenging due to some limitations, the study managed to map the spatial variation of ESs in the MVTCS using a bottom-up participatory data collection approach. Spatial variation of ESs’ supply across LUSs revealed that the demand for all ESs was higher than the ESs’ supply capacity of the MVTCS landscape. There was a fairly high demand for regulating and supporting ESs from all LUSs of the MVTCS. The study found that biodiversity plays an important role in generating ESs associated with LUSs. ESs maps revealed that loss of biodiversity and land degradation in the LUSs was directly linked to the overall ESS capacity. The success of the ecological restoration of VTCSs depends on the extent to which strategies address the diverse levels of cascade ecological complexity, as well as the social engagement of local communities. The study approach could be improved by integrating more biophysical and socio-economic data of the VTCSs that provide support to the successful ESs-based ecological restoration and management. Future research should focus not only on ESs assessments, but also consider their applicability to integrate potential ES indicators into ongoing ecological restoration planning processes in the VTCSs in Sri Lanka.

Author Contributions

Conceptualization, S.S.R.; Methodology, S.S.R.; Software, S.S.R. and H.K.K.; Data validation, S.S.R., P.B.D., K.H. and H.K.K.; Analysis, S.S.R., H.K.K. and K.H.; Visualization, S.S.R. and H.K.K.; Investigation, S.S.R.; Data curation, S.S.R., K.H. and H.K.K.; Writing—original draft preparation, S.S.R.; Writing—review and editing, S.S.R., A.K., M.R., P.B.D., D.H., L.K., B.K., C.S.K., K.H. and T.D.; Supervision, A.K., M.R., L.K., P.B.D., D.H. and T.D.; All authors have read and agreed to the published version of the manuscript.

Funding

This research was funded by an Australian Government Research Training Program (RTP) and Destination Australia Program (DAP) Scholarships through the University of New England (UNE), Australia, to the first author.

Institutional Review Board Statement

The participatory assessment undertaken in this study was conducted in accordance with the guidelines approval provided by the Human Research Ethics Committee of the University of New England, Australia (approval no: HE22-030, dated 3 May 2022).

Informed Consent Statement

Not applicable.

Data Availability Statement

Not applicable.

Acknowledgments

The first author thankfully acknowledges the Alliance of Bioversity International and the International Center for Tropical Agriculture (CIAT), Italy, for providing support for publishing this article. In addition, special thank goes to the Natural Resources Management Centre of the Department of Agriculture, Sri Lanka and Wayamba University of Sri Lanka for facilitating of the field data collection.

Conflicts of Interest

The authors declare no conflict of interest.

References

  1. FAO. “Globally Important Agricultural Heritage Systems” (GIAHS). Available online: http://www.fao.org/giahs/en/ (accessed on 26 June 2021).
  2. Jiao, Y.; Liang, L.; Okuro, T.; Takeuchi, K. Ecosystem services and biodiversity of traditional agricultural landscapes: A case study of the hani terraces in Southwest China. In Biocultural Landscapes; Hong, S.K., Bogaert, J., Min, Q., Eds.; Springer: Dordrecht, Germany, 2014; pp. 81–88. [Google Scholar]
  3. Gu, H.; Sbramanian, S. Socio-Ecological Production Landscapes: Relevance to the Green Economy Agenda; United Nations University Institute of Advanced Studies (UNU-IAS): Yokohama, Japan, 2012; p. 66. [Google Scholar]
  4. Wu, L.; Avishek, A. Restoring the Ecological Foundation for Food Security: A Soil Organic Matter Perspective; UNEP Policy Brief-12; Liu, J., Khan, A., Gommes, R.A., Oduor, A.M.O., Munang, R., Eds.; United Nations Environemnt Programme (UNEP): Nairobi, Kenya, 2013; p. 16. [Google Scholar]
  5. Koohafkan, P.; Altieri, M.A. Globally Important Agricultural Heritage Systems: A Legacy for the Future; FAO—Food and Agriculture Organization of the United Nations: Rome, Italy, 2011; p. 41. [Google Scholar]
  6. Lu, N.; Wang, M.; Ning, B.; Yu, D.; Fu, B. Research advances in ecosystem services in drylands under global environmental changes. Curr. Opin. Environ. Sustain. 2018, 33, 92–98. [Google Scholar] [CrossRef]
  7. Fisher, B.; Turner, R.K.; Morling, P. Defining and classifying ecosystem services for decision making. Ecol. Econ. 2009, 68, 643–653. [Google Scholar] [CrossRef]
  8. Reid, W.V.; Mooney, H.A.; Cropper, A.; Capistrano, D.; Carpenter, S.R.; Chopra, K.; Dasgupta, P.; Dietz, T.; Duraiappah, A.K.; Hassan, R.; et al. Ecosystems and Human Well-Being-SYNTHESIS: A Report of the Millennium Ecosystem Assessment (MEA); Island Press: Washington, DC, USA, 2005; p. 137. [Google Scholar]
  9. Brück, M.; Abson, D.J.; Fischer, J.; Schultner, J. Broadening the scope of ecosystem services research: Disaggregation as a powerful concept for sustainable natural resource management. Ecosyst. Serv. 2022, 53, 101399. [Google Scholar] [CrossRef]
  10. Abeywardana, N.; Schütt, B.; Wagalawatta, T.; Bebermeier, W. Indigenous agricultural systems in the dry zone of Sri Lanka: Management transformation assessment and sustainability. Sustainability 2019, 11, 910. [Google Scholar] [CrossRef]
  11. Chandrasekara, S.S.K.; Chandrasekara, S.K.; Gamini, P.H.S.; Obeysekera, J.; Manthrithilake, H.; Kwon, H.; Vithanage, M. A review on water governance in Sri Lanka: The lessons learnt for future water policy formulation. Water Policy 2021, 23, 255–273. [Google Scholar] [CrossRef]
  12. Dharmasena, P.B. Cascaded Tank-Village System: Present status and prospects. In Agricultural Research for Sustainable Food Systems in Sri Lanka; Marambe, B., Weerahewa, J., Dandeniya, W.S., Eds.; Springer: Singapore, 2020; pp. 63–75. [Google Scholar]
  13. Ratnayake, S.S.; Kumar, L.; Dharmasena, P.B.; Kadupitiya, H.K.; Kariyawasam, C.S.; Hunter, D. Sustainability of Village Tank Cascade Systems of Sri Lanka: Exploring cascade anatomy and socio-ecological nexus for ecological restoration planning. Challenges 2021, 12, 24. [Google Scholar] [CrossRef]
  14. Vidanage, S.P.; Kotagama, H.B.; Dunusinghe, P.M. Sri Lanka’s small tank cascade systems: Building agricultural resilience in the dry zone. In Climate Change and Community Resilience; Haque, A.K.K., Mukhopadhyay, P., Nepal, M., Shammin Md, R., Eds.; Springer: Singapore, 2022; pp. 225–235. [Google Scholar]
  15. Vidanage, S.P. Economic Value of an Ancient Small Tank Cascade System in Sri Lanka. Ph.D. Thesis, University of Colombo, Colombo, Sri Lamka, 2020. [Google Scholar]
  16. Vidanage, S.; Perera, S.; Kallesoe, M. The Value of Traditional Water Schemes: Small Tanks in the Kala Oya Basin, Sri Lanka; IUCN Water, Nature and Economics Technical Paper No. 6; IUCN—The International Union for Conservation of Nature: Colombo, Sri Lanka, 2005; pp. 1–76. [Google Scholar]
  17. Dilhari, W.A.D.S.; Weerahewa, J. Valuing ecosystem services provided by Minor Village Tanks in the Dry Zone of Sri Lanka. In Proceedings of the Cascade Ecology and Management, University of Peradeniya, Faculty of Agriculture, Peradeniya, Sri Lanka, 17–18 September 2021. [Google Scholar]
  18. Zubair, L. Modernisation of Sri Lanka’s traditional irrigation systems and sustainability. Sci. Technol. Soc. 2005, 10, 161–195. [Google Scholar] [CrossRef]
  19. Bhatta, L.D.; Chaudhary, S.; Pandit, A.; Baral, H.; Das, P.J.; Stork, N.E. Ecosystem service changes and livelihood impacts in the Maguri-Motapung wetlands of Assam, India. Land 2016, 5, 15. [Google Scholar] [CrossRef]
  20. Anuradha, J.M.P.N.; Fujimura, M.; Inaoka, T.; Sakai, N. The role of agricultural land use pattern dynamics on elephant habitat depletion and human-elephant conflict in Sri Lanka. Sustainability 2019, 11, 2818. [Google Scholar] [CrossRef]
  21. Ranagalage, M.; Gunarathna, M.H.J.P.; Surasinghe, T.D.; Dissanayake, D.; Simwanda, M.; Murayama, Y.; Morimoto, T.; Phiri, D.; Nyirenda, V.R.; Premakantha, K.T.; et al. Multi-decadal forest-cover dynamics in the tropical realm: Past trends and policy insights for forest conservation in dry zone of Sri Lanka. Forests 2020, 11, 836. [Google Scholar] [CrossRef]
  22. Bhandari, P.; Mohan, K.C.; Shrestha, S.; Aryal, A.; Shrestha, B.U. Assessments of ecosystem service indicators and stakeholder’s willingness to pay for selected ecosystem services in the Chure region of Nepal. Appl. Geogr. 2016, 69, 25–34. [Google Scholar] [CrossRef]
  23. Timberlake, T.P.; Cirtwill, A.R.; Baral, S.C.; Bhusal, D.R.; Devkota, K.; Harris-Fry, H.A.; Kortsch, S.; Myers, S.S.; Roslin, T.; Saville, N.M. A network approach for managing ecosystem services and improving food and nutrition security on smallholder farms. People Nat. 2022, 4, 563–575. [Google Scholar] [CrossRef]
  24. Marambe, B.; Pushpakumara, G.; Silva, P. Biodiversity and agrobiodiversity in Sri Lanka: Village Tank Systems. In The Biodiversity Observation Network in the Asia-Pacific Region; Nakano, S., Yahara, T., Nakashizuka, T., Eds.; Ecological Research Monographs, Springer: Tokyo, Japan, 2012; pp. 403–430. [Google Scholar]
  25. Goonatilake, S.d.A.; Ekanayake, S.P.; Perera, N.; Wijenayake, T.; Wadugodapitiya, A. Biodiversity and Ethnobiology of the Kapiriggama Small Tank Cascade System in Sri Lanka; IUCN Programme on Restoring Traditional Cascading Tank Systems Technical Note 2; IUCN—The International Union for Conservation of Nature: Colombo, Sri Lanka, 2015; p. 189. [Google Scholar]
  26. Zhang, X.; Estoque, R.C.; Xie, H.; Murayama, Y.; Ranagalage, M. Bibliometric analysis of highly cited articles on ecosystem services. PLoS ONE 2019, 14, e0210707. [Google Scholar] [CrossRef] [PubMed]
  27. Díaz, S.M.; Settele, J.; Brondízio, E.; Ngo, H.; Guèze, M.; Agard, J.; Arneth, A.; Balvanera, P.; Brauman, K.; Butchart, S. The IPBES conceptual framework—Connecting nature and people. Curr. Opin. Environ. Sustain. 2015, 14, 1–16. [Google Scholar] [CrossRef]
  28. Müller, F.; Fohrer, N.; Chicharo, L. The basic ideas of the ecosystem service concept. In Ecosystem Services and River Basin Ecohydrology; Chicharo, L., Müller, F., Fohrer, N., Eds.; Springer: Dordrecht, Germany, 2015; pp. 7–33. [Google Scholar]
  29. Burkhard, B.; Müller, A.; Müller, F.; Grescho, V.; Anh, Q.; Arida, G.; Bustamante, J.V.J.; Van Chien, H.; Heong, K.L.; Escalada, M. Land cover-based ecosystem service assessment of irrigated rice cropping systems in southeast Asia—An explorative study. Ecosyst. Serv. 2015, 14, 76–87. [Google Scholar] [CrossRef]
  30. Burkhard, B.; Kroll, F.; Nedkov, S.; Müller, F. Mapping ecosystem service supply, demand and budgets. Ecol. Indic. 2012, 21, 17–29. [Google Scholar] [CrossRef]
  31. Casado-Arzuaga, I.; Madariaga, I.; Onaindia, M. Perception, demand and user contribution to ecosystem services in the Bilbao Metropolitan Greenbelt. J. Environ. Manag. 2013, 129, 33–43. [Google Scholar] [CrossRef] [PubMed]
  32. Burkhard, B.; Kroll, F.; Müller, F.; Windhorst, W. Landscapes’ capacities to provide ecosystem services-a concept for land-cover based assessments. Landsc. Online 2009, 15, 1–22. [Google Scholar] [CrossRef]
  33. Jacobs, S.; Wolfstein, K.; Vandenbruwaene, W.; Vrebos, D.; Beauchard, O.; Maris, T.; Meire, P. Detecting ecosystem service trade-offs and synergies: A practice-oriented application in four industrialized estuaries. Ecosyst. Serv. 2015, 16, 378–389. [Google Scholar] [CrossRef]
  34. Burkhard, B.; Kandziora, M.; Hou, Y.; Müller, F. Ecosystem service potentials, flows and demands-concepts for spatial localisation, indication and quantification. Landsc. Online 2014, 34, 1–32. [Google Scholar] [CrossRef]
  35. Reyers, B.; Biggs, R.; Cumming, G.S.; Elmqvist, T.; Hejnowicz, A.P.; Polasky, S. Getting the measure of ecosystem services: A social–ecological approach. Front. Ecol. Environ. 2013, 11, 268–273. [Google Scholar] [CrossRef]
  36. Paudyal, K.; Baral, H.; Burkhard, B.; Bhandari, S.P.; Keenan, R.J. Participatory assessment and mapping of ecosystem services in a data-poor region: Case study of community-managed forests in central Nepal. Ecosyst. Serv. 2015, 13, 81–92. [Google Scholar] [CrossRef]
  37. Palomo, I.; Felipe-Lucia, M.R.; Bennett, E.M.; Martín-López, B.; Pascual, U. Chapter six -Disentangling the pathways and effects of ecosystem service co-production. Adv. Ecol. Res. 2016, 54, 245–283. [Google Scholar]
  38. Baral, H.; Keenan, R.J.; Fox, J.C.; Stork, N.E.; Kasel, S. Spatial assessment of ecosystem goods and services in complex production landscapes: A case study from south-eastern Australia. Ecol. Complex. 2013, 13, 35–45. [Google Scholar] [CrossRef]
  39. Orsi, F.; Ciolli, M.; Primmer, E.; Varumo, L.; Geneletti, D. Mapping hotspots and bundles of forest ecosystem services across the European Union. Land Use Policy 2020, 99, 104840. [Google Scholar] [CrossRef]
  40. Sarathchandra, C.; Abebe, Y.A.; Wijerathne, I.L.; Aluthwattha, S.T.; Wickramasinghe, S.; Ouyang, Z. An overview of ecosystem service studies in a tropical biodiversity hotspot, Sri Lanka: Key perspectives for future research. Forests 2021, 12, 540. [Google Scholar] [CrossRef]
  41. Hamann, M.; Biggs, R.; Reyers, B. An exploration of human well-being bundles as identifiers of ecosystem service use patterns. PLoS ONE 2016, 11, e0163476. [Google Scholar] [CrossRef]
  42. Hamann, M.; Biggs, R.; Reyers, B. Mapping social–ecological systems: Identifying ‘green-loop’and ‘red-loop’dynamics based on characteristic bundles of ecosystem service use. Glob. Environ. Chang. 2015, 34, 218–226. [Google Scholar] [CrossRef]
  43. Huntsinger, L.; Oviedo, J.L. Ecosystem services are social–ecological services in a traditional pastoral system: The case of California’s Mediterranean rangelands. Ecol. Soc. 2014, 19, 8. [Google Scholar] [CrossRef]
  44. Meacham, M.; Norström, A.V.; Peterson, G.D.; Andersson, E.; Bennett, E.M.; Biggs, R.; Crouzat, E.; Cord, A.F.; Enfors, E.; Felipe-Lucia, M.R. Advancing research on ecosystem service bundles for comparative assessments and synthesis. Ecosyst. People 2022, 18, 99–111. [Google Scholar] [CrossRef]
  45. Ceaușu, S.; Apaza-Quevedo, A.; Schmid, M.; Martín-López, B.; Cortés-Avizanda, A.; Maes, J.; Brotons, L.; Queiroz, C.; Pereira, H.M. Ecosystem service mapping needs to capture more effectively the biodiversity important for service supply. Ecosyst. Serv. 2021, 48, 101259. [Google Scholar] [CrossRef]
  46. Peng, H.; Hua, L.; Zhang, X.; Yuan, X.; Li, J. Evaluation of ESV change under urban expansion based on ecological sensitivity: A case study of three gorges reservoir area in China. Sustainability 2021, 13, 8490. [Google Scholar] [CrossRef]
  47. Alamgir, M.; Pert, P.L.; Turton, S.M. A review of ecosystem services research in Australia reveals a gap in integrating climate change and impacts on ecosystem services. Int. J. Biodivers. Sci. Ecosyst. Serv. Manag. 2014, 10, 112–127. [Google Scholar] [CrossRef]
  48. Oliver, I.; Parkes, D. A Prototype Toolkit for Scoring the Biodiversity Benefits of Land Use Change; NSW Department of Infrastructure Planning and Natural Resources: Parramatta, Australia, 2003; p. 40. [Google Scholar]
  49. Smiraglia, D.; Ceccarelli, T.; Bajocco, S.; Salvati, L.; Perini, L. Linking trajectories of land change, land degradation processes and ecosystem services. Environ. Res. 2016, 147, 590–600. [Google Scholar] [CrossRef] [PubMed]
  50. Bunning, S.; McDonagh, J.; Rioux, J. Land Degradation Assessmentin Drylands (LADA): Manual for Local Level Assessment of Land Degradation and Sustainable Land Management; FAO—Food and Agriculture Organization of The United Nations: Rome, Italy, 2016; p. 183. [Google Scholar]
  51. Shepherd, K.D.; Shepherd, G.; Walsh, M.G. Land health surveillance and response: A framework for evidence-informed land management. Agric. Syst. 2015, 132, 93–106. [Google Scholar] [CrossRef]
  52. Ji, Z.; Xu, Y.; Wei, H. Identifying dynamic changes in ecosystem services supply and demand for urban sustainability: Insights from a rapidly urbanizing city in Central China. Sustainability 2020, 12, 3428. [Google Scholar] [CrossRef]
  53. Crossman, N.D.; Burkhard, B.; Nedkov, S.; Willemen, L.; Petz, K.; Palomo, I.; Drakou, E.G.; Martín-Lopez, B.; McPhearson, T.; Boyanova, K. A blueprint for mapping and modelling ecosystem services. Ecosyst. Serv. 2013, 4, 4–14. [Google Scholar] [CrossRef]
  54. IUCN. Tank Ecosystem Restoration of the Kapiriggama Small Tank Cascade System; IUCN Programme on Restoring Traditional Cascading Tank Systems Technical Note 3; IUCN—The International Union for Conservation of Nature: Colombo, Sri Lanka, 2015; p. 29. [Google Scholar]
  55. Ekanayake, S.P.; Ratnayake, S.S.; Sugathadasa, S.; Rajapakse, R.M. Chapter Three—Biodiversity baseline assessment. In Baseline Assessment of the UNEP-GEF Managing Agricultural Landscapes in Socio-ecologically Sensitive Areas to Promote Food Security, Well-being and Ecosystem Health—Healthy landscapes Project; Dharmasena, P.B., Kadupitiya, H.K., Ratnayake, S.S., Eds.; SACEP—South Asia Co-Operative Environment Programme: Colombo, Sri Lanka, 2020; pp. 151–219. [Google Scholar]
  56. Kadupitiya, H.K.; De Silva, S.H.S.A.; Dilshani, D.G.S.; Weerasinghe, P. Use of smartphones for rapid location tracking in mega scale soil sampling. Open J. Appl. Sci. 2021, 11, 239. [Google Scholar] [CrossRef]
  57. Haines-Young, R.; Potschin-Young, M. Revision of the common international classification for ecosystem services (CICES V5.1): A policy brief. One Ecosyst. 2018, 3, e27108. [Google Scholar] [CrossRef]
  58. López-Marrero, T.; Hermansen-Báez, L.A. Participatory Listing, Ranking, And Scoring of Ecosystem Services and Drivers of Change; USDA Forest Service, Southern Research Station: Gainesville, FL, USA, 2011; p. 7. [Google Scholar]
  59. Rey-Valette, H.; Mathé, S.; Salles, J.M. An assessment method of ecosystem services based on stakeholders perceptions: The Rapid Ecosystem Services Participatory Appraisal (RESPA). Ecosyst. Serv. 2017, 28, 311–319. [Google Scholar] [CrossRef]
  60. Wickham, H. ggplot2: Elegant Graphics for Data Analysis; Springer: New York, NY, USA, 2016. [Google Scholar]
  61. Syrbe, R.-U.; Grunewald, K. Ecosystem service supply and demand–the challenge to balance spatial mismatches. Int. J. Biodivers. Sci. Ecosyst. Serv. Manag. 2017, 13, 148–161. [Google Scholar] [CrossRef]
  62. Jacobs, S.; Burkhard, B.; Van Daele, T.; Staes, J.; Schneiders, A. ‘The Matrix Reloaded’: A review of expert knowledge use for mapping ecosystem services. Ecol. Modell. 2015, 295, 21–30. [Google Scholar] [CrossRef]
  63. Mastrandrea, M.D.; Mach, K.J.; Plattner, G.K.; Edenhofer, O.; Stocker, T.F.; Field, C.B.; Ebi, K.L.; Matschoss, P.R. The IPCC AR5 guidance note on consistent treatment of uncertainties: A common approach across the working groups. Clim. Chang. 2011, 108, 675–691. [Google Scholar] [CrossRef]
  64. Nakazawa, M. Package ‘fmsb’. Available online: https://cran.r-project.org/web/packages/fmsb/fmsb.pdf (accessed on 18 January 2022).
  65. Simpson, E.H. Measurement of diversity. Nature 1949, 163, 688. [Google Scholar] [CrossRef]
  66. García, C.L.; Teich, I.; Gonzalez-Roglich, M.; Kindgard, A.F.; Ravelo, A.C.; Liniger, H. Land degradation assessment in the Argentinean Puna: Comparing expert knowledge with satellite-derived information. Environ. Sci. Policy 2019, 91, 70–80. [Google Scholar] [CrossRef]
  67. NRMC. Assessment and Mapping of Land Degradation and Conservation: Kandy, Nuwara Eliya and Badulla Districts of Sri Lanka; Rehabilitation of Degraded Agricultural Lands (RDAL) Project; NRMC—Natural Resources Management Centre, Department of Agriculture: Peradeniya, Sri Lanka, 2021; p. 63. [Google Scholar]
  68. Dharmasena, P. Evolution of hydraulic societies in the ancient Anuradhapura Kingdom of Sri Lanka. In Landscapes and Societies; Martini, I., Chesworth, W., Eds.; Springer: Dordrecht, Germany, 2010; pp. 341–352. [Google Scholar]
  69. Barral, M.P.; Benayas, J.M.R.; Meli, P.; Maceira, N.O. Quantifying the impacts of ecological restoration on biodiversity and ecosystem services in agroecosystems: A global meta-analysis. Agric. Ecosyst. Environ. 2015, 202, 223–231. [Google Scholar] [CrossRef]
  70. Prober, S.M.; Byrne, M.; McLean, E.H.; Steane, D.A.; Potts, B.M.; Vaillancourt, R.E.; Stock, W.D. Climate-adjusted provenancing: A strategy for climate-resilient ecological restoration. Front. Ecol. Environ. 2015, 3, 65. [Google Scholar] [CrossRef]
  71. Macfadyen, S.; Cunningham, S.A.; Costamagna, A.C.; Schellhorn, N.A. Managing ecosystem services and biodiversity conservation in agricultural landscapes: Are the solutions the same? J. Appl. Ecol. 2012, 49, 690–694. [Google Scholar] [CrossRef]
  72. Fischer, J.; Riechers, M.; Loos, J.; Martin-Lopez, B.; Temperton, V.M. Making the UN decade on ecosystem restoration a social-ecological endeavour. Trends Ecol. Evol. 2021, 36, 20–28. [Google Scholar] [CrossRef]
  73. Heger, T.; Jeschke, J.M.; Febria, C.; Kollmann, J.; Murphy, S.; Rochefort, L.; Shackelford, N.; Temperton, V.M.; Higgs, E. Mapping and assessing the knowledge base of ecological restoration. Restor. Ecol. 2022, e13676. [Google Scholar] [CrossRef]
  74. Clewell, A.F.; Aronson, J. Ecological Restoration: Principles, Values, and Structure of An Emerging Profession; Island Press: Washington, DC, USA, 2012. [Google Scholar]
  75. Luck, G.W.; Harrington, R.; Harrison, P.A.; Kremen, C.; Berry, P.M.; Bugter, R.; Dawson, T.P.; De Bello, F.; Díaz, S.; Feld, C.K. Quantifying the contribution of organisms to the provision of ecosystem services. BioScience 2009, 59, 223–235. [Google Scholar] [CrossRef]
  76. Gann, G.D.; McDonald, T.; Walder, B.; Aronson, J.; Nelson, C.R.; Jonson, J.; Hallett, J.G.; Eisenberg, C.; Guariguata, M.R.; Liu, J. International principles and standards for the practice of ecological restoration. Restor. Ecol. 2019, 27, S1–S46. [Google Scholar] [CrossRef]
  77. Locatelli, B.; Lavorel, S.; Sloan, S.; Tappeiner, U.; Geneletti, D. Characteristic trajectories of ecosystem services in mountains. Front. Ecol. Environ. 2017, 15, 150–159. [Google Scholar] [CrossRef]
  78. Liang, J.; Li, S.; Li, X.; Li, X.; Liu, Q.; Meng, Q.; Lin, A.; Li, J. Trade-off analyses and optimization of water-related ecosystem services (WRESs) based on land use change in a typical agricultural watershed, southern China. J. Clean. Prod. 2021, 279, 123851. [Google Scholar]
  79. Ausseil, A.-G.; Dymond, J.R.; Kirschbaum, M.U.F.; Andrew, R.M. Assessment of multiple ecosystem services in New Zealand at the catchment scale. Environ. Modell. Softw. 2013, 43, 37–48. [Google Scholar] [CrossRef]
  80. Li, B.; Chen, D.; Wu, S.; Zhou, S.; Wang, T.; Chen, H. Spatio-temporal assessment of urbanization impacts on ecosystem services: Case study of Nanjing City, China. Ecol. Indic. 2016, 71, 416–427. [Google Scholar] [CrossRef]
  81. Wei, Y.; Wu, S.; Jiang, C.; Feng, X. Managing supply and demand of ecosystem services in dryland catchments. Curr. Opin. Environ. Sustain. 2021, 48, 10–16. [Google Scholar] [CrossRef]
  82. Dharmasena, P.B. Environmental Richness in The Dry Zone Home Gardens in Sri Lanka. In Proceedings of the Eighth National Workshop on Multipurpose Trees, Kandy, Sri Lanka, 23–25 October 1997. [Google Scholar]
  83. Potschin, M.; Haines-Young, R. Defining and measuring ecosystem services. In Routledge Handbook of Ecosystem Services; Potschin, M., Haines-Young, R., Fish, R., Turner, R.K., Eds.; Routledge: London, UK; New York, NY, USA, 2016; pp. 25–44. [Google Scholar]
  84. Nyumba, T.O.; Wilson, K.; Derrick, C.J.; Mukherjee, N. The use of focus group discussion methodology: Insights from two decades of application in conservation. Methods Ecol. Evol. 2018, 9, 20–32. [Google Scholar] [CrossRef]
  85. Schröter, M.; Remme, R.P.; Hein, L. How and where to map supply and demand of ecosystem services for policy-relevant outcomes? Letter to the Editor. Ecol. Indic. 2012, 23, 220–221. [Google Scholar] [CrossRef]
  86. Villa, F.; Bagstad, K.J.; Voigt, B.; Johnson, G.W.; Portela, R.; Honzák, M.; Batker, D. A methodology for adaptable and robust ecosystem services assessment. PLoS ONE 2014, 9, e91001. [Google Scholar] [CrossRef]
  87. Fang, Z.; Bai, Y.; Jiang, B.; Alatalo, J.; Liu, G.; Wang, H. Quantifying variations in ecosystem services in altitude-associated vegetation types in a tropical region of China. Sci. Total Environ. 2020, 726, 138565. [Google Scholar] [CrossRef] [PubMed]
  88. Neugarten, R.A.; Langhammer, P.F.; Osipova, E.; Bagstad, K.J.; Bhagabati, N.; Butchart, S.H.M.; Dudley, N.; Elliott, V.; Gerber, L.R.; Arrellano, C.G. Tools for Measuring, Modelling, and Valuing Ecosystem Services: Guidance for Key Biodiversity Areas, Natural World Heritage Sites, and Protected Areas; IUCN-WCPA’s Best Practice Protected Area Guidelines Series No 02; IUCN—The International Union for Conservation of Nature: Gland, Switzerland, 2018; p. 70. [Google Scholar]
  89. Johnson, J.A.; Jones, S.K.; Wood, S.L.R.; Chaplin-Kramer, R.; Hawthorne, P.L.; Mulligan, M.; Pennington, D.; DeClerck, F.A. Mapping ecosystem services to human well-being: A toolkit to support integrated landscape management for the SDGs. Ecol. Appl. 2019, 29, e01985. [Google Scholar] [CrossRef] [PubMed]
  90. Krkoška, L.E.; Harmáčková, Z.V.; Landová, L.; Pártl, A.; Vačkář, D. Assessing impact of land use and climate change on regulating ecosystem services in the Czech Republic. Ecosyst. Health Sustain. 2016, 2, e01210. [Google Scholar] [CrossRef]
Figure 1. Location of the study area and major land use types.
Sustainability 14 10180 g001
Figure 2. Methodological approach used to assess ecosystem services in the MVTCS. LUSs = Land Use Systems; ES = Ecosystem Service; KML = Keyhole Markup Language; PRA = Participatory Rapid Appraisal; KII = Key Informant Interviews; EJW = Expert Judgement Workshop.
Sustainability 14 10180 g002
Figure 3. An illustration of the process used to map ecosystem services.
Sustainability 14 10180 g003
Figure 4. Age (a) and the generations (b) of the informants.
Sustainability 14 10180 g004
Figure 5. Community-perceived ranking of ecosystem services in MVTCS. ES = Ecosystem service; Importance value = Community perceived score; P = Provisioning ES; R = Regulating ES; C = Cultural ES; S = Supporting ES; Number (P1) = Rank within the ES category.
Sustainability 14 10180 g005
Figure 6. Land use types and species associations in the MVTCS: (a) land use types, (b) species occurrence (cumulative) in different habitats, (c) number of animal species and (d) foliage cover percentage of species.
Sustainability 14 10180 g006
Figure 7. Ecosystem service supply (ESS) capacity evaluation matrix (a) and ecosystem service demand (ESD) evaluation matrix (b) based on different land use types in the MVTCS. T = Tank; DP = Deep-phase (Diyagilma); UTB = Upstream tree belt (Gasgommana); DR = Downstream reservation (Kattakaduwa); UWH = Upstream water hole (Godawala); USR = Upstream soil ridge (Iswetiya); HG = Home gardens; DF = Dense forests; OF = Open forests; P = Paddy; RARE = Area with exposed rocks; SC = Seasonal crop farming lands; SL = Scrublands; SUCL = Sparsely used crop lands (Chena); ES = Ecosystem service; P = Provisioning ES; R = Regulating ES; C = Cultural ES; S = Supporting ES.
Sustainability 14 10180 g007
Figure 8. Percentage contributions of current supply (a), demand (b) and trade-offs (c) in four ecosystem service categories of different LUTs in the MVTCS based on community-perceived values. T = Tank; DP = Deep-phase (Diyagilma); UTB = Upstream tree belt (Gasgommana); DR = Downstream reservation (Kattakaduwa); UWH = Upstream water hole (Godawala); USR = Upstream soil ridge (Iswetiya); HG = Home gardens; DF = Dense forests; OF = Open forests; P = Paddy; RARE = Area with exposed rocks; SC = Seasonal crop farming lands; SL = Scrublands; SUCL = Sparsely used crop lands (Chena); ES = Ecosystem service.
Sustainability 14 10180 g008
Figure 9. Ecosystem service supply (ESS) and ecosystem service demand (ESD) budget evaluation matrix (a); radar chart of ESS and ESD variations with different LUTs (b). T = Tank; DP = Deep-phase (Diyagilma); UTB = Upstream tree belt (Gasgommana); DR = Downstream reservation (Kattakaduwa); UWH = Upstream water hole (Godawala); USR = Upstream soil ridge (Iswetiya); HG = Home gardens; DF = Dense forests; OF = Open forests; P = Paddy; RARE = Area with exposed rocks; SC = Seasonal crop farming lands; SL = Scrublands; SUCL = Sparsely used crop lands (Chena); ES = Ecosystem service; P = Provisioning ES; R = Regulating ES; C = Cultural ES; S = Supporting ES.
Sustainability 14 10180 g009
Figure 10. Ecosystem service supply capacities of different land use systems in the MVTCS: (a) provisioning, (b) regulating, (c) supporting and (d) cultural.
Sustainability 14 10180 g010
Figure 11. Ecosystem service supply hotspots and bright spots in the MVTCS: (a) biodiversity, (b) land degradation, and (c) overall ecosystem services supply. BVI = Biodiversity Value Index; LDIS = Land Degradation Impact Score.
Sustainability 14 10180 g011
Table 1. Land use system categories used for the ESs assessment.
Land Use System
(LUS)
Land Use Type
(LUT)
CodeScaleFunctions
Agricultural landsPaddyPMacroIrrigated paddy agro-ecosystem.
Sparsely used crop land/Shifting cultivation (Chena)SUCLMacroRain-fed shifting cultivation with very few scattered trees.
Seasonal cropsSCMacroSeasonal crop farming based on climatic seasons.
Forest landsDense forestDFMacroCatchment forest (tropical dry mixed evergreen forest—habitat for wild animals).
Open forestOFMacroSecondary (sparse) forest trees and shrubs. Patches of Damana grasslands associated with tree vegetation.
Scrub landSLMacroOpen areas with low vegetation, covered with small trees and shrubs—habitats for small wild species (amphibians, reptiles etc.).
Forest plantationFPMacroDominant Acacia (Acacia auriculiformis) and monoculture Teak (Tectona grandis) plantation.
Water bodiesTank/Minor reservoirT/MNRMacroVillage tanks. Four geometrical phases of the tank (dead storage, deep-phase, shallow-phase and high flood phase) provide habitats and support the survival of aquatic flora and fauna.
Rocky areasArea with exposed rocksRAREMacroRocks and rock outcrops—habitat for few wild species (amphibians, reptiles, etc.).
Built-up areasHome garden/HomesteadHGMacroHouses, home gardens with horticulture, vegetable and animal husbandry.
Micro-land uses (Ecological commons)Upstream tree belt
(Gasgommana)
UTBMicroStrip of trees found at the periphery of the tank bed. Functioning as a wind barrier, fish breeding habitat, silt filter, habitats for birds and small wild animals.
Downstream reservation
(Kattakaduwa)
DRMicroDiverse vegetation function as natural bio-filter to reduce salinity in seepage water before it reaches into the paddy fields. Habitat for many species.
Upstream soil ridges
(Isweti or Potaweti)
USRMicroUpstream earth ridges to prevent sediment inflow.
Upstream water hole
(Godawala)
UWHMicroHuman-made water hole aims to trap sediment run-off and provides water to wild animals.
Deep phase
(Diyagilma)
DPMicroCentral part of the tank bed. Various aquatic plants are grown in this area. Lotus and hydrilla species are dominant. Invasive aquatic plants such as water hyacinth, azolla, salvenia and water lettuce are also present.
Table 2. Summary of ecosystem services/functions and their key providers that emerged from the participatory rapid appraisal.
Ecosystem ServiceDescriptionKey ProvidersPotential Indicators Identified for ESs Quantification
Food production (P)Cultivated food crops (paddy, cereals, lentils, pulses, vegetables, tubers and other seed crops).
-
Crop species
-
Soil organisms
-
Biophysical elements
-
Agrobiodiversity
-
Soil biodiversity
-
Crop productivity
-
Dietary diversity
Water for domestic use (P)Capacity to provide clean water.
-
Biophysical elements
-
Soil health/land degradation
-
Pollution indicators
-
Groundwater recharge
Water for irrigation (P)Capacity to provide water for agriculture.
-
Biophysical elements
-
Water productivity
Inland fisheries (P)Edible fish species for food and nutrition.
-
Fish species
-
Biodiversity
-
Fish productivity
-
Dietary diversity
Livestock (P)Reared livestock species for livestock products for food and nutrition.
Provide organic manure for crop cultivation.
-
Livestock species
-
Livestock diversity
-
Livestock productivity
-
Dietary diversity
-
Soil organic matter content
Fodder and grasses (P)Existence of grazing lands (pastures) used in the diets of domestic herbivores.
-
Plant species
-
Biodiversity
-
Biomass productivity
Raw materials (P)Plant species used as raw materials.
-
Plant species
-
Biodiversity
-
Biomass productivity
Medicinal plants (P)Medicinal plants and materials.
-
Plant species
-
Biodiversity
Fruits and wild edibles (P)Fruit species and wild edible plants.
-
Plant species
-
Soil organisms
-
Biodiversity
-
Soil biodiversity
Control of floods (R)Capacity of LUSs to capture storm water and reduce runoff.
-
Biophysical elements
-
Plant species of vegetative cover
-
Land use, land degradation, soil health
-
Vegetative cover
Ground water recharge (R)Capacity of LUSs to capture runoff water and enhance aquifer recharge.
-
Biophysical elements
-
Land use, land degradation, vegetative cover, soil health
Water purification (R)Plant species capable to purify polluted water.
-
Plant species
-
Bioiversity—species richness
Local climate regulation (R)Capacity of VTCS ecosystems to reduce negative effects of climate change and regulate air quality.
-
Plant species
-
Biodiversity—species richness
-
Ecological productivity/resilience
Global climate regulation (R)Capacity of VTCS ecosystems to enhance carbon sequestering, and reduce GHG emissions.
-
Biophysical elements
-
Land use, vegetative cover, soil organic carbon
-
Ecological productivity/resilience
Pollination (R)Capacity to maintain insects, birds and animal species as pollinators and seed dispersal animals that support crop pollination—food production and their contribution to gene flows and ecological restoration.
-
Insect, bird, animal and host plant species
-
Biodiversity—species richness
-
Habitat fragmentation
-
Pollution (soil, water, air)
Soil nutrient regulation (R)Capacity of ecological components to maintain soil fertility and soil properties.
-
Biophysical elements
-
Land use, land degradation, vegetative cover, soil health
Soil erosion regulation (R)Capacity of LUSs to provide soil retention, runoff control and reduce soil erosion.
-
Biophysical elements
-
Land use, land degradation, vegetative cover, soil health
Pests and diseases control (R) Capacity to maintain of biological control agents to minimise incidence of pest and diseases outbreak.
-
Insect, bird and vertebrate species
-
Biodiversity—species richness
-
Pollution (soil, water, air)
Landscape diversity (S)Capacity of LUSs to maintain ecologically and social-ecologically important habitats.
-
Biophysical elements
-
Landscape/habitat diversity
-
Landscape performance/resilience
Biodiversity (S)Capacity of VTCS ecosystems to maintain globally and locally important biodiversity to support ecosystem processes and functions.
-
Plant and animal species
-
Biophysical elements
-
Biodiversity
-
Ecological productivity
Aesthetic and recreational values (C)Capacity of landscape to provide areas of outstanding aesthetic beauty and quality. It provides environment for villagers and eco-travellers to relax—recreation and educational potentials.
-
Plant and animal species
-
Biophysical elements
-
Biodiversity
-
Landscape/habitat diversity
Traditional knowledge and values (C)Existence of traditional knowledge systems and practices in the VTCS.
-
Plant and animal species
-
Social elements
-
Biodiversity
-
Biocultural diversity
Cultural customary values (C)Cultural traditions, customs and rituals connected with socio-cultural and ecological elements of the VTCS.
-
Plant and animal species
-
Biocultural elements
-
Biodiversity
-
Biocultural diversity
Spiritual and religious values (C)Spiritual and religious customs associated with a sense of places in the VTCS environment.
-
Biophysical elements
-
Biocultural elements
-
Landscape/habitat diversity
-
Biocultural diversity
Note: P = Provisioning ES; R = Regulating ES; C = Cultural ES; S = Supporting ES functions.
Publisher’s Note: MDPI stays neutral with regard to jurisdictional claims in published maps and institutional affiliations.

