Article

Sustainable Valorization of Four Types of Fruit Peel Waste for Biogas Recovery and Use of Digestate for Radish (Raphanus sativus L. cv. Pusa Himani) Cultivation

1
Department of Biology, College of Science, Princess Nourah bint Abdulrahman University, P.O. Box 84428, Riyadh 11671, Saudi Arabia
2
Agro-Ecology and Pollution Research Laboratory, Department of Zoology and Environmental Science, Gurukula Kangri (Deemed to Be University), Haridwar 249404, Uttarakhand, India
3
Biology Department, College of Science, King Khalid University, Abha 61321, Saudi Arabia
4
Botany Department, Faculty of Science, Kafrelsheikh University, Kafr El-Sheikh 33516, Egypt
5
Biology Department, Faculty of Science and Arts, King Khalid University, Mohail Assir 61321, Saudi Arabia
6
Botany Department, Faculty of Science, Aswan University, Aswan 81528, Egypt
7
Department of Agricultural and Biosystems Engineering, University of Ilorin, PMB 1515, Ilorin 240003, Nigeria
8
Department of Agricultural Civil Engineering, Kyungpook National University, Daegu 41944, Korea
9
Department of Agronomy, Faculty of Agronomy, University of Forestry, 10 Kliment Ohridski Blvd, 1797 Sofia, Bulgaria
10
Department of Plant Production, Faculty of Agriculture, Lebanese University, Beirut 1302, Lebanon
11
University of Zagreb, Faculty of Agriculture, Svetosimunska 25, 10000 Zagreb, Croatia
12
Nehru College, Pailapool, Affiliated Assam University, Silchar 788098, India
*
Authors to whom correspondence should be addressed.
These authors contributed equally to this work.
Sustainability 2022, 14(16), 10224; https://doi.org/10.3390/su141610224
Submission received: 5 July 2022 / Revised: 10 August 2022 / Accepted: 16 August 2022 / Published: 17 August 2022

Abstract

:
Food waste has become a challenging global issue due to its inefficient management, particularly in low and middle-income countries. Among food waste items, fruit peel waste (FPW) is generated in enormous quantities, especially from juice vendors, resulting in arduous tasks for waste management personnel and authorities. However, considering the nutrient and digestible content of organic wastes, in this study four types of FPW (pineapple: PA; sweet lemon: SL; kinnow: KN; and pomegranate: PG) were investigated for their potential use within biogas production, using conventional and electro-assisted anaerobic reactors (CAR and EAR). In addition, the FPW digestate obtained after the biogas production experiments was considered as a soil bio-fertilizer under radish (Raphanus sativus L. cv. Pusa Himani) cultivation. In the results, all four types of FPW had digestible organic fractions, as revealed from physicochemical and proximate analysis. However, PA-based FPW yielded the maximum biogas (1422.76 ± 3.10 mL/62.21 ± 0.13% CH4) using the EAR system, compared to all other FPW. Overall, the decreasing order of biogas yield obtained from FPW was observed as PA > PG > SL > KN. The kinetic analysis of the biogas production process showed that the modified Gompertz model best fitted in terms of coefficient of determination (R2 > 0.99) to predict cumulative biogas production (y), lag phase (λ), and specific biogas production rate (µm). Moreover, fertilizer application of spent FPW digestate obtained after biogas production significantly improved the arable soil properties (p < 0.05). Further, KN-based FPW digestate mixing showed maximum improvement in radish plant height (36.50 ± 0.82 cm), plant spread (70.80 ± 3.79 cm2), number of leaves (16.12 ± 0.05), fresh weight of leaves (158.08 ± 2.85 g/plant), fruit yield (140.10 ± 2.13 g/plant), and fruit length (25.05 ± 0.15 cm). Thus, this study suggests an efficient method of FPW management through biogas and crop production.

1. Introduction

Fruit production is one of many agricultural activities which farmers in developing countries embrace as a sustainable means of livelihood, in order to achieve their sustainable development goal (SDG) 2 [1]. Over the last decade, therefore, many of these countries have encouraged small farmers to enrich their lands with different types of succulent fruit trees. In 2020, global fruit production was estimated at several million metric tons, among which were: 114.1 million metric tons of oranges, mandarins, and derivatives; 27.8 million metric tons of pineapples; 13.7 million metric tons of citrus; and 8.1 million metric tons of pomegranates [2]. Similarly, a published report revealed an average production of more than 97 thousand million metric tons of fruits in 2018 in India, including 5101, 3266, 1706, and 2845 million metric tons of mandarin and derivatives, sweet lemon, pineapple, and pomegranate, respectively [3]. This huge production has naturally resulted in tremendous amounts of fruit peel waste (FPW), which accounts for approximately 25–30% of the initial fruit’s weight (24,250–29,100 million metric tons in India alone).
Despite being a natural and biodegradable material, FPW may become a serious ecological-environmental issue. Generated wastewaters, which hold significant amounts of spent organic matter, require efficient management; but they are often discharged directly into the environment. These wastes, largely abandoned by juice vendors, also hold considerable amounts of essential compounds, such as enzymes, vitamins, polyphenols, and carotenoids, in addition to dietary fibers [4]. As a result, they can be used as raw materials to produce natural, edible films and probiotics within the textile and pharmaceutical industries [5]. Moreover, they have been shown to have high recycling potential with regards to recovering valuable metals from abandoned Lithium-ion batteries, thus acting as green reductants [6]. Other studies reported the application of this type of waste in food and nutrition fields, resulting in an amelioration of meat and meat by-product properties [7,8,9].
Several bioenergy technologies have been adopted as an approach to food waste management, including gasification, hydrothermal liquefaction, and biohydrogen production. Although they attained initial goals, their main constraints were mostly the need for high purification, aqueous phase reformation, and hydrocracking, etc. [10], which are all time-consuming procedures. Moreover, essential raw materials used in the production of biofuels is generally expensive, with the need for cheap alternatives on-going. In this context, several agricultural waste products have been used in the production of biogas and methane. Kumar and co-workers obtained a high biogas volume (8834 mL or 11.93 mL/g of organic carbon), along with considerable methane content (61%), with spent mushroom substrate mixed with cow dung [11]. They also noted increases in chlorophyll, flavonoids, phenolics, and tannin contents, as well as increases in plant height, seed germination, seedlings, root lengths, and the total yield of tomato (Solanum lycopersicum L.) fertilized with the produced AD digestate. Likewise, fruit wastes, with their high protein and carbohydrate contents, are biologically pre-digested and can easily be decomposed by active anaerobic bacteria. In this context, several studies have aimed to enhance methane production through the incorporation of fruit waste in anaerobic digestion (AD). Extruded and non-extruded banana stems, orange peel, and citrus wastes, subjected to AD, resulted in considerable amounts of methane (around 332.7 mLN/g for extruded fruit waste and 253.9 mLN/g for non-extruded) [12]. Another study revealed that fruit waste (banana, mango, and papaya), mixed with sewage sludge and prepared at a temperature of 350 °C (1 wt./1wt.), yielded an optimum methane production of around 285.7 mLN/g [13]. Biogas and methane production from passion fruit peel, orange, and cashew bagasse, were estimated through first order and modified Gompertz kinetic models [14]. The authors reported that optimum biogas and methane yields were obtained with orange bagasse (348 NmL/g and 128 NmL/g, respectively). Moreover, due to their richness in valuable carbohydrates and holo-cellulosic compounds, different pineapple wastes, including the peels, were studied for further methane production. Consequently, fresh, and dried pineapple peels showed acceptable methane yields (51% and 41%, respectively) [15], while a mixture of pig dung with pineapple peels (1:1 v/v) generated around 68% of methane [16]. The AD of pomegranate peel waste has captured the interest of several researchers after it was found that this type of waste generated reasonable amounts of biogas and methane (0.71 m3/kg and 55.7%, respectively) [17]. In addition, the post-digestion management of slurry (digestate) is also challenging for biogas production; therefore, a circular bioeconomy might be a useful approach for the efficient management of biogas digestate, particularly in crop cultivation.
Comparison between a conventional anaerobic reactor (CAR) and an electro-assisted anaerobic reactor (EAR) revealed that the latter had a good methane enrichment in biogas production [18,19]. However, it failed to show sustainable improvement in production, underlying the need for further investigations. PA, PG, KN, and SL juices, are well known in Haridwar city, though their peel wastes are largely abandoned, simulating their potential in AD. Although there have been numerous applications performed for biogas and methane production of fruit waste in general, and specifically for FPW, to the best of our knowledge this is the first study to compare the production of biogas through fruit peels mixed with cow dung, in both conventional anaerobic and electro-assisted reactors. A modified Gompertz kinetic model was performed to purposely compare the findings of all treatments in both reactors. In addition, the spent FPW digestate, obtained after biogas production, was further used for radish (Raphanus sativus L. cv. Pusa Himani) cultivation to achieve a zero-waste target in agriculture.

2. Materials and Methods

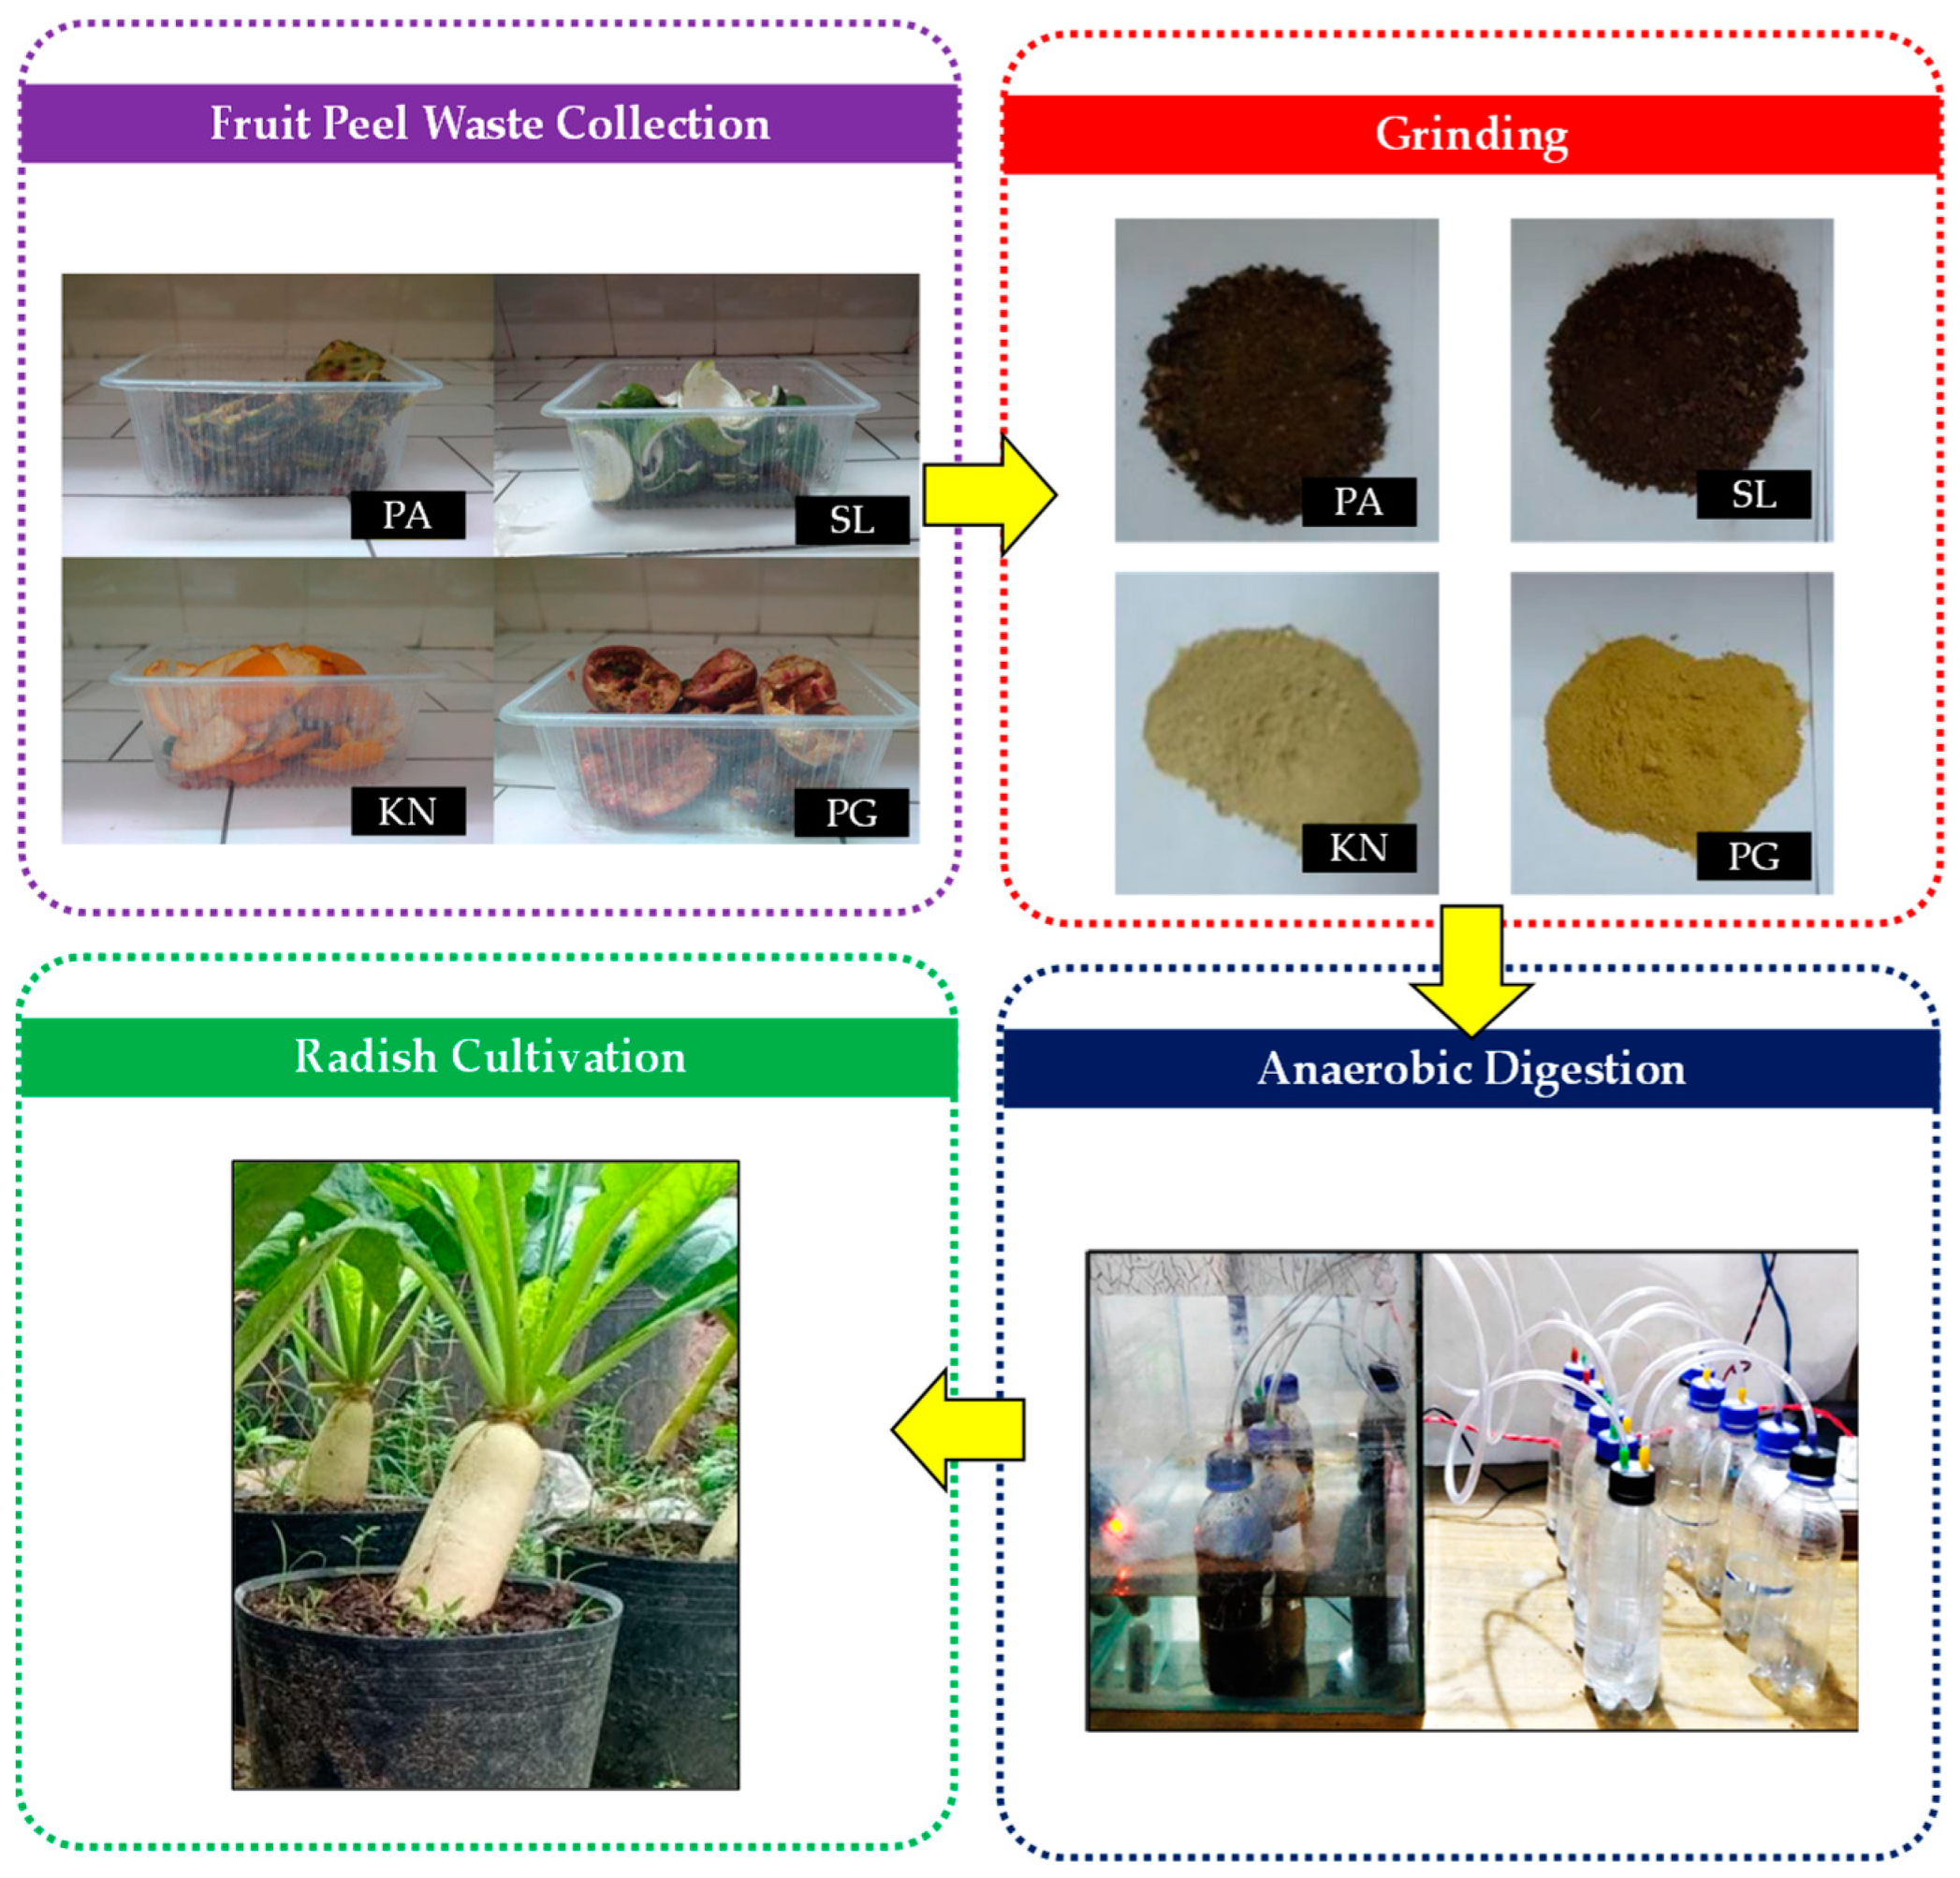
2.1. Collection of Experimental Materials

For this study, four types of fruit peel waste (FPW), including pineapple (PA; Ananas comosus (L.) Merr), sweet lemon (SL; Citrus limetta Risso), kinnow (KN; a hybrid cultivar of Citrus nobilis × Citrus deliciosa), and pomegranate (PG; Punica granatum L.), were collected from disposal bins of local juice vendors in different locations within Haridwar city, India (29°56′45″ N and 78°08′59″ E). Specifically, FPW was collected in separate zip-lock polythene bags of 500 g capacity and transported to the laboratory. All materials were stored at room temperature until further analysis in the biogas production experiments. In addition, fresh cow dung (CD) inoculum was obtained from the cattle shed of Gurukula Kangri (deemed to be a university), Haridwar, India (29°55′07.2″ N and 78°07′18.1″ E). Moreover, certified healthy seeds of radish (Raphanus sativus L. cv. Pusa Himani) were procured from Durga Seed Farm, Chandigarh, India.

2.2. Experimental Design for Biogas Production

All FPW was dried in an oven at 60 °C until a constant weight was achieved. Further, the FPW was ground using a mechanical grinder (HL7576/00 600W, Philips Amaze, India) and converted into fine powder. The biomass was passed through a sieve to achieve a uniform particle size of 1000 μm (Elysia, India). Biogas production experiments were conducted using 250 mL plastic bottles, as shown in Figure 1. The reactor system was comprised of three different interconnected units, including: (a) substrate digester, (b) gas collector, and (c) water collector. The digester unit was filled with a total of 1:3 ratio of substrate and distilled water. For this, a total of eight experimental treatments were performed to assess the biogas production efficiency of four FPWs. Specifically, four treatments were performed using 50 g (25 g FPW + 25 g CD) substrate supplied with 150 mL of distilled water for each individual FPW type. Moreover, four additional treatments were performed using the same FPW under a moderate supply of electric current. For this, as previously described by Kumar et al. [20], two aluminum electrodes were inserted into the substrate digester unit and attached to a constant power supply (HTC 0-30V, SMPS-3005, HATCO Ind., Mumbai, India), with a regulated direct electric current of 1.5 V. All experiments were performed as triplicates. The temperature (35 °C) of the substrate digester was regulated by placing it in a 25 L capacity glass aquarium facilitated with a digital temperature controller sensor (RC-A-41197, Robocraze, India). The biogas production was monitored for 14 days, until the cumulative yield became stationary.

2.3. Experimental Design for Radish Cultivation

In the biogas experiment, the FPW digestate which gave the highest biogas yield was separately air-dried for 3 days. Subsequently, a 5% w/w dose of dried digestate was mixed with arable soil. Radish cultivation was carried out in 40 kg capacity plastic pots filled with 35 kg of arable soil. A total of two radish seeds were sown at a depth of 5 cm. The experiments were performed in triplicate and in a randomized block design. The experiments lasted for 50 days, from January 2022 to February 2022. The environmental condition within the greenhouse was maintained at 23 °C temperature, with 75% relative humidity, and 18/6 h of natural light/darkness. The harvested radish crop was used for selected morphological and yield parameters, including plant height (above ground), plant spread (cm2), number of leaves, fresh weight of leaves (g/plant), fruit yield (g/plant), and fruit length (cm).

2.4. Analytical and Instrumental Procedures

In this study, selected FPW was analyzed for selected physicochemical and proximate parameters, such as pH, electrical conductivity (EC: dS/m), moisture content (%), organic carbon (OC: %), total nitrogen (N: %), C:N ratio, total solids (%), volatile solids (%), chemical oxygen demand (COD: mg/L), cellulose (%), hemicellulose (%), lignin (%), reducing sugars (g/L), and total ash (%) content [21]. For this, pH and EC were determined using a calibrated multimeter (1615, ESICO, India). The moisture content was determined based on the oven drying method. Organic carbon was analyzed using the Walkley and Black method [22], while total nitrogen was determined using the Kjeldahl acid digestion and distillation method [23]. Similarly, arable soil was also analyzed for pH, EC, OC, N, C:N ratio, and total phosphorus (P: %). The selected proximate parameters were determined as per the methods described by Laferrriere [24]. Moreover, compositional analysis of the produced biogas was carried out using a gas chromatography (GC) equipped with a thermal conductivity detector (TCD) (Nucon-5765, Nucon Engineers Ltd., New Delhi, India). In this, Argon (Ar) was used as career gas with a flow rate of 30 mL/min, while detector and column temperatures were adjusted to 60 and 90 °C, respectively [25].

2.5. Data Analysis

The biogas slurry, prepared from different combinations of selected FPW and CD, was analyzed before and after the AD. For this, a percent (%) removal efficiency (Re) index was used to understand net reduction in its physicochemical and proximate parameters [11]. Equation (1) shows the formula used for the removal efficiency calculation:
Removal efficiency (Re: %) = ((Initial value − Final value)/Initial value) × 100
The trend of biogas production from selected FPW in combination with CD was evaluated using a non-linear sigmoid model. For this, a modified Gompertz model was used to determine critical parameters, in order to maximize biogas production. The selected model is a modified form of the Gompertz sigmoid function and is widely accepted to simulate biogas production trend [26]. The form of the model is given in Equation (2):
y = P e x p { e x p [ μ m P ( λ t ) + 1 ] }
where P is the cumulative biogas production potential (mL), μm is the specific biogas production rate (mL/day), λ is the lag phase period (days), and t is the digestion time (days). Data were analyzed using Microsoft Excel 2019 (Microsoft Corp., Redmond, DC, USA) and OriginPro 2022a (OriginLab Corp., Northampton, MA, USA) software packages. The level of statistical significance was adjusted to a 95% confidence interval (p < 0.05) for all tests.

3. Results and Discussion

3.1. Properties of Fruit Peel Waste Used in This Study

The physicochemical and proximate characteristics of CD and FPW are shown in Table 1. The CD had significantly (p < 0.05) higher pH (24–28%) and COD (48–68%), compared to FPW; whereas the latter had significantly higher moisture (4–23%), organic carbon (20–44%), total nitrogen (19–48%), cellulose (41–64%), hemicellulose (19–57%), and reducing sugars (47–65%), in comparison with CD. In fact, FPW richer in essential reducing sugars for biogas production helps in the hastening of holo-cellulose compounds’ decomposition, as a result of their acidic pH. In this context, cellulase activity, which increases more prominently, induces a faster decomposition of lignocellulosic wastes [11] (herein FPW). Moreover, the increased carbon content in FPW helps provide bacterial needs during AD. In addition, an optimum C:N ratio for biogas production was acknowledged as being in the range of 20:1–30:1 [27]. The physicochemical study of used FPW reveals that their C:N ratio is within the range considered suitable for biogas production. Also, lignin, being more complex than cellulose and hemicellulose, takes more time to be decomposed; however, when lignin is decomposed, it assures the needed cellulose and hemicellulose for microbial communities’ activity, once the easily available holocellulose are completely depleted [28]. Herein, FPW, except for KN (19.8% reduction is noted), restocked the AD microbes with increased lignin content (35.1–109.0%), whereas CD improved AD’s efficiency by amalgamating microbial communities in the biogas reactors. TS and vs. were also improved in FPW (except KN) by 11–40% and 4–43%, respectively, compared to CD. PA was reported to enclose 5-fold and 3-fold more TS and vs. [16], compared to the current study. However, it yielded 3-fold less biogas when mixed with pig dung (PD), compared to FPW mixed with CD. This may be due to different composition of PD than CD. Similarly, PG reportedly showed higher vs. in 9-fold, and 3.5-fold of lignin were detectable in an earlier study, compared to our current work [17], resulting in extremely less biogas production. Despite that, we suggested PG is suitable for biogas and methane production.
In order to perform a comparative evaluation among different types of fruit peel, the recorded spectra of PA, SL, KN, and PG, were averaged (Figure 2). Similarity was observed between all fruit peel spectra regarding the downward (negative) peak in IR transmittance (1/cm) regions at 3450–3330, which indicates a weakening of hydrogen bonds. Evidently, negative peaks of transmittance indicate upward (positive) peaks of absorption. Based on this, some researchers attribute the peak of the IR absorption region at around 3300 to an N-H stretching vibration of proteins, amide A, and nucleic acid [29]. A homogenous and similar vibration was observed in the IR transmittance regions at 4000–2500 of all fruit peel spectra. Similar negative peaks were detectable in PA and SL spectra at 1200–1150, which simulates a strong C=O stretching of tertiary alcohol compounds, mostly found in carbohydrates [29]. An additional negative peak was detected at around 1700 in PA spectra, assuming a similarly strong C=O stretching between primary amides, such as the amide I band correlated to an antioxidant capacity [30]. Therefore, the decrease in the transmittance percentage in this region corresponds to a valuable antioxidant capacity of PA peel. Negative peaks in KN and PG faced positive peaks in PA and SL at 1550–1500, reflecting strong and weak N-O stretching, respectively, of amide II, found in protein. A positive peak was similarly observed in SL and PG spectra at 755–750, outlining a weak C-H bending of monosubstituted, or 1,2-disubstituted, compounds [31]. Negative peaks in the IR transmittance of KN and PG spectra at the region 1150–1085, revealed strong C-O stretching of aliphatic ethers in carbohydrates [26]. Moreover, PG showed two peaks in its IR transmittance: a positive peak at the region 895–885, pointing out a weak C=C bending of alkene compounds (known as unsaturated systems), and a negative peak at the region 3000–2840, outlining a medium C-H stretching of alkane compounds (known as saturated systems) [31].

3.2. Changes in FPW-Based Slurry before and after Biogas Production

Table 2 outlines the significant reduction (p < 0.05) in the physicochemical and proximate parameters of biogas slurry, based on mixtures of CD and different types of FPW after completion of AD. AD in a conventional reactor showed the highest reduction of pH in PG (22.8%); whereas PA outlined the highest reduction in the remaining parameters as follows: EC (28.6%), OC (39.1%), TN (23.3%), TS (46.9%), vs. (54.8%), COD (64.4%), cellulose (19.9%), hemicellulose (27.8%), lignin (37.0%), and RS (73.1%). The pattern of removal efficiency points out the highest removal percentages in the following decreasing order: PA > PG > SL > KN (Figure 3). Therefore, it is notable that PA is more digestible, probably due to its higher acidic pH, which plays a role in the improvement of enzymatic activities during AD. Methane production is a natural result of the holocellulose component’s decomposition into simpler organic molecules, releasing essential sugars for methanogens [32]. The use of an electro-assisted anaerobic reactor indicates the highest reductions in pH (26.78%), EC (34.55%), OC (49.45%), TN (27.18%), TS (52.15%), vs. (60.27%), COD (72.51%), cellulose (22.43%), hemicellulose (33.14%), lignin (41.43%), and RS (82.88%), in PA, compared to the remaining types of FPW. As in the conventional reactor, a similar decreasing trend of removal percentages was observed in the electro-assisted anaerobic reactor (PA > PG > SL > KN). It is worth noting that the microbial populations were mainly lignin–decomposers, rather than cellulose– or hemicellulose–decomposers. Comparison between both reactors revealed that the electro-assisted anaerobic reactor significantly reduced OC, TN, COD, cellulose, hemicellulose, lignin, and RS, in all FPW digestate, compared to the conventional reactor. The pH was significantly reduced in PA and SL electro-assisted anaerobic reactors; whereas EC was significantly reduced in all FPW (except KN), compared to the conventional reactor. An earlier study reported that no obvious differences in results were observed between conventional and electro-assisted anaerobic reactors; therefore, no significant differences were detected in terms of the physicochemical composition of the digestate [18]. The current findings, however, contradicted the aforementioned study, proving the efficiency of the electro-assisted anaerobic reactor in a more qualitative AD.
An earlier study reported that pH and COD reductions of 2.9–6.6% and 61.9–70.8%, respectively, were noted after AD of passion fruit peel [12]. Although the results of COD removal in the aforementioned study matched our findings, pH reduction was 3.4 to 7.9-folds higher (i.e., PG) in the current study. Surprisingly, EC increased by 70.0–71.2% after digestion of passion fruit peel, contradicting our findings. A previous study claimed that a pH lower than 6.2 has a negative impact on methanogens, and results in an inhibition of AD, and thus reduced methane production [16]. Herein, this hypothesis showed no reliability as reactors with the lowest pH (5.10–5.49) showed the best physicochemical reductions, and highest methane yields. On the other hand, the higher reduction rate of OC, compared to TN, confirms the hypothesis of Kumar et al. [11], underlying a more rapid consumption of the former by anaerobes, during methane production [26]. With regards to the remaining parameters, the higher reduction of COD and RS (mainly in PA and PG) reveals that the latter was the most consumed, thus playing an essential role in the quality improvement of obtained digestate, and the increase of methane yields. Therefore, PA and PG are the most promising FPW in methane production, regardless of the type of AD reactor used.
In recent studies, several agro-industrial residues were assessed for their potential in biogas production. For instance, Kumar et al. [26] produced biogas from Eichhornia crassipes plant residues supplemented with sugar industry effluent, denoting a considerable reduction in TS, TN, OC, and VS, with 2.2-folds, 28.4-folds, 2.8-folds, and 3.3-folds, respectively, lower than our findings. More recently, a successful trial to produce biogas using spent mushroom substrate supplemented with cow dung was denoted [11]. The aforementioned study reported maximal reductions in the physicochemical properties of slurry reactors, being, therefore, higher in terms of pH (11.5%), EC (9.8%), OC (47.2%), TN (54.5%), vs. (16.8%), cellulose (35.7%), hemicellulose (47.0%), and lignin (47.8%), and lower in terms of TS (12.3%), compared to herein maximal reductions (PA, case of conventional reactor) [11]. This highlights the affordability of producing considerable amounts of biogas, while removing maximum amounts of spent lignocellulosic compounds from abandoned FPW.

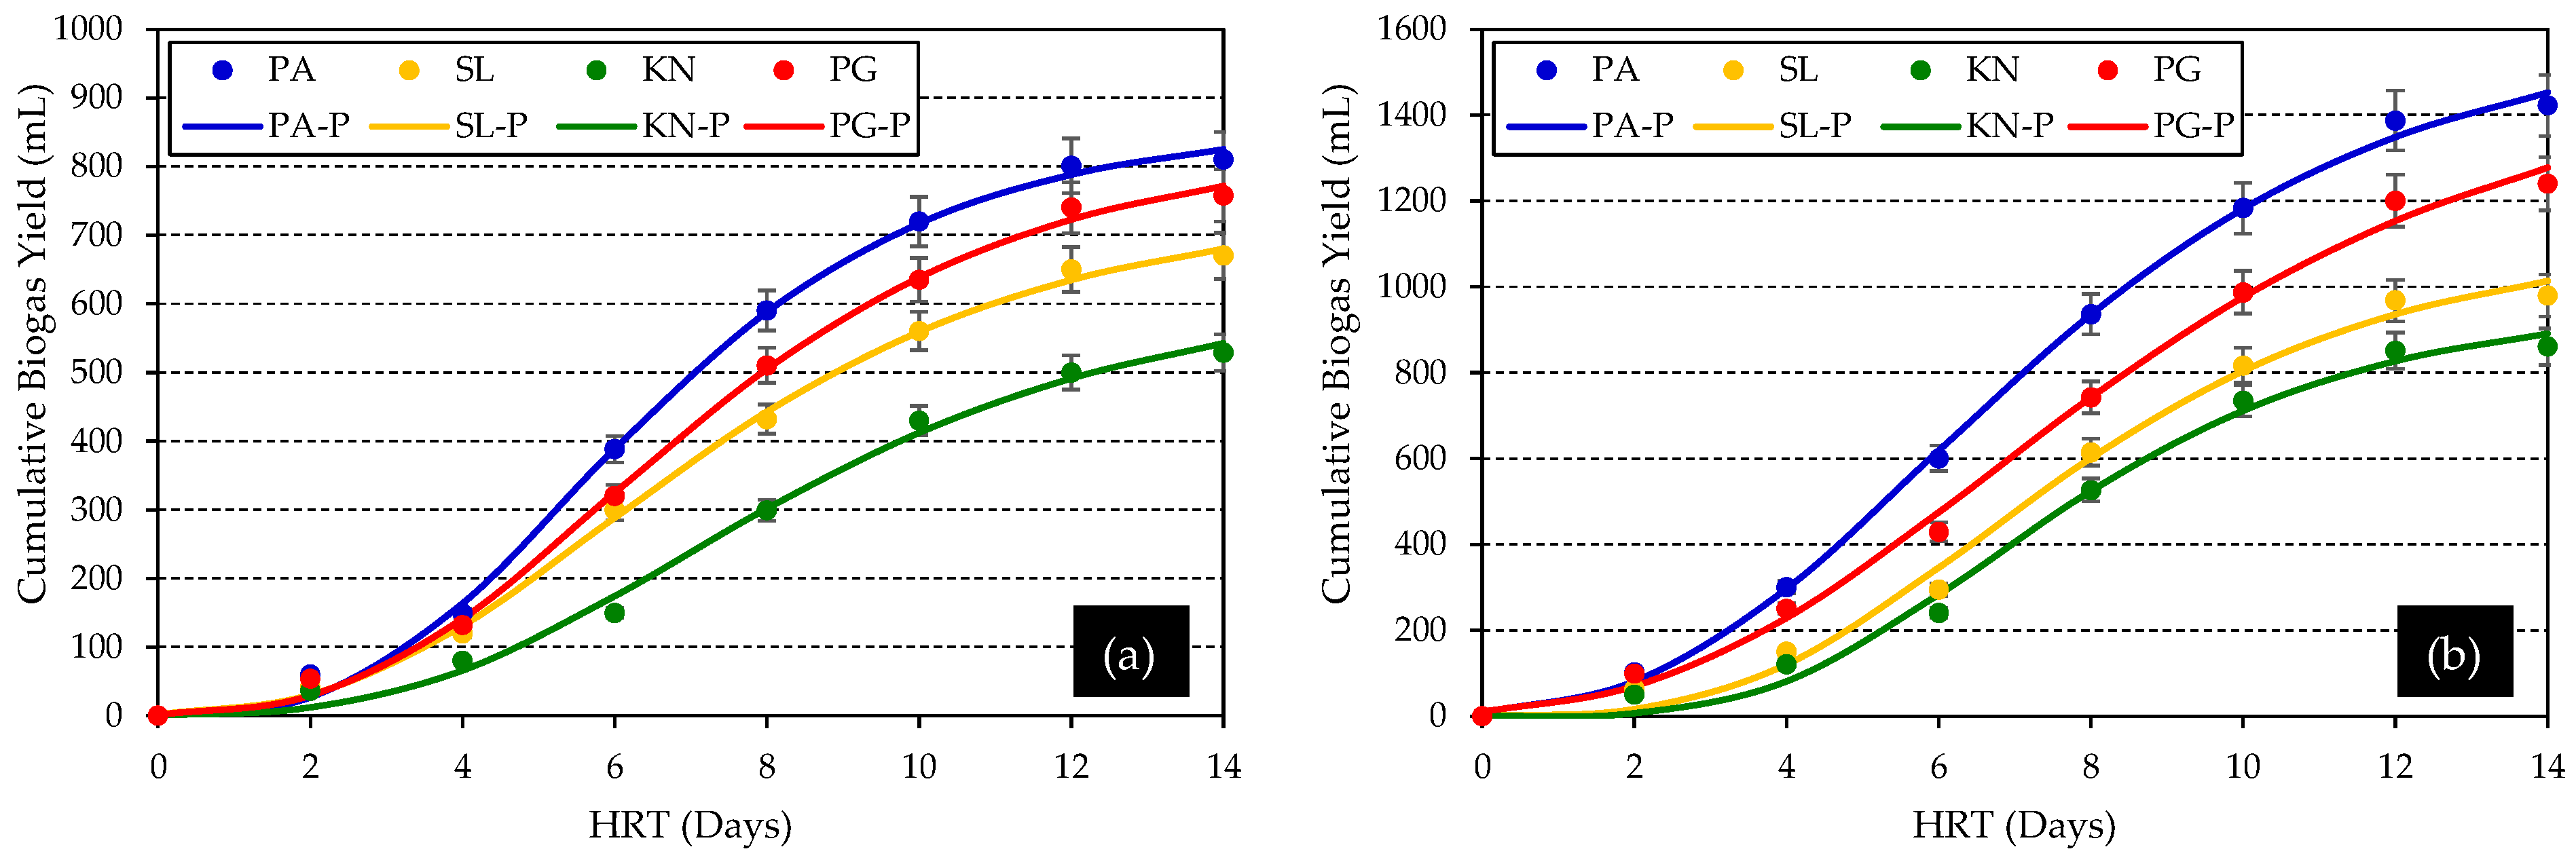
3.3. Biogas Production Potential of Selected FPW and Kinetic Modeling Results

In this study, selected FPW was assessed for biogas production by using two different AD systems i.e., CAE and EAR. Table 3 summarizes the yield and biochemical composition of biogas produced from selected FPW. It was observed that EAR showed significantly (p < 0.05) higher biogas yields, as compared to CAR. In particular, PA-based FPW yielded the highest cumulative biogas (810.50 ± 2.54 and 1422.76 ± 3.10 mL) in both CAR and EAR systems, followed by PG (758.53 ± 1.52 and 1240.10 ± 0.80 mL), SL (670.30 ± 1.90 and 979.18 ± 1.30 mL), and KN (529.10 ± 2.10 and 860.43 ± 0.52 mL). Results revealed that a low-level electric current supply helped maximize the biogas yield from selected FPW. The GC-TCD analysis of collected biogas showed that PA and PG-based FPW had the highest CH4 content (62.21 ± 0.13 and 62.15 ± 0.07%) under EAR experiments. Comparatively, the content of CH4 was increased significantly (p < 0.05) as a result of the electric current supply, while the content of CO2 was reduced in EAR. The biogas yield increased nearly 2-fold. Moreover, the biogas obtained from FPW digestion also showed the presence of slight concentrations of H2S (<0.06%), and water vapors (<0.01%). Maximum biogas production in the case of PA and PG might be associated with efficient digestion of their biochemical and proximate fractions, as also depicted in Table 2, which aided in efficient CH4 release. Moreover, a low-level electric current could help in the efficient electrolysis of water molecules, and increase the bioavailability of electrons at the cathode. These free electrons accelerate the biochemical decomposition of the slurry substrate by different types of anaerobes, which principally release CH4 [20].
The AD experiments lasted for 14 days and daily biogas production was simultaneously monitored. The time-course biogas production data were subjected to a non-linear function-based sigmoid model (modified Gompertz), to compute kinetic parameters. The model-fitting results are provided in Table 4. The results indicated that the modified Gompertz function had acceptable fitness in terms of less standard error in prediction, and coefficient of determination (R2 > 0.99) values. In this regard, the best values for predicted biogas production (y: 1452.81 ± 7.90 mL), lag phase (λ: 5.81 days), and specific biogas production rate (μm: 0.28 mL/day), were observed for PA-based FPW under EAR system. As shown in Figure 4, the time-course fitting curve also exhibited a precise prediction of cumulative biogas production from selected FPW. Kinetic modeling of biogas production helps us to understand the critical parameters of microbial processes, and overall patterns of biogas yield. By using these variables, the digestion process can be adjusted and optimized for better performance. Several studies have been carried out on biogas production from fruit waste using different types of digesters [33]. A study by Ariyanto et al. [34] revealed sustainable upcycling of FPW (orange, mango, and apple) through AD, and achieved 1075 Nm3/day of biogas yield by employing a pilot-scale plant. Similarly, Silva et al. [35] assessed the feasibility of passion FPW (Passiflora edulis) in biogas production, under a combined enzymatic hydrolysis pretreatment. They recorded that passion FPW was able to produce high-quality biogas, having methane concentrations up to 64%. Most recently, Kumar et al. [20] comparatively studied the biogas production efficiency of CAR and EAR systems, and revealed that a low-level electric current supply accelerated the biogas production by 2-fold, with a significant increase in CH4 contents. Therefore, results reported in these studies are in strong agreement with the current study, which suggests the feasibility of EAR over CAR systems, for biogas production from FPW.

3.4. Effect of FPW Digestate on Soil Properties and Radish Crop

In this study, the digestate obtained after the biogas process was further utilized as a soil amendment for radish cultivation. The digestate from the treatments having the highest biogas yield was collected for each FPW. The digestate was mixed with arable soil (5% w/w) for enhanced nutrient availability. As depicted in Table 5, it was observed that FPW digestate mixing significantly (p < 0.05) increased the selected physicochemical (pH and EC), and nutrient (OC, N, P, K) properties. However, the maximum increase in soil nutrients was encountered for the KN-based FPW digestate mixing treatment. It was evidenced that KN showed comparatively less removal of physicochemical, proximate, and nutrient parameters, after biogas production, leading to a high residual fraction in its digested slurry. Thus, the higher the residual fraction, the more nutrients were made available to the soil after digestate mixing. Overall, the decreasing order of FPW digestate effect on nutrient availability of arable soil was identified as KN > SL > PG > PA > Control. A recent report by Kumar et al. [11] showed that soil nourished with biogas digestate had higher nutrient fractions, compared to control treatments.
In addition, Table 6 shows the morphological and yield attributes of the radish crop, grown on arable soil supplemented with different types of FPW digestate. The findings revealed that FPW digestate supplementation had a significant (p < 0.05) increase in morphological and yield attributes of the radish. Specifically, the KN-based FPW digestate showed maximum radish plant height (36.50 ± 0.82 cm), plant spread (70.80 ± 3.79 cm2), number of leaves (16.12 ± 0.05), fresh weight of leaves (158.08 ± 2.85 g/plant), fruit yield (140.10 ± 2.13 g/plant), and fruit length (25.05 ± 0.15 cm), among all other treatments. The decreasing order of radish crop yield was identified as KN > PA > PG > PA > Control. Therefore, since nutrient availability in arable soil is the key factor affecting crop yields, FPW digestate amendment was found to be helpful towards increasing the response of radish. Several varieties of radish are grown in India, including Pusa (Himani, Desi, Chetki, Reshmi), Japanese White, Punjab Safed, and Nadauni. Of these, Pusa Himani is widely grown in temperate regions and is preferred by local growers due to its high yield and resistance to pathogens. Reports on Pusa Himani cultivation under different regimes have shown that it is one of the most successful varieties in terms of germination (>91%) and yield [>130 g/fruit [36]; however, limited studies are available on the use of any kind of biogas digestate for radish cultivation. A recent study by Lee et al. [37] studied the impact of biogas digestate on the growth and nutrient composition of radish crops. They reported that digestate addition increased the antioxidant capacity, total phenolic content, and ascorbic acid levels, of the radish crop. Similarly, Przygocka-Cyna and Grzebisz [38] studied the impact of biogas digestate-based bio-fertilizer on the nutrient composition of cultivated radish crops. They found that the yield and nutritional properties of radish roots were significantly improved after the addition of bio-fertilizer. Thus, these reports support the hypothesis regarding the sustainable use of FPW digestate for improved radish productivity.

4. Conclusions

The findings of this study conclude that fruit peel waste (FPW) generated from local juice vendors can be used for sustainable biogas production in combination with cow dung-based inoculum, and can further enhance the cultivation of radish using the digestate as a biofertilizer. Out of four selected FPWs, pineapple FPW showed the best biogas production in terms of cumulative volume (859.78–1599.04 mL) and methane concentration (59.10–62.21%). Moreover, an electro-assisted anaerobic reactor (EAR) showed better biogas production (higher by 46.08–75.54%), compared to a conventional anaerobic reactor (CAR), due to improved substrate breakdown. In addition, the FPW digestate obtained after the biogas production experiment further helped to increase the nutrient properties of arable soil and subsequent radish (Raphanus sativus L. cv. Pusa Himani) cultivation. The morphological and yield attributes of the radish crop were significantly (p < 0.05) improved after the addition of FPW digestate. This study provides a sustainable approach to food waste management through bioenergy recovery, soil nourishment, and vegetable production. Further studies on the nutritional and elemental composition of both FPW digestate and cultivated radish are highly recommended.

Author Contributions

Conceptualization, V.K., R.K. and P.K.; data curation, R.K.; formal analysis, R.K. and P.K.; funding acquisition, A.A.A.-H., E.M.E., M.A.T. and I.Š.; investigation, R.K.; methodology, P.K.; project administration, A.A.A.-H. and E.M.E.; resources, V.K.; software, P.K.; supervision, V.K.; validation, A.A.A.-H., V.K., E.M.E., M.A.T., B.A., S.A.F., B.M., V.D., M.G. and I.Š.; visualization, M.G. and P.K.; writing—original draft, S.A.F. and P.K.; writing—review and editing, V.K., E.M.E., M.A.T., B.A., B.M., V.D., M.G. and I.Š. All authors have read and agreed to the published version of the manuscript.

Funding

This research was funded by Princess Nourah bint Abdulrahman University Researchers Supporting Project number (PNURSP2022R93), Princess Nourah bint Abdulrahman University, Riyadh, Saudi Arabia; and King Khalid University (grant number RGP.1/182/43), Abha, Saudi Arabia.

Institutional Review Board Statement

Not applicable.

Informed Consent Statement

Not applicable.

Data Availability Statement

Not applicable.

Acknowledgments

The authors are grateful to their host institutes for providing the necessary facilities to conduct this study. The authors express their gratitude to Princess Nourah bint Abdulrahman University Researchers Supporting Project number (PNURSP2022R93), Princess Nourah bint Abdulrahman University, Riyadh, Saudi Arabia. M.A.T. extends his appreciation to King Khalid University for funding this work through the Research Group Project under grant number RGP. 1/182/43, King Khalid University, Abha, Saudi Arabia. All individuals included in this section have consented to the acknowledgment.

Conflicts of Interest

The authors declare no conflict of interest.

References

  1. Adelodun, B.; Kareem, K.Y.; Kumar, P.; Kumar, V.; Choi, K.S.; Yadav, K.K.; Yadav, A.; El-Denglawey, A.; Cabral-Pinto, M.; Son, C.T.; et al. Understanding the impacts of the COVID-19 pandemic on sustainable agri-food system and agroecosystem decarbonization nexus: A review. J. Clean. Prod. 2021, 318, 128451. [Google Scholar] [CrossRef]
  2. Shahbandeh, M. Global Production of Fruit by Variety Selected 2019. 2021. Available online: https://www.statista.com/statistics/264001/worldwide-production-of-fruit-by-variety/ (accessed on 15 July 2022).
  3. MoAFW Horticultural Statistics at a Glance 2018; Department of Agriculture, Cooperation & Farmers’ Welfare, Horticulture Sta-tistics Division, Ministry of Agriculture & Farmers’ Welfare, Government of India: New Delhi, India, 2018.
  4. Hussain, H.; Mamadalieva, N.Z.; Hussain, A.; Hassan, U.; Rabnawaz, A.; Ahmed, I.; Green, I.R. Fruit Peels: Food Waste as a Valuable Source of Bioactive Natural Products for Drug Discovery. Curr. Issues Mol. Biol. 2022, 44, 1960–1994. [Google Scholar] [CrossRef]
  5. Kumar, H.; Bhardwaj, K.; Sharma, R.; Nepovimova, E.; Kuča, K.; Dhanjal, D.S.; Verma, R.; Bhardwaj, P.; Sharma, S.; Kumar, D. Fruit and Vegetable Peels: Utilization of High Value Horticultural Waste in Novel Industrial Applications. Molecules 2020, 25, 2812. [Google Scholar] [CrossRef] [PubMed]
  6. Wu, Z.; Soh, T.; Chan, J.J.; Meng, S.; Meyer, D.; Srinivasan, M.; Tay, C.Y. Repurposing of Fruit Peel Waste as a Green Reductant for Recycling of Spent Lithium-Ion Batteries. Environ. Sci. Technol. 2020, 54, 9681–9692. [Google Scholar] [CrossRef] [PubMed]
  7. Calderón-Oliver, M.; López-Hernández, L.H. Food Vegetable and Fruit Waste Used in Meat Products. Food Rev. Int. 2020, 38, 628–654. [Google Scholar] [CrossRef]
  8. Abatal, M.; Lima, E.C.; Giannakoudakis, D.A.; Vargas, J.; Anastopoulos, I.; Olguin, M.T.; Alfonso, I. Pitahaya Fruit (Hylocereus spp.) Peels Evaluation for Removal of Pb(II), Cd(II), Co(II), and Ni(II) from the Waters. Sustainability 2022, 14, 1685. [Google Scholar] [CrossRef]
  9. Cavalheiro, T.R.T.; Alcoforado, R.D.O.; Silva, V.S.D.A.; Coimbra, P.P.S.; Mendes, N.D.S.; Cavalcanti, E.D.C.; Jurelevicius, D.D.A.; Gonçalves, C.B.D.A. The Impact of Organic Fertilizer Produced with Vegetable Residues in Lettuce (Lactuca sativa L.) Cultivation and Antioxidant Activity. Sustainability 2021, 13, 128. [Google Scholar] [CrossRef]
  10. O’Hara, I.M. The sugarcane industry, biofuel, and bioproduct perspectives. Sugarcane Based Biofuels Bioprod. 2013, 14, 1–22. [Google Scholar] [CrossRef]
  11. Kumar, P.; Eid, E.M.; Taher, M.A.; El-Morsy, M.H.E.; Osman, H.E.M.; Al-Bakre, D.A.; Adelodun, B.; Fayssal, S.A.; Goala, M.; Mioč, B.; et al. Biotransforming the Spent Substrate of Shiitake Mushroom (Lentinula edodes Berk.): A Synergistic Approach to Biogas Production and Tomato (Solanum lycopersicum L.) Fertilization. Horticulturae 2022, 8, 479. [Google Scholar] [CrossRef]
  12. Mozhiarasi, V.; Weichgrebe, D.; Srinivasan, S.V. Enhancement of Methane Production from Vegetable, Fruit and Flower Market Wastes Using Extrusion as Pretreatment and Kinetic Modeling. Water Air Soil Pollut. 2020, 231, 126. [Google Scholar] [CrossRef]
  13. Ambaye, T.G.; Rene, E.R.; Dupont, C.; Wongrod, S.; Van Hullebusch, E.D. Anaerobic Digestion of Fruit Waste Mixed With Sewage Sludge Digestate Biochar: Influence on Biomethane Production. Front. Energy Res. 2020, 8, 31. [Google Scholar] [CrossRef]
  14. Dos Santos, L.A.; Valença, R.B.; da Silva, L.C.S.; Holanda, S.H.D.B.; da Silva, A.F.V.; Jucá, J.F.T.; Santos, A.F.M.S. Methane generation potential through anaerobic digestion of fruit waste. J. Clean. Prod. 2020, 256, 120389. [Google Scholar] [CrossRef]
  15. Rani, D.; Nand, K. Ensilage of pineapple processing waste for methane generation. Waste Manag. 2004, 24, 523–528. [Google Scholar] [CrossRef]
  16. Ofomatah, A.C.; Ugwu, E.K.; Ani, J.U. Biogas Production and Storage from Pig Dung Co-Digested With Pineapple Peel. IOP Conf. Ser. Earth Environ. Sci. 2021, 730, 012004. [Google Scholar] [CrossRef]
  17. Jain, K.; Suryawanshi, P.; Chaudhari, A. Recovery of Acerbic Anaerobic Digester for Biogas Production from Pomegranate Shells Using Organic Loading Approach. Indian J. Biochem. Biophys. 2020, 57, 86–94. [Google Scholar]
  18. Liu, S.Y.; Charles, W.; Ho, G.; Cord-Ruwisch, R.; Cheng, K.Y. Bioelectrochemical enhancement of anaerobic digestion: Comparing single- and two-chamber reactor configurations at thermophilic conditions. Bioresour. Technol. 2017, 245, 1168–1175. [Google Scholar] [CrossRef]
  19. Prajapati, K.B.; Singh, R. Enhancement of biogas production in bio-electrochemical digester from agricultural waste mixed with wastewater. Renew. Energy 2020, 146, 460–468. [Google Scholar] [CrossRef]
  20. Kumar, P.; Kumar, V.; Singh, J.; Kumar, P. Electrokinetic assisted anaerobic digestion of spent mushroom substrate supplemented with sugar mill wastewater for enhanced biogas production. Renew. Energy 2021, 179, 418–426. [Google Scholar] [CrossRef]
  21. Latimer, G.W. Official Methods of Analysis of AOAC International, 21st ed. 2019. Available online: https://www.aoac.org/official-methods-of-analysis-21st-edition-2019/ (accessed on 4 July 2022).
  22. Walkley, A.; Black, I.A. An examination of the Degtjareff method for determining soil organic matter, and a proposed modification of the chromic acid titration method. Soil Sci. 1934, 37, 29–38. [Google Scholar] [CrossRef]
  23. Sáez-Plaza, P.; Navas, M.J.; Wybraniec, S.; Michałowski, T.; Asuero, A.G. An Overview of the Kjeldahl Method of Nitrogen Determination. Part II. Sample Preparation, Working Scale, Instrumental Finish, and Quality Control. Crit. Rev. Anal. Chem. 2013, 43, 224–272. [Google Scholar] [CrossRef]
  24. Laferrriere, J.E. CRC Handbook of Proximate Analysis Tables of Higher Plants; CRC Press: Boca Raton, FL, USA, 1987; Volume 7. [Google Scholar]
  25. Kumar, V.; Kumar, P.; Kumar, P.; Singh, J. Anaerobic Digestion of Azolla pinnata Biomass Grown in Integrated Industrial Effluent for Enhanced Biogas Production and COD Reduction: Optimization and Kinetics Studies. Environ. Technol. Innov. 2020, 17, 100627. [Google Scholar] [CrossRef]
  26. Kumar, V.; Singh, J.; Nadeem, M.; Kumar, P.; Pathak, V.V. Experimental and Kinetics Studies for Biogas Production Using Water Hyacinth (Eichhornia crassipes [Mart.] Solms) and Sugar Mill Effluent. Waste Biomass Valorization 2020, 11, 109–119. [Google Scholar] [CrossRef]
  27. Sharma, K.; Garg, V.K. Biogas from Wastes: Processes and Applications. In Sustainable Resource Recovery and Zero Waste Approaches; Elsevier B.V.: Amsterdam, The Netherlands, 2019; ISBN 9780444642004. [Google Scholar]
  28. Fayssal, S.A.; El Sebaaly, Z.; Alsanad, M.A.; Najjar, R.; Böhme, M.; Yordanova, M.H.; Sassine, Y.N. Combined effect of olive pruning residues and spent coffee grounds on Pleurotus ostreatus production, composition, and nutritional value. PLoS ONE 2021, 16, e0255794. [Google Scholar] [CrossRef] [PubMed]
  29. Movasaghi, Z.; Rehman, S.; Rehman, I.U. Fourier Transform Infrared (FTIR) Spectroscopy of Biological Tissues. Appl. Spectrosc. Rev. 2008, 43, 134–179. [Google Scholar] [CrossRef]
  30. Moţ, A.C.; Silaghi-Dumitrescu, R.; Sârbu, C. Rapid and effective evaluation of the antioxidant capacity of propolis extracts using DPPH bleaching kinetic profiles, FT-IR and UV–vis spectroscopic data. J. Food Compos. Anal. 2011, 24, 516–522. [Google Scholar] [CrossRef]
  31. Socrates, G. Infrared and Raman Characteristic Group Frequencies. Tables and Charts; John Wiley & Sons: Hoboken, NJ, USA, 2004; Volume 35. [Google Scholar]
  32. Awe, O.W.; Zhao, Y.; Nzihou, A.; Minh, D.P.; Lyczko, N. A Review of Biogas Utilisation, Purification and Upgrading Technologies. Waste Biomass Valorization 2017, 8, 267–283. [Google Scholar] [CrossRef]
  33. Bouallagui, H.; ben Cheikh, R.; Marouani, L.; Hamdi, M. Mesophilic biogas production from fruit and vegetable waste in a tubular digester. Bioresour. Technol. 2003, 86, 85–89. [Google Scholar] [CrossRef]
  34. Ariyanto, T.; Cahyono, R.B.; Vente, A.; Mattheij, S.; Millati, R.; Sarto, S.; Taherzadeh, M.; Syamsiah, S. Utilization of Fruit Waste as Biogas Plant Feed and its Superiority Compared to Landfill. Int. J. Technol. 2017, 8, 1385. [Google Scholar] [CrossRef]
  35. Silva, A.; DOS Santos, L.A.; Valença, R.; Porto, T.; Sobrinho, M.D.M.; Gomes, G.; Jucá, J.F.T.; Santos, A.F.M.S. Cellulase production to obtain biogas from passion fruit (Passiflora edulis) peel waste hydrolysate. J. Environ. Chem. Eng. 2019, 7, 103510. [Google Scholar] [CrossRef]
  36. Singh, R.; Singh, D.; Baksh, H. Performance of Different Genotypes of Radish (Raphanus sativus L.). J. Agric. Search 2021, 8, 338–341. [Google Scholar] [CrossRef]
  37. Lee, M.E.; Steiman, M.W.; Angelo, S.K.S. Biogas digestate as a renewable fertilizer: Effects of digestate application on crop growth and nutrient composition. Renew. Agric. Food Syst. 2021, 36, 173–181. [Google Scholar] [CrossRef]
  38. Przygocka-Cyna, K.; Grzebisz, W. Effect of biofertilizer amendments on the concentration of elements in edible parts of radish and green bean grown in a cropping sequence. J. Elem. 2018, 23, 69–83. [Google Scholar] [CrossRef]
Figure 1. Experimental steps adopted for biogas production from fruit peel wastes (PA: pineapple; SL: sweet lemon; KN: kinnow; PG: pomegranate) and radish cultivation.
Sustainability 14 10224 g001
Figure 2. FTIR spectra of fruit peel waste (PA: pineapple; SL: sweet lemon; KN: kinnow; PG: pomegranate).
Sustainability 14 10224 g002
Figure 3. Removal efficiency (%) of fruit peel waste-based slurry parameter after biogas production experiments (PA: pineapple; SL: sweet lemon; KN: kinnow; PG: pomegranate; EAR: electro-assisted anaerobic reactor; CAR: conventional anaerobic reactor).
Sustainability 14 10224 g003
Figure 4. Time course experimental (symbol) and modified Gompertz model predicted (lines) biogas production from selected fruit peel waste in (a) conventional and (b) electro-assisted anaerobic reactor (PA: pineapple; SL: sweet lemon; KN: kinnow; PG: pomegranate; P: predicted).
Sustainability 14 10224 g004
Table 1. Properties of cow dung inoculum and fruit peel waste used in this study.
PropertiesCow Dung (CD)Fruit Peel Wastes
Pineapple (PA)Sweet Lemon (SL)Kinnow (KN)Pomegranate (PG)
pH8.10 ± 0.03 a5.83 ± 0.02 d6.17 ± 0.05 b6.02 ± 0.02 c6.13 ± 0.04 b
Electrical Conductivity (dS/m)4.82 ± 0.10 a5.08 ± 0.31 a3.70 ± 0.17 d4.10 ± 0.09 cd4.46 ± 0.12 c
Moisture Content (%)56.80 ± 2.52 a62.38 ± 3.10 ab74.19 ± 1.85 c68.02 ± 4.30 b59.07 ± 2.90 a
Organic Carbon (%)20.63 ± 1.20 a36.70 ± 0.60 d28.01 ± 1.23 bc25.92 ± 0.75 b31.35 ± 1.02 cd
Total Nitrogen (%)0.70 ± 0.02 a1.36 ± 0.05 d1.02 ± 0.01 c0.86 ± 0.03 b1.28 ± 0.07 d
C:N Ratio29.4726.9827.4630.1324.49
Total Solids (%)7.23 ± 0.10 b12.04 ± 0.06 d8.16 ± 0.30 c4.60 ± 0.26 a10.24 ± 0.22 cd
Volatile Solids (%)9.14 ± 0.09 b16.08 ± 0.14 cd9.54 ± 0.18 c8.12 ± 0.06 a13.77 ± 0.40 c
COD (mg/L)8302.10 ± 10.53 e4283.20 ± 8.27 d3107.05 ± 21.04 b2690.81 ± 15.02 a3710.52 ± 9.15 c
Cellulose (%)4.90 ± 0.08 a13.56 ± 0.14 d9.10 ± 0.23 bc8.35 ± 0.06 b9.90 ± 0.08 c
Hemicellulose (%)3.05 ± 0.02 a7.15 ± 0.06 e5.10 ± 0.04 d3.77 ± 0.02 b4.14 ± 0.05 c
Lignin (%)6.10 ± 0.04 b12.75 ± 0.12 d8.24 ± 0.08 c5.09 ± 0.11 a8.53 ± 0.26 c
Reducing Sugars (g/L)42.60 ± 3.73 a121.61 ± 2.90 d89.10 ± 2.10 b81.04 ± 3.04 b105.29 ± 1.55 c
Total Ash (%)2.44 ± 0.02 a3.07 ± 0.01 d2.54 ± 0.02 b3.16 ± 0.03 d2.92 ± 0.04 c
The same letters (a–e) indicate no significant difference among different cow dung and fruit peel waste at p < 0.05.
Table 2. Changes in the fruit peel waste-based slurry parameters, before and after biogas production.
PropertiesConventional ReactorElectro-Assisted Anaerobic Reactor
PASLKNPGPASLKNPG
pHBefore6.93 ± 0.02 a7.12 ± 0.05 a7.08 ± 0.03 a7.11 ± 0.02 a6.97 ± 0.06 a7.14 ± 0.02 a7.06 ± 0.6 a7.12 ± 0.03 a
After5.28 ± 0.04 b5.83 ± 0.03 b5.91 ± 0.05 b5.49 ± 0.04 b5.10 ± 0.02 b5.62 ± 0.04 b5.80 ± 0.08 b5.38 ± 0.06 b
EC (dS/m)Before4.96 ± 0.05 a4.28 ± 0.06 a4.45 ± 0.04 a4.64 ± 0.03 a4.95 ± 0.04 a4.26 ± 0.07 a4.46 ± 0.05 a4.64 ± 0.05 a
After3.56 ± 0.02 b3.37 ± 0.03 b3.65 ± 0.05 b3.40 ± 0.06 b3.24 ± 0.8 b3.17 ± 0.04 b3.67 ± 0.03 b3.15 ± 0.04 b
OC (%)Before28.08 ± 1.42 a24.10 ± 1.80 a23.25 ± 0.96 a26.02 ± 0.18 a28.67 ± 1.27 a24.32 ± 1.93 a23.28 ± 1.02 a25.99 ± 0.26 a
After17.10 ± 2.70 b17.64 ± 2.15 b19.02 ± 1.68 b17.51 ± 0.93 b14.49 ± 0.62 b15.92 ± 2.18 b17.24 ± 1.40 b15.82 ± 1.01 b
TN (%)Before1.03 ± 0.03 a0.86 ± 0.02 a0.79 ± 0.04 a0.98 ± 0.05 a1.03 ± 0.02 a0.86 ± 0.03 a0.78 ± 0.06 a0.99 ± 0.03 a
After0.79 ± 0.02 b0.74 ± 0.03 b0.71 ± 0.05 b0.76 ± 0.07 b0.75 ± 0.04 b0.72 ± 0.04 b0.67 ± 0.02 b0.74 ± 0.05 b
TS (%)Before9.65 ± 0.08 a7.70 ± 0.05 a5.91 ± 0.06 a8.76 ± 0.08 a9.64 ± 0.51 a7.70 ± 0.06 a5.92 ± 0.08 a8.74 ± 0.08 a
After5.12 ± 0.10 b5.30 ± 0.04 b4.54 ± 0.12 b5.82 ± 0.094.61 ± 0.13 b5.10 ± 0.05 b4.20 ± 0.16 b5.06 ± 0.14 b
VS (%)Before12.60 ± 0.18 a9.32 ± 0.08 a8.64 ± 0.09 a11.41 ± 0.15 a12.61 ± 0.17 a9.34 ± 0.09 a8.63 ± 0.10 a11.46 ± 0.23 a
After5.70 ± 0.20 b5.68 ± 0.13 b5.45 ± 0.17 b5.93 ± 0.24 b5.01 ± 0.20 b4.95 ± 0.15 b4.80 ± 0.27 b5.58 ± 0.16 b
COD (mg/L)Before6210.27 ± 12.09 a5710.50 ± 36.24 a5491.29 ± 28.04 a6014.07 ± 30.11 a6292.65 ± 17.38 a5704.58 ± 28.10 a5496.46 ± 21.09 a6006.31 ± 27.20 a
After2208.61 ± 9.18 b3325.50 ± 15.02 b3410.18 ± 11.46 b2874.05 ± 8.90 b1730.13 ± 20.55 b2777.06 ± 18.07 b2845.10 ± 9.74 b2010.26 ± 12.04 b
Cellulose (%)Before9.24 ± 0.07 a7.01 ± 0.08 a6.63 ± 0.04 a7.39 ± 0.06 a9.23 ± 0.07 a7.00 ± 0.09 a 6.63 ± 0.05 a7.40 ± 0.07 a
After7.40 ± 0.16 b5.90 ± 0.20 b6.05 ± 0.09 b6.21 ± 0.03 b7.16 ± 0.18 b5.75 ± 0.21 b5.66 ± 0.10 b5.93 ± 0.02 b
Hemicellulose (%)Before5.10 ± 0.04 a4.09 ± 0.05 a3.40 ± 0.03 a3.62 ± 0.02 a5.10 ± 0.03 a4.08 ± 0.07 a3.41 ± 0.04 a3.60 ± 0.06 a
After3.68 ± 0.10 b3.47 ± 0.07 b2.78 ± 0.06 b2.85 ± 0.02 b3.41 ± 0.08 b3.10 ± 0.06 b2.49 ± 0.07 b2.54 ± 0.03 b
Lignin (%)Before9.40 ± 0.07 a7.16 ± 0.06 a5.59 ± 0.03 a7.33 ± 0.08 a9.43 ± 0.09 a7.17 ± 0.05 a5.60 ± 0.05 a7.32 ± 0.11 a
After5.92 ± 0.12 b5.15 ± 0.10 b4.27 ± 0.02 b5.05 ± 0.05 b5.52 ± 0.10 b4.70 ± 0.11 b3.75 ± 0.03 b4.60 ± 0.08 b
RS (g/L)Before82.10 ± 6.80 a64.90 ± 4.22 a61.84 ± 10.21 a73.92 ± 8.85 a82.11 ± 5.97 a65.85 ± 4.30 a61.82 ± 12.15 a73.95 ± 8.29 a
After22.08 ± 2.09 b31.32 ± 5.03 b34.01 ± 3.17 b28.10 ± 4.34 b14.06 ± 1.49 b20.12 ± 5.09 b26.40 ± 2.86 b19.38 ± 2.01 b
The same letters (a, b) indicate no significant difference between before and after values at p < 0.05; PA: pineapple; SL: sweet lemon; KN: kinnow; PG: pomegranate.
Table 3. Yield and biochemical composition of biogas produced from fruit peel waste-based slurry, under two different anaerobic reactors.
Biogas PropertiesConventional ReactorElectro-assisted Anaerobic Reactor
PASLKNPGPASLKNPG
Biogas Yield (mL)810.50 ± 2.54 a670.30 ± 1.90 a529.10 ± 2.10 a758.53 ± 1.52 a1422.76 ± 3.10 b979.18 ± 1.30 b860.43 ± 0.52 b1240.10 ± 0.80 b
Biogas Yield (mL/gVS)44.34 ± 1.20 c20.84 ± 0.70 a27.73 ± 0.34 b46.71 ± 1.06 c77.83 ± 2.20 d30.45 ± 1.87 b45.10 ± 0.40 c76.36 ± 1.93 d
CH4 (%)59.10 ± 0.08 a57.12 ± 0.15 a55.55 ± 0.06 a58.02 ± 0.02 a62.21 ± 0.13 b58.35 ± 0.05 b54.08 ± 0.10 b62.15 ± 0.07 b
CO2 (%)40.86 ± 0.02 a42.84 ± 0.05 a44.47 ± 0.03 a41.93 ± 0.09 a37.74 ± 0.01 b41.62 ± 0.06 b45.85 ± 0.03 b37.81 ± 0.09 b
H2S (%)0.03 ± 0.01 a0.05 ± 0.01 a0.02 ± 0.01 a0.04 ± 0.01 a0.04 ± 0.01 a0.02 ± 0.01 b0.06 ± 0.01 b0.03 ± 0.01 a
Water Vapours (%)0.01 ± 0.00 a0.01 ± 0.00 a0.01 ± 0.00 a0.01 ± 0.00 a0.01 ± 0.00 a0.01 ± 0.00 a0.01 ± 0.00 a0.01 ± 0.00 a
The same letters (a–d) indicate no significant difference between conventional and electro-assisted anaerobic reactor values at p < 0.05; PA: pineapple; SL: sweet lemon; KN: kinnow; PG: pomegranate.
Table 4. Results of modified Gompertz model fitness for predicted biogas yield, and critical kinetic parameters.
VariablesConventional ReactorElectro-Assisted Anaerobic Reactor
PASLKNPGPASLKNPG
y (mL)825.20 ± 5.28680.60 ± 4.50543.74 ± 3.08772.40 ± 6.251452.81 ± 7.901013.05 ± 3.10891.22 ± 4.361278.09 ± 2.53
P (mL)859.78738.57618.24831.651599.011105.78957.411501.15
λ (days)5.375.796.825.805.816.466.556.57
μm (mL/day)0.360.300.280.310.280.320.350.24
R20.990.990.990.990.990.990.990.99
y: predicted biogas production ± standard error; P: maximum biogas production potential; λ: lag phase; μm: specific biogas production rate; R2: coefficient of determination; PA: pineapple; SL: sweet lemon; KN: kinnow; PG: pomegranate.
Table 5. Effect of FPW digestate mixing on properties of arable soil.
PropertiesControlFPW Digestate (5% w/w Soil)
PASLKNPG
pH7.33 ± 0.02 a7.59 ± 0.03 b7.61 ± 0.04 b7.62 ± 0.02 b7.60 ± 0.02 b
Electrical Conductivity (EC: dS/m)2.12 ± 0.04 a2.28 ± 0.05 b2.28 ± 0.02 b2.30 ± 0.05 b2.28 ± 0.04 b
Organic Carbon (OC: %)1.36 ± 0.10 a2.08 ± 0.08 b2.16 ± 0.05 b2.22 ± 0.04 bc2.15 ± 0.07 b
Total Nitrogen (N: %)0.13 ± 0.02 a0.17 ± 0.01 b0.17 ± 0.01 b0.16 ± 0.03 bc0.17 ± 0.01 b
C:N Ratio10.4612.4412.9913.5912.88
Total Phosphorus (P: %)0.41 ± 0.04 a0.43 ± 0.02 a0.45 ± 0.03 a0.43 ± 0.04 a0.49 ± 0.01 b
Total Potassium (K: 0)0.23 ± 0.02 a0.24 ± 0.02 a0.27 ± 0.01 b0.26 ± 0.03 a0.25 ± 0.02 a
The same letters (a–c) indicate no significant difference between control and fruit peel waste (FPW) digestate treatment values at p < 0.05; PA: pineapple; SL: sweet lemon; KN: kinnow; PG: pomegranate.
Table 6. Effect of FPW digestate on morphological and yield attributes (mean ± SD; n = 5) of radish at maturity.
PropertiesControl (Arable Soil)FPW Digestate (5% w/w Soil)
PASLKNPG
Plant Height (above ground: cm)24.40 ± 1.20 a30.20 ± 0.73 b34.14 ± 1.04 c36.50 ± 0.82 c32.90 ± 1.10 b
Plant Spread (cm2)58.15 ± 2.75 a62.04 ± 3.03 a68.35 ± 1.18 bc70.80 ± 3.79 c65.26 ± 2.52 b
Number of Leaves12.18 ± 0.10 a14.50 ± 0.18 b16.02 ± 0.18 c16.12 ± 0.05 c15.70 ± 0.26 bc
Fresh Weight of Leaves (g/plant)130.53 ± 5.04 a145.16 ± 3.16 b154.60 ± 4.27 c158.08 ± 2.85 c150.22 ± 3.09 bc
Fruit Yield (g/plant)116.26 ± 3.29 a129.03 ± 1.70 b137.00 ± 4.02 bc140.10 ± 2.13 c132.09 ± 4.35 b
Fruit Length (cm)17.10 ± 0.05 a20.42 ± 0.13 b24.97 ± 0.09 d25.05 ± 0.15 d22.18 ± 0.20 c
The same letters (a–d) indicate no significant difference between control fruit peel waste (FPW) digestate treatment values at p < 0.05; PA: pineapple; SL: sweet lemon; KN: kinnow; PG: pomegranate.
Publisher’s Note: MDPI stays neutral with regard to jurisdictional claims in published maps and institutional affiliations.

