Article

Changes in Share Prices of Macrosector Companies on the Warsaw Stock Exchange as a Reaction to the COVID-19 Pandemic

by
Beata Bieszk-Stolorz
* and
Iwona Markowicz
Institute of Economics and Finance, University of Szczecin, 71-101 Szczecin, Poland
*
Author to whom correspondence should be addressed.
Sustainability 2022, 14(16), 10252; https://doi.org/10.3390/su141610252
Submission received: 19 June 2022 / Revised: 11 August 2022 / Accepted: 16 August 2022 / Published: 18 August 2022
(This article belongs to the Special Issue COVID-19 and the Sustainability of Global Economies)

Abstract

:
The crisis caused by the emergence of the COVID-19 pandemic had an impact on the economic situation worldwide, including the stock exchange quotations. The aim of the research is to assess the reaction to crisis situations of share prices of companies listed on the Warsaw Stock Exchange (Poland) belonging to three main macrosectors: Industry, Finance and Services. The main part of the analysis concerns the market reaction to the COVID-19 pandemic during its first wave. The study utilises the survival analysis methods, which allowed for an assessment and comparison of the situation of the three macrosectors. The duration of the decline in share prices and the recovery time were analysed. The intensity and probability of the decline and subsequent increase in share prices were also examined. The Kaplan–Meier estimator, Cox regression model and logit model were used in the study. The pandemic shocks differed significantly from shocks caused by economic crises in the past. We showed that the differences for macro-sector share price declines were statistically insignificant. For price increases, the Finance macrosector differed from the other macrosectors. The probability, intensity and odds of an increase in share prices of companies belonging to this macrosector were lower than for the other macrosectors. In addition, we compared the obtained results with the results of previous studies conducted for the period of the financial crisis in 2008–2009 and the bear market in 2011. We pointed out the differences between the crisis caused by the pandemic and the other crises.

1. Introduction

The COVID-19 pandemic that spread globally in 2019–2020 affected the socio-economic situation and the environment worldwide. The outbreak of COVID-19 slowed down gross domestic product (GDP) along with major economic sectors and indicators [1]. The impact has disrupted sustainable development. The disease significantly changed people’s way of life, caused job losses and the collapse of businesses. Thus, the pandemic has hit the global economy hard, affecting the economic performance of economies to varying degrees [2]. The mandate to use disposable masks and gloves and the indiscriminate use of disinfectants caused an increase in clinical waste [3]. The Sustainable Development Goals Report 2021 [4] indicated that the outbreak of the pandemic in 2020 severely disrupted economic activity around the world. The recession that resulted from COVID-19 was rated as the worst since the Great Depression. According to Ahmed et al. [5] (2021), COVID-19 is certainly the first sustainability crisis of the 21st century.
Due to the wide range of impacts, the pandemic has been taken into account in scientific studies from various fields [6]. The reaction to this unexpected factor was also evident in financial markets, as it affected the equity market risk of listed companies. Stock markets, as usual, were the first to react, with drop rates as much as the global financial crises of 2008 [7]. The first wave of the pandemic was smaller but triggered a larger market reaction and was the cause of share price declines in listed companies. Dias et al. [8] analysed the efficiency of the capital market in its weak form. Their analysis of selected European stock indices (BEL 20, CAC 40, DAX 30, FTSE Athex 20, IBEX 35, ISEQ, PSI 20), the US DOW JONES and the Chinese SSE from the period of the first wave of the pandemic showed that stock markets tended to overreact to data and information in the short term. These reactions may have been the result of investor uncertainty during the global epidemic. The globalisation of crises and spillovers is influenced by existing market linkages, vulnerabilities, systemic risks and flawed regulation [9]. Zaremba et al. [10] ascertained sources of financial immunity to the coronavirus pandemic. Their findings demonstrated that stock markets in countries with low unemployment rates and populated with firms with conservative investment policies and low valuations relative to expected profits tend to be more immune to the healthcare crisis. Firm government policy responses generally tend to support stock markets in times of the pandemic. However, stock markets may react differently. Aharon and Siev [11] explored the impact of government intervention to contain the spread of COVID-19 in emerging countries on the performance of their leading stock indices. Their findings show that government restrictions are associated with negative market returns, possibly due to the anticipated adverse effect on the economy. Compared to other countries, the Polish equity market has reacted particularly strongly to restrictions on internal movement between cities/regions. The abnormal returns (AR) on the announcement day of this intervention using the market model were equal to −14.28%.
The literature thematically related to our article usually deals with issues related to one sector, e.g., the tourism sector, the energy sector, etc. We did not come across an article that conducted a study of the main macrosectors of the economy and additionally compared them with each other and with previous crises. We conducted a similar study on the global financial crisis in 2008–2009 and the bear market in 2011. It seemed interesting to us to compare these two crises with the crisis caused by the COVID-19 pandemic. In the literature, the largest stock exchanges in the world are most often analysed. We undertook an analysis of companies listed on the Warsaw Stock Exchange (Poland). It is currently the largest stock exchange of financial instruments in the Central and Eastern European region and one of the best-known Polish financial institutions. This is the added value of our study.
The aim of this study is to assess the reaction of the stock market in Poland to the crisis. In the analysis, we have included companies listed on the Warsaw Stock Exchange (WSE) belonging to the three main macro-sectors: Industry, Finance and Services. We examined the decline and subsequent increase in share prices of companies from each macrosector as a reaction to the COVID-19 pandemic. It is particularly valuable to compare the situation in the three crisis periods: the health crisis (2020), the economic crisis (2008–2009) and the bear market (2011). Analyses of the economic crisis and the bear market have been carried out in previous studies. We put forward the following research hypotheses:
Hypothesis 1 (H1).
The time to decline in company share prices and the time to recover (time to increase prices) in the face of the health crisis for the analysed macrosectors was similar.
The COVID-19 pandemic is cited in the literature as a factor affecting the economies of countries. It is described as an unexpected factor, so it was difficult to predict its course and its impact on companies and households. The possible negative impact on the stock market risk of listed companies has often been highlighted. The tools introduced to overcome the pandemic, mainly isolation, caused an economic slowdown both in the sale of goods, provision of services and in the financial market. Therefore, the proposed hypothesis did not favour any of the macrosectors. In the case of recovery from the crisis period, we assumed that just like the reaction to the health crisis, the reaction to its weakening would be similar among investors interested in industrial, service and financial companies.
Hypothesis 2 (H2).
The relative intensity of the decline in share prices of the companies of individual macrosectors as a reaction to the emergence of the pandemic and the relative intensity of the increase in share prices of the companies of individual macrosectors as a reaction to the weakening of the pandemic were the same.
Hypothesis 3 (H3).
In a specific period of time, the relative risk of decline in the share prices of companies from particular macrosectors as a reaction to the crisis factor and the relative chance of increase in the share prices of companies from particular macrosectors as a recuperation of losses were equal.
H2 and H3 are the consequences of the assumptions made in H1. In general, it was assumed that the decline in prices resulting from the emergence of a hitherto unknown crisis factor, which was the spread of the SARS-CoV-2 virus, affects all listed companies, regardless of their membership in a particular macrosector. The conducted research was to allow verification of the assumed hypotheses.
The manuscript is organised as follows: Section 2 presents the literature review. In Section 3, we present the data and research methods. Section 4 presents the results of the empirical analysis. In Section 5, we present the discussion of the obtained results. The manuscript ends with conclusions.

2. Literature Review

The rapid spread of the SARS-CoV-2 virus in early 2020 was an unexpected factor affecting the socio-economic situation of countries. The primary problem then became the efficiency of health care systems combating new pathogens, such as SARS-CoV-2, worldwide [12]. Above all, the high number of infections and deaths was perceived. However, the problem was obviously related to a wide spectrum of socio-economic phenomena. Smith et al. [13] already emphasised in 2009 (subtype of the influenza A virus) that pandemic preparedness planning must balance two key policy aspects—maintaining economic activity to minimise the economic impact of a pandemic and encouraging social distancing to minimise its health impact. In 2020, we saw reductions in production, investment, international trade [14], tourism [15], business closures [16], reductions in household income and expenditure [17], increases in unemployment [18,19], and even worsening poverty [20]. According to Arriola et al. [14], the impacts of the COVID-19 pandemic on production and trade have varied across specific goods, services and trade partners. Authors write that the heterogeneity of changes in trade flows across products, sources and destinations signifies high uncertainty and adjustment costs and requires additional incentives to adopt new risk mitigation strategies. There were very large declines in trade and production in 2020. The declines were of similar depth to those at the trough of the Global Financial Crisis (GFC). However, losses were recovered more quickly, marking more of a V-shaped recovery in 2020.
The pandemic has also limited the development of a new phenomenon, the sharing economy [21]. It is emphasised that the impact of the pandemic on different sectors of the economy varied. In the USA, the three most damaged sectors were Manufacturing, Professional Services and Leisure and Hospitality [22]. The first wave of the pandemic had a major impact on the price of energy commodities and thus on the price of energy [23]. Dynamic, even revolutionary, changes in the demand for raw materials and changes in energy prices are indicated by Drzymała and Korzeniewska [24]. They explain this by the COVID-19 pandemic. This decrease and a subsequent strong increase in demand and prices were not captured by any predictive model. The authors also point to an important economic aspect that comes up in discussions in relation to the crisis (pandemic). Energy obtained directly from renewable natural resources, which can include energy obtained from wind, sun and water, is largely free and independent of a crisis situation. Investment in clean energy, which is needed by the global economy and humanity, should, therefore, be intensified. It will reduce CO2 emissions [25,26].
Actions by state governments to mitigate the impact of the COVID-19 pandemic carried some limitations. Research by Msomi, Olarewaju and Ngcobo [27] indicates a positive and significant correlation between access to and ability to use cash and the sustainability of small and medium-sized enterprises. In many cases, governments have been assisted by the adoption of austerity policies and expenditure rationalisation, involving the reallocation of resources from the public sphere [28]. It should be noted that the global problem forced the introduction of restrictions in all countries, albeit at varying levels. The most common was lockdown, i.e., the suspension of social and economic activity within a region or country. The situation was unusual and difficult. Discrepancies between public expectations and government actions (also between WHO and some countries) became apparent. Significant differences were observed in the level of risk perception across countries, social groups, companies and institutions. Obviously, when faced with a crisis, discrepancies emerge between expert risk assessment (based on statistics and probability) and public and business perception (based on experience, emotions, fears). We then speak of the phenomenon of ‘probability neglect’ [29,30]. Thus, the decisions of those in power are the result of expert analysis but also of public pressure. Such a sequence of events and decisions has been described by Kahneman [31] as the ‘availability cascade’.
The literature highlights that the pandemic has affected the equity markets of both developed and developing economies. The impact of COVID-19 depends on the nature of financial markets and the macroeconomic environment. The adverse effects of the pandemic could be severe for developing countries, where stocks are more volatile and exposed to systematic risk [32]. The research showed high volatility of share prices in the US, European countries and also in India [33]. It even considered the impact of COVID-19 on the Indian stock market as a ‘black swan event’; that is, the occurrence of a highly unanticipated event with an extremely bad impact. The authors found that the mean return of both the indices, BSE and NSE, was positive before COVID-19, but daily mean returns were negative during the pandemic, implying an adverse impact on stock returns.
Research shows the impact of the pandemic on the behaviour of market investors. It is confirmed that share prices of energy and fuel companies showed a reaction to the health crisis on the Warsaw Stock Exchange [34] and on the Bucharest Stock Exchange [35]. The authors emphasise that the deterioration of financial results and share prices of energy and fuel companies resulted from a temporary reduction in demand for energy and fuels due to pandemic restrictions and was also an effect of market investors’ behaviour. The impact of the health crisis on companies and households and the associated uncertainty caused disruption in many financial markets. Even the U.S. Treasury market showed signs of stress in March 2020 [18]. Research also focused on the corporate bond market. The stress exhibited in this market was manifested by an increase in spreads and a decrease in liquidity [36]. In general, the pandemic is regarded as a serious threat to financial markets [37,38], with most global equity markets suffering losses [39]. Research by Pardal et al. [40] show that the global pandemic had an expressive impact on the memory properties of the stock indexes of the capital markets of Central Europe. The level of financial integration is very significant in these markets, which increases the problems in the implementation of efficient portfolio diversification strategies. Chatjuthamard et al. [41] have shown that the growth in cumulative COVID-19 confirmed cases amplifies realised volatility and jumps while reducing returns.
We should note that the reaction of global financial markets to the pandemic was very strong, and stock market returns declined sharply [37]. According to the authors, COVID-19 provides a valuable opportunity to gain insights into drivers of firm value using a truly exogenous shock. Moreover, the events of the first quarter of 2020 allow observing how markets process information as the crisis unfolds. According to Albaity et al. [38], it was unsurprising that the number of COVID-19 cases led to lower bank stock returns. Ramelli and Wagner [37] also argue that the reaction of stock prices is a forecast of the economic impact of the pandemic.

3. Materials and Methods

3.1. Data

A decline in the share prices of companies appeared in Poland with each successive wave of the pandemic; however, it is emphasised that the reaction was progressively weaker. This was the result of the experience gained by investors, support from central banks and growing optimism about the prospects for eradicating the epidemic. These factors convinced investors to stay in the stock market. The first wave of the pandemic in Poland appeared in March 2020, and although it was small from the point of view of the number of cases and deaths, it caused anxiety in the stock market, which resulted in a decline in share prices. Figure 1 shows the value of the WIG index for the period January 2020–June 2021 (https://stooq.pl). The index reached its minimum on 12 March 2020. This was a decline of 37.3%. The percentage of this decline served as the required threshold of decline for all observed companies. Due to the fact that subsequent declines were smaller, it was decided to use 2020 as the observation period.
To achieve the research objective using survival analysis methods, it was necessary to determine the random variables: the time of decline and the time of increase in the prices of shares listed on the Warsaw Stock Exchange. We observed 409 companies listed on the Warsaw Stock Exchange during the research period. Some companies did not experience the required decrease or subsequent increase. Such observations were assumed to be censored. The sizes of the individual macrosectors are shown in Table 1. We assumed that:
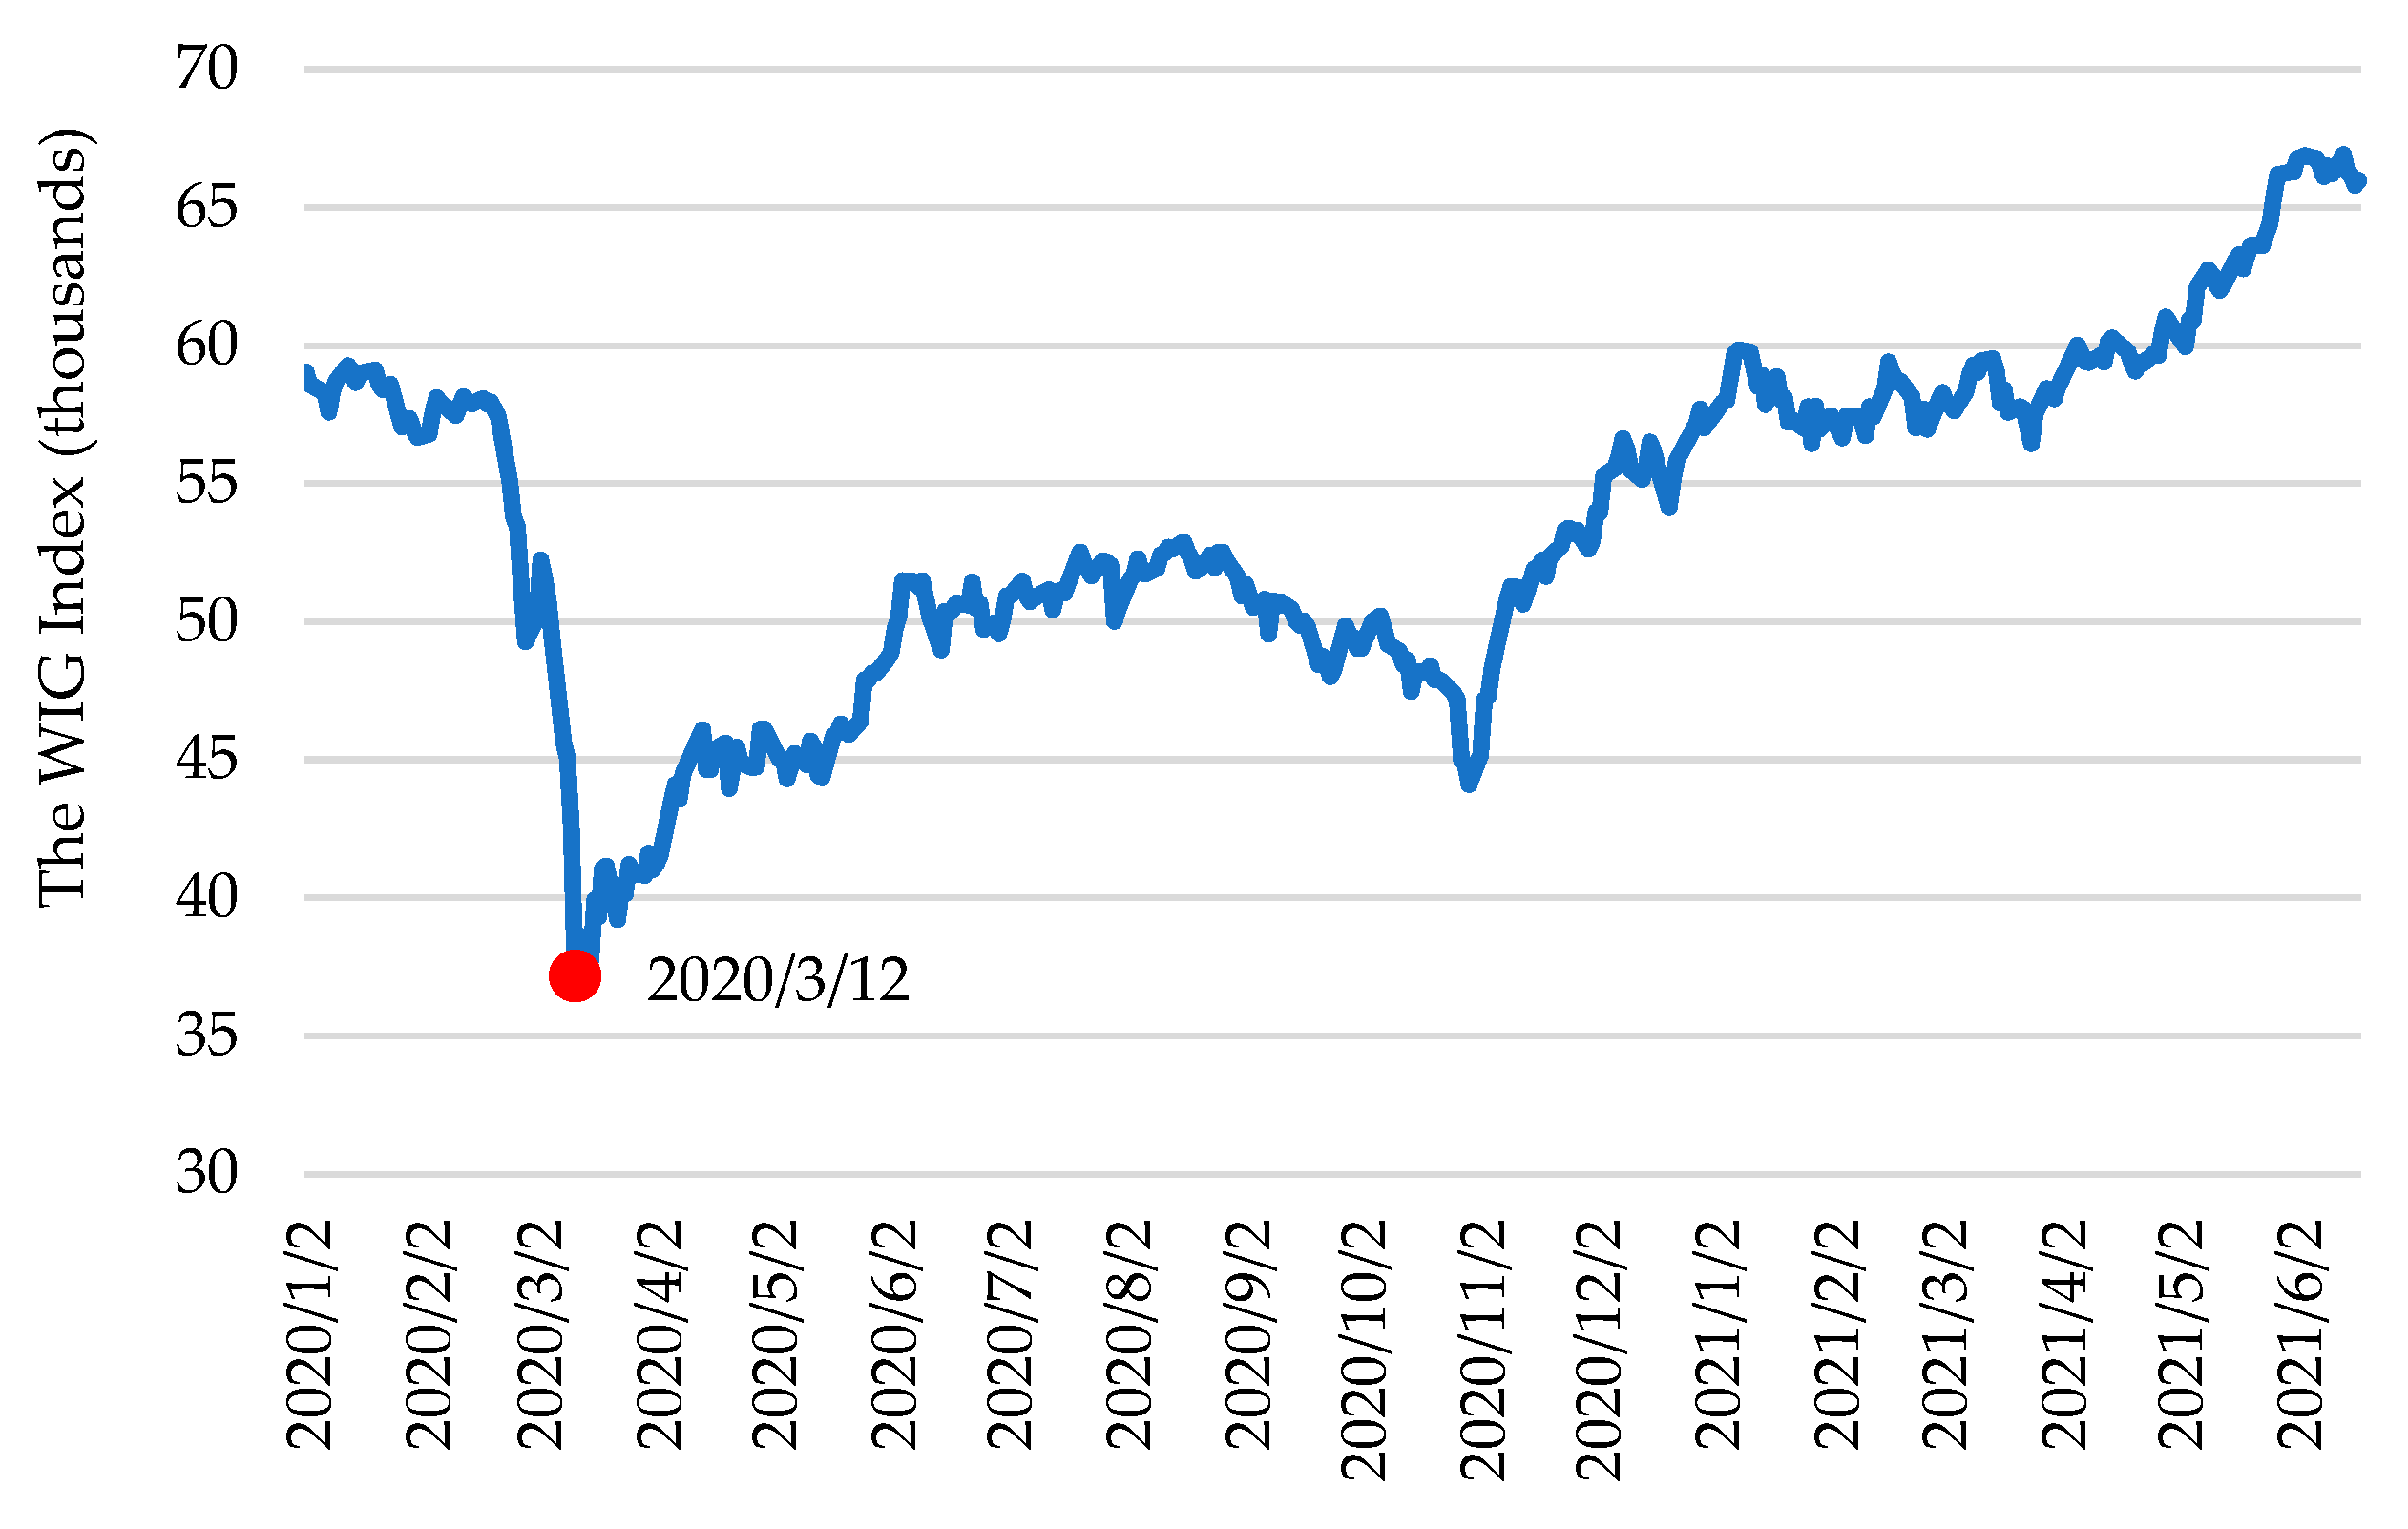
  • Time of decline: observation period Q1 2020, random variable T-time from the moment of reaching the maximum to the moment of decline by 37.3% (analogous to the decline of WIG). Companies that did not reach the decline in Q1 2020 were considered censored observations.
  • Time of increase: observation period Q2–Q4 2020, random variable T-time from the minimum achieved in 2020 to the moment of recovery (level of the maximum from the beginning of 2020). Companies that did not achieve this increase by the end of 2020 were assumed to be censored observations.
Companies were grouped into three macro sectors: Industry, Finance and Services. This division was officially used on the Warsaw Stock Exchange between 1999 and 2016. This is how all companies listed there were grouped. This method of sector classification was based on the production method. Starting with the first listing in 2017, the number of macrosectors was expanded, and there are eight of them now [42]. The current sector classification, which is in line with international standards, has been standardised for all issuers in the equity and bond markets. This division is based on an analysis of the recipients of products and services [43]. Because we wanted to relate the results of the research to our previous analyses, we were forced to use one common classification of companies. There are now more companies listed on the Warsaw Stock Exchange, and the new sectors are not reflected in the stock market of a dozen years ago. We decided to use the old macrosector classification in the current study. Ways of classifying companies into the old and new macro sectors can be found in the stock exchange publications [44].

3.2. Methodology

We use the methods of survival analysis in this study. Originally, these methods were used in demography, medicine and reliability theory. In this way, the duration of human life or the operating time of a device was analysed. Currently, they are also used in the study of the duration of socio-economic phenomena: on the real estate market [45], the duration of companies [46,47], the capital market [34,48] and the duration of trade relationships [49]. Survival time is described by a random variable T. Studies describe the duration of an individual in a particular state until an event occurs that ends the observation. Since in the analysis of the duration of socio-economic phenomena, the distribution of duration is most often unknown, non-parametric or semiparametric methods are used. The advantage of the applied methods is the possibility of using incomplete data in the study. If an event does not occur before the end of the observation, such an observation is assumed to be censored. The cumulative distribution function F(t) of random variable T describes the probability of an event occurring no later than time t. The basic function in survival analysis is the survival function described by the following formula [50]:
S ( t ) = P ( t > T ) = 1 F ( t )
where:
  • T—duration,
  • F(t)—cumulative distribution function of random variable T.
The survival function S ( t ) denotes the probability that a certain event will not occur until at least time t. In the case of an unknown duration distribution, a non-parametric model of the survival function is used. The most commonly used is the Kaplan–Meier estimator [51]:
S ^ ( t i ) = j = 1 i ( 1 d j n j )   for   i = 1 ,   2 ,   , k ,  
where:
  • ti—the point in time when at least one event occurs, t 1 < t 2 < < t k , t 0 = 0 ,
  • di—number of events in time ti,
  • ni—number of units observed in time ti, n i = n i 1 d i 1 z i 1 ,
  • zi—number of censored observations in time ti.
If the study analyses the characteristics of individuals, survival curves can be drawn for each category of these characteristics. Survival curves created in this way can be compared. There are many tests and there is no clear answer as to which tests are best. The properties of these tests under different assumptions are still a subject of open debate [52] (pp. 191–198), [53] (pp. 251–262), [54]. In general, we verify the following null hypothesis: H 0 :   S 1 ( t ) = S 2 ( t ) . The alternative hypothesis can take one of the following forms: H 1 :   S 1 ( t ) S 2 ( t ) , H 1 :   S 1 ( t ) > S 2 ( t ) or H 1 :   S 1 ( t ) < S 2 ( t ) . In the presented study, we used two of them: the Gehan generalization of the Wilcoxon test [55] and the log-rank test [56]. The first of these tests is otherwise known as the Breslow test. This test does not require the assumption of proportionality of the group event intensity function. In this test, more weight is given to the initial part of the distribution. For this reason, when the survival curves intersect at the beginning of the distribution, the power of this test decreases and the chance that different but intersecting curves will be considered similar increases. To avoid this situation, the results were checked using the log-rank test.
The second important function is the survival analysis of the hazard function h ( t ) . It describes the hazard of occurrence of an event in moment t under the condition of survival until time t [50]:
h ( t ) = lim Δ t 0 P ( t T < t + Δ t | T t ) Δ t
In practice, the relative hazard is often determined. In our study, we used for this purpose of a semiparametric Cox hazards model, given by the following equation [57]:
h ( t , X ) = h 0 ( t ) exp i = 1 n a i X i
where:
  • X = ( X 1 , X 2 , , X n ) —vector of independent variables,
  • h 0 ( t ) —baseline hazard,
  • α 1 , α 2 , , α n —model coefficients,
  • t—observation period.
In such case, parameter α i are not interpreted, but the hazard ratio is calculated by using the equation H R = exp ( α i ) . The hazard ratio assesses the hazard of the event at time t for the selected group relative to the reference group. In the case of the analysis of socio-economic phenomena, the hazard defined by Formula (3) is interpreted as the intensity of occurrence of the event. Formula (4) describes the relative intensity.
Additionally, we assessed the relative chance/risk of an event. For this purpose, we used a logit model [58]:
logit ( p ) = ln ( p 1 p ) = β 0 + i = 1 n β i X i
where:
  • p = P ( Y = 1 | X ) —conditional probability of the occurrence of an event,
  • X = ( X 1 , X 2 , , X n ) —vector of independent variables,
  • β 1 ,   β 2 ,   ,   β n —model coefficients.
In this case, we also did not interpret parameter β i , but the odds ratio is given by O R = exp ( β i ) . In this way, we determined the relative odds (chance/risk) of an event occurring at time t in the selected group compared to the reference group. When interpreting socio-economic phenomena, OR can be interpreted as the relative risk of occurrence of an event (in the case of an undesirable event) or the relative chance of occurrence of an event (in the case of a desirable event).
In this study, we used the –1–0–1 coding of variables [59]. The reference group for HR and OR is an artificial group having average hazard and average odds, respectively. This made it possible to present all three macrosectors in tables and figures.

4. Results

We conducted the study in three stages, as shown in Figure 2.
In the first stage of the study, we determined the survival curves for each macrosector for the decline and increase in prices. For this purpose, we used the Kaplan–Meier estimator given by Equation (2). The course of the survival curves indicates that in the first wave of the pandemic, the probability of a decline in share prices in all three macrosectors was similar (Figure 3). This is confirmed by the Gehan test and log-rank test statistics (Table 2) determined for the three macrosectors together as well as for each pair of macrosectors (no significance at the assumed significance level of 0.05). Figure 4 shows the Kaplan–Meier estimators for the stock price increase. Clear differences can be seen in the survival curve for the Finance macrosector compared to the Industry and Services macrosectors. These differences are confirmed by the Gehan and log-rank test statistics. The test for the three macrosectors indicates significant differences in the course of the survival curves (Table 2). The pairwise test for the macrosectors allowed for their accurate identification. The probabilities of share price increase in the companies belonging to the Services and Industry macrosectors are not significantly different from each other. In contrast, the probability of a share price increase for the Finance macrosector differs significantly from the other sectors.
Thus, we verified H1. It was partially confirmed, i.e., the time to the decline in share prices of companies in the face of the health crisis for the studied macrosectors was indeed similar (no statistically significant differences). In contrast, the time to recovery after the first wave of the pandemic for the studied macrosectors was not similar. An unfavourable situation concerns the Finance macrosector. In this case, the time to recovery of share prices was longer.
The second and third stages of the study consisted of estimating the parameters of the Cox regression model (Formula (4)) and logit model (Formula (5)). In each of the models, X is a vector of dichotomous variables describing the company’s belonging to a macro-sector (Table 3). In one model, all three variables cannot appear at the same time, as collinearity would occur. Each model was estimated with two sets of variables: X2, X3 and X1, X2. This allowed the estimation of all parameters as well as HR and OR.
In the second stage of the study, we evaluated the intensity of decline and then increase in share prices of companies belonging to the three main macrosectors. The estimates of the Cox regression model parameters are presented in Table 4. In the case of a decline in stock prices, the obtained parameters were not statistically significant, so the intensities of declines in stock prices of companies belonging to the macrosectors were similar to each other. In the case of an increase in share prices, all parameters were significant (at the assumed significance level of 0.05). This means that the intensities of share price increases were significantly different from the average: for Industry and Services, they were 29% and 21% higher, respectively, and for the Finance macrosector, 36% lower.
In Figure 5, we compiled the hazard ratios for the decline and increase in stock prices in macrosectors. Industry and Services had a higher hazard of decline and subsequent increase in share prices compared to the average. In contrast, shares belonging to the Finance macrosector had a lower decline and increased hazards than the average for all sectors. It should be emphasised here that the differences in the price decline of the macrosector shares were not statistically significant. However, it should be stated that Industry and Services are located in the ‘higher hazard of price decline-more hazard of price increase’ quadrant, while the Finance macro sector is located in the ‘lower hazard of price decline-lower hazard of price increase’ section (Figure 5, the division into quadrants is determined by the point (1;1) assigned to the mean of the macrosectors). Thus, the Finance macrosector has proven to be less sensitive to the health crisis. The response, in this case, is attenuated both during the onset of the crisis and after the crisis has ceased. In this way, we verified H2. We confirmed it partially, i.e., the relative hazard of the decline in the share prices of the companies of each macrosector as a reaction to the emergence of the health crisis was similar. In contrast, significant statistical differences concerned the relative hazard of the increase in share prices of macrosector companies as a response to the weakening of the pandemic.
The third stage of the study consisted of assessing the risk of decline and the odds of an increase in macrosector share prices over a specified period of time. For this purpose, we used a logit model. The results of the estimation of model parameters are presented in Table 5. As in the case of the Cox regression models, the model parameters for the decline in share prices were statistically insignificant but significant for a price increase. The odds for a share price increase for the macrosectors Industry and Services were higher by 46% and 37%, respectively, than the average odds determined for all macrosectors. In contrast, for the Finance macrosector, the odds of a share price increase was 50% lower than the average. In Figure 6, we juxtaposed the relative decline risk and the relative increase odds. Shares of companies belonging to the Finance macrosector had a non-significantly different relative risk of price decline, higher than the average for all sectors, and had a significantly lower odds of the price increase. The other two macrosectors had a non-significantly lower than average risk of price decline but significantly higher odds of recovery. This part of the study served to verify H3. Further, when analysing the relative risk of a fall in share prices in response to the health crisis, we found that the differences between macrosectors were not significant. On the other hand, the relative odds of the increase in share prices of the macrosector companies after the pandemic weakened differed. The odds of price increases in the Finance macrosector were significantly lower than in the other macrosectors.

5. Discussion

The shock caused by the current pandemic differs significantly from the shock caused by economic crises in the past, which were caused by global financial and fiscal problems [2]. Ten years after the end of the Global Financial Crisis (GFC) and the Great Recession, the COVID-19 pandemic caught the world by surprise [18]. In retrospect, the GFC can be explained as a consequence of the situation in the housing, mortgage and financial markets. In contrast, the COVID-19 health crisis came as a surprise. Its negative impact on demand and supply conditions turned it into a global economic and financial crisis. In order to assess the situation in Poland, we compared the results of the conducted analysis with the results of analogous studies conducted for the crisis period (2008–2009) and the bear market period (2011) [60,61]. Figure 7 and Figure 8 summarise the relative intensities and relative odds for all three crisis periods. Their analysis leads to the general conclusion that the situation of the macrosectors during the pandemic differed from their situation during the crisis and the bear market. If they were similar, the points corresponding to a given macrosector would be close to each other on the graphs. This is not the case. This is particularly evident for the macrosectors Finance and Services.
The pandemic caused by the emergence and rapid spread of the SARS-CoV-2 virus has caused many economic problems. Numerous studies point to more and less vulnerable segments of global economies. The pandemic has negatively affected stock markets in most countries [62]. Susu [35] wrote about the deterioration of the fuel and energy sector in Romania. The results of a study by Hatmanu and Cautisanu [63] showed a significant long-term negative impact of the pandemic on the Bucharest Exchange Trading index for Romania. According to Devi et al. [64], the sectors on the Indonesia Stock Exchange experiencing a decrease in the liquidity and profitability ratios were property, real estate and building construction, finance, trade, services and investment sectors. Ganie et al. [65] studied the market response in the countries most affected by the pandemic, the USA, India, Brazil, Mexico, Russia and Spain. Brazilian stock indices show the highest decline among the selected countries.
An interesting study was conducted by Honko et al. [66]. The authors found that companies listed on the Warsaw Stock Exchange did not indicate the risk caused by a pandemic in their financial statements. Insufficient disclosure of the impact of a pandemic on the financial situation of the analysed companies was demonstrated. Analysis of banks listed on the Warsaw Stock Exchange showed that large retail banks have been less affected compared to medium-sized ones with relatively rich corporate portfolios [67]. The first wave of the pandemic had an important impact on the memory properties of the main indices of the analysed financial markets [8].
According to Goldstein et al. [18], financial markets in the United States rebounded quickly. While the S&P 500 Index lost one-third of its value during the COVID-19 crash of February and March 2020, it gained all of it back by August 2020, and it has been rising ever since.
Our research indicates a similar response to the health crisis from all three macrosectors. However, during the period of recovery from the crisis, the situation of the companies in the Finance macrosector was different from that of the other companies. There appeared to be fewer opportunities and less intensity to recover losses. There are many reasons for this situation. Attention should be drawn to the negative impact of the pandemic on banks’ credit activities. Companies, in particular, were affected by the reduction or abandonment of production. A similar situation applied to consumer credits and loans. Their value declined sharply in all countries [68,69]. In Poland, interest in consumer bankruptcy increased during this period. The government’s protective measures, interest rate cuts, the level of fiscal burdens, declining interest margins, the small scale of operations and the low quality of the loan portfolio resulted in a decline in profits and profitability for the banking sector.
In February 2020, there was uncertainty, volatility and risk observed in the US financial markets. There was an abrupt decline in the equity markets, and the loss in market value was approximately 30% within a few weeks, and the sell-off speed was more than that of the Global Financial Crisis, which occurred in 2008–2009 [70]. The insurance market was also affected by the pandemic. An increase in claims in certain product ranges (credit, travel, health insurance) is highlighted.
Izzeldin et al. [71] investigated the impact of the COVID-19 financial crisis on stock markets in G7 countries and their business sectors. Country-wise, the UK and the US were the most affected, with the highest heterogeneity in their business sectors’ responses. Financial markets’ response to COVID-19 is akin to the response to previous financial crises rather than previous pandemics. Other studies indicate that many other sectors have suffered more than the financial one [72,73]. According to Gębski [74], the determination and consistency in regulatory actions counteract the effects of the pandemic crisis on the banking sector and consumer finance.
Deloitte surveyed 69 chief risk officers and training managers in twelve countries in the CEE region to provide their views and expectations on the impact of COVID-19 on the banking sector [75]. In this survey report, regional head Marton claims that being several months into an economic downturn brought by the emergence of the COVID-19 pandemic made all market players face unprecedented challenges, and this makes no exception to the banking industry. Banks are facing increasing levels of loan losses, declining interest rates, provisions and fees.
Wójcik and Ioannou [76] assessed the potential impact of a pandemic on the financial sector by comparing US sectoral stock market indices. All indices fell, but there are large differences between sectors. The largest declines (19 February to 9 April) were in the sectors: Energy (−33%) and Finance (−27%). Finance (made of banking, insurance and diversified financial firms) has been the second-most affected sector. According to Wójcik and Ioannou [76], insurance firms, particularly large ones, have been affected by the pandemic less than banks. In the short run, however, lower revenues and higher costs can be expected in the form of premiums paid to individuals and firms affected by the crisis.
According to Feyen et al. [77], the macro-financial shock caused by the COVID-19 pandemic precipitated a global economic recession and put severe pressure on financial markets and institutions around the world. Their results indicate that policy-makers in richer and more populous countries have been significantly more responsive and have taken more policy measures. The banking sector and liquidity and funding measures were introduced earlier in countries with high private debt levels.
Resti [78] discuss the main structural changes triggered by COVID-19 in banking. Direct consequences include: the impact of the lockdown on remote shopping and telework, lower cash usage and a further shift toward innovative payment methods, and the downturn suffered by the economy and bank borrowers.
According to Nisani et al. [79], the outbreak of the COVID-19 pandemic highlighted the fragile stability of the financial markets during unexpected events (as for other uncertainty events: the September 11 attacks—2001, the global financial crisis—2008).

6. Conclusions

Each crisis shows the interconnectedness of different dimensions of sustainable development—from health, well-being, social and economic prosperity to climate and ecosystems. Governments, and the international community should make structural transformations and develop common solutions guided by the Governments and the international community should make structural transformations and develop common solutions guided by the Sustainable Development Goals. The authors of The Sustainable Development Goals Report 2021 conclude that the human and economic losses caused by the COVID-19 pandemic are unprecedented and that the recovery efforts to date are uneven, inequitable and insufficiently focused on achieving sustainable development. The current crisis is increasingly undoing progress toward the Sustainable Development Goals.
To summarise the conducted research, it is possible to synthesise the conclusions regarding the health crisis (2020):
Stage 1—Kaplan–Meier estimator
  • differences in survival functions for individual macrosectors were not significant for the decline in share prices but were significant at the time of recovery,
  • the Finance macrosector was in the most difficult situation (longer duration of share price increases after the crisis factor receded).
Stage 2—Cox hazards model
  • relative hazard (intensity) of price decline—no differences between macrosectors,
  • the lowest relative hazard (intensity) of price increases was in the Finance macrosector.
Stage 3—logit model
  • risk of decline in prices at a particular time of crisis—no differences between macrosectors,
  • lowest relative chance of price increases in the post-crisis period was for the Finance macrosector.
We could say that the Finance macrosector was in the most difficult situation. The companies in this sector had the greatest difficulty in recovering from the first wave of the pandemic. Comparing the results of previous studies, it also turns out that in the earlier crisis periods (2008–2009, 2011), the situation was similar. In crisis situations, the best-performing companies are those of the Industry macrosector.
Research can allow us to understand the impact of different crisis situations, including pandemics, on the economy. The conclusions of the analysis can help investors to better cope with increased financial risks and can also help to manage similar events in the future. They will be able to adjust their portfolios quickly to these extreme risk and uncertainty conditions. Regulatory authorities such as central banks and governments during crises take different measures to mitigate their effects. The study can help to understand the differential impact of crises on macrosectors of the economy. This will allow planning of appropriate strategies and taking more effective actions. The results of this study can help policy-makers to better respond to market fluctuations. Analysing the impact of past crises on the economy can help to prepare better for future unexpected events. It is important to bear in mind that investors are always keen to learn about the nature and intensity of such adverse stock market reactions before developing an investment strategy.
We also recognise the weaknesses of the research we conducted. We only considered listed companies because of the availability of data. These are obviously large and thriving companies. In contrast, the pandemic affects all companies, including small and weak ones. The financial weakness of America’s small businesses during a pandemic is indicated, for example, by the study of Bartik et al. [80], which used survey responses. However, such a study provides information rather about the mood of entrepreneurs. We, on the other hand, wanted to investigate the exact reactions of companies’ share prices to the crisis situation.

Author Contributions

Conceptualization, B.B.-S. and I.M.; methodology, B.B.-S. and I.M.; software, B.B.-S. and I.M.; validation, B.B.-S. and I.M.; formal analysis, B.B.-S. and I.M.; investigation, B.B.-S. and I.M.; resources, B.B.-S. and I.M.; data curation, B.B.-S. and I.M.; writing—original draft preparation, B.B.-S. and I.M.; writing—review and editing, B.B.-S. and I.M.; visualization, B.B.-S. and I.M.; supervision, B.B.-S. and I.M.; project administration, B.B.-S. and I.M.; funding acquisition, B.B.-S. and I.M. All authors have read and agreed to the published version of the manuscript.

Funding

The project is financed within the framework of the program of the Minister of Science and Higher Education under the name “Regional Excellence Initiative” in the years 2019–2022; project number 001/RID/2018/19; the amount of financing PLN 10,684,000.

Institutional Review Board Statement

Not applicable.

Informed Consent Statement

Not applicable.

Data Availability Statement

All data comes from https://stooq.pl (accessed on 7 February 2022).

Conflicts of Interest

The authors declare no conflict of interest.

References

  1. Islam, M.M.; Jannat, A.; Al Rafi, D.A.; Aruga, K. Potential Economic Impacts of the COVID-19 Pandemic on South Asian Economies: A Review. World 2020, 1, 283–299. [Google Scholar] [CrossRef]
  2. Lee, C.-T.; Hu, J.-L.; Kung, M.-H. Economic Resilience in the Early Stage of the COVID-19 Pandemic: An Across-Economy Comparison. Sustainability 2022, 14, 4609. [Google Scholar] [CrossRef]
  3. Begum, H.; Alam, A.S.A.F.; Leal Filho, W.; Awang, A.H.; Ghani, A.B.A. The COVID-19 Pandemic: Are There Any Impacts on Sustainability? Sustainability 2021, 13, 11956. [Google Scholar] [CrossRef]
  4. The Sustainable Development Goals Report 2021. Available online: https://unstats.un.org/sdgs/report/2021/ (accessed on 3 June 2022).
  5. Ahmed, F.; Syed, A.A.; Kamal, M.A.; de las Nieves López-García, M.; Ramos-Requena, J.P.; Gupta, S. Assessing the Impact of COVID-19 Pandemic on the Stock and Commodity Markets Performance and Sustainability: A Comparative Analysis of South Asian Countries. Sustainability 2021, 13, 5669. [Google Scholar] [CrossRef]
  6. Liu, N.; Xu, Z.; Skare, M. The research on COVID-19 and economy from 2019 to 2020: Analysis from the perspective of bibliometrics. Oeconomia Copernic. 2021, 12, 217–268. [Google Scholar] [CrossRef]
  7. Hassan, S.M.; Riveros Gavilanes, J.M. First to React Is the Last to Forgive: Evidence from the Stock Market Impact of COVID 19. J. Risk Financ. Manag. 2021, 14, 26. [Google Scholar] [CrossRef]
  8. Dias, R.; Teixeira, N.; Machova, V.; Pardal, P.; Horak, J.; Vochozka, M. Random walks and market efficiency tests: Evidence on US, Chinese and European capital markets within the context of the global COVID-19 pandemic. Oeconomia Copernic. 2020, 11, 585–608. [Google Scholar] [CrossRef]
  9. Roszkowska, P.; Prorokowski, Ł. Model of Financial Crisis Contagion: A Survey-based Simulation by Means of the Modified Kaplan-Meier Survival Plots. Folia Oeconomica Stetin. 2014, 13, 22–55. [Google Scholar] [CrossRef]
  10. Zaremba, A.; Kizys, R.; Tzouvanas, P.; Aharon, D.Y.; Demir, E. The quest for multidimensional financial immunity to the COVID-19 pandemic: Evidence from international stock markets. J. Int. Financ. Mark. Inst. Money 2021, 71, 101284. [Google Scholar] [CrossRef]
  11. Aharon, D.Y.; Siev, S. COVID-19, government interventions and emerging capital markets performance. Res. Int. Bus. Financ. 2021, 58, 101492. [Google Scholar] [CrossRef]
  12. Markowicz, I.; Rudawska, I. Struggling with COVID-19—A Framework for Assessing Health System Performance. Sustainability 2021, 13, 11146. [Google Scholar] [CrossRef]
  13. Smith, R.D.; Keogh-Brown, M.R.; Barnett, T.; Tait, J. The economy-wide impact of pandemic influenza on the UK: A computable general equilibrium modelling experiment. BMJ-Br. Med. J. 2009, 339, b4571. [Google Scholar] [CrossRef] [PubMed]
  14. Arriola, K.; Kowalski, P.; van Tongeren, F. The impact of COVID-19 on the directions and structure of international trade. OECD Trade Policy Pap. 2021, 252. [Google Scholar] [CrossRef]
  15. Jones, L.; Palumbo, D.; Brown, D. Coronavirus: How the Pandemic Has Changed the World Economy. BBC News. 24 January 2021. Available online: https://www.bbc.com/news/business-51706225 (accessed on 1 June 2022).
  16. Spiegel, M.; Tookes, H. Business restrictions and COVID-19 fatalities. Rev. Financ. Stud. 2021, 34, 5266–5308. [Google Scholar] [CrossRef]
  17. Waliszewski, K.; Warchlewska, A. Comparative analysis of Poland and selected countries in terms of household financial behaviour during the COVID-19 pandemic. Equilibrium. Q. J. Econ. Econ. Policy 2021, 16, 577–615. [Google Scholar] [CrossRef]
  18. Goldstein, I.; Koijen, R.S.J.; Mueller, H.M. COVID-19 and Its Impact on Financial Markets and the Real Economy. Rev. Financ. Stud. 2021, 34, 5135–5148. [Google Scholar] [CrossRef]
  19. Svabova, L.; Tesarova, E.N.; Durica, M.; Strakova, L. Evaluation of the impacts of the COVID-19 pandemic on the development of the unemployment rate in Slovakia: Counterfactual before-after comparison. Equilibrium. Q. J. Econ. Econ. Policy 2021, 16, 261–284. [Google Scholar] [CrossRef]
  20. Laborde, D.; Martin, W.; Swinnen, J.; Vos, R. COVID-19 Risks to Global Food Security. Science 2020, 369, 500–502. [Google Scholar] [CrossRef]
  21. Hossain, M. The effect of the COVID-19 on sharing economy activities. J. Clean. Prod. 2021, 280, 124782. [Google Scholar] [CrossRef]
  22. Barlow, J.; Vodenska, I. Socio-Economic Impact of the COVID-19 Pandemic in the U.S. Entropy 2021, 23, 673. [Google Scholar] [CrossRef]
  23. Dmytrów, K.; Landmesser, J.; Bieszk-Stolorz, B. The Connections between COVID-19 and the Energy Commodities Prices: Evidence through the Dynamic Time Warping Method. Energies 2021, 14, 4024. [Google Scholar] [CrossRef]
  24. Drzymała, A.J.; Korzeniewska, E. Impact of the Self-Consumption of Electricity on the Profitability of the Investment into a Photovoltaic Installation: The Case of a Company in Poland. Eur. Res. Stud. J. 2022, 25, 316–332. [Google Scholar]
  25. Bertram, C.; Luderer, G.; Creutzig, F.; Bauer, N.; Ueckerdt, F.; Malik, A.; Edenhofer, O. COVID-19-induced low power demand and market forces starkly reduce CO2 emissions. Nat. Clim. Change 2021, 11, 193–196. [Google Scholar] [CrossRef]
  26. Whitehouse Associates. BP Statistical Review of World Energy, 71st ed.; Whitehouse Associates: London, UK, 2022. [Google Scholar]
  27. Msomi, T.S.; Olarewaju, O.M.; Ngcobo, X. Sustaining South African small and medium-sized enterprises through monetary access and Literacy in the COVID-19 ERA. Folia Oeconomica Stetin. 2021, 21, 57–75. [Google Scholar] [CrossRef]
  28. Fatih, C. What can SVAR models tell us about the impact of Public Expenditure Shocks on macroeconomic variables in Algeria? A Slight Hint to the COVID-19 Pandemic. Folia Oeconomica Stetin. 2021, 21, 21–37. [Google Scholar] [CrossRef]
  29. Sunstein, C.R.; Zeckhauser, R. Overreaction to Fearsome Risks, Public Law and Legal Theory Working Paper. 2008. Available online: https://chicagounbound.uchicago.edu/public_law_and_legal_theory/219/ (accessed on 25 May 2022).
  30. Martofel, A. Analysis of Governmental and International Responses to The SARS-CoV-2 Pandemic. Almanach 2020, 15, 48–53. [Google Scholar]
  31. Kahneman, D. Thinking, Fast and Slow; Farrar, Straus and Giroux: New York, NY, USA, 2011. [Google Scholar]
  32. Farooq, U.; Nasir, A.; Bilal; Bashir, M.F. The COVID-19 pandemic and stock market performance of transportation and travel services firms: A cross-country study. Econ. Res.-Ekon. Istraz. 2022. [Google Scholar] [CrossRef]
  33. Bora, D.; Basistha, D. The outbreak of COVID-19 pandemic and its impact on stock market volatility: Evidence from a worst-affected economy. J. Public Aff. 2021, 21, e2623. [Google Scholar] [CrossRef]
  34. Bieszk-Stolorz, B.; Markowicz, I. Decline in Share Prices of Energy and Fuel Companies on the Warsaw Stock Exchange as a Reaction to the COVID-19 Pandemic. Energies 2021, 14, 5412. [Google Scholar] [CrossRef]
  35. Susu, S. The impact of the COVID-19 pandemic on the financial performance and price of the shares of the energy and fuel companies listed on the main segment of the Bucharest Stock Exchange. USV Ann. Econ. Public Adm. 2021, 21, 27–36. [Google Scholar]
  36. Haddad, V.; Moreira, A.; Muir, T. When selling becomes viral: Disruptions in debt markets in the COVID-19 crisis and the Fed’s response. Rev. Financ. Stud. 2021, 34, 5309–5351. [Google Scholar] [CrossRef]
  37. Ramelli, S.; Wagner, A.F. Feverish Stock Price Reactions to COVID-19. Rev. Corp. Financ. Stud. 2020, 9, 622–655. [Google Scholar] [CrossRef]
  38. Albaity, M.; Mallek, R.S.; Mustafa, H. Bank Stock Return Reactions to the COVID-19 Pandemic: The Role of Investor Sentiment in MENA Countries. Risks 2022, 10, 43. [Google Scholar] [CrossRef]
  39. Lyócsa, Š.; Baumöhl, E.; Výrost, E.; Molnár, P. Fear of the coronavirus and the stock markets. Financ. Res. Lett. 2020, 36, 101735. [Google Scholar] [CrossRef] [PubMed]
  40. Pardal, P.; Dias, R.; Šuleř, P.; Teixeira, N.; Krulický, T. Integration in Central European capital markets in the context of the global COVID-19 pandemic. Equilibrium. Q. J. Econ. Econ. Policy 2020, 15, 627–650. [Google Scholar] [CrossRef]
  41. Chatjuthamard, P.; Jindahra, P.; Sarajoti, P.; Treepongkaruna, S. The effect of COVID-19 on the global stock market. Account. Finance 2021, 61, 4923–4953. [Google Scholar] [CrossRef]
  42. Available online: https://www.gpw.pl/pub/GPW/STATIC/files/29.12.16_kom4.pdf (accessed on 26 May 2022).
  43. Available online: https://prnews.pl/gpw-oglasza-nowa-klasyfikacje-sektorowa-emitentow-361758 (accessed on 29 May 2022).
  44. Available online: https://www.gpw.pl/biblioteka-gpw-lista?gpwlc_id=10 (accessed on 25 May 2022).
  45. Foryś, I. The Cox Proportional Hazards Model in the Analysis of Property Transactions. Folia Oeconomica Stetin. 2010, 8, 71–81. [Google Scholar] [CrossRef]
  46. Markowicz, I. Duration Analysis of Firms—Cohort Tables and Hazard Function. Int. J. Bus. Soc. Res. 2015, 5, 36–47. [Google Scholar] [CrossRef]
  47. Urbańczyk, D.M. Competing Risks Models for an Enterprises Duration on the Market. Folia Oeconomica Stetin. 2020, 20, 456–473. [Google Scholar] [CrossRef]
  48. Bieszk-Stolorz, B.; Dmytrów, K. Evaluation of Changes on World Stock Exchanges in Connection with the SARS-CoV-2 Pandemic. Survival Analysis Methods. Risks 2021, 9, 121. [Google Scholar] [CrossRef]
  49. Markowicz, I.; Baran, P. Duration of Trade Relationships of Polish Enterprises on the Intra-Community Market: The Case of Vehicles and Automotive Parts Trade. Sustainability 2022, 14, 3599. [Google Scholar] [CrossRef]
  50. Kleinbaum, D.G.; Klein, M. Survival Analysis. A Self-Learning Text, 3rd ed.; Springer: New York, NY, USA, 2012. [Google Scholar] [CrossRef]
  51. Kaplan, E.L.; Meier, P. Nonparametric estimation from incomplete observations. J. Am. Stat. Assoc. 1958, 53, 457–481. [Google Scholar] [CrossRef]
  52. Klein, J.; Moeschberger, M. Survival Analysis. Techniques for Censored and Truncated Data; Springer: New York, NY, USA, 1997. [Google Scholar]
  53. Suciu, G.P.; Lemeshow, S.; Moeschberger, M. Statistical Tests of the Equality of Survival Curves: Reconsidering the Option. In Advances in Survival Analysis; Balakrishnan, N., Rao, C.R., Eds.; Elsevier: Amsterdam, The Netherlands, 2003; pp. 251–262. [Google Scholar] [CrossRef]
  54. Karadeniz, P.G.; Ercan, I. Examining Tests for Comparing Survival Curves with Right Censored Data. Stat. Transit. 2017, 18, 311–328. [Google Scholar] [CrossRef]
  55. Lee, E.T.; Desu, M.M.; Gehan, E.A. A Monte Carlo Study of the Power of Some Two sample Tests. Biometrika 1975, 62, 425–432. [Google Scholar] [CrossRef]
  56. Bland, J.M.; Altman, D.G. The logrank test. BMJ-Br. Med. J. 2004, 328, 1073. [Google Scholar] [CrossRef]
  57. Cox, D.R. Regression Models and Life-Tables. J. R. Stat. Soc. Series B Stat. Methodol. 1972, 34, 187–220. [Google Scholar] [CrossRef]
  58. Kleinbaum, D.G.; Klein, M. Logistic Regression. A Self-Learning Text, 3rd ed.; Springer: New York, NY, USA, 2010. [Google Scholar] [CrossRef]
  59. Bieszk-Stolorz, B.; Markowicz, I. The Influence of Variable Coding on the Interpretation of the Cox Proportional Hazards Model Parameters. In Proceedings of the 37th International Business Information Management Association (IBIMA), Cordoba, Spain, 1–2 April 2021; pp. 3329–3339. [Google Scholar]
  60. Bieszk-Stolorz, B.; Markowicz, I. The Assessment of the Situation of Listed Companies in Macrosectors in a Bear Market— Duration Analysis Models. In Proceedings of the Applications of Mathematics and Statistics in Economics. International Scientific Conference, Szklarska Poręba, Poland, 30 August–3 September 2017; Wroclaw University of Economics and Business: Wroclaw, Poland, 2017; pp. 17–26. [Google Scholar] [CrossRef]
  61. Bieszk-Stolorz, B.; Markowicz, I. Application of models of survival analysis in the assessment of the situation of macrosectors of listed companies. Optimum. Econ. Stud. 2018, 1, 3–15. [Google Scholar] [CrossRef]
  62. Kartal, M.T.; Depren, S.K.; Depren, Ö. How Main Stock Exchange Indices React to COVID-19 Pandemic: Daily Evidence from East Asian Countries. Glob. Econ. Rev. 2021, 50, 54–71. [Google Scholar] [CrossRef]
  63. Hatmanu, M.; Cautisanu, C. The Impact of COVID-19 Pandemic on Stock Market: Evidence from Romania. Int. J. Environ. Res. Public Health 2021, 18, 9315. [Google Scholar] [CrossRef]
  64. Devi, S.; Warasniasih, N.M.S.; Masdiantini, P.R.; Musmini, L.S. The Impact of COVID-19 Pandemic on the Financial Performance of Firms on the Indonesia Stock Exchange. J. Econ. Bus. Account. Ventur. 2020, 23, 226–242. [Google Scholar] [CrossRef]
  65. Ganie, I.R.; Wani, T.A.; Yadav, M.P. Impact of COVID-19 Outbreak on the Stock Market: An Evidence from Select Economies. Bus. Perspect. Res. 2022, 22785337211073635. [Google Scholar] [CrossRef]
  66. Honko, S.; Remlein, M.; Rowinska-Kral, M.; Swietla, K. Effects of COVID-19 in the Financial Statements of Selected Companies Listed in Warsaw Stock Exchange. Eur. Res. Stud. J. 2020, 23, 854–871. [Google Scholar] [CrossRef]
  67. Bernardelli, M.; Korzeb, Z.; Niedziółka, P. The banking sector as the absorber of the COVID-19 crisis? economic consequences: Perception of WSE investors. Oeconomia Copernic. 2021, 12, 335–374. [Google Scholar] [CrossRef]
  68. Ҫolak, G.; Öztekin, Ö. The Impact of COVID-19 Pandemic on Bank Lending Around the World. J. Bank. Financ. 2021, 133, 106207. [Google Scholar] [CrossRef]
  69. Özlem Dursun-de Neef, H.; Schandlbauer, A. COVID-19 and Lending Responses of European banks. J. Bank. Financ. 2021, 133, 106236. [Google Scholar] [CrossRef]
  70. Roy, S. Economic impact of COVID-19 Pandemic. Tech. Rep. 2020. Available online: https://www.researchgate.net/publication/343222400_ECONOMIC_IMPACT_OF_COVID-19_PANDEMIC (accessed on 30 May 2022).
  71. Izzeldin, M.; Muradoğlu, Y.G.; Pappas, V.; Sivaprasad, S. The Impact of COVID-19 on G7 Stock Markets Volatility: Evidence from a ST-HAR Model. Int. Rev. Financ. Anal. 2021, 74, 101671. [Google Scholar] [CrossRef]
  72. Kwan, S.H.; Merterns, M.T. Market Assessment of COVID-19. FRBDF Econ. Lett. 2020, 14, 1–5. Available online: https://www.frbsf.org/economic-research/files/el2020-14.pdf (accessed on 28 May 2022).
  73. Huayu, S.; Fu, M.; Pan, H.; Yu, Z.; Chen, Y. The impact of the COVID-19 pandemic on firm performance. Emerg. Mark. Financ. Trade 2020, 56, 2213–2230. [Google Scholar] [CrossRef]
  74. Gębski, Ł. The Impact of the Crisis Triggered by the COVID-19 Pandemic and the Actions of Regulators on the Consumer Finance Market in Poland and Other European Union Countries. Risks 2021, 9, 102. [Google Scholar] [CrossRef]
  75. Deloitte, COVID-19 CEE Banking Sector Impact Survey. First Symptoms of the Coronavirus Outbreak. 2020. Available online: https://www2.deloitte.com/cz/en/pages/covid-19/articles/covid-19-cee-banking-sector-impact-survey.html (accessed on 31 July 2022).
  76. Wójcik, D.; Ioannou, S. COVID-19 and finance: Market developments so far and potential impacts on the financial sector and centres. J. Econ. Hum. Geogr. 2020, 111, 387–400. [Google Scholar] [CrossRef]
  77. Feyen, E.; Gispert, T.A.; Kliatskova, T.; Mare, D.S. Financial Sector Policy Response to COVID-19 in Emerging Markets and Developing Economies. J. Bank. Financ. 2021, 133, 106184. [Google Scholar] [CrossRef] [PubMed]
  78. Resti, A. Did the pandemic lead to structural changes in the banking sector? In In-Depth Analysis, Requested by the ECON Committee; European Union: Maastricht, The Netherlands, 2021. [Google Scholar]
  79. Nisani, D.; Qadan, M.; Shelef, A. Risk and Uncertainty at the Outbreak of the COVID-19 Pandemic. Sustainability 2022, 14, 8527. [Google Scholar] [CrossRef]
  80. Bartik, A.W.; Bertrand, M.; Cullen, A. The impact of COVID-19 on small business outcomes and expectations. Econ. Sci. 2020, 117, 17656–17666. [Google Scholar] [CrossRef] [PubMed]
Figure 1. WIG index value for the period January 2020–June 2021 (https://stooq.pl).
Sustainability 14 10252 g001
Figure 2. Scheme of the study.
Sustainability 14 10252 g002
Figure 3. Kaplan–Meier estimators for the decline in share prices of companies in macrosectors. Source: own elaboration on the basis of data from https://stooq.pl.
Sustainability 14 10252 g003
Figure 4. Kaplan–Meier estimators for the increase in share prices of companies in macrosectors. Source: own elaboration on the basis of data from https://stooq.pl.
Sustainability 14 10252 g004
Figure 5. Map of HR decline–HR increase for the health crisis.
Sustainability 14 10252 g005
Figure 6. Map of OR decline–OR increase for the health crisis.
Sustainability 14 10252 g006
Figure 7. Map of HR decline–HR increase for the health crisis. Source: own elaboration on the basis of [61].
Sustainability 14 10252 g007
Figure 8. Map of ‘OR decline–OR increase’ for the health crisis (2020), financial crisis (2008–2009) and bear market (2011). Source: own elaboration on the basis of [60].
Sustainability 14 10252 g008
Table 1. Number of observed companies by macrosectors and full and censored observations.
ObservationsIndustryFinanceServicesTotal
Share price decline
Completed984084222
Censored833272187
Share price increase
Completed12230103255
Censored594253154
Table 2. Results of Gehan and log-rank tests for decline and increase in stock prices of companies in macrosectors.
GroupsSignificance Level
Gehan TestLog-Rank Test
Share price decline
Industry–Finance–Servicesp = 0.4320
Industry–Financep = 0.5731p = 0.5731
Industry–Servicesp = 0.9237p = 0.9237
Services–Financep = 0.5675p = 0.5675
Share price increase
Industry–Finance–Servicesp = 0.0049
Industry–Financep = 0.0004p = 0.0004
Industry–Servicesp = 0.6248p = 0.6248
Services–Financep = 0.0014p = 0.0014
Table 3. Macrosectors and the corresponding variables.
MacrosectorVariable
IndustryX1
FinanceX2
ServicesX3
Table 4. Cox regression model parameter estimates for the decline and increase in macrosector share prices.
SpecificationParameter’s EstimateChi-SquarepHR
Share price decline
Industry0.02730.08640.76881.0277
Finance−0.06940.35450.55160.9330
Services0.04210.19210.66121.0430
Share price increase
Industry0.25327.58260.00591.2881
Finance−0.442811.62750.00070.6422
Services0.18954.00160.04551.2086
Table 5. Parameter estimates of the logit model for decline and increase in macrosector share prices.
SpecificationParameter’s EstimateWald’s StatisticpOR
Share price decline
Intercept0.18112.83140.0924
Industry−0.01500.01190.91330.9851
Finance0.04200.05820.80941.0429
Services−0.02700.03610.84930.9734
Share price increase
Intercept0.351510.02890.0015
Industry0.37506.79340.00921.4550
Finance−0.688015.08900.00010.5026
Services0.31304.48360.03421.3675
Publisher’s Note: MDPI stays neutral with regard to jurisdictional claims in published maps and institutional affiliations.

