Article

A Refined Evaluation Analysis of Global Healthcare Accessibility Based on the Healthcare Accessibility Index Model and Coupling Coordination Degree Model

1
School of Health Policy & Management, Nanjing Medical University, 101 Longmian Avenue, Jiangning District, Nanjing 211166, China
2
The Affiliated Hospital of Qingdao University, 16 Jiangsu Avenue, Shinan District, Qingdao 266003, China
3
School of Public Health, Nanjing Medical University, 101 Longmian Avenue, Jiangning District, Nanjing 211166, China
4
Center for Global Health, Nanjing Medical University, 101 Longmian Avenue, Jiangning District, Nanjing 211166, China
*
Author to whom correspondence should be addressed.
Sustainability 2022, 14(16), 10280; https://doi.org/10.3390/su141610280
Submission received: 29 June 2022 / Revised: 30 July 2022 / Accepted: 2 August 2022 / Published: 18 August 2022
(This article belongs to the Special Issue Sustainable Social Development and Health Economics)

Abstract

:
Healthcare accessibility (HCA) is directly related to the general well-being of citizens, and the HCA index model is widely used in HCA evaluation. However, the evaluation results of the HCA index model are rough and potentially misleading because it cannot measure the coordination of a country’s performance across the various evaluation dimensions. This study aimed to introduce a coupling coordination degree model to remedy this defect of the HCA index model, conduct a more meticulous evaluation for the global HCA development over the past two decades, present a panorama of global HCA current status, and further contribute precise strategies to enhance global HCA development. Combining the HCA index model and the coupling coordination model, we used the Global Health Observatory (GHO) data to evaluate the development levels of HCA in 186 countries across the world from 2000 to 2018. The results showed that, first, global HCA development has shown a slow upward trend over the past two decades. Second, of the selected 60 representative countries in 2018, the HCA in 86.7% of high-income countries belonged to the optimum development type, the HCA in 73.4% of upper-middle-income countries was in the antagonism-coordination stage of the transition development category, and the HCA in 66.7% of low-income and lower-middle-income countries (LMICs) was in the inferior and worst development forms. Third, the Spearman’s correlation coefficient between HCA index and HCA coupling coordination degree was 0.787 (p < 0.001). The above results indicate that the dilemma of HCA development in LMICs lies not only in the poor healthcare resources, but also in weak ability to allocate healthcare resources effectively. As the lack of healthcare resources cannot be alleviated in a short time, LMICs ought to prioritize effective healthcare resources allocation, such as developing new basic healthcare kits adapted to low-resource setting.

1. Introduction

Healthcare accessibility (HCA) has a direct bearing on the overall well-being of citizens [1]. Understanding and evaluating HCA is complex and requires a multidimensional approach to investigate the supply and utilization of HCA [2]. A large number of scholars have made great efforts to the definition of the HCA concept and evaluation dimensions construction [2,3,4,5].
To summarize, the understanding of HCA can mainly be categorized into two levels: restricted and general understanding. Restricted HCA refers to the relative ease with which healthcare can be reached from a given location [2,4]; thus, HCA is equal to healthcare spatial accessibility [6]. General HCA refers to an adequate number and equitable distribution of medical doctors in all parts of a country, and the ability of people to access needed core health services, irrespective of their socio-economic circumstances [7,8]; thus, workforce accessibility, financial accessibility, and services accessibility are three essential dimensions that evaluate HCA [7,8,9]. Based on the restricted understanding of HCA, scholars have selected different indicators to evaluate the spatial accessibility of healthcare in low-income and lower-middle-income countries (LMICs) [10], and high-income and upper-middle-income countries (HMICs) [11,12]. Based on the general understanding of HCA, scholars have selected different indicators to evaluate the HCA from the dimensions of workforce accessibility, financial accessibility, and services accessibility in LMICs [13] and HMICs [14]. An initial evaluation of HCA at the national level has also been periodically made by the Health at a Glance: OECD Indicators [15], but it just showed how OECD member countries (a byword for the world’s richest countries) fare on some selected HCA indicators. Such studies cover just a certain country or a certain type of country, which is only a partial display of global HCA. In addition, the time span of data used in these studies is relatively small, and cannot systematically and comprehensively show the development status of global HCA.
It is critical to choose the appropriate models and methods for evaluating HCA. In the field of restricted HCA evaluation, with advancements in spatial analyses and geographic information systems, more and more sophisticated methods such as kernel density model, gravity model, gravity-based two-step floating catchment area model, and so on have emerged in healthcare spatial accessibility [16]. In the field of general HCA evaluation, fuzzy comprehensive evaluation methods [17], the healthcare quality and access index (HAQ) model [18], the composite healthcare accessibility index (CHCA) model [19], and so on are widely used. The HCA index model is the simplest and convenient one; it weights and sums the original indicator values after standardization [20]. The HCA index model can measure the HCA development level of a country or region to a certain extent, and HCA index level is often closely related to the wealth of healthcare resources of a country or region [14]. However, as scholars have noted and acknowledged, such studies are potentially misleading because a country may do well in one HCA dimension but not in the other two [20,21,22]. The HCA index value may be affected by extreme performance on a certain dimension and cannot reflect the real development level of HCA; that is, the HCA index model cannot reveal the coordination between evaluation dimensions of HCA. This means that the evaluation results of the HCA index model are coarse because they just show the overall level of HCA development.
The above literature review shows that most existing national HCA research has the following three shortcomings. First, the country coverage is limited, so comparative analysis between countries is incomplete and insufficient. Second, the time span is narrow, so the conclusion of the development trend is not robust and reliable enough. Third, the evaluation results of HCA are rough due to the inherent defects of the HCA index model.
Coupling coordination is a concept that reflects the degree of harmony between different subsystems of the main system in the development process [23]. In recent years, the coupling coordination degree model has been applied more and more in the field of ecological evaluation to measure the coordination level between ecological evaluation dimensions and ecological development level, and to reveal the ability of a country to allocate resources [23,24,25]. Workforce accessibility, financial accessibility, and services accessibility are interconnected and dependent on each other, and the degree of coordination among them possess a profound impact on HCA development [14]. We hold that although ecological evaluation and healthcare evaluation are different, ideas such as sustainable and coordinated development are common to both. In addition, based on the theoretical basis and methodology of the coupling coordination degree model itself, we believe that the coupling coordination degree model suitable for ecological evaluation could also be applied to the field of healthcare evaluation. Therefore, we introduced the coupling coordination degree to reflect the development level of HCA, in order to make up for the deficiency that traditional HCA evaluation cannot reveal the coordination between HCA evaluation dimensions.
In the present study, we aimed at combining the HCA index model and coupled coordination degree model to comprehensively evaluate the HCA in 186 countries across the world from 2000 to 2018, carrying out a refined classification of the global HCA development level, and proposing precise countermeasures for each type of HCA development to promote the development of global HCA. The analyses not only contributed to a more refined evaluation of global HCA development and showed a panoramic view of HCA development level at the international level, but also provided a new perspective and an important method for HCA evaluation: the coupling coordination degree model.

2. Materials and methods

2.1. Construction of an Evaluation Index System

Constructing a scientific and reasonable evaluation indicator system is the basis for evaluating HCA based on the general understanding of HCA and existing literature [7,8,15], and following dynamic and scientific principles for objectivity, and data availability. The current study selected the comprehensive evaluation indicators from the workforce, financial, and services dimensions (Table 1).

2.2. Determination of the Index Weight

Based on the existing literature [20,21,22], we weighted equally using a geometric average for each dimension and indicator, on the assumption that each dimension and indicator was equally crucial for citizens’ access to healthcare.

2.3. HCA Index Model

The HCA index was used to measure the development level of HCA; following Wagstaff et al. [20], the equation was constructed as follows:
H C A i n d e x = 100 3 [ f ( x ) + g ( y ) + h ( z ) ] f ( x ) = 1 2 i = 1 2 X i t g ( y ) = 1 2 j = 1 2 Y j t h ( z ) = 1 2 k = 1 2 Z k t
X i t , Y j t , Z k t represent the standardized values of the indicators in the three dimensions: workforce, financial, and services; 1 3 represents the weight of each dimension; 1 2 represents the weight of the indicators in the three dimensions; f ( x ) , g ( y ) , h ( z ) are the evaluation indices of the three dimensions in the year t . The higher the HCA index, the higher the development level of HCA. On the contrary, the development level of HCA is relatively lagging. According to the existing literature [23], the HCA index is divided into 3 stages: 0~49 is the low stage, 50~69 is the antagonism stage, and 70~100 is the high stage.

2.4. Coupling Coordination Degree Model

The coupling coordination degree reflects the development level of HCA and the interactions among the three dimensions. Based on the relevant research of Qi [23] and other scholars [24,25] combined with the research objects of this study, the coupling coordination degree model was constructed as follows:
D = C T
C = 3 f ( x ) g ( y ) h ( z ) 3 f ( x ) + g ( y ) + h ( z )
T = α f ( x ) + β g ( y ) + γ h ( z )
D represents the coupling coordination degree, D [ 0 , 1 ] ; α , β , and γ represent the weight of each dimension, that is, the importance of each dimension. In this study, we set α = β = γ = 1 3 . According to the existing literature [23], the coupling coordination degree is divided into 3 stages: 0~0.39 is the maladjustment stage, 0.40~0.69 is the sub coordination stage, and 0.70~1.00 is the coordination stage.

2.5. Data Source and Processing

The dataset for our HCA indicators was taken from the WHO’s Global Health Observatory (GHO) data repository (2021 version). This database provides over 1000 indicators on priority health topics for its 194 member countries, with the best estimates for individual indicators to allow comparisons across countries and time periods [26]. The data points are not always the same as official national estimates due to updating or revisions of data or changes to methodologies used [27].
Following Ama et al. [28], we replaced the missing data by using available data from a proximate year. For example, data for medical doctor density for Argentina in 2018 were missing, thus, we replaced the data with medical doctor density data for Argentina in 2017. After adding these 46 imputed data points to the GHO database and dropping countries with missing data on one or more of our HCA indicators, we ended up with a dataset of 14,882 data points, covering 186 countries—6 high-income countries, 53 upper-middle-income countries, 54 lower-middle-income countries, and 23 low-income countries (Table 2).
After supplementing the missing data, we standardized the original data to eliminate the inconvenience of data processing caused by a different unit of the original data. The processing method was as follows [23]:
Positive   indicators :   X i j = ( X i j M I N X j ) / ( M A X X j M I N X j ) Negative   indicators :   X i j = ( M A X X j X i j ) / ( M A X X j M I N X j )
Here, X i j represents the standardized value, and X i j is the original value; M A X X j , M I N X j are the maximum and minimum values of j indicator across different countries in year i .
All statistical analyses were done with the SPSS V.25 and 0.05 significance was used [29].

3. Results

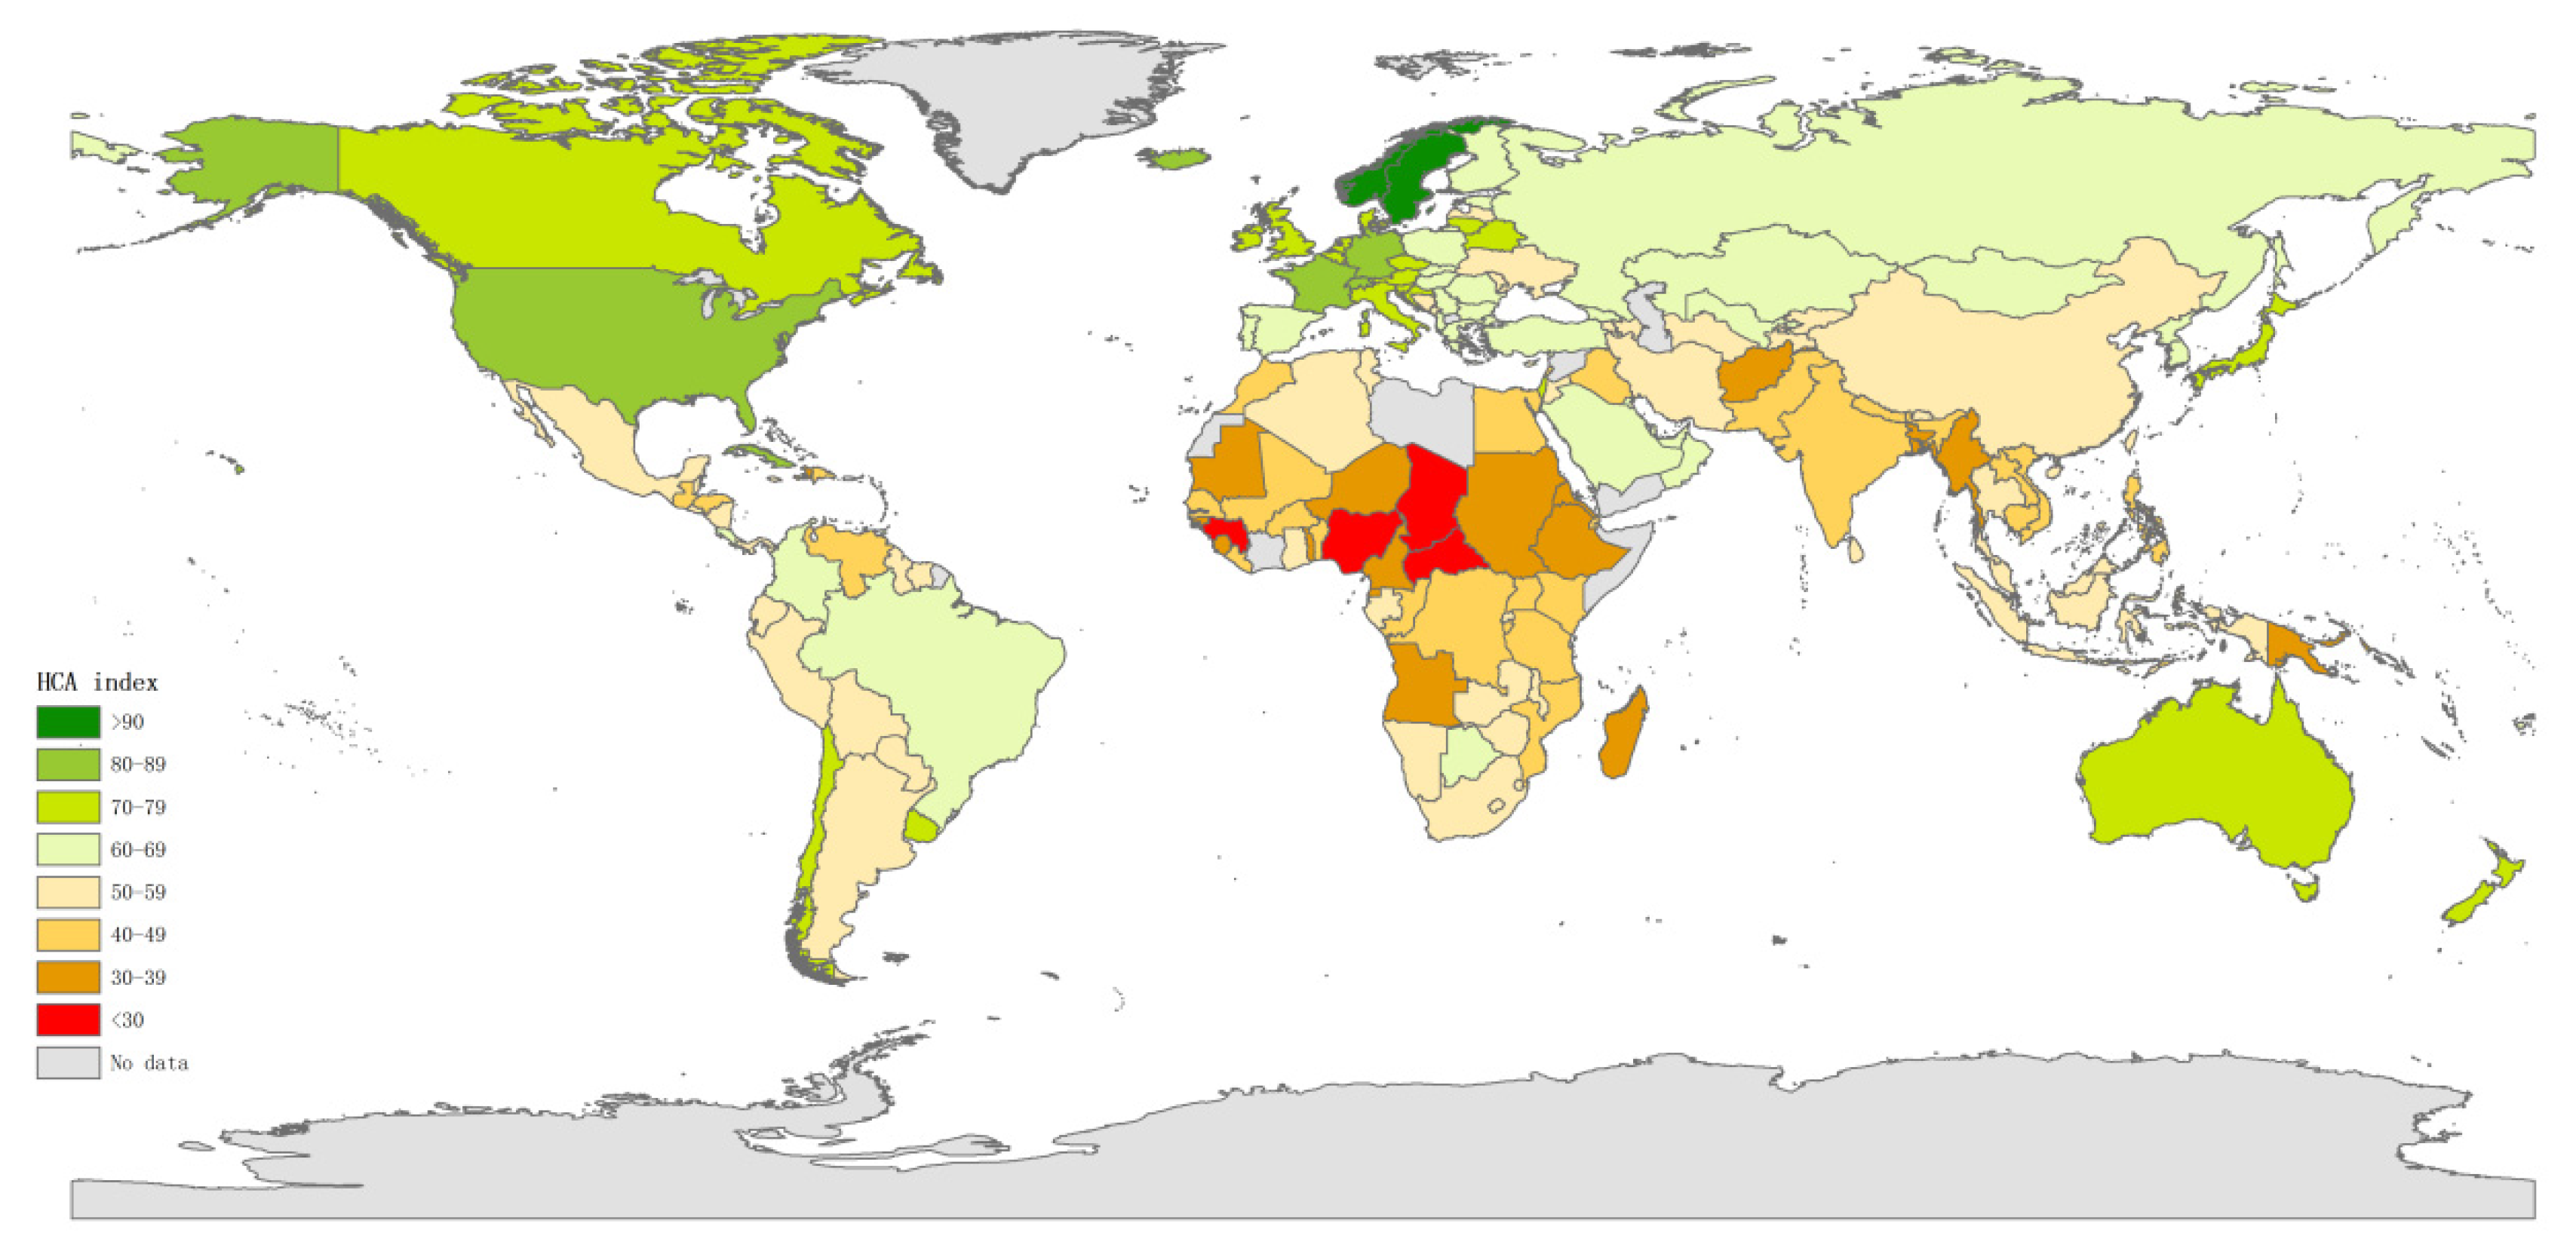
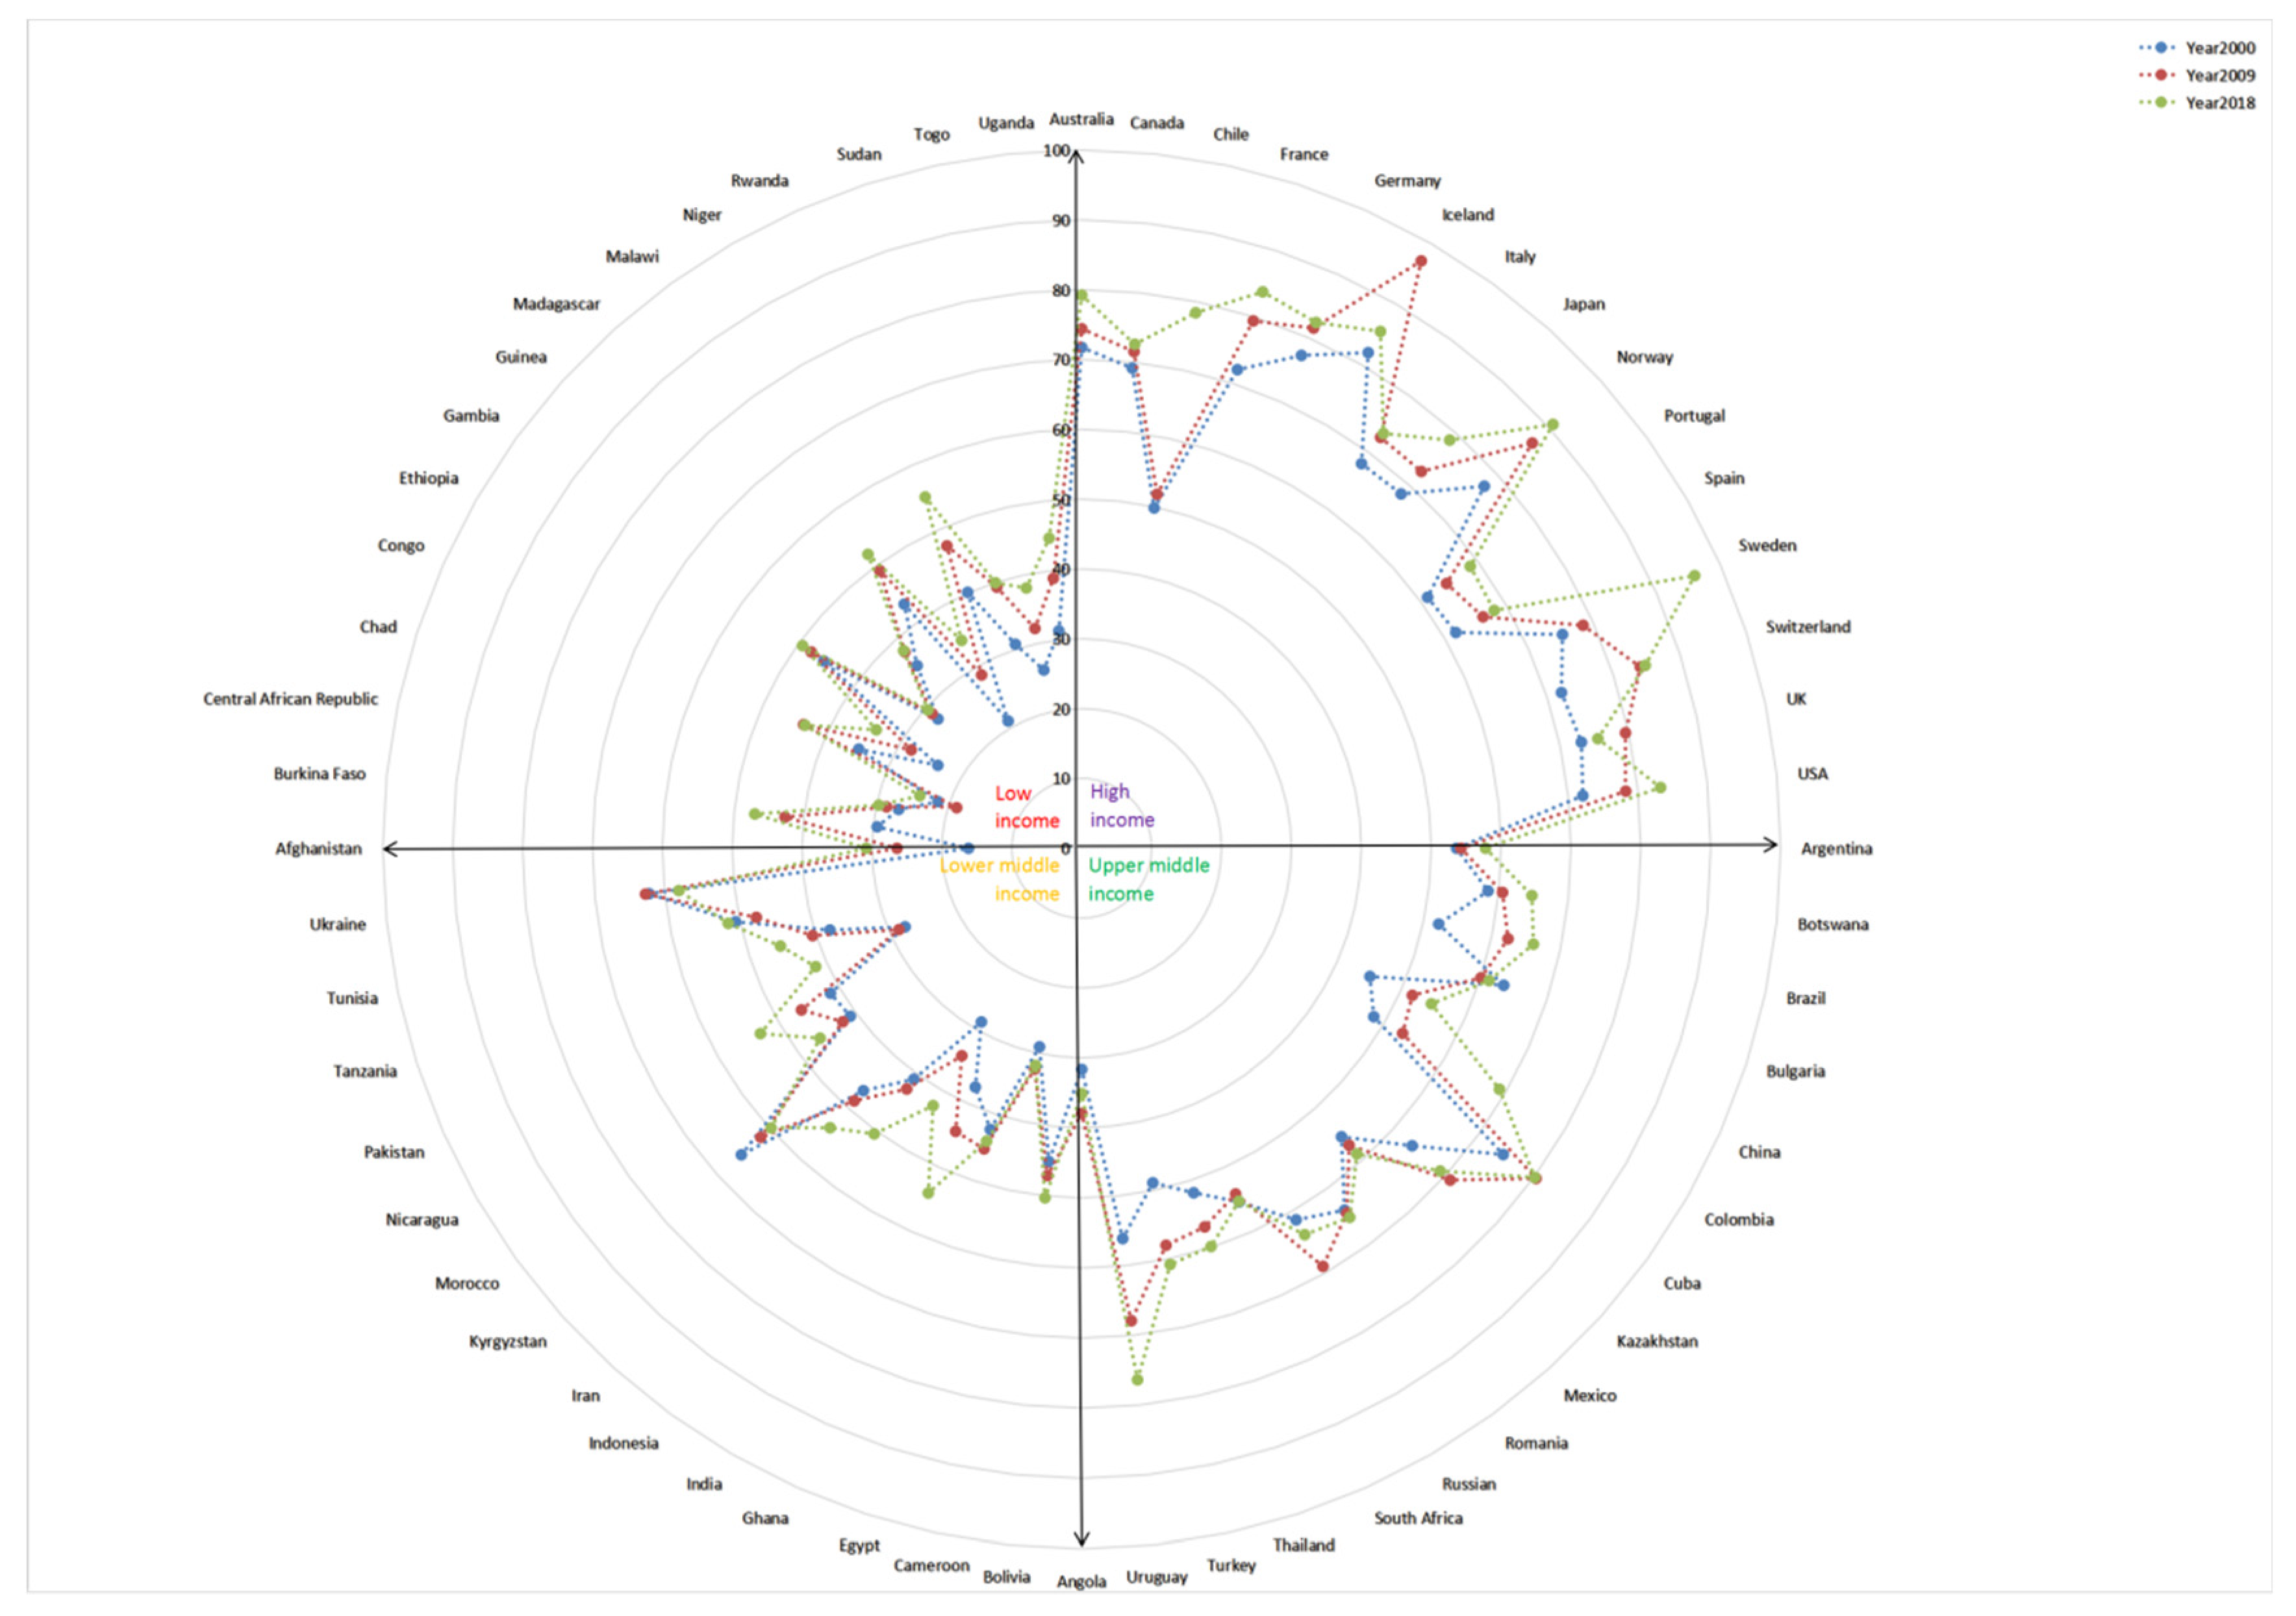
3.1. HCA Index Analysis

The HCA index of 186 countries around the world was calculated according to the HCA index model mentioned above, and the results were presented in ArcMap. Figure 1 shows the HCA index of 186 countries in 2018. Due to a large amount of data, we selected the HCA index results of 60 representative countries grouped by income in 2000, 2009, and 2018 (we selected 15 countries from each national income group, also taking into consideration the geographical locations of those countries), as shown in Figure 2. Table 3 shows classification of HCA index levels in these 60 countries.
Figure 1 visually reveals the geographical distribution of HCA index levels in countries around the world in 2018; countries in Europe, the Americas, and Oceania generally scored higher than countries in Asia and Africa on the HCA index values.
Of the top 10 countries in the HCA index, seven were from Europe (Sweden 96.01, Norway 90.73, Iceland 85.48, Switzerland 84.78, France 83.80, Germany 82.44, Ireland 79.63), two were from America (USA 83.28, Cuba 80.11), and one was from Oceania (Niue 79.86).
Of the bottom 10 countries in the HCA index, seven were from Africa (Chad 24.36, Nigeria 26.84, Guinea 29.61, Central African Republic 29.69, Equatorial Guinea 30.47, Cameroon 31.80, Ethiopia 33.95), two were from Asia (Afghanistan 30.85, Bangladesh 33.63), and one was from the Americas (Haiti 32.98).
Figure 2 visually reveals two prominent insights. First, large variations in the HCA index among countries grouped by income are apparent, with countries in the higher income group tending to perform better on the HCA index. The HCA index trends progressively negative in a clockwise direction in Figure 2, with the highest HCA index countries clustered at the top right, and the lowest HCA index countries clustered at the top left.
Second, countries performed differently on the HCA index within the same income group. For example, there were weaker and stronger performers among the upper-middle-income countries, with countries such as China (HCA index value = 54.76 in 2018) achieving lower scores on the HCA index than even some low-income countries (such as Rwanda, HCA index value = 55.08 in 2018); while some countries such as Cuba (HCA index value = 80.11 in 2018) achieved higher scores on the HCA index than most high-income countries (such as Portugal, HCA index value = 68.15 in 2018).
For the three selected years of 2000, 2009, and 2018, the HCA index of 60 representative countries has been divided into 3 levels: low, antagonism, and high (Table 3). Table 3 shows the distribution of different development stages in different income groups. We found that the HCA index of the selected 60 representative countries was generally showing a steady and slow upward trend. The number of countries in the low development stage was gradually decreasing (30 in 2000 vs. 20 in 2018) and the number of countries in the high development stage was gradually increasing (10 in 2000 vs. 15 in 2018).

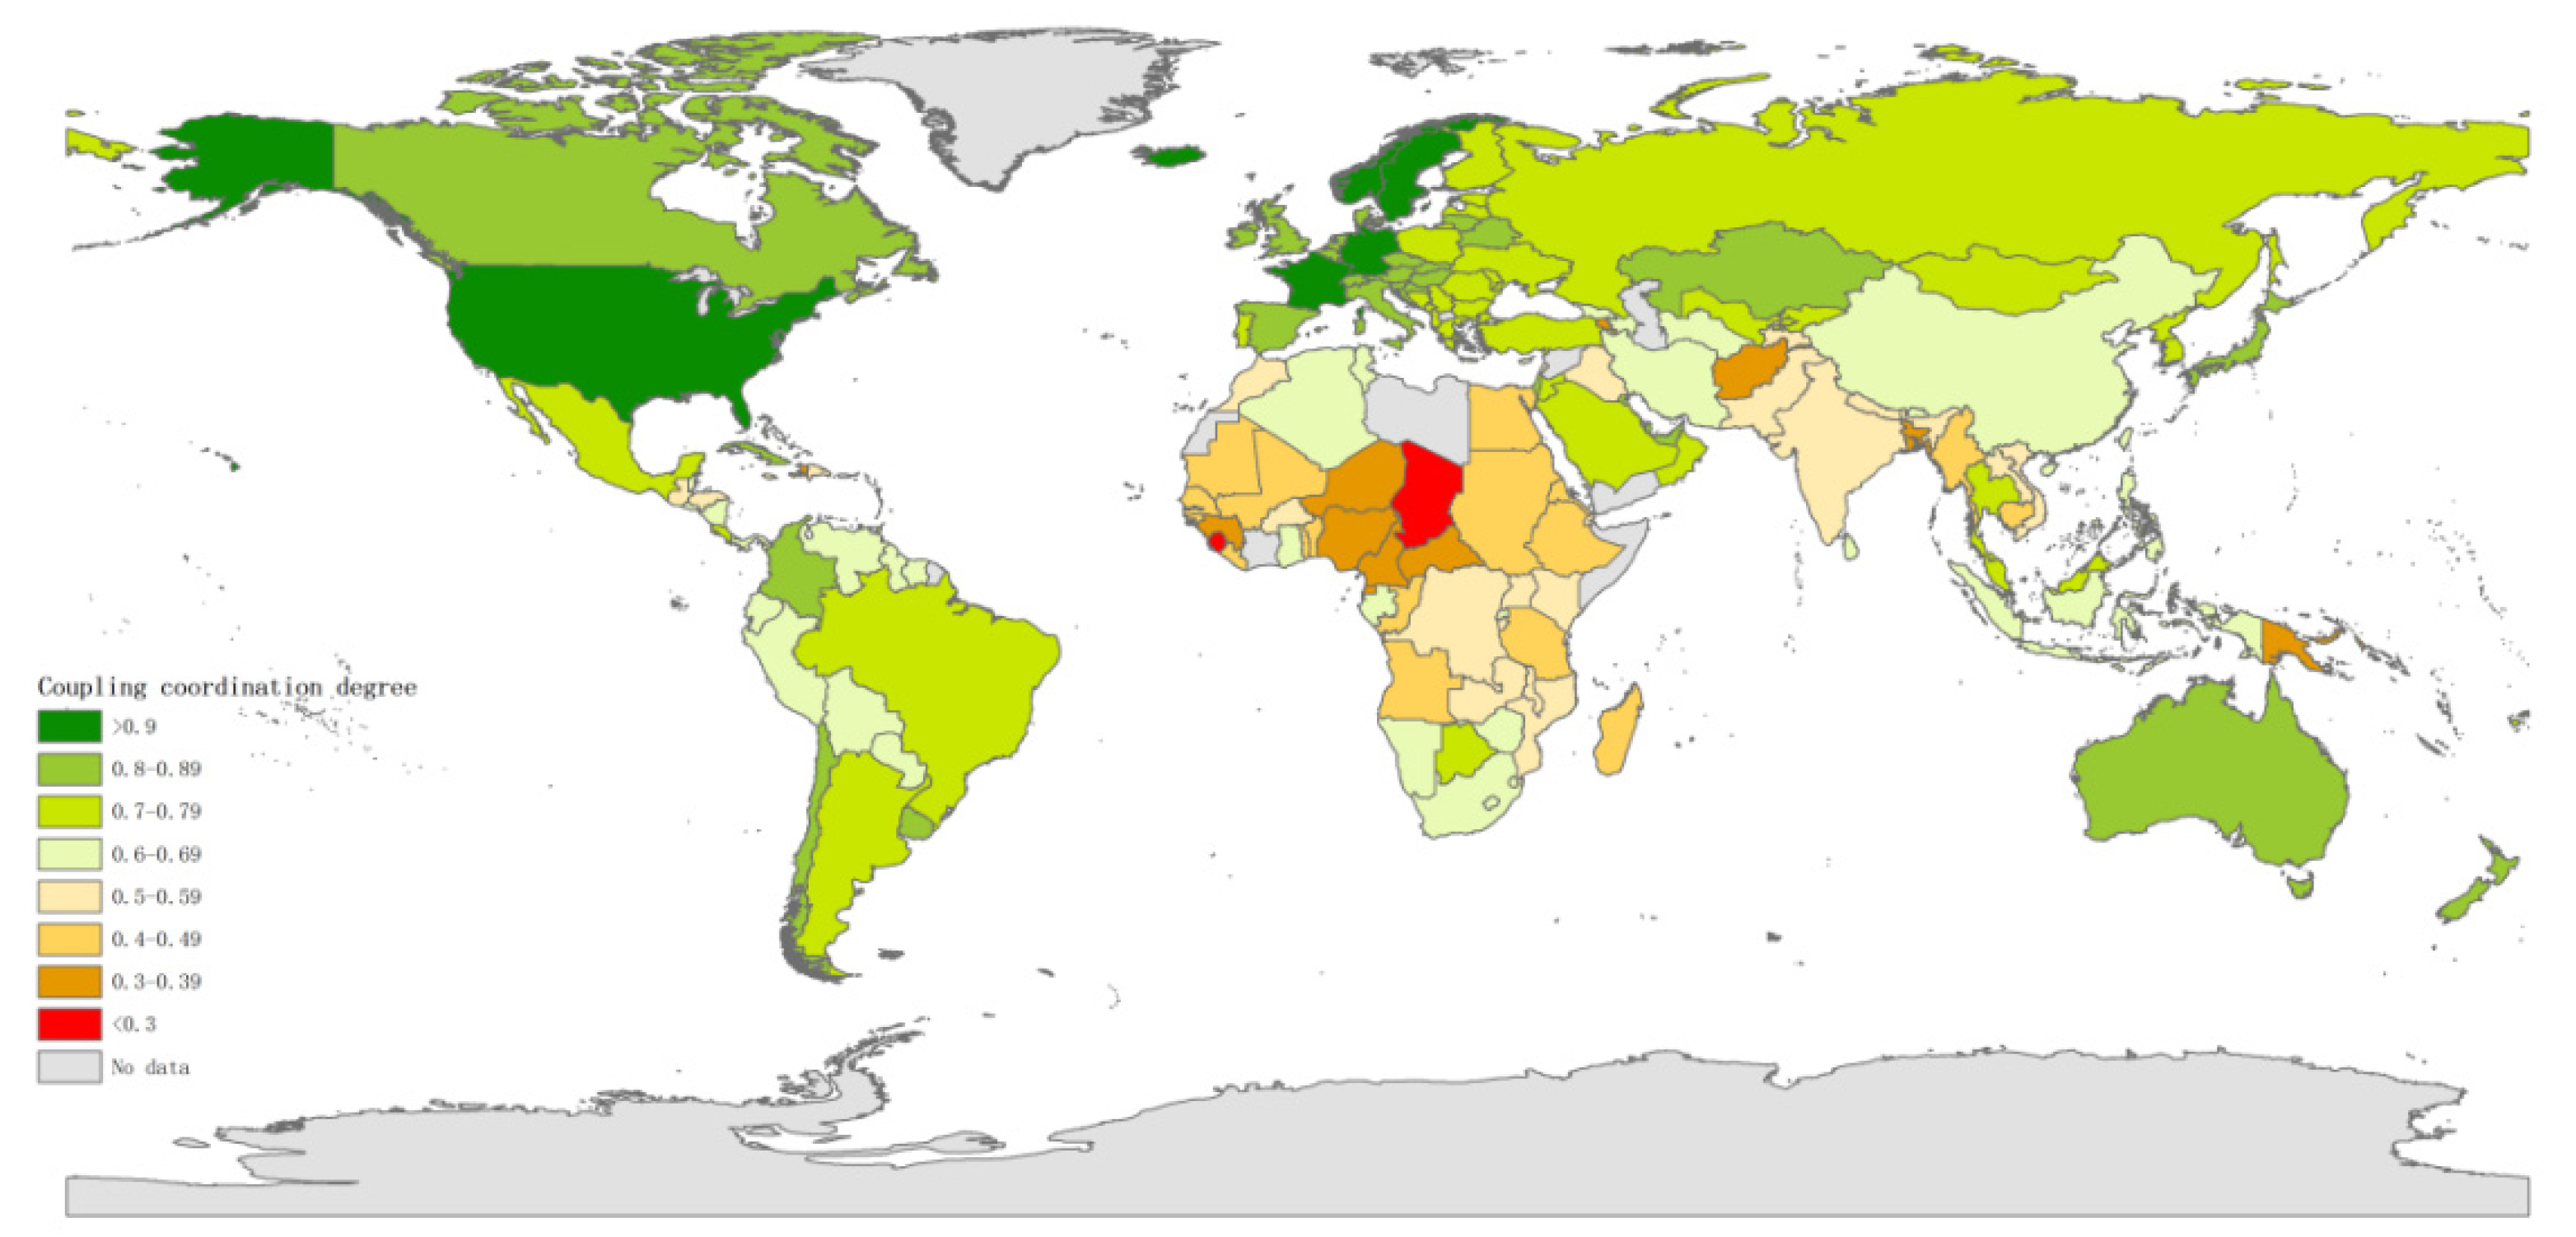
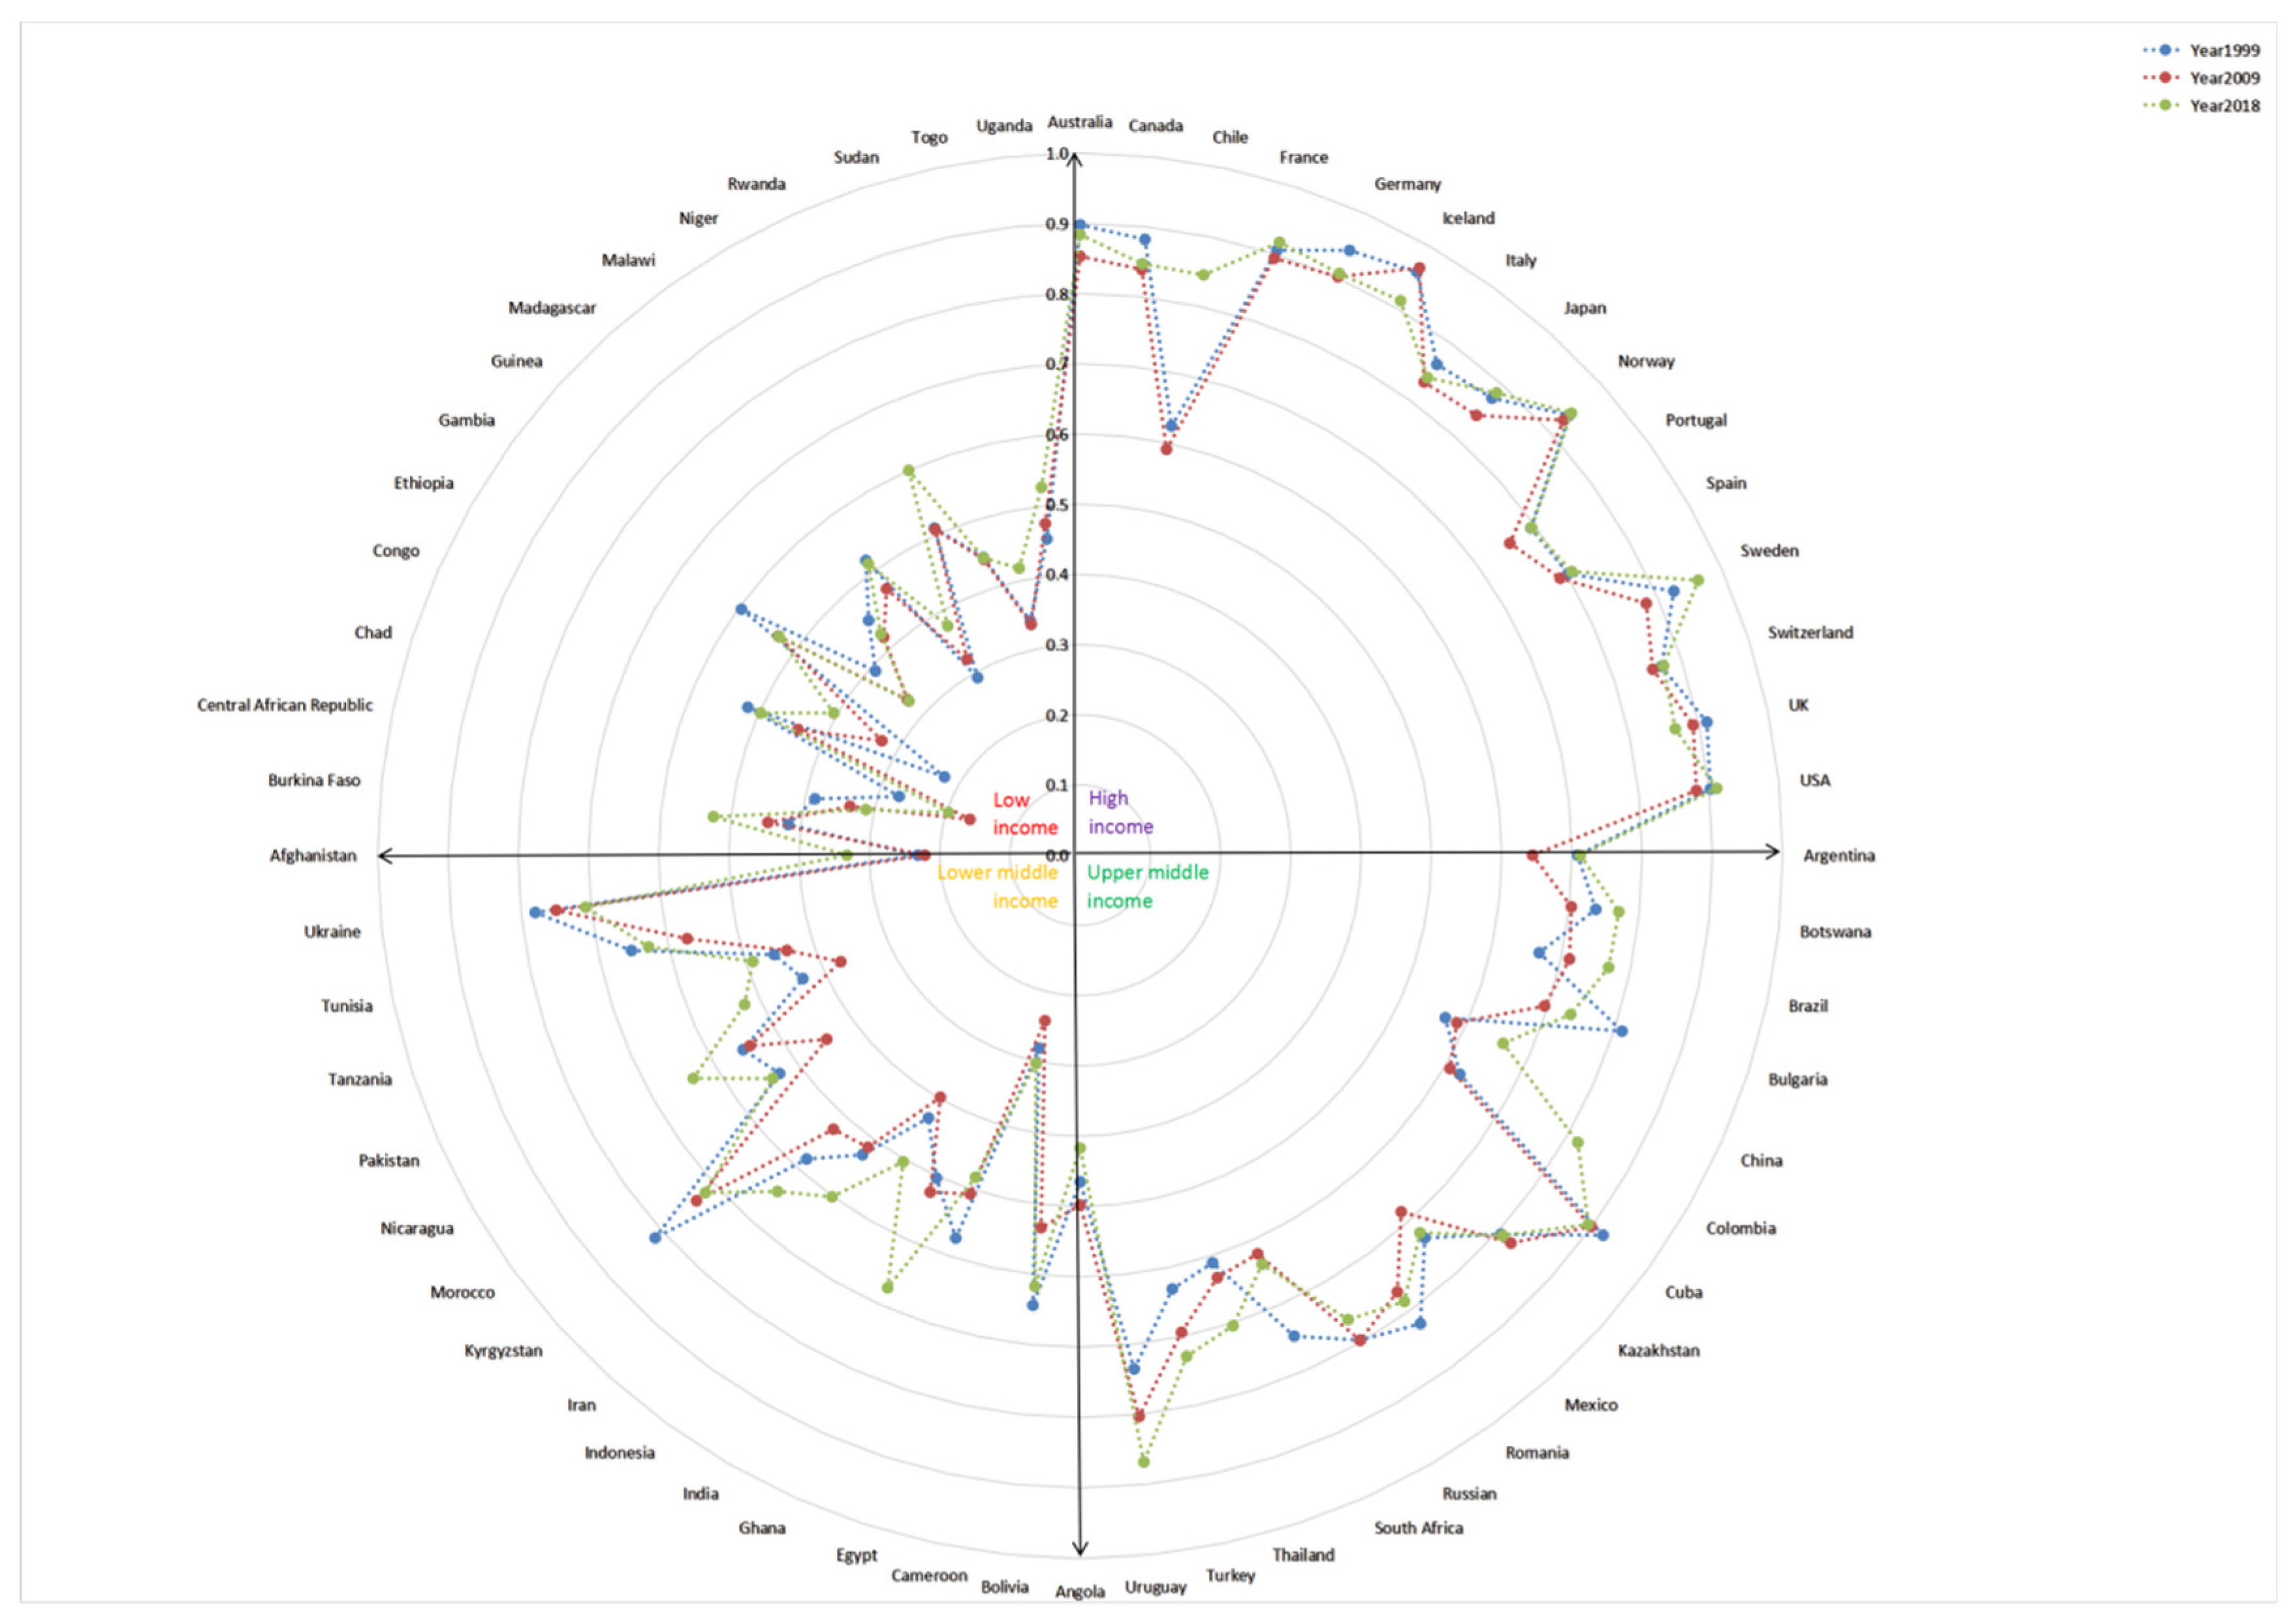
3.2. Coupling Coordination Degree Analysis

Based on the coupling coordination degree model, the coupling coordination degree of 186 countries around the world was calculated and the results are presented in ArcMap. Figure 3 showed the coupling coordination degree of 186 countries in 2018. For the same reason mentioned above, the coupling coordination degree results for the selected 60 representative countries are shown in Figure 4. Table 4 shows the classification of coupling coordination degree levels in these 60 countries.
It can be seen from Figure 3 that there are large variations in the geographical distribution of coupling coordination degree levels in countries across the world in 2018. Countries in Europe, the Americas, and Oceania generally scored higher than countries in Asia and Africa on the coupling coordination degree values.
Of the top 10 countries in the coupling coordination degree, seven were from Europe (Sweden 0.963, Norway 0.941, France 0.918, Iceland 0.912, Germany 0.907, Luxembourg 0.893, Ireland 0.890), two were from the Americas (USA 0.911, Cuba 0.894), and one was from Oceania (Niue 0.902).
Of the bottom 10 countries in the coupling coordination degree, eight were from Africa (Chad 0.197, Sierra Leone 0.299, Cameroon 0.303, Central African Republic 0.312, Guinea 0.328, Nigeria 0.329, Equatorial Guinea 0.361, Niger 0.377), and two were from Asia (Bangladesh 0.303, Afghanistan 0.332).
Figure 4 visually reveals two outstanding insights. First, large variations in the coupling coordination degree among countries grouped by income are apparent, with countries in the higher income group tending to perform better on the coupling coordination degree. The coupling coordination degree trends progressively negative in a clockwise direction in Figure 4, with the highest coupling coordination degree countries clustered at the top right, and the lowest coupling coordination degree countries clustered at the top left.
Second, countries performed differences in the coupling coordination degree within the same income group. For example, there were weaker and stronger performers among the upper-middle-income countries, with countries such as South Africa (coupling coordination degree value = 0.637 in 2018) achieving lower scores on the coupling coordination degree than some lower-middle-income countries (such as Kyrgyzstan, coupling coordination degree value = 0.718 in 2018); while some countries such as Cuba (coupling coordination degree value = 0.894 in 2018) achieved higher scores on the coupling coordination degree than most high-income countries (such as Portugal, coordination degree value = 0.794 in 2018).
In the three selected years of 2000, 2009, and 2018, the coupling coordination degree of the selected 60 representative countries has also been divided into three levels: maladjustment, sub coordination, and coordination (Table 4). Table 4 shows the distribution of different development stages in different income groups. We found that the coupling coordination degree of the selected 60 representative countries was generally showing a steady and slow upward trend. The number of countries in the stage of maladjustment was gradually decreasing (8 in 2000 vs. 6 in 2018), and the number of countries in the coordination stage was gradually increasing (26 in 2000 vs. 30 in 2018).

3.3. Refined Classification Analysis

Based on existing literature [20,23], we further combined the evaluation results of the HCA index model and coupling coordination degree model and divided HCA development into five types and nine stages theoretically, as shown in Table 5, to make a refined classification evaluation of global HCA development.
As can be seen from Table 5, the selected 60 representative countries only appear in four development types (optimum, transition, inferior, and worst) and five development stages (high-coordination, antagonism-coordination, antagonism-sub coordination, low-sub coordination, and low-maladjustment) in the selected three years of 2000, 2009, and 2018. The global HCA development has shown a positive trend on the whole over the past two decades. The number of countries belonging to the optimum development type was continuing to grow (10 in 2000, 14 in 2009, and 15 in 2018), and the number of countries belonging to the inferior and worst development type was continuing to fall (30 in 2000, 28 in 2009, and 20 in 2018) year by year.
The countries with the HCA in the optimal development type were all HMICs and the countries with the HCA in the inferior and worst development type were all LMICs. The HCA development level of Cuba exceeded most high-income countries and has always been in the optimum development type. Chile made a great leap in HCA development from the transition development type to the optimal development type. The five LMICs in sub-Saharan (Cameroon, Central African Republic, Chad, Guinea, and Niger) and Afghanistan HCA development have consistently the worst development types.
We examined Spearman’s correlation between HCA index and coupling coordination degree; the correlation coefficient was 0.787, p < 0.001.

4. Discussion

This study presents a refined evaluation of global HCA from 2000 to 2018 based on the HCA index model and coupling coordination degree model. Our results show that global HCA has generally showed a steady and slow upward trend in terms of both the HCA index and coupling coordination degree over the past 20 years, but there were large variations in national geographic distribution and income group distribution. In addition, the correlation between HCA index and coupling coordination degree was significant, positive, and strong. This is the first study to introduce the coupling coordination degree model to make up for the defect that the previous HCA evaluation studies cannot reflect the interactions between evaluation dimensions; thus, a more meticulous and comprehensive analysis of HCA was carried out in our study.

4.1. HCA Index

Our HCA index analysis results show that HCA development improved in most countries over the past 20 years, which is certainly an encouraging sign. However, we also found that the development level of HCA was significantly varied between high-income and low-income countries; in particular, the development level of HCA was extremely poor in LMICs in sub-Saharan Africa, which reflects the inequity of HCA development., Pu [1], and Parvin et al. [30] used travel distance and travel time from population centers to healthcare facilities as indicators to assess HCA in the selected LMICs, and concluded that these countries performed poorly in HCA. De Mello-Sampayo [31] and Cortés et al. [32] used the number of physicians per capita and distribution of hospitals as indicators to evaluate HCA in the selected HMICs, and showed the variance of HCA among different income groups. Their conclusions were analogous to our own, even though the indicators we used were different from those they used. We believe that there is a strong correlation between the travel distance and travel time from population centers to healthcare facilities, the distribution of hospitals, and the density of medical doctors, nurses, and midwives.
A country’s low HCA index is often due to poor healthcare resources [14]. While healthcare resources have increased in both HMICs and LMICs over the past 20 years, there is a huge gap between them. For example, in 2018, in our study, the average medical doctor density in high-income countries was 37.6 times (45.1 per 10,000 population vs. 1.2 per 10,000 population) higher than in low-income countries and 4.6 times (45.1 vs. 9.9) higher than in lower-middle-income countries; the average medical doctors density in upper-middle-income countries was 27.5 times (33.0 vs. 1.2) higher than in low-income countries and 3.3 times (33.0 vs. 9.9) higher than in lower-middle-income countries, which is similar to previous studies [33]. Lack of capacity to train domestic health workers and brain drain may be the two dominating reasons for the scarce health workforce in LMICs [34]. Lantz et al. [35] found that 12.8% of surgical specialists from Africa and 12.1% from Southeast Asia migrated to HMICs. Still, LMICs will not be able to improve their scarce healthcare resources in the short term [36], and therefore they need the international community to step up assistance in distance education, financial support, and so on, especially now that COVID-19 is having a huge impact on the global healthcare system.

4.2. Coupling Coordination Degree

Our coupling coordination degree analysis results show that HCA development was stable and improved in most countries over the past 20 years, which is a positive sign. Nevertheless, we also found that in 2018, one-third of LMICs were still in the maladjustment stage of coupling coordination degree, which is a terrible signal. In 2018, all high-income countries had reached the coordination stage of coupling coordination degree.
The coupling coordination degree reveals a country’s ability to allocate resources effectively [23]. At present, no research has explored the rationality and effectiveness of healthcare resource allocation from the perspective of coordination of HCA evaluation dimensions. Visconti [36] and McBain et al. [37] used the time-cost model and time-driven activity-based costing model (TDABC), respectively, to measure the effectiveness of healthcare resource allocation in LMICs. They found that the effectiveness of healthcare resource allocation in LMICs was poor and much lower than in high-income countries. Our research conclusions were similar to theirs, which indicates empirically that the coupling coordination degree is a reasonable and feasible indicator to reflect a country’s healthcare resource allocation capacity. Limited resource availability and inconsistencies in allocation efficiency are a reflection of weak health systems in LMICs [38], as demonstrated by the present study. In our study, the correlation coefficient between the HCA index and coupling coordination degree was 0.787 (p < 0.001), indicating that scant healthcare resources limited healthcare resource allocation ability, and weak allocation ability made lacking health care resources more critical. It is crucial to choose an appropriate breakthrough point. It was more feasible to seek a way to improve healthcare resource allocation ability than to develop healthcare resources under a scarce healthcare resource environment [38].

4.3. The role of HCA in Refining Classification Evaluation

Our refined classification evaluation of the global HCA development level will help guide us to identify countries that have achieved success in promoting HCA development and draw valuable experience from them. For example, Chile’s HCA was in a transition development type from 2000 to 2009 and did not improve much, but from 2009 to 2018, its HCA jumped to an optimal development type. Cuba is an upper-middle-income country, but its HCA development level is even higher than most high-income countries, and its HCA has been in the optimal development type for the past 20 years. This suggests that both countries may have efficient health systems worth learning from. As the study by Núñez et al. [39] pointed out, Chile is an attractive case study because it has undergone deep health reform changes over a short time, and the Chilean experience teaches us that the efficient allocation of healthcare resources results in the distribution of health outcomes towards the poor. Vos et al. [40] pointed to the Cuban case as one of the leading examples of an integrated governmental form of population health; its approaches to containing medical costs while providing quality care are worth learning from [41].
Our refined classification evaluation will be conducive to contributing to precision proposals for global HCA in different development categories. High-income countries such as Iceland, Sweden, etc. with the HCA in optimal development type indicate that their HCA development is in a perfect state; these countries not only have sufficient healthcare resource, but also had a powerful ability to allocate healthcare resources, which can maximize the effectiveness of adequate healthcare resources [34]. The mission for such countries to promote the development of HCA is to make timely and dynamic adjustments according to the actual situation to maintain the current status.
For HCA development in countries belonging to the suboptimum type, a high level of HCA tends to depend on the dividend effect brought by their abundant healthcare resources, while they fail to bring the maximum effectiveness of healthcare resources into full play, resulting in the idling and waste of healthcare resources to a certain extent [12]. Such national healthcare resource allocation capacity needs to be further improved. The main way to promote the development of HCA in these countries is to optimize healthcare resource allocation to achieve the best state of HCA development.
HCA in the transition development type indicates that HCA is unbalanced and underdeveloped. HCA in this development type is sensitive to the growth and deployment of health care resources. In this category, HMICs with a certain economic basis (such as Spain and China, etc.) could give priority to strengthening economic input to stimulate the growth of healthcare resources [12], such as expanding medical and health facilities, improving medical education, etc., to drive the development of HCA. LMICs in this category (such as Indonesia and Malawi, etc.) should prioritize improving healthcare resource allocation capacity, such as by developing new healthcare service packages applicable for low-resource settings [38], in order to promote HCA development.
The countries with inferior and worst development type of HCA were all LMICs. The implementation of investment in quality medical and health resources is unrealistic in LMICs due to socio-economic limitations [13]. LMICs should give paramount consideration to improving the system of tiered medical services, developing basic medical care service kits, and other means to optimize resource allocation for enhancing HCA [38]. In addition, LMICs should focus on scaling up the number of low-end healthcare talents rather than producing elite medical specialists; one problem is that LMICs are faced with a brain drain of medical experts [35]. They should also invest in basic healthcare facilities, rather than large-scale hospitals [2] to meet the basic health service needs of the population in a short time.
To summarize, the advantages of HCA development in HMICs lay not only in their affluent healthcare resources, but also in their powerful capacity to allocate healthcare resources; the dilemma of HCA development in LMICs lies not only in their lacking healthcare resources, but also in their weak capacity to allocate their limited healthcare resources effectively. As a result, LMICs ought to seek breakthroughs in improving their capacity for efficient allocation of healthcare resources to promote the HCA development when the meager healthcare resources cannot be improved in a short time.

4.4. Strengths and Limitations

Our study is superior to other studies in at least the following respects. First, this is the first study to introduce the coupling coordination degree model and combine it with the HCA index model as a blueprint for refined evaluation of global HCA development, thereby making contributions to accurately identifying national HCA development status and to precisely providing HCA development strategies. Second, our study covers more than 95% of countries in the world, thus providing a full picture of the global HCA development level. Third, our study presents a time span of nearly 20 years for HCA development, meaning that the results of the HCA development trends were significant and reliable.
Although potentially useful in global-level and country-specific HCA monitoring exercises aiming to obtain a comprehensive and elaborative picture of progress toward HCA, our operationalization had several data-related limitations. First, the GHO database data we used came from different sources (administrative, survey, and modeled data), which may produce potential biases. Second, we selected fewer HCA evaluation indicators than desirable due to insufficient data. Third, our HCA indicators captured service coverage, but not service quality.
To be clear, the fact that we used fewer HCA indicators than desirable does not mean that our study cannot reflect the HCA in a country. Because we used the most basic sentinel HCA evaluation indicators, if a country performed poorly on these indicators, it is hard to imagine that it could do well on other HCA evaluation indicators that we did not include. Furthermore, too many indicators may obscure the effectiveness of the key evaluation indicators.

5. Conclusions

Our empirical results indicate that the union of the coupling coordination degree model and HCA index model is a valid scheme to delicately evaluate global HCA development. Whether based on the HCA index model or coupling coordination degree model, most countries for which data were available showed positive trends in HCA development over the past two decades, but large variations remain, much of which was explained by differences in national incomes; the development level of HCA in LMICs was much lower than in HMICs. In addition, the HCA index was significantly, positively, and strongly associated with coupling coordination degree, indicating that the stock and the allocation capacity of healthcare resources are interdependent and mutually restricted.

Author Contributions

Z.S. conducted the study design with D.Q.; Z.S. conducted the data collection, data cleaning, data checking, data analysis, and data interpretation and had the primary responsibility of writing this paper; Y.S. conducted the literature search, data collection, data cleaning, and data checking; X.L. conducted the data checking, manuscript formatting adjustment, and the logic check of the manuscript; Y.T. conducted the figure optimization and the logic check of the manuscript; S.C. organized the tables and reviewed the drafts of this manuscript; D.Q. conducted the study design with Z.S.; D.Q. supervised the research process and reviewed the drafts of this manuscript. All authors have read and agreed to the published version of the manuscript.

Funding

This work was supported by the Key Project of the National Philosophy and Social Science Foundation of China (Grant number: 20AZD081).

Institutional Review Board Statement

Not applicable.

Informed Consent Statement

Not applicable.

Data Availability Statement

The datasets generated and/or analyzed in the current study are available in the Global Health Observatory data repository (2021 version, https://www.who.int/data/gho, accessed on 28 June 2022) and the World Bank’s Open Databases (2021 version, https://data.worldbank.org, accessed on 28 June 2022). All the data used in this study are available to the public, and no individual information is involved. Hence, no ethical or governmental permissions were required for this study.

Acknowledgments

We thank Raymond W Pong of the Centre for Rural and Northern Health Research, Laurentian University, Canada for his very helpful polishing and comments on previous versions of the paper.

Conflicts of Interest

The authors declare that they have no competing interest. The funder of the study had no role in the study design, data collection, data analysis, data interpretation, and writing of the report. The inclusion of any map (including the depiction of any boundaries therein), or of any geographic or locational reference, does not imply the expression of any opinion whatsoever on our part concerning the legal status of any country, territory, jurisdiction or area, or its authorities.

References

  1. Pu, Q.; Yoo, E.; Rothstein, D.H.; Cairo, S.; Malemo, L. Improving the spatial accessibility of healthcare in North Kivu, Democratic Republic of Congo. Appl. Geogr. 2020, 121, 102262. [Google Scholar] [CrossRef]
  2. Polo, G.; Acosta, C.M.; Ferreira, F.; Dias, R.A. Location-Allocation and Accessibility Models for Improving the Spatial Planning of Public Health Services. PLoS ONE 2015, 10, e119190. [Google Scholar] [CrossRef] [PubMed]
  3. Penchansky, R.; Thomas, J.W. The Concept of Access: Definition and Relationship to Consumer Satisfaction. Med. Care 1981, 19, 127–140. [Google Scholar] [CrossRef]
  4. Wang, L. Immigration, ethnicity, and accessibility to culturally diverse family physicians. Health Place 2007, 13, 656–671. [Google Scholar] [CrossRef]
  5. Delamater, P.L.; Messina, J.P.; Shortridge, A.M.; Grady, S.C. Measuring geographic access to health care: Raster and network-based methods. Int. J. Health Geogr. 2012, 11, 15. [Google Scholar] [CrossRef]
  6. Guagliardo, M.F. Spatial accessibility of primary care: Concepts, methods and challenges. Int. J. Health Geogr. 2004, 3, 3. [Google Scholar] [CrossRef]
  7. Ono, T.; Lafortune, G.; Schoenstein, M. Health Workforce Planning in OECD Countries: A Review of 26 Projection Models from 18 Countries; OECD Publishing: Paris, France, 2013. [Google Scholar]
  8. Ono, T.; Schoenstein, M.; Buchan, J. Geographic Imbalances in Doctor Supply and Policy Responses; OECD Publishing: Paris, France, 2014. [Google Scholar]
  9. OECD. Health for Everyone?: Social Inequalities in Health and Health Systems; OECD Publishing: Paris, France, 2019. [Google Scholar]
  10. Ouko, J.J.O.; Gachari, M.K.; Sichangi, A.W.; Alegana, V. Geographic information system-based evaluation of spatial accessibility to maternal health facilities in Siaya County, Kenya. Geogr. Res.-Aust. 2019, 57, 286–298. [Google Scholar] [CrossRef]
  11. Shah, T.I.; Bell, S.; Wilson, K. Spatial Accessibility to Health Care Services: Identifying under-Serviced Neighbourhoods in Canadian Urban Areas. PLoS ONE 2016, 11, e168208. [Google Scholar] [CrossRef] [PubMed]
  12. Lu, C.; Zhang, Z.; Lan, X. Impact of China’s referral reform on the equity and spatial accessibility of healthcare resources: A case study of Beijing. Soc. Sci. Med. 2019, 235, 112386. [Google Scholar] [CrossRef]
  13. Bitton, A.; Fifield, J.; Ratcliffe, H.; Karlage, A.; Wang, H.; Veillard, J.H.; Schwarz, D.; Hirschhorn, L.R. Primary healthcare system performance in low-income and middle-income countries: A scoping review of the evidence from 2010 to 2017. BMJ Glob. Health 2019, 4, e1551. [Google Scholar] [CrossRef]
  14. Xu, Z.; Gahr, M.; Xiang, Y.; Kingdon, D.; Rüsch, N.; Wang, G. The state of mental health care in China. Asian J. Psychiatry 2022, 69, 102975. [Google Scholar] [CrossRef] [PubMed]
  15. OECD. Health at a Glance 2019: OECD Indicators; OECD Publishing: Paris, France, 2019. [Google Scholar]
  16. Matthews, K.A.; Gaglioti, A.H.; Holt, J.B.; Wheaton, A.G.; Croft, J.B. Using spatially adaptive floating catchments to measure the geographic availability of a health care service: Pulmonary rehabilitation in the southeastern United States. Health Place 2019, 56, 165–173. [Google Scholar] [CrossRef] [PubMed]
  17. Di, X.; Wang, L.; Dai, X.; Yang, L. Assessing the Accessibility of Home-Based Healthcare Services for the Elderly: A Case from Shaanxi Province, China. Int. J. Environ. Res. Public Health 2020, 17, 7168. [Google Scholar] [CrossRef] [PubMed]
  18. Barber, R.M.; Fullman, N.; Sorensen, R.J.D.; Bollyky, T.; McKee, M.; Nolte, E.; Abajobir, A.A.; Abate, K.H.; Abbafati, C.; Abbas, K.M.; et al. Healthcare Access and Quality Index based on mortality from causes amenable to personal health care in 195 countries and territories, 1990–2015: A novel analysis from the Global Burden of Disease Study 2015. Lancet 2017, 390, 231–266. [Google Scholar] [CrossRef]
  19. Cabrera-Barona, P.; Blaschke, T.; Kienberger, S. Explaining Accessibility and Satisfaction Related to Healthcare: A Mixed-Methods Approach. Soc. Indic. Res. 2017, 133, 719–739. [Google Scholar] [CrossRef]
  20. Wagstaff, A.; Neelsen, S. A comprehensive assessment of universal health coverage in 111 countries: A retrospective observational study. Lancet Glob. Health 2020, 8, 39–49. [Google Scholar] [CrossRef]
  21. Hogan, D.R.; Stevens, G.A.; Hosseinpoor, A.R.; Boerma, T. Monitoring universal health coverage within the Sustainable Development Goals: Development and baseline data for an index of essential health services. Lancet Glob. Health 2018, 6, e152–e168. [Google Scholar] [CrossRef]
  22. McPake, B.I. Crunching health expenditure numbers: Important but treacherous terrain. Lancet Glob. Health 2018, 6, e124–e125. [Google Scholar] [CrossRef]
  23. Qi, Y.; Farnoosh, A.; Lin, L.; Liu, H. Coupling coordination analysis of China’s provincial water-energy-food nexus. Environ. Sci. Pollut. R. 2022, 29, 23303–23313. [Google Scholar] [CrossRef]
  24. Cheng, X.; Long, R.; Chen, H.; Li, Q. Coupling coordination degree and spatial dynamic evolution of a regional green competitiveness system—A case study from China. Ecol. Indic. 2019, 104, 489–500. [Google Scholar] [CrossRef]
  25. Shi, T.; Yang, S.; Zhang, W.; Zhou, Q. Coupling coordination degree measurement and spatiotemporal heterogeneity between economic development and ecological environment—Empirical evidence from tropical and subtropical regions of China. J. Clean. Prod. 2020, 244, 118739. [Google Scholar] [CrossRef]
  26. Janse van Rensburg, B.; Kotzé, C.; Moxley, K.; Subramaney, U.; Zingela, Z.; Seedat, S. Profile of the current psychiatrist workforce in South Africa: Establishing a baseline for human resource planning and strategy. Health Policy Plan. 2022, 37, 492–504. [Google Scholar] [CrossRef] [PubMed]
  27. Vardell, E. Global Health Observatory Data Repository. Med. Ref. Serv. Q. 2020, 39, 67–74. [Google Scholar] [CrossRef]
  28. Ampofo, A.G.; Boateng, E.B. Beyond 2020: Modelling obesity and diabetes prevalence. Diabetes Res. Clin. Pract. 2020, 167, 108362. [Google Scholar] [CrossRef] [PubMed]
  29. IBM Corp. IBM SPSS Statistics for Windows, Version 25.0; IBM Corp.: Armonk, NY, USA, 2017. [Google Scholar]
  30. Parvin, F.; Ali, S.A.; Hashmi, S.N.I.; Khatoon, A. Accessibility and site suitability for healthcare services using GIS-based hybrid decision-making approach: A study in Murshidabad, India. Spat. Inf. Res. 2021, 29, 1–18. [Google Scholar] [CrossRef]
  31. De Mello-Sampayo, F. Spatial Interaction Model for Healthcare Accessibility: What Scale Has to Do with It. Sustainability 2020, 12, 4324. [Google Scholar] [CrossRef]
  32. Cortés, Y. Spatial Accessibility to Local Public Services in an Unequal Place: An Analysis from Patterns of Residential Segregation in the Metropolitan Area of Santiago, Chile. Sustainability 2021, 13, 442. [Google Scholar] [CrossRef]
  33. World Health Organization. World Health Statistics 2021: Monitoring Health for the SDGs, Sustainable Development Goals; World Health Organization: Geneva, Switzerland, 2021. [Google Scholar]
  34. Pandian, J.D.; Kalkonde, Y.; Sebastian, I.A.; Felix, C.; Urimubenshi, G.; Bosch, J. Stroke systems of care in low-income and middle-income countries: Challenges and opportunities. Lancet 2020, 396, 1443–1451. [Google Scholar] [CrossRef]
  35. Lantz, A.; Holmer, H.; Finlayson, S.R.G.; Ricketts, T.C.; Watters, D.A.; Gruen, R.L.; Johnson, W.D.; Hagander, L. Measuring the migration of surgical specialists. Surgery 2020, 168, 550–557. [Google Scholar] [CrossRef]
  36. Visconti, R.M.; Larocca, A.; Marconi, M. Accessibility to First-Mile health services: A time-cost model for rural Uganda. Soc. Sci. Med. 2020, 265, 113410. [Google Scholar] [CrossRef]
  37. McBain, R.K.; Jerome, G.; Warsh, J.; Browning, M.; Mistry, B.; Faure, P.A.I.; Pierre, C.; Fang, A.P.; Mugunga, J.C.; Rhatigan, J.; et al. Rethinking the cost of healthcare in low-resource settings: The value of time-driven activity-based costing. BMJ Glob. Health 2016, 1, e134. [Google Scholar] [CrossRef] [PubMed]
  38. Abdu, M.; Wilson, A.; Mhango, C.; Taki, F.; Coomarasamy, A.; Lissauer, D. Resource availability for the management of maternal sepsis in Malawi, other low-income countries, and lower-middle-income countries. Int. J. Gynecol. Obstet. 2018, 140, 175–183. [Google Scholar] [CrossRef]
  39. Núñez, A.; Manzano, C.A.; Chi, C. Health outcomes, utilization, and equity in Chile: An evolution from 1990 to 2015 and the effects of the last health reform. Public Health 2020, 178, 38–48. [Google Scholar] [CrossRef] [PubMed]
  40. De Vos, P. Cuba’s Strategy Toward Universal Health. Int. J. Health Serv. 2019, 49, 186–192. [Google Scholar] [CrossRef]
  41. Bhardwaj, N.; Skinner, D. Primary Care in Cuba: Considerations for the U.S. J. Health Care Poor Underserved 2019, 30, 456–467. [Google Scholar] [CrossRef] [PubMed]
Figure 1. The HCA index by country. Notes: Numbers are derived from 2018 (if available) or the data points that are the most proximate 2018 per HCA evaluation indicator.
Sustainability 14 10280 g001
Figure 2. The HCA index by national income group. Notes: Data are based on the specified years (2000, 2009, and 2018) from 60 representative countries (we selected 15 countries from each national income group, also taking into consideration the geographical locations of those countries). Congo refers to the Republic of the Congo in this figure.
Sustainability 14 10280 g002
Figure 3. The coupling coordination degree by country. Notes: Numbers are derived from 2018 (if available) or the data points that are the most proximate 2018 per HCA evaluation indicator.
Sustainability 14 10280 g003
Figure 4. The coupling coordination degree by national income group. Notes: Data are based on the specified years (2000, 2009, and 2018) from 60 representative countries (we selected 15 countries from each national income group, also taking into consideration the geographical locations of those countries). Congo refers to the Republic of the Congo in this figure.
Sustainability 14 10280 g004
Table 1. HCA evaluation indicator system.
DimensionsEvaluation IndicatorsUnitPropertyData
Resources
References
WorkforceMedical doctors densityPer 10,000 populationPositiveThe GHO databaseHealth at a Glance 2019: OECD Indicators
Nursing and midwifery personnel densityPer 10,000 populationPositiveThe GHO databaseHealth at a Glance 2019: OECD Indicators
FinancialOOP expenditure as percentage of CHE%NegativeThe GHO databaseHealth at a Glance 2019: OECD Indicators
Catastrophic spending on health (at 10% threshold)%NegativeThe GHO databaseHealth at a Glance 2019: OECD Indicators
ServicesDTP3 vaccination rates%PositiveThe GHO databaseHealth at a Glance 2019: OECD Indicators
Skilled birth attendance%PositiveThe GHO databaseHealth at a Glance 2019: OECD Indicators
Notes: If the indicator type is positive, then the larger the indicator value, the better the situation. If the indicator type is negative, then the smaller the indicator, the better the situation. OOP = out-of-pocket. CHE = current health expenditure. DTP3 = diphtheria tetanus toxoid and pertussis. GHO = Global Health Observatory.
Table 2. Countries grouped by national income.
Income GroupsCountCountries
High-income56Andorra, Antigua and Barbuda, Australia, Austria, Bahamas, Bahrain, Barbados, Belgium, Brunei Darussalam, Canada, Chile, Cook Islands, Croatia, Cyprus, Czechia, Denmark, Estonia, Finland, France, Germany, Greece, Hungary, Iceland, Ireland, Israel, Italy, Japan, Kuwait, Latvia, Lithuania, Luxembourg, Malta, Nauru, Netherlands, New Zealand, Niue, Norway, Oman, Palau, Poland, Portugal, Qatar, Republic of Korea, Saint Kitts and Nevis, Saudi Arabia, Seychelles, Singapore, Slovakia, Slovenia, Spain, Sweden, Switzerland, Trinidad and Tobago, UK, United Arab Emirates, USA
Upper-middle-income53Albania, Argentina, Armenia, Azerbaijan, Belarus, Bosnia and Herzegovina, Botswana, Brazil, Bulgaria, China, Colombia, Costa Rica, Cuba, Dominica, Dominican Republic, Ecuador, Equatorial Guinea, Fiji, Gabon, Georgia, Grenada, Guatemala, Guyana, Iraq, Jamaica, Jordan, Kazakhstan, Lebanon, Malaysia, Maldives, Marshall Islands, Mauritius, Mexico, Montenegro, Namibia, Panama, Paraguay, Peru, Republic of Moldova, Romania, Russia, Saint Lucia, Saint Vincent and the Grenadines, Serbia, South Africa, Suriname, Thailand, Tonga, Turkey, Turkmenistan, Tuvalu, Uruguay, Venezuela
Lower-middle-income54Algeria, Angola, Bangladesh, Belize, Benin, Bhutan, Bolivia, Cabo Verde, Cambodia, Cameroon, Comoros, Côte d’Ivoire, Djibouti, Egypt, El Salvador, Eswatini, Ghana, Haiti, Honduras, India, Indonesia, Iran, Kenya, Kiribati, Kyrgyzstan, Lesotho, Mauritania, Micronesia, Mongolia, Morocco, Myanmar, Nepal, Nicaragua, Nigeria, Pakistan, Papua New Guinea, Philippines, Samoa, Sao Tome and Principe, Senegal, Solomon Islands, Sri Lanka, Tajikistan, Tanzania, The Lao People’s Democratic Republic, The Republic of the Congo, Timor-Leste, Tunisia, Ukraine, Uzbekistan, Vanuatu, Viet Nam, Zambia, Zimbabwe
Low-income23Afghanistan, Burkina Faso, Burundi, Central African Republic, Chad, Democratic People’s Republic of Korea, Democratic Republic of the Congo, Eritrea, Ethiopia, Gambia, Guinea, Guinea-Bissau, Liberia, Madagascar, Malawi, Mali, Mozambique, Niger, Rwanda, Sierra Leone, Sudan, Togo, Uganda
Notes: National income groups were taken from the World Bank’s Open Databases (2021 version, https://data.worldbank.org, accessed on 28 June 2022).
Table 3. Classification of the HCA index levels in 60 representative countries grouped by income from 2000 to 2018.
YearLowAntagonismHighCount
2000Turkey, Colombia, Iran, Gambia, China, Bolivia, Malawi, Egypt, Nicaragua, Morocco, Indonesia, Rwanda, Tanzania, Ghana, Madagascar, Congo, Angola, Uganda, Sudan, Burkina Faso, Cameroon, India, Guinea, Pakistan, Central African Republic, Togo, Ethiopia, Chad, Niger, AfghanistanCanada, Japan, Italy, Kyrgyzstan, Romania, Kazakhstan, Bulgaria, Ukraine, Spain, Russia, Portugal, Botswana, Uruguay, Mexico, South Africa, Argentina, Brazil, Thailand, Tunisia, ChileIceland, Norway, Germany, Sweden, Cuba, UK, Switzerland, USA, France, Australia60
2009Malawi, Iran, Gambia, Tunisia, Rwanda, Bolivia, Nicaragua, Egypt, Ghana, Congo, Burkina Faso, Indonesia, Morocco, Tanzania, Sudan, Uganda, Angola, Madagascar, India, Cameroon, Togo, Guinea, Niger, Pakistan, Central African Republic, Ethiopia, Afghanistan, ChadRussia, Uruguay, Spain, Portugal, Romania, Ukraine, Brazil, Kyrgyzstan, Botswana, Bulgaria, Turkey, Mexico, Thailand, Argentina, South Africa, Colombia, Chile, ChinaIceland, Norway, Switzerland, Germany, Cuba, UK, France, Sweden, USA, Australia, Italy, Japan, Canada, Kazakhstan60
2018Gambia, Burkina Faso, Morocco, Tanzania, Uganda, Egypt, Congo, India, Pakistan, Sudan, Togo, Madagascar, Angola, Niger, Ethiopia, Cameroon, Afghanistan, Central African Republic, Guinea, ChadColombia, Kazakhstan, Portugal, Spain, Brazil, Romania, Botswana, Russia, Bulgaria, Turkey, Thailand, Kyrgyzstan, Mexico, Ukraine, Argentina, South Africa, Rwanda, China, Ghana, Iran, Nicaragua, Malawi, Tunisia, Indonesia, BoliviaSweden, Norway, Iceland, Switzerland, France, USA, Germany, Cuba, Australia, Japan, Chile, Uruguay, UK, Italy, Canada60
DistributionLower-middle-income (35%); Low-income (65%)High-income (8%); Upper-middle-income (52%); Lower-middle-income (32%); Low-income (8%)High-income (86.7%); Upper-middle-income (13.3%)High-income (25%); Upper-middle-income (25%); Lower-middle-income (25%); Low-income (25%)
Notes: Congo refers to the Republic of the Congo in this table.
Table 4. Classification of the coupling coordination degree in 60 representative countries grouped by income from 2000 to 2018.
YearMaladjustmentSub CoordinationCoordinationCount
2000Guinea, Central African Republic, Togo, Niger, Cameroon, Chad, Afghanistan, EthiopiaBrazil, Tunisia, Bolivia, Turkey, Chile, Colombia, Thailand, Gambia, Iran, Egypt, China, Nicaragua, Morocco, Indonesia, Malawi, Congo, Rwanda, Ghana, Angola, Tanzania, Uganda, Madagascar, Sudan, India, Pakistan, Burkina FasoIceland, Germany, Norway, Sweden, Cuba, UK, France, USA, Australia, Canada, Japan, Switzerland, Italy, Romania, Kyrgyzstan, Bulgaria, Kazakhstan, Spain, Russia, Portugal, Ukraine, South Africa, Botswana, Uruguay, Mexico, Argentina60
2009Pakistan, Togo, Central African Republic, Guinea, Ethiopia, Niger, Cameroon, Afghanistan, ChadTurkey, Mexico, Argentina, Thailand, South Africa, Colombia, Chile, China, Tunisia, Nicaragua, Bolivia, Gambia, Iran, Ghana, Indonesia, Rwanda, Egypt, Angola, Uganda, Malawi, Burkina Faso, Morocco, Sudan, Congo, Tanzania, Madagascar, IndiaIceland, Norway, Germany, Cuba, France, UK, Sweden, USA, Switzerland, Australia, Japan, Canada, Italy, Kazakhstan, Uruguay, Russia, Spain, Romania, Portugal, Ukraine, Kyrgyzstan, Brazil, Botswana, Bulgaria60
2018Niger, Afghanistan, Guinea, Central African Republic, Cameroon, ChadGhana, China, Iran, South Africa, Nicaragua, Tunisia, Bolivia, Indonesia, Rwanda, Morocco, Gambia, Uganda, Burkina Faso, Pakistan, Malawi, India, Congo, Tanzania, Egypt, Sudan, Madagascar, Togo, Angola, EthiopiaSweden, Norway, France, Iceland, USA, Germany, Cuba, Japan, Australia, Switzerland, Uruguay, UK, Canada, Chile, Italy, Colombia, Kazakhstan, Spain, Portugal, Romania, Botswana, Brazil, Russia, Bulgaria, Turkey, Mexico, Kyrgyzstan, Argentina, Ukraine, Thailand60
DistributionLower-middle-income (16.7%); Low-income (83.3%)Upper-middle-income (8.3%); Lower-middle-income (50%); Low-income (41.7%)High-income (50%); Upper-middle-income (43.3%); Lower-middle-income (6.7%)High-income (25%); Upper-middle-income (25%); Lower-middle-income (25%); Low-income (25%)
Notes: Congo refers to the Republic of the Congo in this table.
Table 5. The refined classification of HCA development in 60 representative countries grouped by income from 2000 to 2018.
TypeStage200020092018Count
OptimumHigh-CoordinationAustralia, Cuba, France, Germany, Iceland, Norway, Sweden, Switzerland, UK, USAAustralia, Canada, Cuba, France, Germany, Iceland, Italy, Japan, Kazakhstan, Norway, Sweden, Switzerland, UK, USAAustralia, Canada, Chile, Cuba, France, Germany, Iceland, Italy, Japan, Norway, Sweden, Switzerland, UK, Uruguay, USAHigh-income (86.7%); Upper-middle-income (13.3%)
SuboptimumHigh-Sub-Coordination
TransitionHigh-Maladjustment
Antagonism-CoordinationArgentina, Botswana, Bulgaria, Canada, Italy, Japan, Kazakhstan, Kyrgyzstan, Mexico, Portugal, Romania, Russia, South Africa, Spain, Ukraine, UruguayBotswana, Brazil, Bulgaria, Kyrgyzstan, Portugal, Romania, Russia, Spain, Ukraine, UruguayArgentina, Botswana, Brazil, Bulgaria, Colombia, Kazakhstan, Kyrgyzstan, Mexico, Portugal, Romania, Russia, Spain, Thailand, Turkey, UkraineHigh-income (13.3%); Upper-middle-income (73.4%); Lower-middle-income (13.3%)
Antagonism-Sub-CoordinationBrazil, Chile, Thailand, TunisiaArgentina, Chile, China, Colombia, Mexico, South Africa, Thailand, TurkeyBolivia, China, Ghana, Indonesia, Iran, Malawi, Nicaragua, Rwanda, South Africa, TunisiaUpper-middle-income (20%); Lower-middle-income (60%); Low-income (20%)
Antagonism-Maladjustment
Low-Coordination
InferiorLow-Sub CoordinationAngola, Bolivia, Burkina Faso, China, Colombia, Congo, Egypt, Gambia, Ghana, India, Indonesia, Iran, Madagascar, Malawi, Morocco, Nicaragua, Pakistan, Rwanda, Sudan, Tanzania, Turkey, UgandaAngola, Bolivia, Burkina Faso, Congo, Egypt, Gambia, Ghana, India, Indonesia, Iran, Madagascar, Malawi, Morocco, Nicaragua, Rwanda, Sudan, Tanzania, Tunisia, UgandaAngola, Burkina Faso, Congo, Egypt, Ethiopia, Gambia, India, Madagascar, Morocco, Pakistan, Sudan, Tanzania, Togo, UgandaLower-middle-income (42.9%); Low-income (57.1%)
WorstLow-MaladjustmentAfghanistan, Cameroon, Central African Republic, Chad, Ethiopia, Guinea, Niger, TogoAfghanistan, Cameroon, Central African Republic, Chad, Ethiopia, Guinea, Niger, Pakistan, TogoAfghanistan, Cameroon, Central African Republic, Chad, Guinea, NigerLower-middle-income (16.7%); Low-income (83.3%)
Notes: Congo refers to the Republic of the Congo in this table.
Publisher’s Note: MDPI stays neutral with regard to jurisdictional claims in published maps and institutional affiliations.

