Abstract
In recent years, the global economy has become more closely related among countries, and people’s pursuit of economic growth has caused the destruction of the environment. This paper selected panel data from 30 provinces in China from 1997 to 2020 to investigate the dynamic relationship between trade liberalization, financial development and carbon dioxide emissions by constructing a PVAR model. We also consider technology as an important variable for studying the effect on carbon dioxide emissions. We draw the following conclusions. First, financial development promotes carbon dioxide emissions, while trade liberalization has no significant impact on carbon dioxide emissions. Second, China’s trade liberalization promotes financial development, which has limited support for international trade. Third, there is a two-way causal relationship between financial development and carbon dioxide emissions, and there is also a two-way causal relationship between trade liberalization and financial development. Finally, there is a significant inverted “U” curve relationship between trade liberalization and innovation efficiency, environmental regulation and innovation. According to the results, we believe that openness to trade impacts emissions of carbon dioxide, opening a new function path: namely, trade openness and financial development result in high carbon dioxide emissions; consequently, China has relied on this process in the development of their financial system.
1. Introduction
The biggest problem of climate change is global warming. Energy technology innovation is viewed as a crucial method for achieving a low-carbon economy in response to global warming [1]. Technological innovation is critical in balancing the amount and quality of economic growth. High-quality financial development requires innovation, and financial development is inextricably linked to the advancement of green technology innovation systems. Cost-cutting technological improvements may not be ecologically benign.
As a new global player, China’s economic growth has been widely observed; after more than 40 years of reform and opening-up, China’s rapid economic growth has been accompanied by rapid growth in trade liberalization and a sharp increase in CO2 emissions. At the end of 2021, China’s total carbon emissions accounted for 36.7% of the world’s total emissions. At the same time, China’s overseas trade has expanded quickly; the trade scale from 35.50 billion yuan in 1978 jumped to 39.1 trillion yuan in 2021 (General Administration of Customs of China). Table 1 shows the corresponding study of the relationship between CO2 emission, FD, TR and other factors.

Table 1.
The corresponding study of the relationship between CO2 emission, FD, TR and other factors.
The economy increases production level, which increases carbon emissions, and urbanization has a direct relationship with environmental deterioration [13]. Green technology is a significant factor in reducing carbon emissions [14]. Godil, Yu [15] used QARDL to analyze data from China and concluded that carbon dioxide would decrease due to technology. Braungardt, Elsland [16] pointed out that green technology is a solution to green growth, but cannot reduce carbon dioxide emissions, Wang, Yang [17] also have the same conclusion. Iqbal, Ahmad [18] further highlighted that some organizations did not encourage technology innovation since it is a cost-bearing activity. Wang and Zhu [1] thought that innovation of renewable energy technology negatively influences carbon dioxide emissions. Chien, Ajaz [19] validate the EKC hypothesis to find that economic growth positively affects carbon dioxide emissions. Hence, using technology as a moderator to verify the relationship between financial development, trade liberalization and carbon dioxide emissions is necessary.
Through the above analysis, the objective evaluation of trade liberalization and financial development affecting carbon dioxide emissions is of great importance. The focus is on how trade liberalization and financial development affect carbon dioxide emissions. Will trade liberalization and financial development indirectly contribute to carbon dioxide emissions by other means? Existing literature only studies the independent effects of trade liberalization and financial development on carbon dioxide emissions, which may ignore the objective link between trade liberalization and financial development in carbon emission reduction. In addition, some previous literature lacks empirical data to examine the relationship, and the conclusion only shows unidirectional causality. Based on this, our paper brings trade liberalization, financial development and carbon dioxide emissions into a unified research framework and adopts the panel vector autoregression (PVAR) analysis method to study the internal relationship between trade liberalization, financial development and carbon dioxide emissions. Without any previous restrictions, the vector autoregressive (VAR) model is used to evaluate the dynamic connection of joint endogenous variables. It creates a model based on statistical data features. It builds a model by treating each endogenous variable in the system as a function of the lag value of all endogenous variables in the system in order to explain variable interaction [20].
Based on the foregoing analysis, this paper intends to examine the link between financial development, trade liberalization and environmental pollution using China’s panel data from 1997 to 2020. Furthermore, given the importance of technology in economic growth, technological innovation is utilized as one factor to analyze financial development’s influence on lowering carbon emissions. The rest of this paper is structured as follows. Section 2 reviews the literature and hypothesis on trade liberalization, financial development and carbon dioxide emissions. Section 3 is the model setting and data description. Section 4 is the empirical analysis of this paper. In Section 5, we summarize the conclusions and give policy recommendations. The limitation and further recommendations are shown in the last section.
2. Literature and Hypothesis
Numerous studies on carbon dioxide emissions have been conducted in recent years. However, the influence of trade liberalization and financial development on carbon dioxide emissions is more dynamic than that of other factors [21].
2.1. Trade Liberalization and Carbon Dioxide Emissions
Some researchers believe that trade liberalization reduces carbon dioxide emissions, and others hold the opposite view [22], based on the analytical framework of Grossman and Krueger [23], Chang and Chang [24] used four alternative measures to find that the relationship between trade liberalization and environmental quality also depends on country corruption. Oh and Bhuyan [25] studied the relationship between economic growth, energy consumption, trade liberalization and carbon dioxide emissions, they found that energy consumption has a positive effect on CO2 emissions, but other variables have a positive effect only in the long run. Tariq, Sun [4] further confirmed the positive relationship between trade liberalization and CO2 emissions. Hdom and Fuinhas [12] used cointegration regression methods to analyze the relationship between economic activities, such as trade, and CO2 emissions in Brazil, they assumed the more trade openness, the more pollution. Still, this situation is not suitable in Brazil and all the countries. Many studies have tested the relationship between trade—environment relationship primarily by factoring trade liberalization into Environmental Kuznets Curve (EKC) theory [5], according to EKC theory, there is an inverted U-shaped, which means that with the growth of the economy, the environmental pollution will increase. When the economy develops to a threshold, environmental pollution will improve. This change is due to endogenously. Although some studies have provided evidence for the pollution paradise theory [26,27], there are still some debates about whether trade liberalization promotes carbon dioxide emissions, and the selection of research objects and the use of different methods are the reasons for the inconsistent results. Previous studies have held that trade liberalization has led to an increase in economic activities, directly leading to an increase in carbon dioxide emissions. At the same time, the degree of trade openness determines the degree of trade liberalization, so trade globalization will also increase carbon dioxide emissions. Accordingly, the first hypothesis is proposed.
Hypothesis 1 (H1).
Trade liberalization has a direct effect on CO2.
2.2. Financial Development and Carbon Dioxide Emissions
Many researchers have found the relationship between financial development and the environment. Since different economic development levels exist across developed and developing countries, recent literature has come to different conclusions about both developed and developing countries [28]. Some studies conclude that financial development may have a negative effect on the environment. Firstly, financial development will prompt consumers to obtain more loans to buy houses, cars and other commodities, whose purchase directly increases the energy demand and thus promotes carbon dioxide emission [29]. Secondly, financial development reduces financing costs to a certain extent, which will prompt enterprises to expand production scale, and also hurt the environment [30]. On the other hand, researchers concluded that financial development might also positively affect the environment. Khan and Ozturk [31] used 88 developing countries’ samples for research and concluded that financial development reduces pollution emissions. Le, Le [32] also reached the same conclusion with Asia as the research object. Phong [33] further took ASEAN-5 countries as the research object. They measured financial development through Durbin–Hausman–Wu statistics to determine the appropriate model, and also believed that financial development was beneficial to environmental improvement. Other scholars [34,35] reached a similar conclusion. According to the quantity theory of money (QTM), financial development will occur through wealth and scale effects, as explained by Xiong and Qi [36]. The financial system can change the flow of capital. By guiding the flow of capital, the industrial structure can be optimized and backward and highly polluting enterprises can be phased out. Financial development also can increase support for basic research, especially for low-carbon technology research, which can bring technological innovation and help to curb environmental pollution. Most importantly, when a country’s finance is highly developed, national policies, consumer preferences, market mechanisms, etc., will change and more attention will be paid to environmental protection, which is also beneficial to reducing carbon dioxide emissions. Accordingly, the second hypothesis is proposed.
Hypothesis 2 (H2).
Financial development can decrease CO2 emissions.
2.3. Trade Liberalization and Financial Development
The study of trade liberalization and financial development can be roughly divided into two groups. One group suggests that financial development promotes trade liberalization. They emphasize that the financial system is a kind of resource endowment with highly developed financial systems in countries. Its dependence on the external financing department has a high growth rate [37], that is to say, the financial system in developed countries exports capital-intensive products [38,39,40]. Yakubu, Aboagye [41] examined the relationship between financial development and international trade relay on 46 countries in Africa, and they revealed the differential effects of finance on trade, and that private credit affects trade. Chan and Manova [42] confirmed theoretically and empirically that countries with developed financial markets have more trading partners. Because these countries have lower financing costs and can achieve greater profits. The other group believes that trade liberalization can promote financial development. It is believed that as a country’s trade liberalization increases, it will increase the demand for external financing products, thus continuously promoting financial development [11,43]. Ibrahim and Sare [44] used the systematic GMM method to study the impact of Africa’s trade liberalization on the development of the financial sector. The study believed that trade liberalization promoted financial development and that human capital accumulation and trade liberalization could be substituted for each other in influencing Africa’s financial development. Ashraf [45] used bank-level data from emerging economies to examine the impact of trade and financial openness on financial development. Their results showed that trade liberalization promoted the development of banking by increasing trading volume and reducing transaction costs. Zhang, Zhu [46] used dynamic panel estimation technology to study the impact of China’s trade and financial openness on financial development. The results showed that trade liberalization did not promote financial development due to inappropriate resource allocation. According to conventional trade theory, international commerce with a reallocation of resources inside national borders is influenced by exogenous differences between nations [47]. However, some researchers pointed out that conventional trade theory is inadequate to explain what actually happens in the real world, such as the changing character of international trade, the changing roles and relative competitive positions of countries in the world economy [48]. New development theories, in addition, do not predict that trade will unambiguously raise economic development [47]. In empirical studies, since most scholars have studied the impact of trade liberalization on financial development, while only a few have studied the impact of financial development on trade liberalization, further empirical work is needed. Accordingly, the third hypothesis is proposed.
Hypothesis 3 (H3).
There is a bi-directional causal relationship between financial development and trade liberalization.
3. Model Setting and Data Description
3.1. PVAR Model
The panel data vector autoregressive (PVAR) model was used in Green finance [20], the relationship between renewable energy consumption, economic growth and CO2 [49], fiscal and taxation policies [50], the interaction effect of government [51]. The proposed panel VAR model was shown as Equation (1).
where i = 1, 2… N, t = 1, 2… T, represents the total number of individuals, The subscripts, which are defined as i, t and j, refer to individual, time and lag order, respectively. Yit denotes a vector of the endogenous stationary series, αi denotes the individual fixed effect, δt denotes the time fixed effect and εit denotes the random error term. The dynamic relationship among different factors was shown in Equations (2)–(4):
3.2. Data Description
Annual provincial panel data from 2005 to 2020 in China were collected from the China Statistical Yearbook, which does not contain Hong Kong, Macao, Taiwan and Tibet due to lack of data. The time interval includes important international events such as China’s accession to the WTO (2001), Financial Crisis (2008) and Brexit (2016).
The carbon dioxide emission (CO2) was shown in Equation (5).
where αi refers to the standard coal coefficient of energy i, βi refers to the carbon dioxide emission coefficient of energy i, and Ei refers to the consumption of energy coefficient i. Trade openness (TR) refers to the ratio of the import and export to gross domestic product (GDP). Financial development (FD) refers to the ratio of the sum of deposits and loans of financial institutions to GDP.
3.3. Technology Effect on CO2 Emission
This study examines the relationship between technology innovation and CO2 emission. Technology innovation is defined by patents and R&D investment. The corresponding data were from the China Statistical Yearbook and the annual report of listed companies. The model was built as Equations (6) and (7):
3.4. SFA Model
In order to study the technology innovation effect on trade liberalization, the SFA model was used. In this paper, based on the SFA model of Battese and Coelli [52], the input and output activities of technological innovation are used in a Trans-Log form.
The detailed models were shown in Equations (8)–(12). The specific models are set as follows: is each region’s innovation output, is the amount of R&D personnel input in each region, Kit is the amount of R&D capital input in each region, i is the ranking number of each province and city in China, t is the period number; β0, β1,…, β5 are the parameters to be estimated. εit is the random disturbance, it is the random error term and obeys N(0, ); is the error correction of the regression model for the technical inefficiency term and obeys a truncated normal distribution, i.e., ~N(0i, ); is the control variable affecting the technical inefficiency; TECit is the technology level of each region every year; γ is the parameter to be estimated.
The sample period of this study is 1997–2020, and this paper used data from 30 provinces in China obtained from China Science and Technology Statistical Yearbook, China Environment Statistical Yearbook, China Statistical Yearbook, and China Education Statistical Yearbook.
- Y: innovation output (pieces);
- K: R&D capital stock;
- L: Personnel input in regional R&D activities;
- TRL: Regional trade liberalization level;
- ER: Environmental regulation variables;
Control variables: The intensity of R&D investment (ST): the ratio of R&D expenditure to GDP; human capital (SCH): the indicator of average years of education. The education level of each province is divided into five levels: no schooling, primary school, junior high school, senior high school and college and above, and the corresponding years of education are 0, 6, 9, 12 and 16, respectively. The average number of years of education required is calculated by multiplying the number of people aged 6 and above at each education level by the corresponding number of years of education and then summing them up to obtain the average number of years of education required. The degree of economic development (GDPPC): The gross regional product per capita (RMB); foreign direct investment (FDI): The actual amount of foreign investment utilized in the region, which is converted to the average exchange rate of each year, and the logarithm is taken to eliminate systematic errors caused by differences in the order of magnitude of the data.
4. Results and Discussion
4.1. Descriptive Statistics Analysis
Table 2 shows the standard energy coefficient, carbon dioxide emission coefficient and consumption of energy coefficient. As shown in Table 3, the average of InCO2, InTR, InFD is 4.82, −2.43 and 18.54; the standard error of InCO2, InTR, InFD is 9.89, 0.68 and 25.38; the minimum value of InCO2, InTR, InFD is 8.01, −2.13 and 18.65; the maximum is 0.86, 1.68 and 1.76. We used 1000 observations to analyze the nexus between financial development, trade liberalization and carbon dioxide emissions. Standard errors are examined for the effect on sample size. The standard error or InFD is 25.38, which means InFD is easily affected by sample size, while InTR is not. The minimum and maximum of InFR are very different, which shows that deposits and loans of financial institutions are different according to economic level.
Table 2.
Energy Standard Coal Coefficient (αi), Carbon Dioxide Emission Coefficient (βi) and consumption of energy coefficient (Ei).
Table 3.
Descriptive Statistics.
4.2. Panel Unit Root Test
Table 4 summarizes the results of the unit root tests. It showed that the variables are stationary at levels. LLC test showed InCO2 is stationary at levels 1% and 5% significance levels, which are 0.0298 and 0.2862. InFD is 5% significance level, which is 0.2318 and 0.1839. InTR is 1% and 10% significance level, which is 0.1836 and 0.2736. All variables are stationary at the first differenced form. The conclusion of the IPS test showed that all variables reject the unit root null hypothesis, and InCO2 it is at 1% and 5% significance levels, which are 1.325 and 1.438. InTR is significant at the level of 10%, which is 0.416 and 1.428.
Table 4.
Results of Unit Root Test.
4.3. PVAR Evaluation
4.3.1. Lagging Items Screening
Table 5 showed the lagging item screening. The AIC, BIC and HQIC for the lag 1 were −5.7624, −5.2346, −6.2345. And the BIC and HQIC were significant for lag 1. For lag 2, the AIC, BIC and HQIC values were −5.6219, −5.0138, −5.4326, respectively. For lag 3, the AIC, BIC and HQIC values were −5.5628, −4.4316, −5.6138, respectively. For lag 4, the AIC, BIC and HQIC values were −5.3129, −4.2364, −5.6183, respectively. For the lag 4, the AIC, BIC and HQIC values were significant.
Table 5.
Lagging Item Screening.
4.3.2. PVAR Evaluation Results
Table 6 reports the estimation results of the PVAR model. The results show that the first and third lags of the CO2 are positively correlated with its current level. The estimated coefficients associated with the first and third lags of CO2 are equal to 1.912 and 0.236, and they are significant both at the 1% levels, indicating that the carbon dioxide in the previous period promoted the increase of carbon dioxide emissions in the current period. Additionally, the first and third lags of CO2 positively determine the current level of financial development at the 5% and 1% level of significance, which means that the carbon dioxide emissions increase financial development, which is consistent with Hypothesis 2, financial development can affect CO2 emissions. The coefficient is significant at the level of 1% level of financial development, the coefficient is 0.236. It is the third-order lag coefficient, indicating financial development promotes CO2 emissions.
Table 6.
PVAR Evaluation Results.
4.4. Variance Decomposition
Table 7 showed the variance decomposition. The results indicated that for the results of the 10 periods, the contribution from highest to lowest are carbon dioxide emissions (81.3%), trade liberalization (11.8%) and financial development (4.6%). The smallest is trade liberalization is responsible for 63.4%, 31.4% and 11.2% respectively. As for trade liberalization (51.3%), then carbon dioxide emissions were 13.2%.
Table 7.
Variance Decomposition.
4.5. Granger Causality Test
Table 8 showed the results of the Granger causality test. When the variable was lnCO2, the chi-square value for lnFD was not the cause, lnTR is not the cause, and all were 27.124, 4.436 and 47.238, respectively. The p values were 0.003, 0.246 and 0.012, respectively.
Table 8.
The Results of Granger Causality Test.
From the carbon dioxide emission equation, the null hypothesis is rejected at the significance level of 1%, that the carbon dioxide emissions rely on financial development. From the financial development equation, the original hypothesis is rejected at the 1% level of significance that financial development is not determined by carbon dioxide emissions and trade liberalization.
4.6. Technology Innovation Effect on Carbon Dioxide Emissions
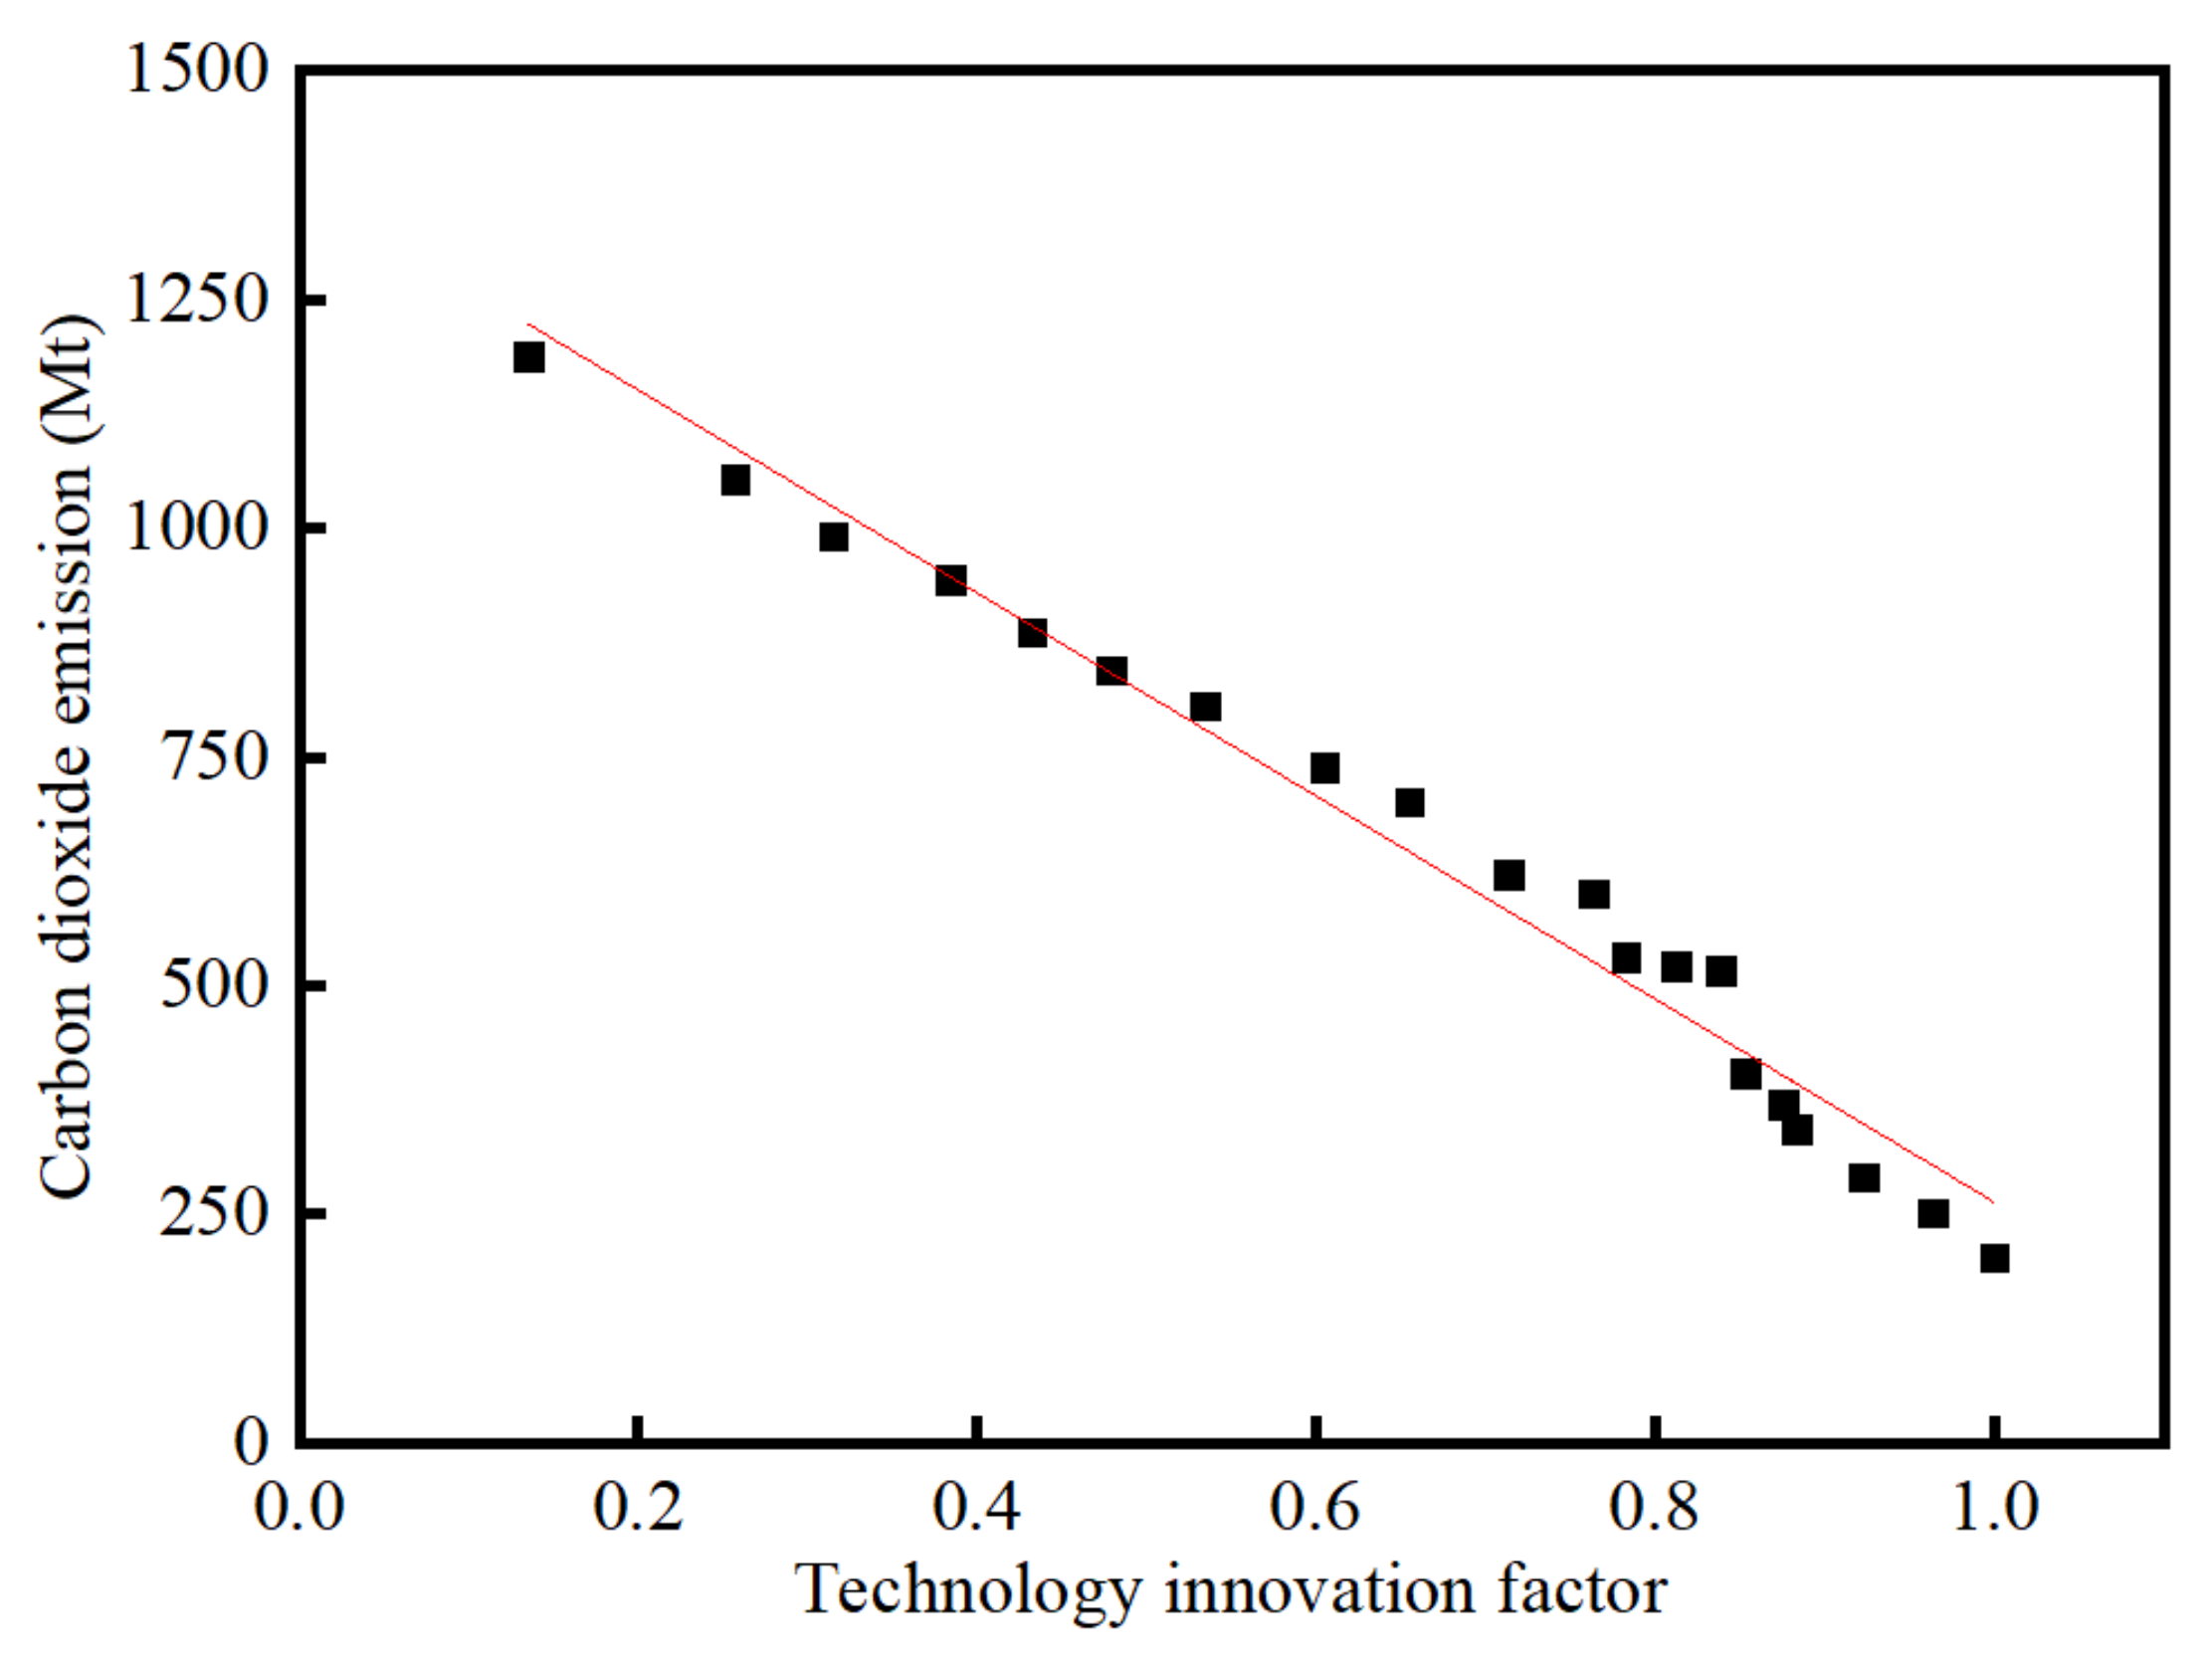
Figure 1 shows the trend of carbon dioxide emissions and the technology innovation factor, which indicates carbon dioxide emissions have a strong correlation with the technology innovation factor. The coefficient of determination R-Square is 0.9755, indicating that 97.6% of the increase in carbon dioxide can be explained by technological innovation, and the fitting degree is good. The adjusted Adj. R-square is 0.974, which also indicates that the model fitting effect is good.
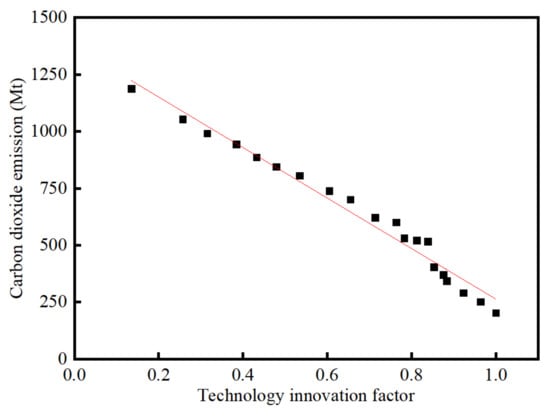
Figure 1.
The relationship between carbon dioxide emission and the technology innovation factor.
4.7. Technology Innovation Effect on Trade Liberation
Table 9 gives the estimation results of the SFA of the main function of models 1 and 2. As shown in Table 9, the σ value passes the test at the 5% level of significance, which is 0.3214 in model 1, and the 1% level of significance, which is 0.1324. The γ values pass the test at the 1% level of significance; in model 1 and model 2, the γ value reaches 0.5238 and 0.6852, respectively, which indicates technical inefficiency was affected by random disturbance.
Table 9.
The Maximum likelihood estimation of SFA.
This paper adds TRL2 and ER2 to study the nonlinear relationship between trade liberalization and environmental regulation in model 2 and model 3. Models 4, 5 and 6 test the synergistic effects of trade liberalization and environmental regulation intensity on innovation efficiency. As shown in model 1 and model 2 in Table 10, we can see that there is a “U” shape relationship between trade liberalization and innovation inefficiency, i.e., an inverted “U” shape relationship with innovation efficiency. In model 1, TR, ER and SCH are significant at a 5% level, and ST and InFDI are significant at a 1% level. In model 2, TRL2 is significant at a 5% level, which is 0.6254. In model 4 and 5, we can see both TRL and ER are significant at a 5% level, and environmental regulation positively regulates the non-linear effect of trade liberalization on innovation efficiency. The same show that trade liberalization also positively regulates the inverted “U” shape of environmental regulation on innovation efficiency.
Table 10.
SFA estimation of the impact of trade liberalization and environmental regulation intensity on innovation inefficiency.
5. Conclusions and Policy Recommendations
This paper investigated the dynamic relationship between trade liberalization, financial development and carbon dioxide emissions employing the PVAR model and Chinese panel data of 30 provinces. This paper also analysis technology innovation as a variable to analyze the relationship between trade liberalization, environmental regulation and carbon dioxide emissions. Based on the analysis, we draw the following conclusions.
First, trade liberalization in China supports financial development, which in turn boosts carbon dioxide emissions, but trade liberalization has negligible effects on carbon dioxide emissions and limited support for international commerce. As a result, it is critical to limit the negative environmental effect of financial development, continually improve the financial system and direct money to invest in the green economy, low-carbon economy and circular economy. As the primary polluters of the environment, enterprises should actively engage in technological innovation activities aimed at improving enterprise production efficiency, lowering the cost of pollution discharge per unit of output and reducing pollution from enterprise production to the ecological environment, as well as promoting the development of high-tech industries, exit outdated, high-polluting businesses.
Second, China’s financial development increases carbon dioxide emissions, whereas trade liberalization has little influence. The government should preserve the financial system’s service stability and build a diverse financial service system. To avoid increased environmental pollution due to financial development, it is necessary to use financial means to accelerate the transition of economic development mode, promoting more financial resources to flow into green finance and prioritizing support for green, environmental protection, energy-saving and low-polluting enterprises.
Third, there is a bi-directional causal link that occurs not just between financial development and CO2 emissions but also between trade liberalization and financial development. The amount of technical innovation influences the environmental effect of financial development. Environmental protection technology should be regularly updated to increase firm production efficiency and achieve energy-saving emissions. Simultaneously, consideration should be given to the indirect impact of trade liberalization on the environment. In the future, Chinese enterprises should prioritize independent research and development in the globalization process and integrate themselves into the global value chain, shifting from the production of low-value-added, high-energy-consuming products to the production of high-value-added, low-energy-consumption products.
Fourth, the government should fully embrace the role of financial development in trade liberalization. Since China’s reform and its opening up, the domestic financial industry has grown. However, because China’s financial system is still in its early stages, foreign trade development has not played a significant role. With the rise of trade protectionism, China will continue to follow the road of trade liberalization, improving financial products and boosting the level of financial services, all of which benefit global economic development. Simultaneously, as part of the financial development and trade structure adjustment, greater attention should be made to the formation and upgrading of finance-related systems, laws and regulations in order to meet China’s carbon emission reduction targets.
Fifth, there is a significant inverted “U” curve relationship between trade liberalization and innovation efficiency, environmental regulation and innovation, Foreign direct investment also had a positive impact on technological innovation. Although environmental regulations have been strengthened, regional innovation efficiency has shown a trend of increasing first and then decreasing. Thus, we should further increase the degree of trade liberalization, combine trade liberalization with environmental regulation and improve independent innovation capability.
6. Limitations and Future Recommendations
In our study, there are several limits in our research that can be solved in the approaching years. To begin, a substantial body of literature indicates that financial growth and trade liberalization are major mechanisms influencing carbon dioxide emissions, and our study focuses on these two factors. However, we use the ratio of each province’s total import and export volume to GDP to gauge trade liberalization, which may potentially affect carbon dioxide emissions through other pathways. What exactly are these channels? Further research is required for our study. Second, the panel data used in this paper’s empirical analysis is limited at the province level due to data availability. The findings will be strengthened if it reaches the municipal or county level.
Given the limitations mentioned above, future studies can focus on analyzing the influence of financial outcomes and financial efficiency on carbon dioxide to acquire a more thorough knowledge of the link between financial development and carbon dioxide. Second, investigating how financial development and trade liberalization impact carbon dioxide emissions can help to enhance the relevant theoretical theory. Third, future research may expand existing research by adding data analysis at the municipal level and also add new variables, such as the impact of environmental regulations on carbon dioxide emissions, as well as new models, to solve the endogenous problem and investigate the two-way influence mechanism of trade liberalization, financial development and carbon emissions.
Author Contributions
Conceptualization: K.D.; Data curation, K.D. and M.C.; Methodology, K.D. and M.C.; Software, M.C.; Project administration: N.A.K.M.; Supervision, N.A.K.M.; Validation, K.D. and N.A.K.M.; Writing—Original draft, K.D.; Writing—review and editing, K.D. and N.A.K.M. All authors have read and agreed to the published version of the manuscript.
Funding
This research received no external funding.
Institutional Review Board Statement
Not applicable.
Informed Consent Statement
Not applicable.
Data Availability Statement
The data presented in this study are available on request from the corresponding author.
Conflicts of Interest
The authors declare no conflict of interest.
References
- Wang, Z.; Zhu, Y. Do energy technology innovations contribute to CO2 emissions abatement? A spatial perspective. Sci. Total Environ. 2020, 726, 138574. [Google Scholar] [CrossRef] [PubMed]
- Onifade, S.T.; Erdoğan, S.; Alagöz, M.; Bekun, F.V. Renewables as a pathway to environmental sustainability targets in the era of trade liberalization: Empirical evidence from Turkey and the Caspian countries. Environ. Sci. Pollut. Res. 2021, 28, 41663–41674. [Google Scholar] [CrossRef] [PubMed]
- Jena, P.R. Does trade liberalization create more pollution? Evidence from a panel regression analysis across the states of India. Environ. Econ. Policy Stud. 2018, 20, 861–877. [Google Scholar] [CrossRef]
- Tariq, G.; Sun, H.; Haris, M.; Kong, Y.; Nadeem, A. Trade liberalization, FDI inflows economic growth and environmental sustainability in Pakistan and India. J. Agric. Environ. Int. Dev. 2018, 112, 253–269. [Google Scholar] [CrossRef]
- Kolcava, D.; Nguyen, Q.; Bernauer, T. Does trade liberalization lead to environmental burden shifting in the global economy? Ecol. Econ. 2019, 163, 98–112. [Google Scholar] [CrossRef]
- Dogan, E.; Seker, F. The influence of real output, renewable and non-renewable energy, trade and financial development on carbon emissions in the top renewable energy countries. Renew. Sustain. Energy Rev. 2016, 60, 1074–1085. [Google Scholar] [CrossRef]
- Mehmood, U.; Tariq, S. Globalization and CO2 emissions nexus: Evidence from the EKC hypothesis in South Asian countries. Environ. Sci. Pollut. Res. 2020, 27, 37044–37056. [Google Scholar] [CrossRef] [PubMed]
- Mahmood, H.; Maalel, N.; Zarrad, O. Trade openness and CO2 emissions: Evidence from Tunisia. Sustainability 2019, 11, 3295. [Google Scholar] [CrossRef]
- Mahmood, H.; Alkhateeb, T.T.Y. Trade and environment nexus in Saudi Arabia: An environmental Kuznets curve hypothesis. Int. J. Energy Econ. Policy 2017, 7, 291–295. [Google Scholar]
- Shahbaz, M.; Nasreen, S.; Ahmed, K.; Hammoudeh, S. Trade openness–carbon emissions nexus: The importance of turning points of trade openness for country panels. Energy Econ. 2017, 61, 221–232. [Google Scholar] [CrossRef]
- Ehigiamusoe, K.U.; Lean, H.H. Tripartite analysis of financial development, trade openness and economic growth: Evidence from Ghana, Nigeria and South Africa. Contemp. Econ. 2018, 12, 189–207. [Google Scholar]
- Hdom, H.A.; Fuinhas, J.A. Fuinhas, Energy production and trade openness: Assessing economic growth, CO2 emissions and the applicability of the cointegration analysis. Energy Strategy Rev. 2020, 30, 100488. [Google Scholar] [CrossRef]
- Meirun, T.; Mihardjo, L.W.; Haseeb, M.; Khan, S.A.R.; Jermsittiparsert, K. The dynamics effect of green technology innovation on economic growth and CO2 emission in Singapore: New evidence from bootstrap ARDL approach. Environ. Sci. Pollut. Res. 2021, 28, 4184–4194. [Google Scholar] [CrossRef] [PubMed]
- Hashmi, R.; Alam, K. Dynamic relationship among environmental regulation, innovation, CO2 emissions, population, and economic growth in OECD countries: A panel investigation. J. Clean. Prod. 2019, 231, 1100–1109. [Google Scholar] [CrossRef]
- Godil, D.I.; Yu, Z.; Sharif, A.; Usman, R.; Khan, S.A.R. Investigate the role of technology innovation and renewable energy in reducing transport sector CO2 emission in China: A path toward sustainable development. Sustain. Dev. 2021, 29, 694–707. [Google Scholar] [CrossRef]
- Braungardt, S.; Elsland, R.; Eichhammer, W. The environmental impact of eco-innovations: The case of EU residential electricity use. Environ. Econ. Policy Stud. 2016, 18, 213–228. [Google Scholar] [CrossRef]
- Wang, Z.; Yang, Z.; Zhang, Y.; Yin, J. Energy technology patents–CO2 emissions nexus: An empirical analysis from China. Energy Policy 2012, 42, 248–260. [Google Scholar] [CrossRef]
- Iqbal, Q.; Ahmad, N.H.; Nasim, A.; Khan, S.A.R. A moderated-mediation analysis of psychological empowerment: Sustainable leadership and sustainable performance. J. Clean. Prod. 2020, 262, 121429. [Google Scholar] [CrossRef]
- Chien, F.; Ajaz, T.; Andlib, Z.; Chau, K.Y.; Ahmad, P.; Sharif, A. The role of technology innovation, renewable energy and globalization in reducing environmental degradation in Pakistan: A step towards sustainable environment. Renew. Energy 2021, 177, 308–317. [Google Scholar] [CrossRef]
- Hu, Y.; Zheng, J. Is green credit a good tool to achieve “double carbon” goal? Based on coupling coordination model and PVAR model. Sustainability 2021, 13, 14074. [Google Scholar] [CrossRef]
- Ma, T.; Wang, Y. Globalization and environment: Effects of international trade on emission intensity reduction of pollutants causing global and local concerns. J. Environ. Manag. 2021, 297, 113249. [Google Scholar] [CrossRef] [PubMed]
- Zandi, G.; Haseeb, M. The role of trade liberalization in carbon dioxide emission: Evidence from heterogeneous panel estimations. Int. J. Financ. Res. 2019, 10, 228–240. [Google Scholar] [CrossRef]
- Grossman, G.M.; Krueger, A.B. Environmental Impacts of a North American Free Trade Agreement; National Bureau Of Economic Research: Cambridge, MA, USA, 1991. [Google Scholar]
- Chang, S.-C.; Chang, H.-F. Same Trade Openness Yet Different Environmental Quality—But Why? J. Int. Commer. Econ. Policy 2020, 11, 2050002. [Google Scholar] [CrossRef]
- Oh, K.-Y.; Bhuyan, M.I. Trade openness and CO2 emissions: Evidence of Bangladesh. Asian J. Atmos. Environ. 2018, 12, 30–36. [Google Scholar] [CrossRef]
- Lin, B.; Xu, M. Does China become the “pollution heaven” in South-South trade? Evidence from Sino-Russian trade. Sci. Total Environ. 2019, 666, 964–974. [Google Scholar] [CrossRef]
- Tasri, E.S.; Karimi, K. Emission Study And Pollution Heaven Hypothesis In Economic Development Of Developed Country. In Proceedings of the The First Economics, Law, Education and Humanities International Conference, Padang, Indonesia, 14 August 2018; Universitas Bung Hatta Repository: Southampton, UK, 2019. [Google Scholar]
- Shoaib, H.M.; Rafique, M.Z.; Nadeem, A.M.; Huang, S. Impact of financial development on CO2 emissions: A comparative analysis of developing countries (D8) and developed countries (G8). Environ. Sci. Pollut. Res. 2020, 27, 12461–12475. [Google Scholar] [CrossRef] [PubMed]
- Zhang, Y.-J. The impact of financial development on carbon emissions: An empirical analysis in China. Energy Policy 2011, 39, 2197–2203. [Google Scholar] [CrossRef]
- Shahbaz, M.; Tiwari, A.; Nasir, M. The effects of financial development, economic growth, coal consumption and trade openness on CO2 emissions in South Africa. Energy Policy 2013, 61, 1452–1459. [Google Scholar] [CrossRef]
- Khan, M.; Ozturk, I. Examining the direct and indirect effects of financial development on CO2 emissions for 88 developing countries. J. Environ. Manag. 2021, 293, 112812. [Google Scholar] [CrossRef] [PubMed]
- Le, T.-H.; Le, H.-C.; Taghizadeh-Hesary, F. Does financial inclusion impact CO2 emissions? Evidence from Asia. Financ. Res. Lett. 2020, 34, 101451. [Google Scholar] [CrossRef]
- Phong, L. Globalization, financial development, and environmental degradation in the presence of environmental Kuznets curve: Evidence from ASEAN-5 countries. Int. J. Energy Econ. Policy 2019, 9, 40–50. [Google Scholar]
- Hafeez, M.; Chunhui, Y.; Strohmaier, D.; Ahmed, M.; Jie, L. Does finance affect environmental degradation: Evidence from One Belt and One Road Initiative region? Environ. Sci. Pollut. Res. 2018, 25, 9579–9592. [Google Scholar] [CrossRef]
- Sethi, P.; Chakrabarti, D.; Bhattacharjee, S. Globalization, financial development and economic growth: Perils on the environmental sustainability of an emerging economy. J. Policy Modeling 2020, 42, 520–535. [Google Scholar] [CrossRef]
- Xiong, L.; Qi, S. Financial development and carbon emissions in Chinese provinces: A spatial panel data analysis. Singap. Econ. Rev. 2018, 63, 447–464. [Google Scholar] [CrossRef]
- Rajan, R.; Zingales, L. Financial dependence and growth. American Econo. Rev. 1998, 88, 559–586. [Google Scholar]
- Beck, T. Financial development and international trade: Is there a link? J. Int. Econ. 2002, 57, 107–131. [Google Scholar] [CrossRef]
- Carlin, W.; Mayer, C. Finance, investment, and growth. J. Financ. Econ. 2003, 69, 191–226. [Google Scholar] [CrossRef]
- Fisman, R.; Love, I. Financial Development and Growth in the Short and Long Run; National Bureau of Economic Research: Cambridge, MA, USA, 2004. [Google Scholar]
- Yakubu, A.S.; Aboagye, A.Q.; Mensah, L.; Bokpin, G.A. Effect of financial development on international trade in Africa: Does measure of finance matter? J. Int. Trade Econ. Dev. 2018, 27, 917–936. [Google Scholar] [CrossRef]
- Chan, J.M.; Manova, K. Financial development and the choice of trade partners. J. Dev. Econ. 2015, 116, 122–145. [Google Scholar] [CrossRef]
- Gnangnon, S.K. Multilateral trade liberalization and economic growth. J. Econ. Integr. 2018, 33, 1261–1301. [Google Scholar] [CrossRef]
- Ibrahim, M.; Sare, Y.A. Determinants of financial development in Africa: How robust is the interactive effect of trade openness and human capital? Econ. Anal. Policy 2018, 60, 18–26. [Google Scholar] [CrossRef]
- Ashraf, B.N. Do trade and financial openness matter for financial development? Bank-level evidence from emerging market economies. Res. Int. Bus. Financ. 2018, 44, 434–458. [Google Scholar] [CrossRef]
- Zhang, C.; Zhu, Y.; Lu, Z. Trade openness, financial openness, and financial development in China. J. Int. Money Financ. 2015, 59, 287–309. [Google Scholar] [CrossRef]
- Le, T.-H.; Tran-Nam, B. Trade liberalization, financial modernization and economic development: An empirical study of selected Asia–Pacific countries. Res. Econ. 2018, 72, 343–355. [Google Scholar] [CrossRef]
- Wangwe, S.M. Exporting Africa: Technology, Trade and Industrialization in Sub-Saharan Africa; Wangwe, S.M., Ed.; Routledge/UNU Press: London, UK, 1995. [Google Scholar]
- Charfeddine, L.; Kahia, M. Impact of renewable energy consumption and financial development on CO2 emissions and economic growth in the MENA region: A panel vector autoregressive (PVAR) analysis. Renew. Energy 2019, 139, 198–213. [Google Scholar] [CrossRef]
- Zhu, X.; Lu, Y. Fiscal and taxation policies, economic growth and environmental quality: An analysis based on PVAR model. IOP Conf. Series: Earth Environ. Sci. 2019, 227, 052041. [Google Scholar] [CrossRef]
- Su, Y.; Li, D. Interaction effects of government subsidies, R&D input and innovation performance of Chinese energy industry: A panel vector autoregressive (PVAR) analysis. Technol. Anal. Strateg. Manag. 2021, 1–15. [Google Scholar] [CrossRef]
- Battese, G.E.; Coelli, T.J. A model for technical inefficiency effects in a stochastic frontier production function for panel data. Empir. Econ. 1995, 20, 325–332. [Google Scholar] [CrossRef]
Publisher’s Note: MDPI stays neutral with regard to jurisdictional claims in published maps and institutional affiliations. |
© 2022 by the authors. Licensee MDPI, Basel, Switzerland. This article is an open access article distributed under the terms and conditions of the Creative Commons Attribution (CC BY) license (https://creativecommons.org/licenses/by/4.0/).