Abstract
(1) Background: Recently, secondary soil salinization has frequently occurred in ecological water conveyance and irrigation areas. Therefore, monitoring the information on soil salinization in the conveyance irrigation area and analyzing the change process of soil salinization are of great significance to both environmental improvement and salinization management. (2) Methods: This study takes the Shiyang River’s terminal lake—Qingtu Lake—and its surroundings as the research area. The salinization index was extracted by remote sensing data and methods, and a comprehensive salinization model (CSI) was established. Firstly, the spatial distribution regular of soil salinization, since ecological water conveyance was explored, and the change trends in soil salinization were analyzed. Secondly, the relationship between the change characteristics of soil salinization and groundwater, water area changes and land use types were analyzed. (3) Results: The Kappa coefficient between the soil salinization extracted by CSI and the measured data reached 0.703, and CSI can accurately monitor soil salinization information. From 2011 to 2020, the non-salinized land increased by 2.1%, mild and moderate salinization decreased by 5.7% and 3.9%, respectively, and severe salinization increased by 7.5%. The salinization in the lake area showed a decreasing trend, and the periphery of the lake area showed an increasing trend. Groundwater, water area changes and land use type have certain influences on soil salinization in the study area. (4) Conclusion: Since ecological water conveyance, the total proportion of soil salinized area in Qingtu Lake and its surrounding areas has not changed much, but there are certain changes between different grades of salinized land. The areas with changes to the level of salinization are mainly shallow, unstable water areas, saline–alkali land, wetlands and sandy land, and there are secondary salinization problems in these areas.
1. Introduction
Land is the material basis for human survival and labor, and the most basic and precious resource for human production and life [1]. Soil salinization, as a type of soil desertification, is one of the most important and most widespread environmental problems in arid and semi-arid regions worldwide [2,3]. The global area of salinized land has reached about 1 billion hectares, accounting for 7% of the total land area [4,5], and the secondary salinized area has reached 77 million hectares, of which 58% are concentrated in irrigated areas, that is, nearly 20% of the world’s irrigated areas have secondary soil salinization [6,7].
Remote sensing and geographic information technology have become important data methods for soil salinization monitoring and analysis [8,9]. Based on remote sensing data, scholars, both domestic and abroad, have done a lot of research on soil salinization [10,11,12,13,14,15], and research on the response of soil salinization to changes in water resources has become a hot topic [16,17,18], but many such studies focus on coastal areas [19,20]. Due to differences in geographical location, climatic conditions, and changes in water resources, soil salinization has different effects; large-scale human interventions such as ecological water conveyance and irrigation can, especially, rapidly change regional water resource conditions. However, in the context of secondary soil salinization in nearly 20% of the world’s irrigated areas, the response process of soil salinization in inland river basins in arid regions to ecological water conveyance and the characteristics of areas where secondary soil salinization occurs still need to be further studied.
The Shiyang River Basin is a typical arid inland river basin [21,22], located in the northeast of Minqin County, in the southeast of the Badain Jaran Desert and the west of the Tengger Desert. The terminal lake of the Shiyang River—Qingtu Lake—is an important ecological barrier to preventing the connection between the two deserts [23]. However, because the annual rainfall in the Qingtu Lake area is only 110 mm, the evaporation is as high as 2644 mm, and the dryness is greater than 5 degrees. With 3028 h of sunshine, the average annual temperature is 7.7 °C, and the temperature difference between day and night is 15.2 °C; this area is mainly alkaline soil, with a pH of more than 8, which is one of the driest and most severe desertification areas in China [23]. With the drying of Qingtu Lake in the 1950s, the regional desertification problem has become the main ecological problem to be solved urgently in the Qingtu Lake area. To this end, in response to the government’s call to “don’t let Qingtu Lake become the second Lop Nur” [24], in 2010, Hongyashan Reservoir began carrying out ecological water conveyance to Qingtu Lake, which has been in operation for more than ten years. Since the ecological water conveyance, the ecological environment of the Qingtu Lake area has attracted the attention of scholars. A series of studies have also been carried out [25,26,27,28]. However, there are few studies on the process of ecological water conveyance in soil salinization [29,30].
Therefore, this study takes Qingtu Lake and its surroundings as the research area, uses remote sensing data combined with ground-measured data to establish a soil salinization index model, and uses the measured data to verify the model. The spatial and temporal characteristics of soil salinization in the study area from 2011 to 2020 were quantitatively analyzed, and the effects of groundwater, water area changes and soil types on soil salinization were discussed. It has an important reference value for ecological governance and land resource protection decision making.
2. Materials and Methods
2.1. Data Sources
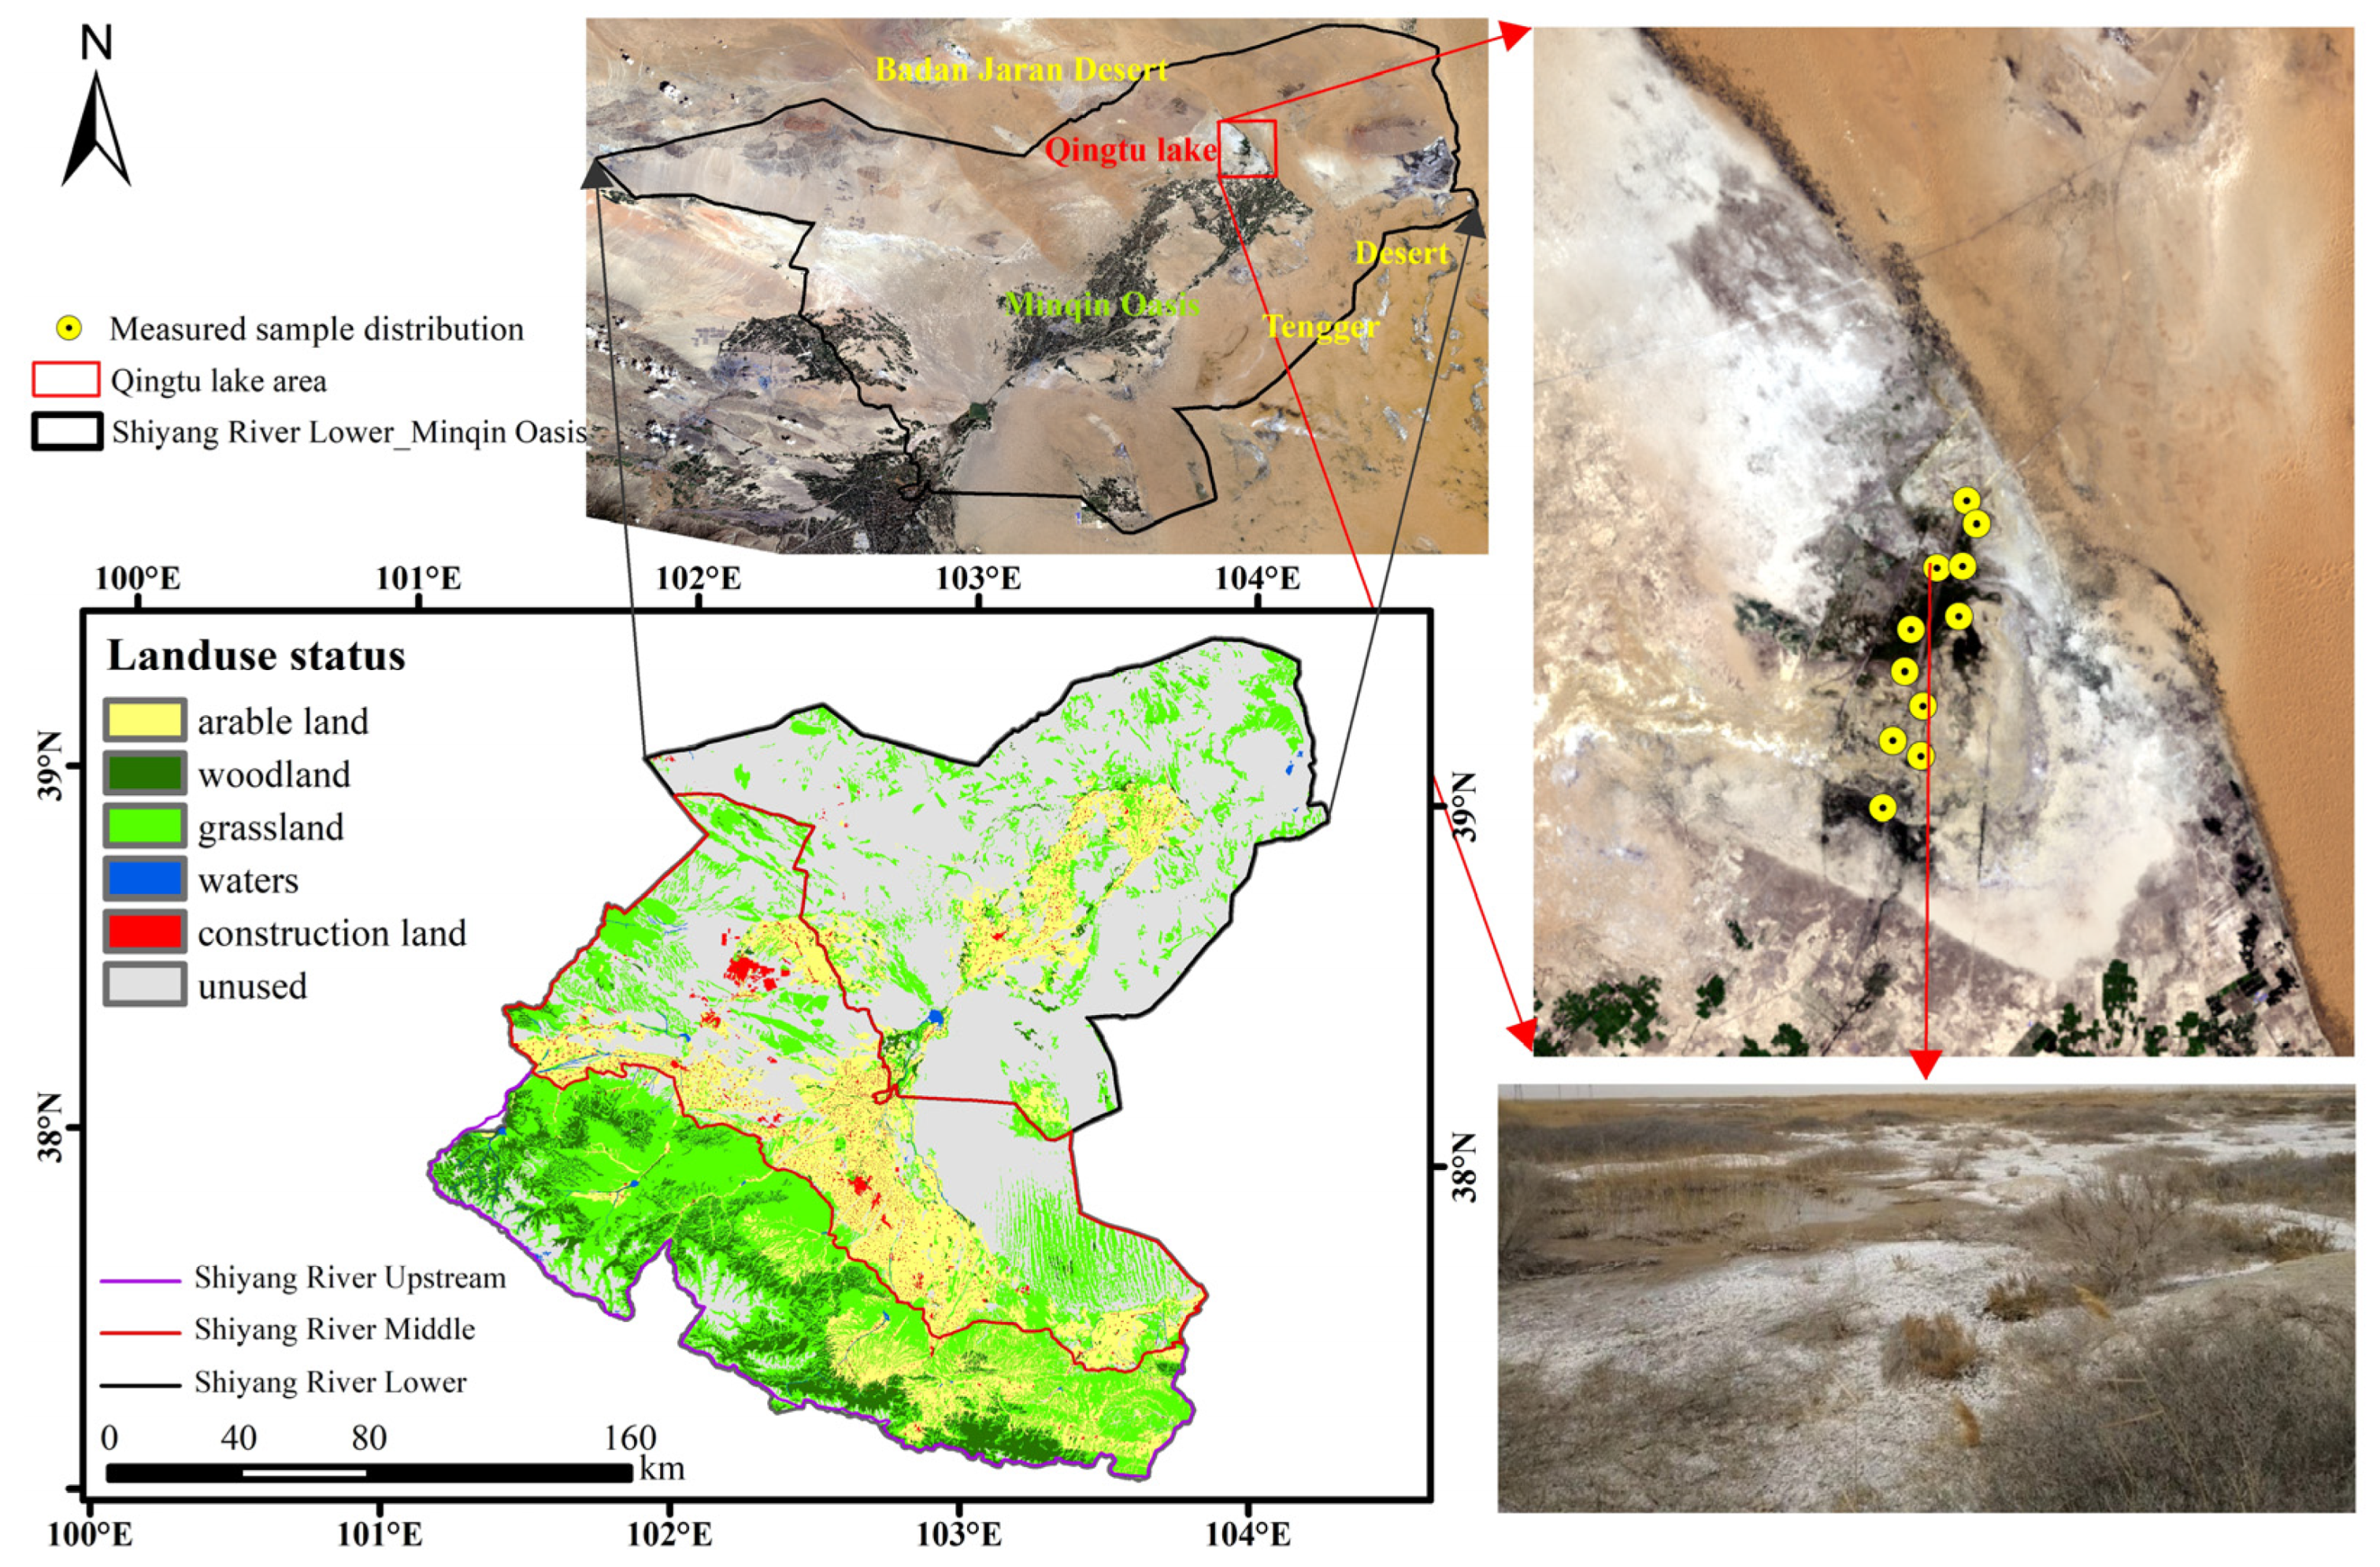
The data names, data sources and descriptions used in this paper are shown in (Table 1), and the spatial distribution of the measured sample data is shown in (Figure 1).

Table 1.
Presentation of the study data.

Figure 1.
Diagram of the location of the study area.
2.2. Research Methods
2.2.1. Comprehensive Salinization Index Model (CSI)
Previous studies have shown that the combined calculation of visible blue light, red light and near-infrared wavelengths can better reflect soil salinization information [31,32]. In this paper, five salinity indices that are more accurate in extracting soil salinization information are selected, and the calculation formula is shown in (Table 2). In the formula, R, G, B and NIR represent the reflectance of the image in the red, green, blue and near-infrared bands, respectively, and L is the soil adjustment factor, which ranges from 0 to 1 [33,34]. In this study, this value was 0.5.
Table 2.
Index information and its calculation formula.
For the calculated salinity index and environmental index, the weight value of each index is determined according to the principle of principal component analysis, and the comprehensive soil salinization index model is established using the multiple regression model. The comprehensive index calculation formula is shown in (1) [35]:
In the formula, CSI is the comprehensive salt index, n is the number of indexes, Wi is the weight of index i (i = 1, 2,…, n) and Ci is the i-th index value.
2.2.2. Trend Analysis
Trend analysis can detect the time change characteristics of soil salinization in each grid, thereby comprehensively reflecting the long-term sequence changing trend of soil salinization in the study area [36].
This study uses the trend analysis method to calculate the slope and explores the time trend of soil salinization. A negative slope indicates weakening of soil salinization, a positive slope indicates an increase in soil salinization [30,37]; based on the p value of the F test to express whether the change is significant or not, the trend of change is divided into five levels: a significant decrease (slope < 0, p < 0.01), decreased (slope < 0, 0.01 < p < 0.05), not significantly changed (p > 0.05), increased (slope > 0, 0.01 < p < 0.05) and significantly increased (slope > 0, p < 0.01); the calculation formula is as follows (2) [38]:
In the formula, CSIi is the normalized to obtain the comprehensive soil salinization index (CSI) in the i-th year and the value of i is (i = 1, 2, …, n).
2.2.3. Kappa Coefficient
The Kappa coefficient is an indicator used for consistency checks and can also be used to measure the effect of classification. It is a multivariate discrete method to evaluate the classification accuracy and error matrix of remote sensing images. The overall classification accuracy only considers the number of correctly classified cells in the diagonal direction, while the Kappa coefficient considers various missed and misclassified cells outside the diagonal. The Kappa coefficient is calculated as follows) [39]:
In the formula, is the number of correctly classified pixels on the diagonal, is the sum of the pixels of the entire matrix, is the multiplication of the sum of the elements in the i-th row and the sum of the elements in the i-th column, and is the sum of all elements of the matrix squares.
3. Results and Analysis
3.1. The Variation Characteristics of Salinization
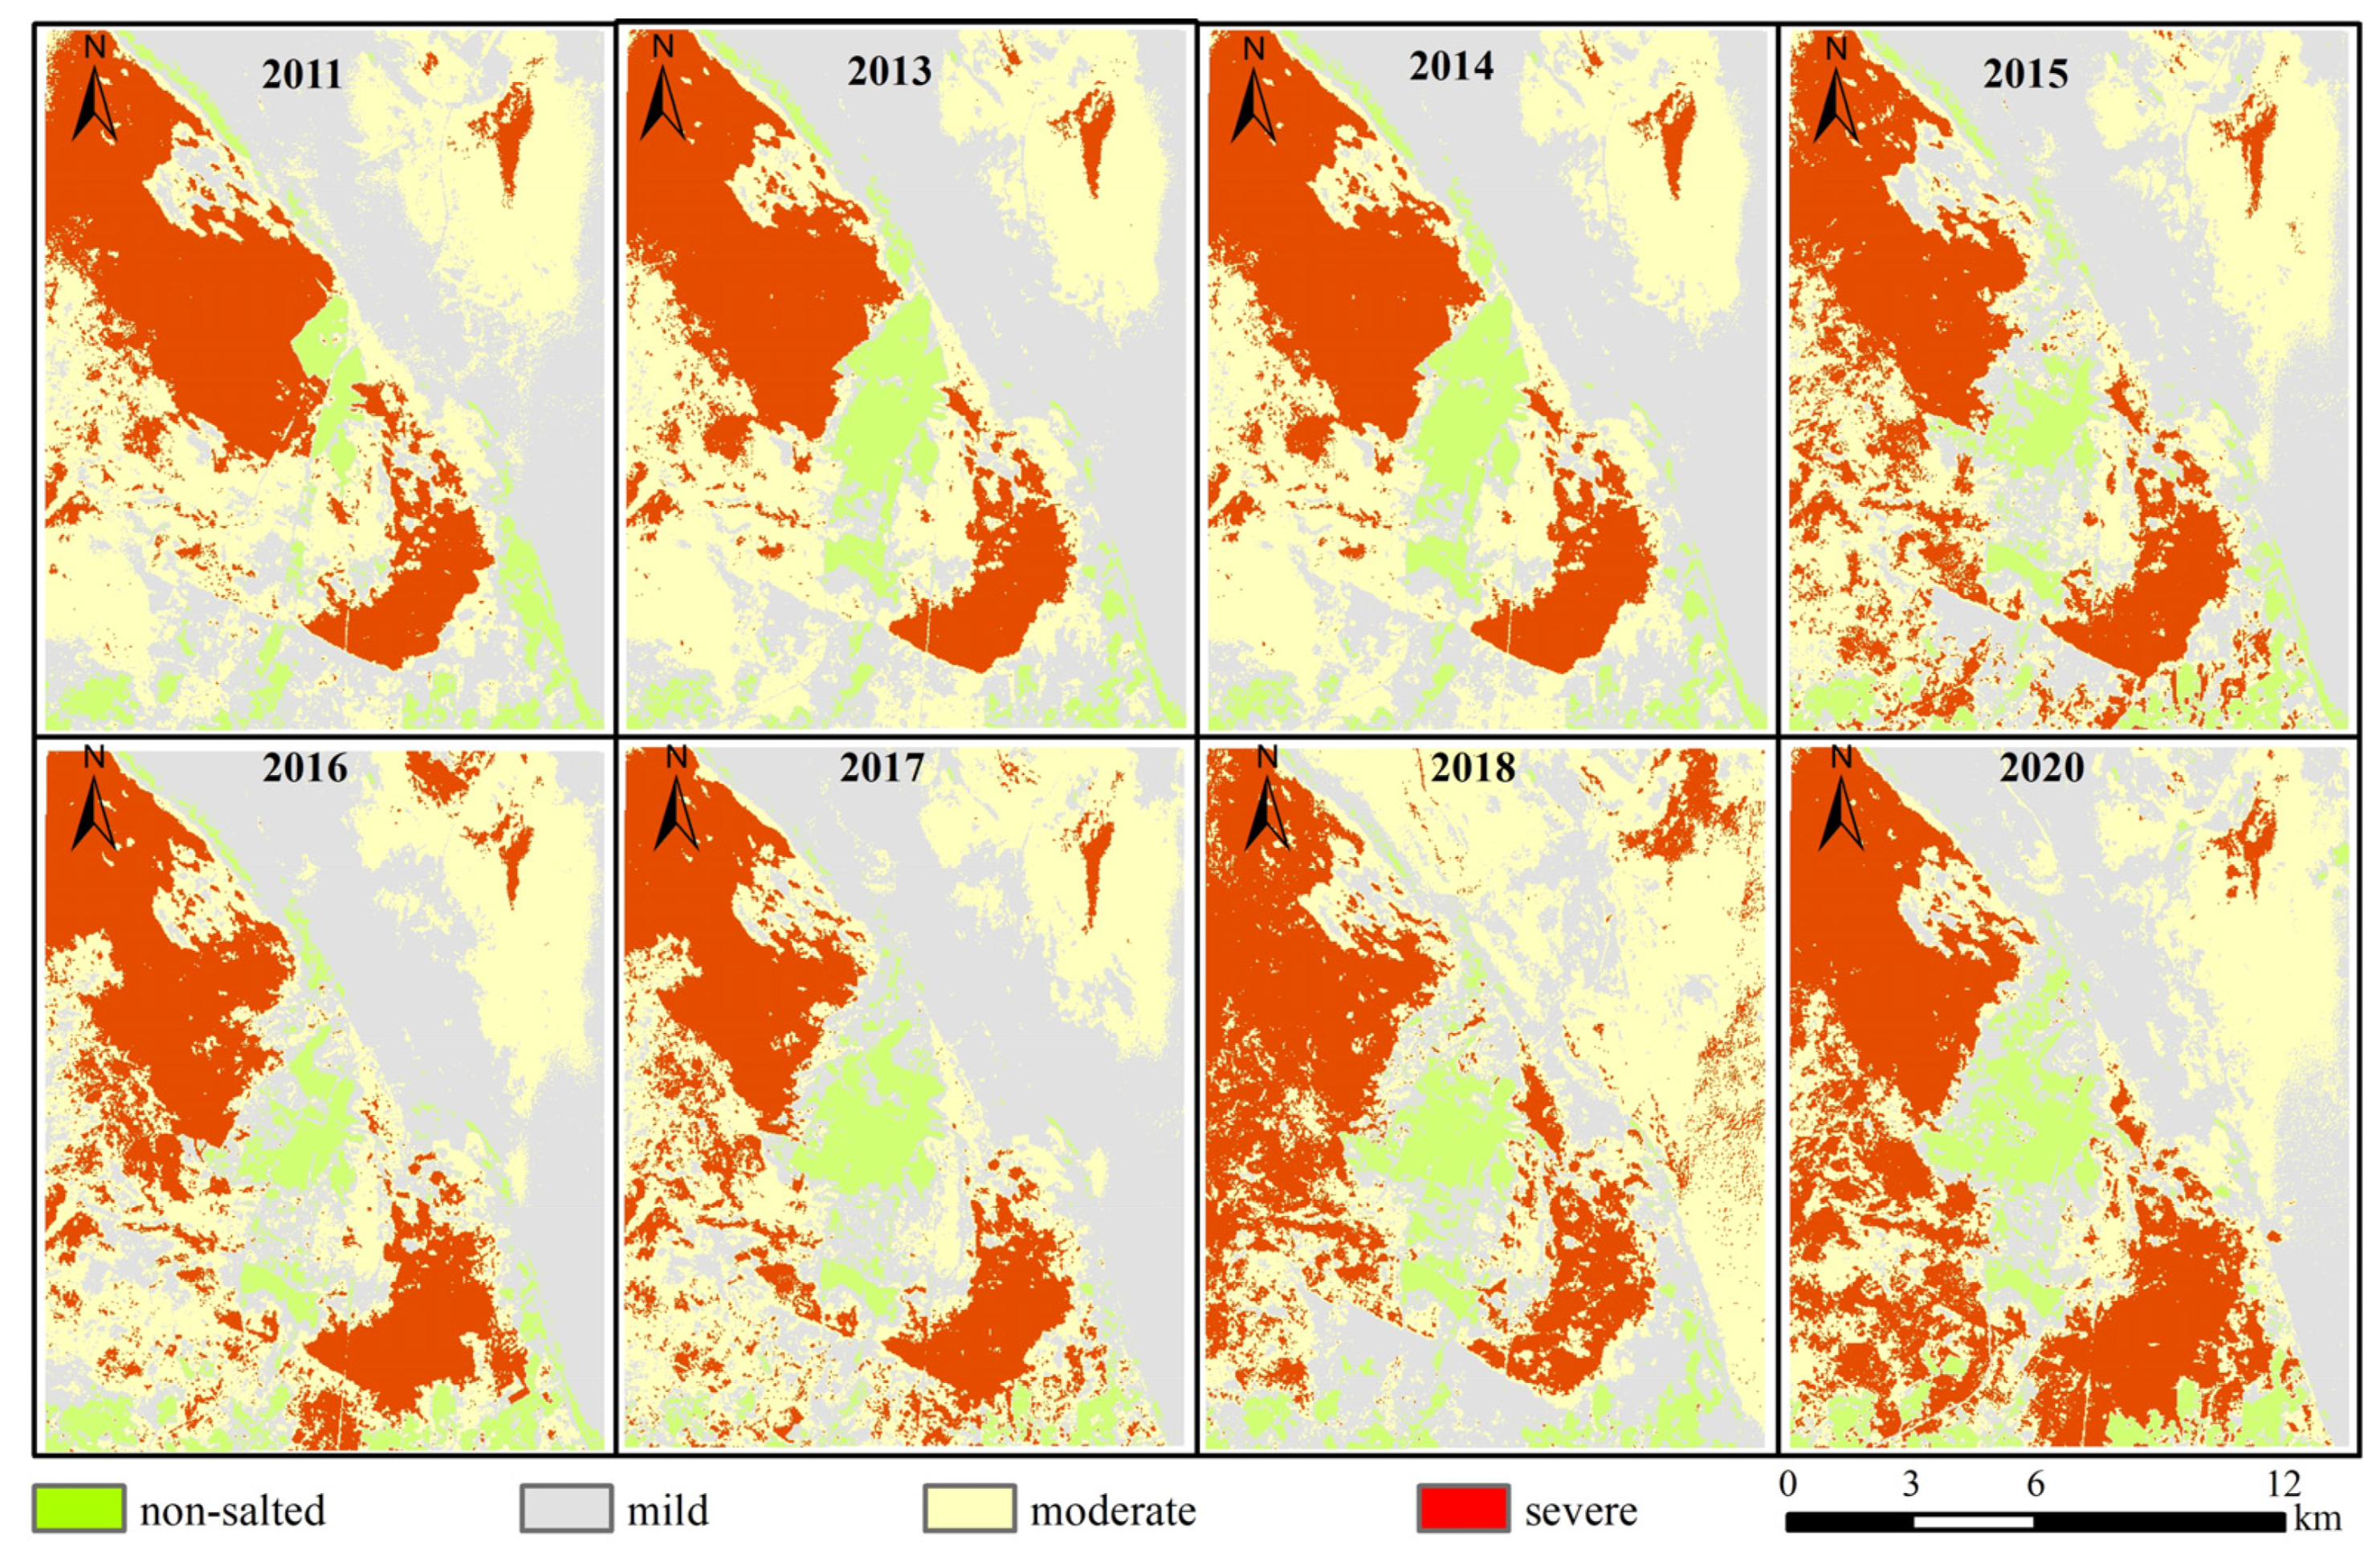
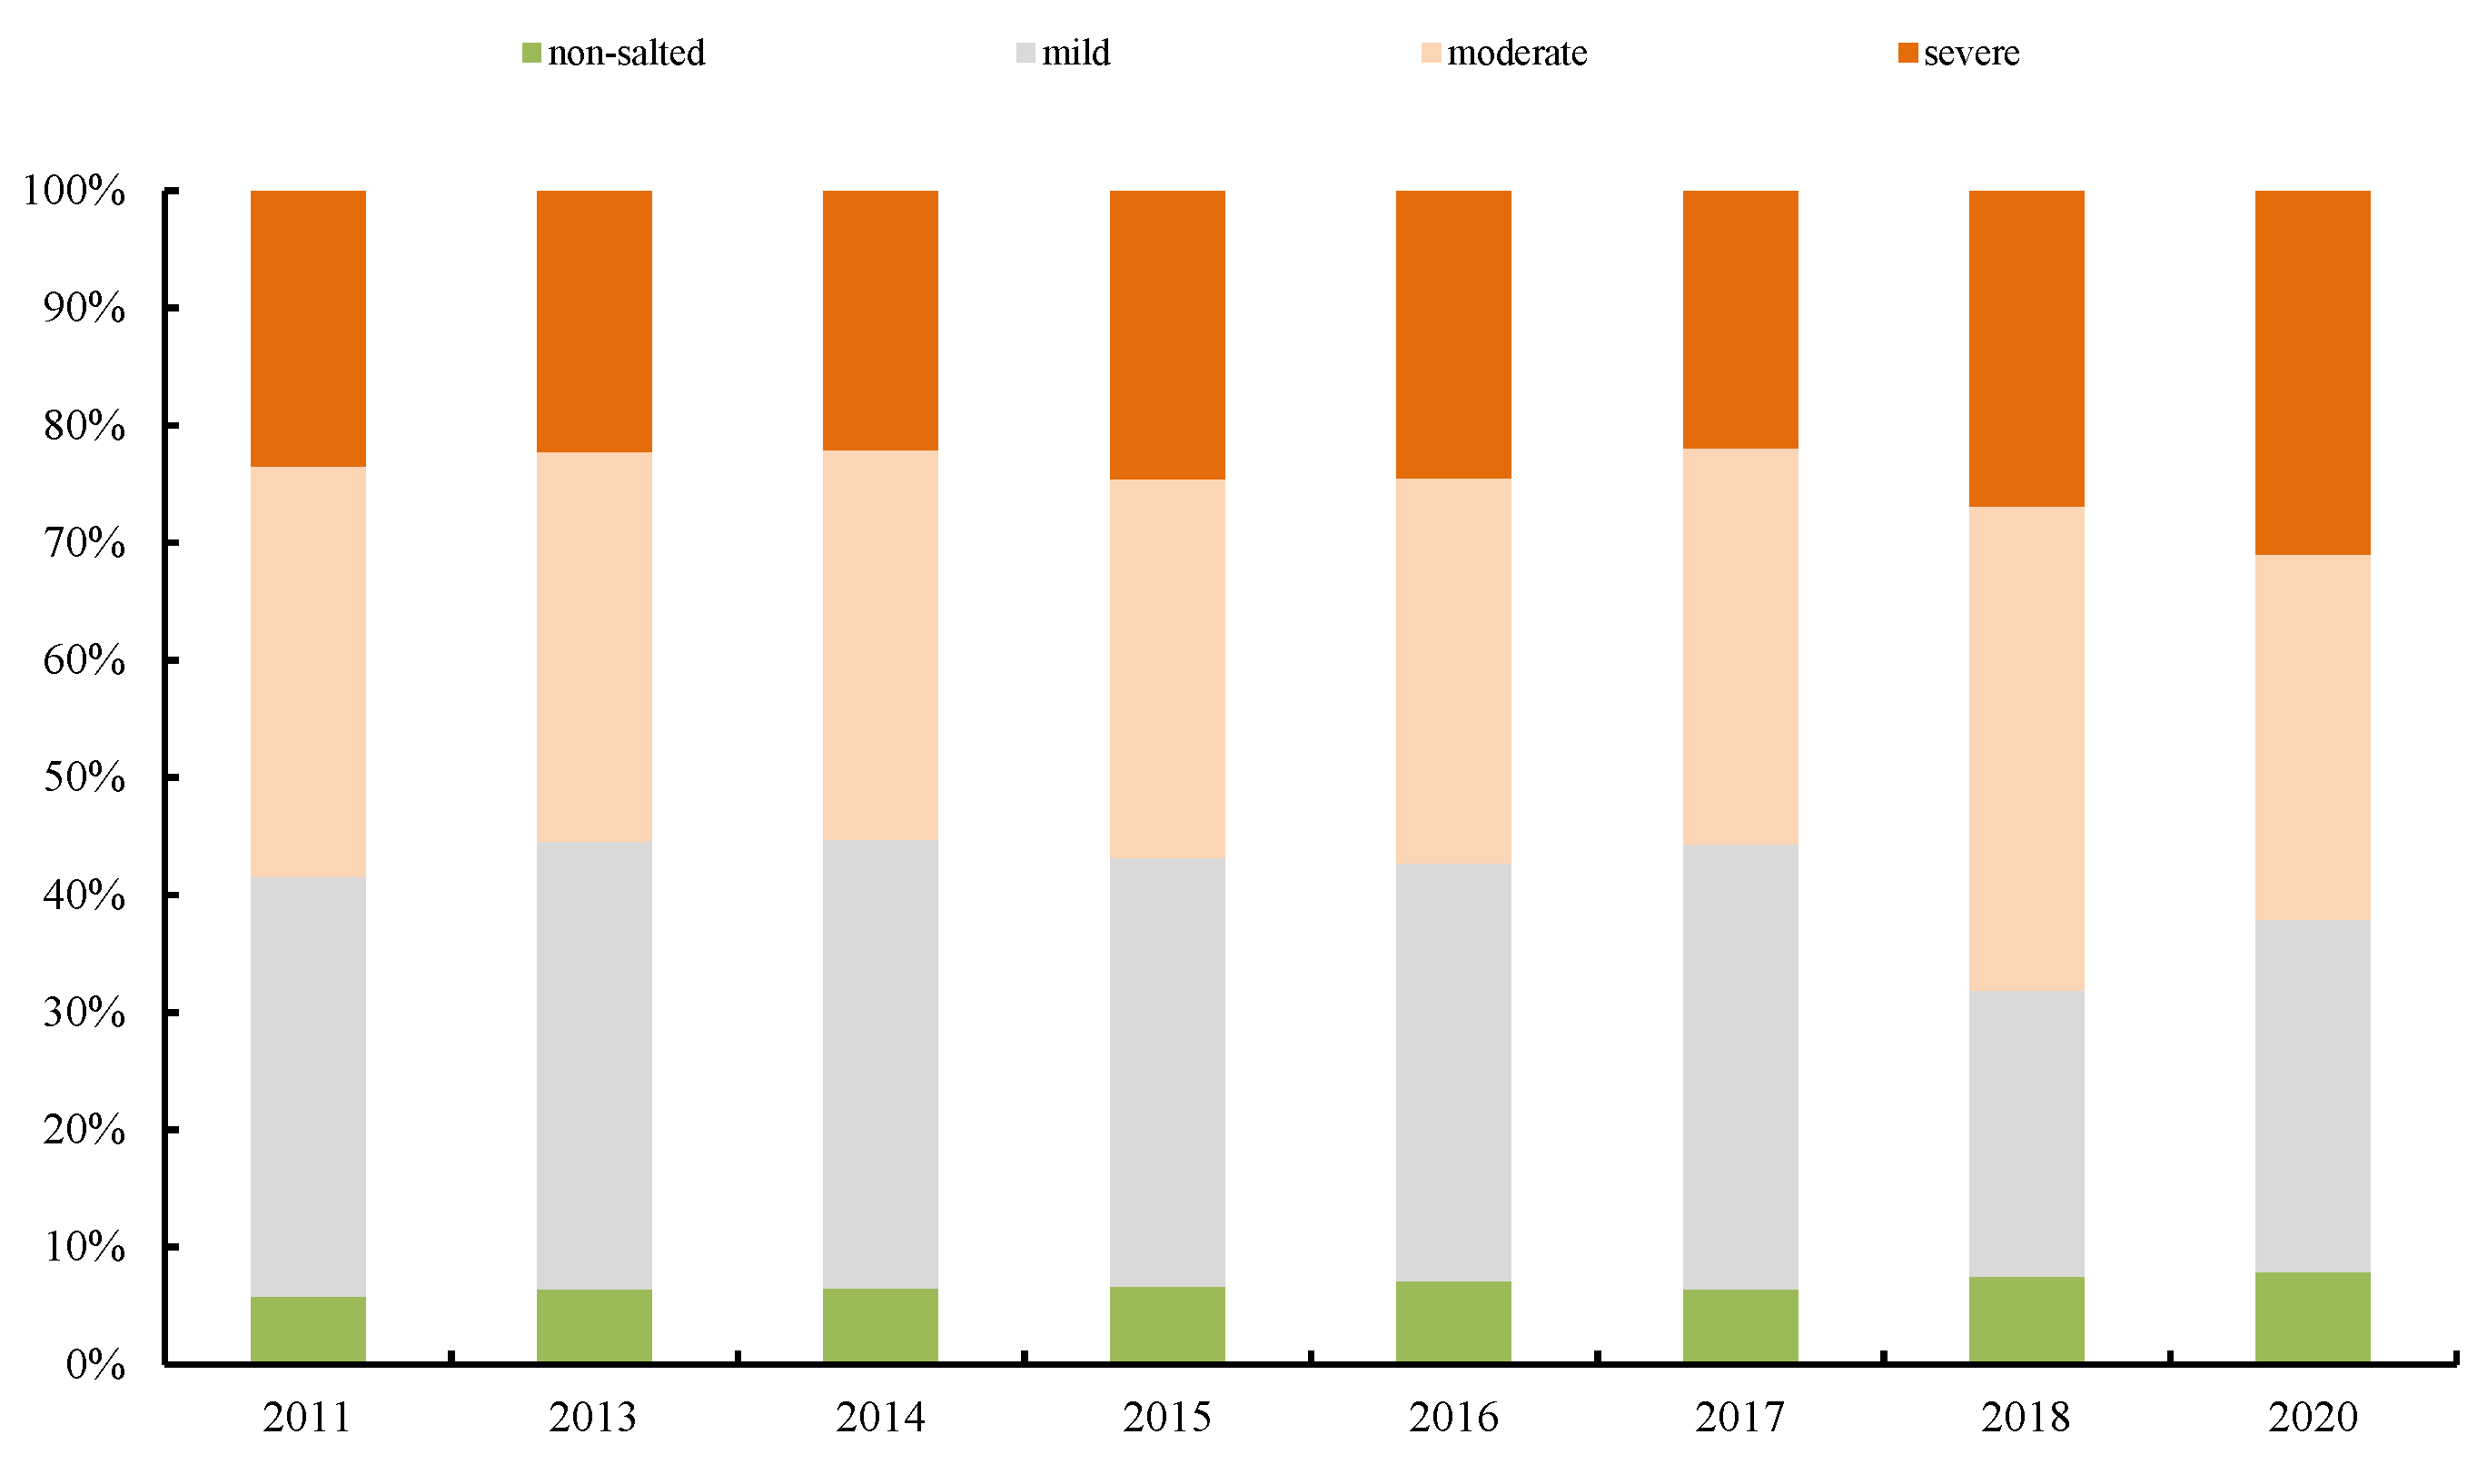
The spatial differentiation of soil salinization in the study area was obvious (Figure 2). The water and vegetation coverage areas were mainly non-salinized land, while the northwest and southeast of Qingtu Lake were mostly severely salinized. The central lake area and its periphery were mildly and moderately salinized. From 2011 to 2020, the changes of non-salinized land and severely salinized land were obvious. Severely salinized land was showed to increase, and the main area of change was the southern part of Qingtu Lake. The soil salinization in the study area was serious, with an average annual proportion of severely salinized land as high as 24.6%, among which, the largest proportion of severely salinized land reached 31% in 2020 (Figure 3). The average annual proportion of moderately salinized land was 34%, with the largest percentage of at 41% in 2018. Mildly salinized land occupied an average annual land area of 34.5% and, in 2014, this land accounted for the largest proportion, reaching 38.2%. The average share of non-saline land is 6.8%, with a minimum of 5.8% in 2011 and a maximum of 7.9% in 2020.

Figure 2.
Spatial distribution characteristics of soil salinization.
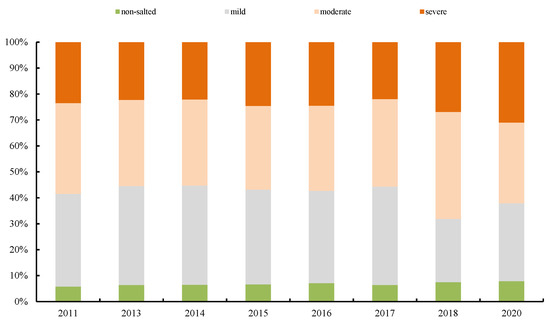
Figure 3.
Statistics on the proportion of different levels of soil salinized land from 2011 to 2020.
3.2. Trend Analysis
Trend analysis can quantitatively display the change characteristics of soil salinization in the study area in a long-time series and visualize the spatial change process of soil salinization. The spatial analysis characteristics of the change trend of soil salinization in Qingtu Lake and its surrounding areas were significant (Figure 4). Over the last decade of ecological water conveyance, there has been both increasing and decreasing trends in soil salinization. The proportion of land with an increasing trend was 47.9% and the proportion of land with a decreasing trend was 13.2%. The proportion with an increasing trend was much larger than that with a decreasing trend, which indicates an overall increasing trend of soil salinity in the study area from 2011 to 2022. The areas with an increasing trend of soil salinization were mainly the periphery of the central lake area and the northwestern and southeastern parts of Qingtu Lake, which indicate that the soil salinization in these areas has increased and there has been secondary salt accumulation.
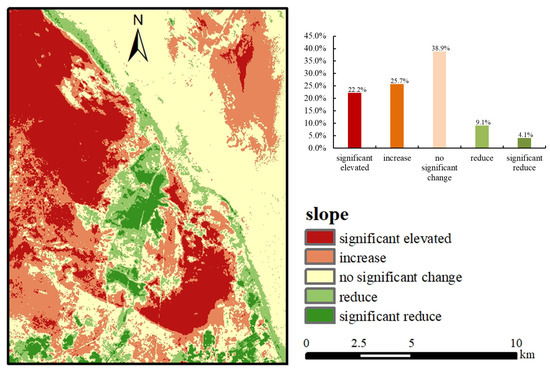
Figure 4.
Trend of soil salinization from 2011 to 2020.
3.3. CSI Model Verification
To verify the accuracy of the CSI model in estimating soil salinization information, the soil salinity measured by the soil salinity meter in 2018 was compared with the salinization degree estimated by the CSI at the corresponding point, as shown in (Table 3). According to our classification standards of soil salinization in arid and semi-arid regions of China, the measured soil salinity was divided into four levels: non-salinized, mild salinization, moderate salinization and severe salinization. The results of calculation by CSI were classified: severe salinization (CSI > 0.6), moderate salinization (0.4 < CSI < 0.6), mild salinization (0.2 < CSI < 0.4) and non-salted land (CSI < 0.2). It can be seen that 77.8% of the predicted results are the same as the actual measured results, and 22.2% of the predicted results are different. Among them, the proportion of moderate salinization estimated to be mild salinization is 3.7%, the proportion of non-salted land estimated to be mild salinization is 7.4%, and the proportion of moderate salinization estimated to be severe salinization is 11.1%. The calculated Kappa coefficient of the measured and the estimated data was 0.703, which has a high consistency. This suggests that CSI’s estimation of soil salinization was relatively accurate.
Table 3.
Statistics of predicted and measured values at soil salinization in different levels.
4. Discussion
Soil salinization is the redistribution of various soluble salts in the horizontal and vertical directions of the soil under the combined action of certain natural conditions, such as climate, hydrology, soil texture, and human activities such as irrigation. The process of accumulation of soluble salts on the surface occurs through water evaporation. In this process, the climate is the main driving force, hydrological conditions are the key factor, and human activities are an important factor affecting salinized soil [30]. However, the dominant factors affecting soil salinization differ in different study areas. This paper discussed the relationship between soil salinization in the Qingtu Lake area and groundwater, water area and land use types since ecological water conveyance began.
4.1. Relationship between Groundwater and Soil Salinization
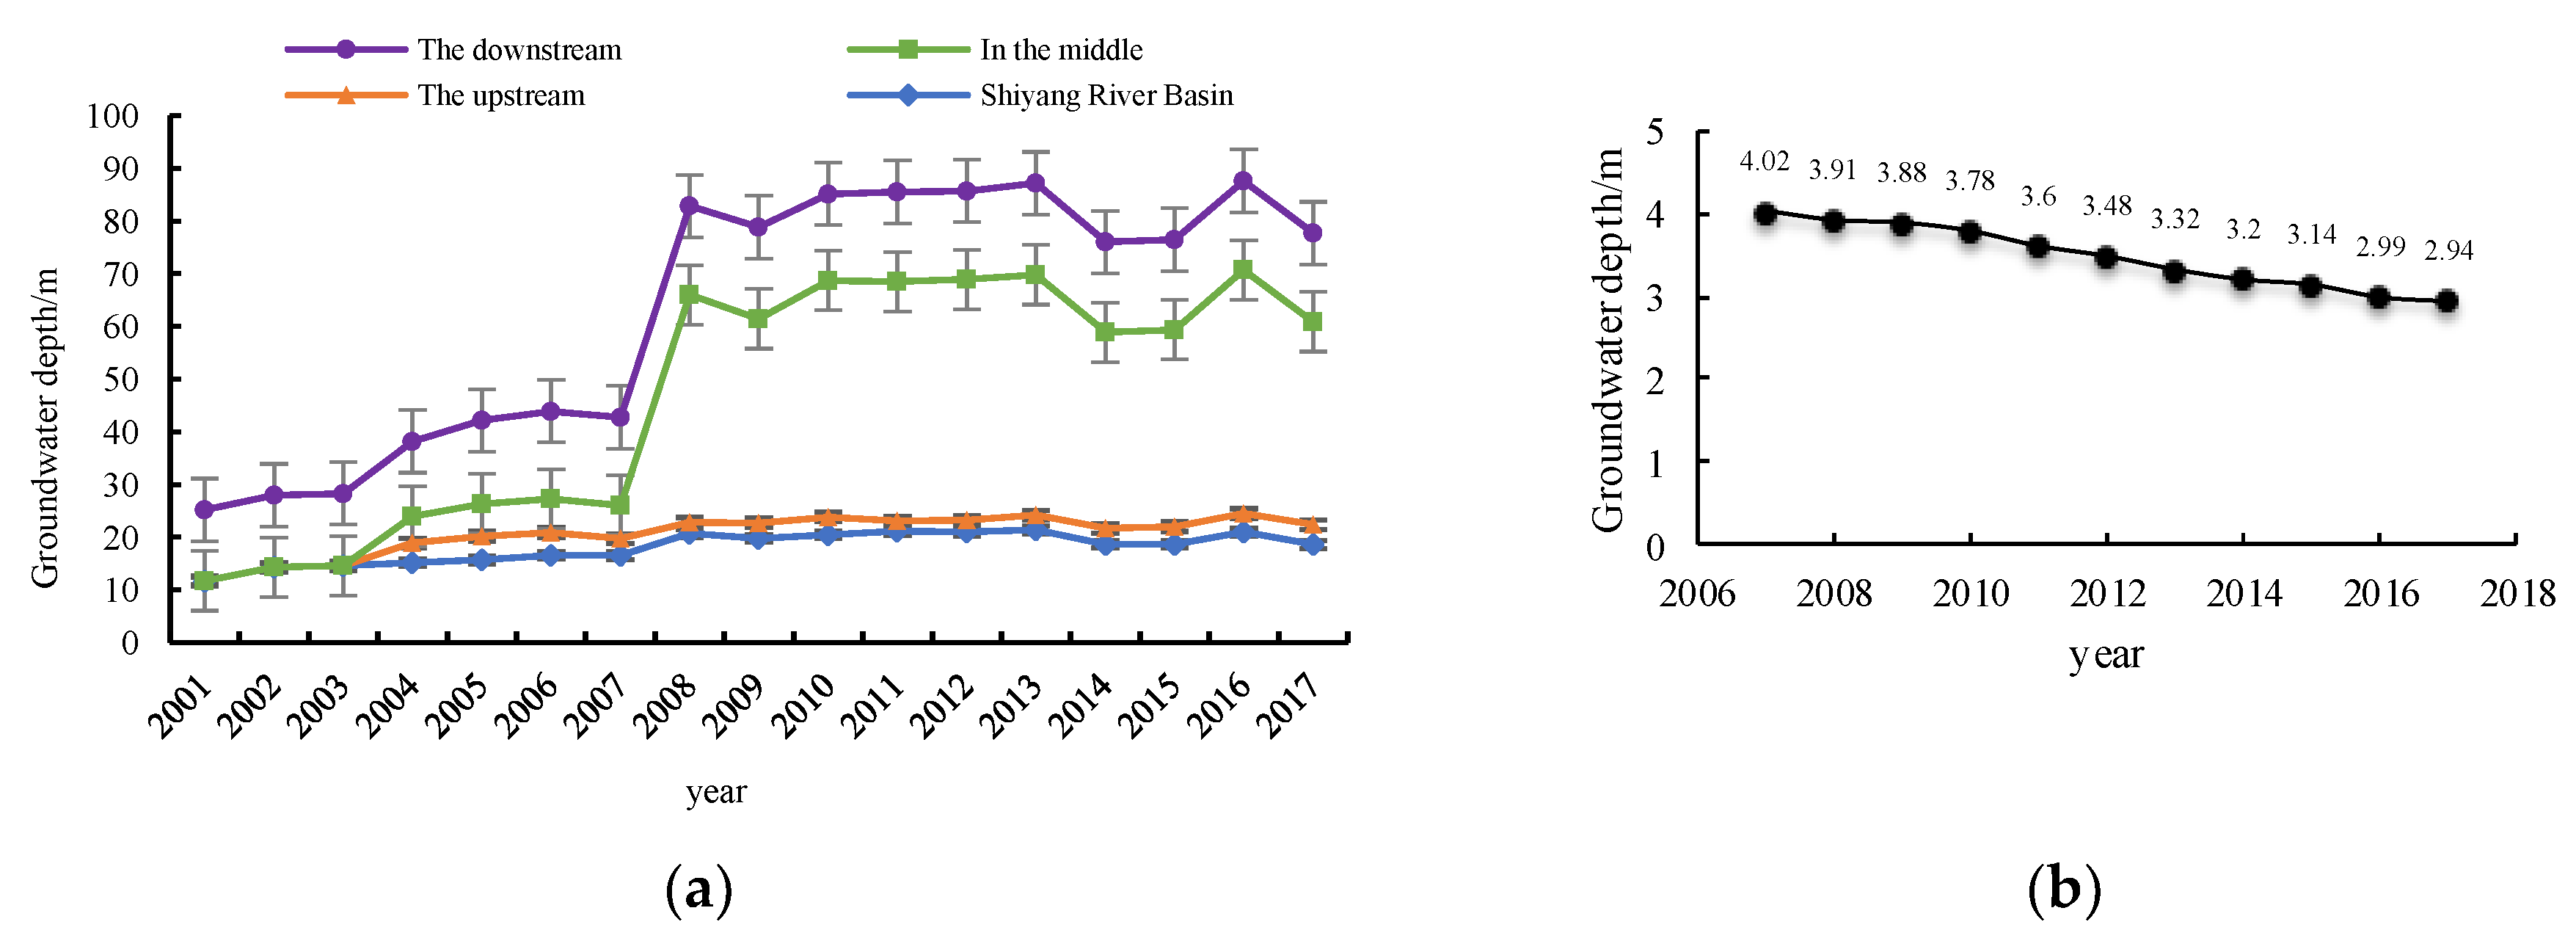
In arid and semi-arid regions, groundwater level is an important factor affecting soil salinization. As a typical arid inland river basin, the Shiyang River is short of groundwater resources, and the groundwater levels in the upper, middle and lower reaches are very different. The characteristics of the groundwater level (Figure 5a) show that the groundwater level in the entire basin and upstream area of the Shiyang River is relatively high, and there is no obvious interannual variation; inadequate natural groundwater recharges in downstream areas. According to the data provided by the Minqin County Environmental Governance Bulletin, the groundwater level in the Qingtu Lake area rose from 2006 to 2018 (Figure 5b). The rising groundwater level in the Qingtu Lake area year by year was mainly the result of human intervention, which was closely related to the ecological governance of the Qingtu Lake area. However, due to arid climate conditions, the shallow groundwater table continued to evaporate, and the salt in the groundwater accumulated on the surface, resulting in the formation of large areas of salinized land. The large proportion of heavily salinized land in Qingtu Lake area had a s relationship with the high-groundwater level.
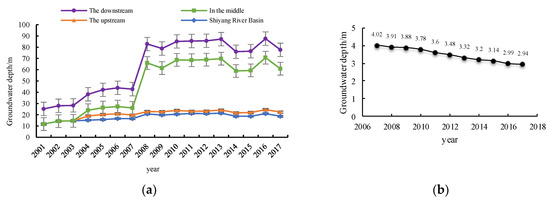
Figure 5.
Characteristics of changes in groundwater levels. (a) Interannual variation characteristics of groundwater levels in the upper, middle and lower reaches of the Shiyang River; (b) Interannual variation characteristics of groundwater level in Qingtu Lake area.
4.2. The Relationship between Ecological Water Conveyance and Soil Salinization
Since the implementation of ecological water conveyance, water has been formed in the Qingtu Lake area, and the groundwater level has risen. The effect of groundwater on soil salinization is long-term and stable. To further discuss the specific impact process of ecological water conveyance on soil salinization, this paper used supervised classification to extract the water surface formed by Qingtu Lake from 2010 to 2020 and monitored the change in water area through spatial analysis. It was divided into a stable water catchment area and a shallow, unstable water catchment area (Figure 6). Since the ecological water conveyance began in 2010, the water area formed by Qingtu Lake has gradually increased, but the water area is unstable. During the field investigation, it was also found that most of the waters in the Qingtu Lake area were shallow, unstable water areas, and these areas had both heavily salinized and non-salinized areas. Severely salinized land was caused by the evaporation of water in shallow, unstable water accumulation areas under dry climate conditions, resulting in the accumulation of salts on the surface. The non-salinized land was due to the formation of desertification wetlands in some shallow, unstable water accumulation areas, and there were certain reasons for the growth of drought-tolerant plants.
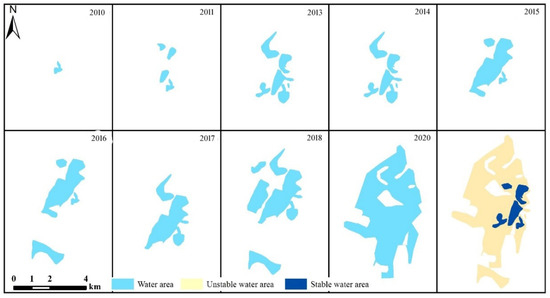
Figure 6.
Changes in the water area of Qingtu Lake.
The spatial distribution of the change trend of salinization in the water area of Qingtu Lake is shown in (Figure 7). Statistics of the land occupation ratio of different change trends show that the area with a decreasing trend of salinization occupied the largest proportion, reaching 32.5%; the proportion of land occupation with a significant decreasing trend was 25.4%; the proportion of land occupation with a significant increasing trend was the smallest, accounting for 9%; and the proportion of land occupation with an increasing trend was 13.4%. The proportion of land with a decreasing trend was larger than that with an increasing trend, and the overall performance was a decreasing trend. Ecological water conveyance improves the environment of the lake area, and the proportion of salinized land becomes smaller. However, in unstable waters, as water evaporates, the problem of secondary soil salinization still exists.
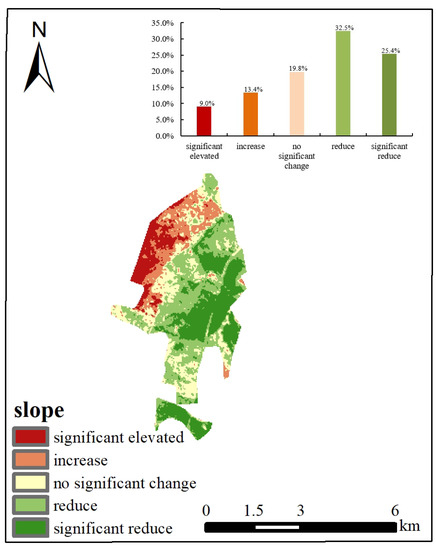
Figure 7.
Spatial characteristics of salinization variation trends in the Qingtu Lake water area.
4.3. Relationship between Soil Salinization and Land Use Types
When discussing the relationship between ecological water conveyance and soil salinization, it is found that there are both non-salinized and severely salinized areas in the shallow, unstable water accumulation area. This phenomenon is mainly related to the land use type of Qingtu Lake. In the primary land use classification, Qingtu Lake and its surrounding areas were mostly unused land, but under the secondary land use classification, there were various types of land uses (Figure 8).
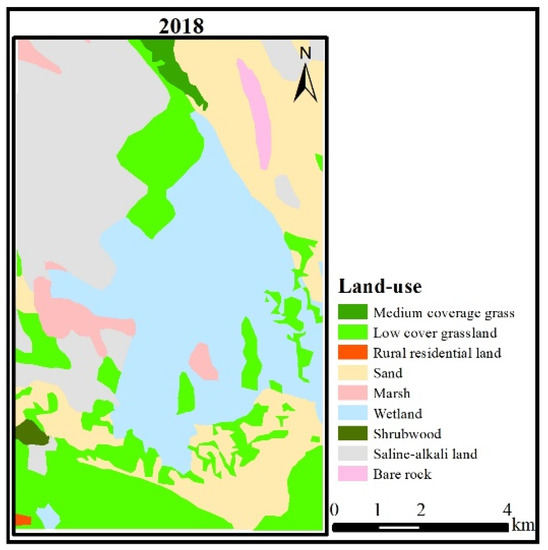
Figure 8.
Land uses in Qingtu Lake and its surrounding areas.
Under different land use types, the salinization process was different, with the evaporation of water in the shallow water area. In saline–alkali land, sandy land and some wetland areas, it was mainly manifested as a secondary salt accumulation process, which increased salinization. In areas with low-coverage grasslands and stable waters, the level of salinization decreases and gradually transforms into non-salinized land.
5. Conclusions
- (1)
- The response of soil salinization to ecological water conveyance in the terminal lake of the Shiyang River Basin—Qingtu Lake—has obvious regional and soil heterogeneity. The response characteristics of soil salinization differ in different areas from the central lake area and under different land use types.
- (2)
- Since the ecological water conveyance began, with the change of the water area of Qingtu Lake, the soil salinization level in some areas has changed. The level of salinization in the lake area is reduced, and the salinized land is transformed into non-salinized. The level of salinization in the periphery of the lake area first decreased and then increased, and, finally, secondary soil salinization occurred.
- (3)
- The secondary soil salinization has mainly occurred in the shallow, unstable water accumulation areas of Qingtu Lake, wetland and sandy land, and the secondary soil salinization has a certain hysteresis. When implementing ecological water conveyance to improve the ecological environment in arid areas, in order to prevent the problem of secondary soil salinization, long-term continuous monitoring and maintenance of the stability of the water area are key.
Author Contributions
Conceptualization, J.Z.; Data curation, J.Y., Y.W. (Yuanyuan Wen), Y.W. (Yanqiang Wang) and J.L.; Formal analysis, J.Y.; Funding acquisition, J.Z.; Investigation, G.Z.; Methodology, J.Y., G.Z., Y.W. (Yuanyuan Wen) and Z.Y.; Project administration, J.Z.; Software, J.L.; Visualization, Y.W. (Yanqiang Wang); Writing—original draft, J.Y.; Writing—review & editing, J.Y. and J.Z. All authors have read and agreed to the published version of the manuscript.
Funding
This research was funded by the Natural Science Foundation of China ((42161072, 41661084).
Institutional Review Board Statement
Not applicable.
Informed Consent Statement
Not applicable.
Data Availability Statement
Not applicable.
Conflicts of Interest
The authors declare no conflict of interest.
References
- Mougenot, B.; Pouget, M. Epema GR remote sensing of salt affected soils. Remote Sens. Rev. 1993, 7, 241–259. [Google Scholar] [CrossRef]
- Allbed, A.; Kumar, L.; Aldakheel, Y.Y. Assessing soil salinity using soil salinity and vegetation indices derived from IKONOS high-spatial resolution imageries: Applications in a date palm dominated region. Geoderma 2014, 230, 1–8. [Google Scholar] [CrossRef]
- He, J.; Den, Q.; Ma, X.J.; Su, X.S.; Ma, X.M. Soil salinization affected by hydrogeochemical processes of shallow groundwater in Cangzhou City, a coastal region in North China. Hydrol. Res. 2021, 52, 1116–1131. [Google Scholar] [CrossRef]
- Hattar, B.I.; Taimeh, A.Y.; Ziadat, F.M. Variation in soil chemical properties along to pose quences in an arid region of the. levant. Catena 2010, 83, 34–45. [Google Scholar] [CrossRef]
- Cheng, T.; Ji, L.; Li, H.; Fei, K.; Yu, X. Study on the Spatiotemporal Changes of Soil Salinization in the Yellow River Delta from 2003 to 2019. World Sci. Res. J. 2021, 7, 237–244. [Google Scholar]
- Sun, H.; Xu, L.; Wang, J.; Fu, X. Remote Sensing Monitoring of Spatial–Temporal Variation of Soil Salinization before and after Irrigation in the Yellow River Delta. Coast. Res. 2020, 105, 56–60. [Google Scholar] [CrossRef]
- Kasim, N.; Maihemuti, B.; Sawut, R.; Abliz, A.; Dong, C.; Abdumutallip, M. Quantitative Estimation of Soil Salinization in an Arid Region of the Keriya Oasis Based on Multidimensional Modeling. Water 2020, 12, 880. [Google Scholar] [CrossRef]
- Guo, B.; Zang, W.; Luo, W.; Wen, Y.; Yang, F.; Han, B.; Fan, Y.; Chen, X.; Qi, Z.; Wang, Z.; et al. Detection model of soil salinization information in the Yellow River Delta based on feature space models with typical surface parameters derived from Landsat8 OLI image. Geomat. Nat. Hazards Risk 2020, 11, 288–300. [Google Scholar] [CrossRef]
- Xie, X.; Pu, L.; Zhu, M.; Xu, Y.; Wang, X. Linkage between soil salinization indicators and physicochemical properties in a long-term intensive agricultural coastal reclamation area, Eastern China. Soils Sediments 2019, 19, 3699–3707. [Google Scholar] [CrossRef]
- Ding, J.L.; Yao, Y.; Wang, F. Detecting soil salinization in arid regions using spectral feature space derived from remote sensing data. Acta Ecol. Sin. 2014, 34, 4620–4631. [Google Scholar]
- Rukhovich, D.I.; Simakova, M.S.; Kulyanitsa, A.L.; Bryzzhev, A.V.; Koroleva, P.V.; Kalinina, N.V.; Kalinina, G.I.; Chernousenko, E.V.; Vil’chevskaya, E.A.; Dolinina, S.V.; et al. Methodology for Comparing Soil Maps of Different Dates with the Aim to Reveal and Describe Changes in the Soil Cover (by the Example of Soil Salinization Monitoring). Eurasian Soil Sci. 2016, 49, 145–162. [Google Scholar] [CrossRef]
- Gorji, T.; Sertel, E.; Tanik, A. Monitoring soil salinity via remote sensing technology under datascarce conditions: A case study from Turkey. Ecol. Indic. 2017, 74, 384–391. [Google Scholar] [CrossRef]
- Chervan, A.M.; Ustinova, A.M.; Tsyrybko, V.B. Spatiotemporal Changes of Soil Salinization in the Soligorsk Mining Region. J. Eurasian Soil Sci. 2019, 52, 998–1006. [Google Scholar] [CrossRef]
- Ke, Z.; Liu, X.; Ma, L.; Feng, Z.; Tu, W.; Dong, Q.; Jiao, F.; Wang, Z. Rainstorm events increase risk of soil salinization in a loess hilly region of China. Agric. Water Manag. 2021, 256, 107081. [Google Scholar] [CrossRef]
- Yu, X.; Xin, P.; Hong, L. Effect of evaporation on soil salinization caused by ocean surge inundation. J. Hydrol. 2021, 597, 126200. [Google Scholar] [CrossRef]
- Wang, Z.; Zhang, F.; Zhang, X.; Chan, N.W.; Kung, H.-T.; Ariken, M.; Zhou, X.; Wang, Y. Regional suitability prediction of soil salinization based on remote-sensing derivatives and optimal spectral index. Sci. Total Environ. 2021, 775, 145807. [Google Scholar] [CrossRef]
- Wu, D.; Jia, K.; Zhang, X.; Zhang, J.; El-Hamid, A.; Hazem, T. Remote Sensing Inversion for Simulation of Soil Salinization Based on Hyperspectral Data and Ground Analysis in Yinchuan, China. Nat. Resour. Res. 2021, 30, 4641–4656. [Google Scholar] [CrossRef]
- Liu, C.; Cui, B.; Zeleke, K.T.; Hu, C.; Wu, H.; Cui, E.; Huang, P.; Gao, F. Risk of Secondary Soil Salinization under Mixed Irrigation Using Brackish Water and Reclaimed Water. J. Agron. 2021, 11, 2039. [Google Scholar] [CrossRef]
- Hirich, A.; Choukr-Allah, R.; Ezzaiar, R.; Shabbir, S.A.; Lyamani, A. Introduction of alternative crops as a solution to groundwater and soil salinization in the Laayoune area, South Morocco. Euro Mediterr. J. Environ. Integr. 2021, 6, 1–13. [Google Scholar] [CrossRef]
- Yao, Y.; Ding, J.; Wang, S. Soil salinization monitoring in the Werigan-Kuqa Oasis, China, based on a Three-Dimensional Feature Space Model with Machine Learning Algorithm. Remote Sens. Lett. 2021, 12, 269–277. [Google Scholar] [CrossRef]
- Tian, A.; Fu, C.; Yau, H.-T.; Su, X.-Y.; Xiong, H. A New Methodology of Soil Salinization Degree Classification by Probability Neural Network Model Based on Centroid of Fractional Lorenz Chaos Self-Synchronization Error Dynamics. IEEE Trans. Geosci. Remote Sens. 2020, 58, 799–810. [Google Scholar] [CrossRef]
- Besser, H.; Mokadem, N.; Redhouania, B.; Rhimi, N.; Khlifi, F.; Ayadi, Y.; Zohra, O.; Abdelhakim, B.; Younes, H. GIS-based evaluation of groundwater quality and estimation of soil salinization and land degradation risks in an arid Mediterranean site (SW Tunisia). Arab. J. Geosci. 2017, 10, 1–20. [Google Scholar] [CrossRef]
- Zovko, M.; Romić, D.; Colombo, C.; Di Iorio, E.; Romić, M.; Buttafuoco, G.; Castrignanò, A. A geostatistical Vis-NIR spectroscopy index to assess the incipient soil salinization in the Neretva River valley, Croatia. Geoderma 2018, 332, 60–72. [Google Scholar] [CrossRef]
- Qiu, G.Y.; Li, X.Y.; Feng, Y.C. How to prevent Minqin from becoming the second “Lop Nur” several ideals and suggestion about carrying out the instruction of premier wen and resolving the water crisis in Minqin area. China Land Sci. 2008, 22, 26–30. [Google Scholar]
- Chen, Z.R.; Liu, S.Z.; Liu, S.J. Effect of Water Body Forming on the Distribution of Typical Vegetation in Qingtu Lake. Chin. Agric. Sci. Bull. 2015, 31, 177–183. [Google Scholar]
- Hua, Y.C.; Li, Z.Y.; Gao, Z.H. Variation of Vegetation Coverage in Minqin County Since 2001. Arid Zone Res. 2017, 34, 337–343. [Google Scholar]
- Zhao, J.; Yang, J.X.; Zhu, G.F. Coverage in Qingtu Lake and Its Surrounding Area. Arid Zone Res. 2018, 35, 1251–1261. [Google Scholar]
- Yang, J.; Zhao, J.; Zhu, G.; Wang, Y.; Ma, X.; Wang, J.; Huiwen, G.; Yu, Z. Soil salinization in the oasis areas of downstream inland rivers—Case Study: Minqin oasis. Quat. Int. 2020, 537, 69–78. [Google Scholar] [CrossRef]
- Zhang, Y.; Zhu, G.F.; Ma, H.Y. Effects of Ecological Water Conveyance on the Hydrochemistry of a Terminal Lake in an Inland River: A Case Study of Qingtu Lake in the Shiyang River Basin. Water 2019, 11, 1673. [Google Scholar] [CrossRef]
- Haj-Amor, Z.; Tóth, T.; Ibrahimi, M.K.; Bouri, S. Effects of excessive irrigation of date palm on soil salinization, shallow groundwater properties, and water use in a Saharan oasis. Environ. Earth Sci. 2017, 76, 1–13. [Google Scholar] [CrossRef]
- El Harti, A.; Lhissou, R.; Chokmani, K.; Ouzemou, J.-E.; Hassouna, M.; Bachaoui, E.M.; El Ghmari, A. Spatiotemporal monitoring of soil salinization in irrigated Tadla Plain (Morocco) using satellite spectral indices. J. Int. J. Appl. Earth Obs. Geoinf. 2016, 50, 64–73. [Google Scholar] [CrossRef]
- Xu, C.; Cheng, H.; Wang, Y.; Wan, R.; Liu, L.; Zhang, R. Improved multi-level fuzzy evaluation model based on cloud theory for evaluation of soil salinization degree. Editor. Off. Trans. Chin. Soc. Agric. Eng. 2017, 33, 88–95. [Google Scholar]
- Chu, L.L.; Kang, Y.H.; Wan, S.Q. Effects of water application intensity of micro-sprinkler irrigation and soil salinity on environment of coastal saline soils. Water Sci. Eng. 2021, 13, 116–123. [Google Scholar] [CrossRef]
- Seydehmet, J.; Lv, G.H.; Abliz, A. Landscape Design as a Tool to Reduce Soil Salinization: The Study Case of Keriya Oasis (NW China). Sustainability 2019, 11, 2578. [Google Scholar] [CrossRef]
- Ramos, T.B.; Darouich, H.; Šimůnek, J.; Gonçalves, M.C.; Martins, J.C. Soil salinization in very high-density olive orchards grown in southern Portugal: Current risks and possible trends. J. Agric. Water Manag. 2019, 217, 265–281. [Google Scholar] [CrossRef]
- Shi, W.L. Influence analysis of artificial water transfer on the regional ecological environment of Qingtu Lake in the lower reaches of the Shiyang River. Acta Ecol. Sin. 2017, 37, 5951–5960. [Google Scholar]
- Abdullah, A.Y.M.; Biswas, R.K.; Chowdhury, A.I.; Billah, S.M. Modeling soil salinity using direct and indirect measurement techniques: A comparative analysis. Environ. Dev. 2019, 29, 2211–4645. [Google Scholar] [CrossRef]
- Guo, S.; Ruan, B.; Chen, H.; Guan, X.; Wang, S.; Xu, N.; Li, Y. Characterizing the spatiotemporal evolution of soil salinization in Hetao Irrigation District (China) using a remote sensing approach. Int. J. Remote Sens. 2018, 39, 6805–6825. [Google Scholar] [CrossRef]
- Barrios, J.M.; Verstraeten, W.W.; Maes, P.; Aerts, J.; Farifteh, J.; Coppin, P. Relating land cover and spatial distribution of Nephropathia epidemica and Lyme borreliosis in Belgium. Int. J. Environ. Health Res. 2013, 23, 132–154. [Google Scholar] [CrossRef]


Publisher’s Note: MDPI stays neutral with regard to jurisdictional claims in published maps and institutional affiliations. |
© 2022 by the authors. Licensee MDPI, Basel, Switzerland. This article is an open access article distributed under the terms and conditions of the Creative Commons Attribution (CC BY) license (https://creativecommons.org/licenses/by/4.0/).