Abstract
This study explored the impact of the air cargo industry on the regional economy by regressing panel data for 91 prefecture-level cities in China from 2006 to 2019. By using the total employment and the employment of the 19 sub-industries as indicators of regional economic development, results show that only the growth of employment in the manufacturing sector is significantly and positively associated with the growth of air cargo volume. This study then explores the heterogeneity of the impact of air cargo on manufacturing employment in different types of cities by using a dummy variable interaction term and finds that in terms of the elasticity of growth of air cargo on manufacturing employment, southwest, and northwest regions are significantly higher than other regions, inland cities are significantly higher than coastal port cities, and major gateway cities are significantly lower than non-major gateway cities. Our research shows that air cargo development can lead to manufacturing industry clustering, while air cargo infrastructure development is more important for the economic development of inland regions and secondary gateway cities.
1. Introduction
There has been a long history of research on the impact of air transportation on regional development, and there is general agreement among academics that the air transportation industry can have a positive impact on regional economies. The impact of air transportation on regional economies occurs at two main levels: first, the construction of airports is a direct investment in the regional economy and generates on-site employment; second, air transportation can change the economic ties between a region and other regions and create differences in regional competitiveness [1]. However, in previous studies, attention has been focused on air passenger transport and the air cargo research literature is very scarce, especially in the Chinese air cargo industry, mainly because of the late emergence of air cargo as a major area of public policy, but perhaps more importantly because of the lack of data.
The main types of cargo typically transported by air include capital and transportation equipment, high-value consumer goods (gold and other valuables, electronics, apparel), manufacturing intermediate products, and refrigerated agricultural products (fresh vegetables and seafood). In general, cargoes transported by air have different characteristics than those transported by road, rail, or port, either because of their high unit quality or because of their time sensitivity. Because of this, it has been argued that air cargo can provide new avenues in the process of product “self-discovery”, as it both expands the set of products for which a region may be competitive and provides additional avenues for entrepreneurial experimentation by reducing ex ante investment costs [2]. A good example of this is the flower industry in Ethiopia [3]. It is also because of the specificity of the type of goods that air cargo is oriented toward that makes various industries dependent on air cargo to different degrees, and the construction of air cargo hubs as infrastructure not only depends on the original industrial structure but also inevitably has a significant impact on it.
In recent years, with the rapid development of e-commerce and express logistics in China, and the continuous relocation and upgrading of manufacturing industries, the demand for air cargo is increasing day by day. However, China has never had a specialized air cargo and a complete air cargo airport system, so from the 13th Five-Year Plan in 2015, the Chinese government made it a priority to accelerate the construction of cargo-oriented airports. In 2020, the National Development and Reform Commission and the Civil Aviation Administration of China (CAAC) also proposed the construction of an air cargo hub system consisting of comprehensive hub airports and specialized cargo hub airports, making the planning and construction of air cargo hubs a hot topic again [4]. The new development direction and goal also bring new questions: what impact can the air cargo industry have on the regional economy? How do we choose the location of air cargo hubs and cities? It seems that these questions have not been systematically studied and solved, but several provinces and cities have started to build air cargo hubs and visionary goals, competing to build regional or even national air cargo hubs. Such disorderly competition and expansion may lead to unnecessary waste and dispersion of resources.
As China’s air cargo system is currently at a primary stage of development, and China is currently in a period of industrial relocation and upgrading, the investment in infrastructure often brings about a certain degree of industrial agglomeration, especially in the cargo type of infrastructure that is deeply bound to industrial agglomeration. Therefore, this paper would like to explore the issue of air cargo hub location selection from the supply-side perspective, i.e., the impact of air cargo on the regional economy, in order to provide some empirical suggestions for the planning and construction of China’s air cargo system.
In this study, we first used air cargo data and employment data for 91 prefecture-level cities in China from 2006 to 2019 to estimate the impact of the development of the air cargo industry on employment in different industries through the least squares (OLS) and Heckman two-stage methods. Afterward, based on the preliminary estimation results, we analyzed the impact of air cargo on the change of employment in cities of different geographical regions and administrative levels by introducing dummy variable interaction terms, and all of them found significant heterogeneity. We believe that this study has the following main contributions: firstly this study should be the first article to study the impact of air cargo on the economic development of different industries and different regions in China, filling a gap in the literature. Secondly, our study contributes to the study of how transportation networks affect uneven regional development. Our results show that the development of the air cargo industry has a significant impact on manufacturing development in inland areas and non-major gateway cities, and the results likewise suggest that the air cargo industry also plays a positive role in the redistribution of economic development.
The rest of the paper is organized as follows: Section 2 outlines the literature. Section 3 describes the data set of this study and the different distributions of the sample cities. Section 4 presents the research model of this paper. Section 5 gives the empirical basic results. Section 6 discusses some heterogeneity. Section 7 concludes.
2. Literature Review
From the late 1980s and early 1990s, a lot of attention has been paid to the impact of air transport on economic development. The main methods used were the regional multiplier method, the questionnaire method, the experimental economics method, and the econometric method. The regional multiplier method is the traditional method for assessing the role of airports on regional economic development and is widely used by planning agencies, but the determination of the multiplier effect at the local level in this method is very difficult [5,6]. The questionnaire method is widely used to try to solicit expert opinion, but there is a high potential for vested interests to “capture” the process. The experimental economics approach offers a more rigorous methodology but has rarely been used in air transport research, probably due to data limitations. The econometric approach, which has been widely used in recent years, appears to offer more reliable practical experience.
In the previous econometric literature on air transportation and regional economic development, the research regions are mainly concentrated in developed countries such as Europe and the United States, and the research subjects are mainly in the air passenger transport industry. Table 1 summarizes the research methods, contents, regions used, and conclusions of the relevant literature. It can be found that the research methods are mainly based on least squares (OLS), two-stage least squares (2SLS), and the Granger causality test, where two-stage least squares can be seen as an improvement of least squares, but the estimated coefficients of two-stage least squares with exogenous instrumental variables are more unbiased and consistent compared to least squares, and the Granger causality test is a technique to determine whether one time series contributes to the prediction of another time series. The research content is also mainly on the impact of air transportation on regional employment and trade.

Table 1.
Literature on the relationship between air transport and regional economics.
In general, the findings in Table 1 show that air transport has a significant impact on regional employment and inter-regional trade growth, but since most previous studies have focused on air passenger transport and regional economic development, with passenger airports concentrated in densely populated metropolitan areas, it has mainly had a large impact on the service sector and not much on the manufacturing sector. However, there does not seem to be a consensus on the relationship between air cargo and regional economic development alone. For example, Green (2007) [11] found a significant impact of air passenger traffic on regional population and employment growth in the last decade of the last century when he studied the impact of the air transportation industry on regional population and employment growth in the United States, but the impact of air cargo traffic was not significant. However, Button and Yuan (2012) [16] and Mukkala and Tervo (2013) [17], who analyzed the Granger causality between the air cargo industry and regional economic development in the United States and Europe by constructing a bivariate VAR model between air cargo volume and regional economic development variables, found that compared to the effect of regional economic development on air cargo, the impact of air cargo on regional economic development appears to be more pronounced. The effect of air cargo on regional economic development is not clear because the time period and methodology of the above literature are inconsistent and cannot be directly compared. China’s air transportation started to develop rapidly after the opening of the sky agreement in 2003, and mainly developed air passenger transportation, air cargo has long existed as an accessory to air passenger transportation, and there is almost no relevant research literature. Therefore, the research in this paper can be said to fill some research gaps between air cargo and regional economic development, and also provide empirical suggestions for air cargo development in China.
In this study, the more widely used OLS method was chosen to assess the impact of the air cargo industry on the regional economy. Total employment and employment in 19 industries according to the China Industry Classification System (CICS) were selected as regional economic measures. The sum of air cargo and mail throughput of all airports within each prefecture-level city is used as a measure of air cargo. Due to the restrictive nature of the data, 91 cities with continuous air cargo and employment in different industries from 2006 to 2019 were selected for this paper. Meanwhile, the construction and development of airports often have their historical development elements, which are often deeply tied to import and export trade and gross regional product (GDP) in reformed and open China, so this paper adds the Heckman two-stage method to correct for sample selection bias. Finally, based on the basic findings, the paper goes on to analyze the regional heterogeneity and administrative level heterogeneity in the sample cities to assess the impact of air cargo on different types of cities in a more intuitive way.
3. Description of Data and City Distribution
Based on the air cargo and mail throughput data of civil aviation airports from 2006 to 2019 published by the official website of the Civil Aviation Administration of China and relevant macro and employment data published by the Statistics Bureau of China and regional statistical bureaus for screening, relevant statistics of 91 prefecture-level cities from 2006 to 2019 were selected comprehensively based on the availability of data to form the panel data. The total GDP of the selected prefecture-level cities is accounted for according to the 2019 data, accounting for approximately 70% of the total national GDP. The air cargo data of the prefecture-level cities are summed up by the air cargo throughput of all airports within that prefecture-level city in that year.
The dependent variables in this study are the total employment in each prefecture-level city and the employment in 19 industries classified according to the China Industry Classification System (CICS), the explanatory variable is the air cargo volume in each prefecture-level city, and for the control variables, the economic indicators of total import and export trade, GDP, resident population, road cargo volume, and rail cargo volume in each prefecture-level city are selected. In order to reduce the effect of heteroskedasticity, the above indicators are logarithmically treated, so that the coefficients in the regression equation of this study can be interpreted as response elasticities. The descriptive statistics are shown in Table 2.
Table 2.
Descriptive statistics.
In this paper, the cities in the sample are divided according to China’s geographical location, administrative level, and the presence or absence of ports, as shown in Figure 1. According to the geographical location of China, cities can be divided into seven regions: east China, north China, south China, central China, northeast China, northwest China, and southwest China; according to the administrative level of cities, cities can be divided into gateway cities and non-gateway cities. In this paper, gateway cities are 35 large and medium-sized cities consisting of Chinese municipalities, sub-provincial cities, and other provincial capitals. If the cities in the sample are among these 35 large and medium-sized cities, they are classified as gateway cities; otherwise, they are non-gateway cities; furthermore, the gateway cities can be divided into major and minor gateway cities, if a city in the gateway city is among the municipalities directly under the central government and sub-provincial cities, then the city is a major gateway city; otherwise, it is defined as a minor gateway city; finally, the cities in the sample are divided into two categories, port cities, and non-port cities, according to the presence of ports. Relevant dummy variables were constructed according to the above classification, which can be seen in Table 2.
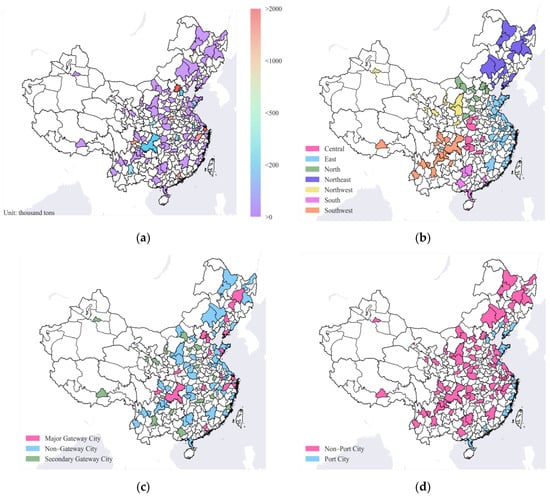
Figure 1.
Sample city distribution maps. (a) Distribution of air cargo volume in 2019; (b) distribution of geographical areas; (c) distribution of administrative levels; (d) distribution of port cities.
Figure 1a is drawn based on the air cargo volume by city in 2019, which shows that although the distribution of air cargo cities in China is relatively dense, it is still mainly dominated by low cargo volume. High cargo volume cities are mainly Shanghai, Beijing, Guangzhou, Shenzhen, Zhengzhou, Hangzhou, and Chengdu, which are the major gateway cities. From the overall distribution, China’s air cargo cities are still mainly distributed in the eastern and central regions, and very sparse in the west.
4. Model
In this paper, a two-way fixed effects regression technique is used to estimate the model, and the basic model structure is shown below:
where i refers to the cross-sectional unit (prefecture-level city), t refers to the time period (year), α is the intercept, β is the vector of (transposed) parameter estimates, and X is the set of the vector of explanatory variables and the vector of control variables corresponding to each prefecture-level city i at time t, γi denotes city fixed effects to control for historical or geographic characteristics that do not vary over time, τt denotes year fixed effects to control for the effects of macroeconomic or political shocks, and εit is the error term.
To address the estimation bias caused by sample selection bias, the inverse Mills ratio λ calculated using the Heckman two-step estimation method was added to the regression analysis. The inverse Mills ratio λ was calculated as follows:
The estimates δ are first calculated from the Probit model:
The total sample is selected from the 285 major prefecture-level cities in China. In Equation (2), if the 91 sample cities are selected in this paper, then s = 1, otherwise s = 0. The explanatory variables are the total import/export trade and GDP of each prefecture-level city in the current year. The inverse Mills ratio λ for each city in the sample is then calculated from the estimated values δ.
The inverse Mills ratio λ is then substituted into the final regression equation, and the final model structure is shown below:
where Eit represents total employment and 19 sub-sectors of employment respectively; Aircargoit represents the air cargo volume of city i in year t; λit is the inverse Mills ratio of city i in year t; Tradeit represents the total import and export trade of city i in year t; GDPit represents the gross national product of city i in year t; Popit represents the resident population of city i in year t; Roadcargoit represents the road cargo volume of city i in year t; Railcargoit represents the rail cargo volume of city i in year t.
Further, in order to analyze the different impacts of air cargo in different types of cities, this paper uses the Chow test with the introduction of the cross-product term to test whether there is a significant difference in the impact coefficients of air cargo in different types of cities. For example, to analyze the difference between the impact of air cargo on employment in port cities and non-port cities, the dummy variable Porti is introduced, and Porti is equal to one if a city is a port city; otherwise, Porti is equal to zero. This paper is set up to allow for differences in the coefficients of all explanatory and control variables between groups. The model setup at this point is shown in Equation (5).
At this point, X is the set of the vector of explanatory variables and the vector of control variables that contain the inverse Mills ratio λ, which can be referred to as Equation (4).
For the port cities in the sample, Equation (5) can then be expressed as:
and non-port cities can be expressed as follows:
The significance of the difference between the impact of air cargo on employment in port cities and non-port cities can then be obtained from the significance of the coefficient μ. The same procedure is followed for the rest of the grouping regression coefficients for testing the significance of differences between gateway cities and non-gateway cities, etc.
5. Basic Results
In this paper, a regression analysis without the inclusion of the inverse Mills ratio was first conducted, followed by a regression including the inverse Mills ratio, and the regression method chosen was OLS plus clustering robust standard errors, as shown in Table 3 and Table 4. To save space, only key information is presented in the tables. The regression results without the inverse Mills ratio show (Table 3) that only manufacturing employment is significantly affected by air cargo volume, with an impact coefficient of 0.087. In the regression results with the inverse Mills ratio (Table 4), λ has a significant impact on the change in employment in some industries, indicating that the original model has a sample selection bias, and using the Heckman two-stage method can make the results more robust. In the results of Table 4, it can be found that, like the results of Table 3, air cargo volume only has a significant effect on the number of manufacturing employment, and the significance level is also consistent with Table 3, except that the coefficient of manufacturing employment affected is increased to 0.092, i.e., the elasticity of air cargo volume to manufacturing employment growth is improved after using the Heckman two-stage method.
Table 3.
Basic results.
Table 4.
Basic results after Heckman correction.
6. Heterogeneity Analysis
6.1. Heterogeneity Analysis of Geographical Location
In order to analyze the heterogeneity of the impact of the air cargo industry on manufacturing employment in different geographical locations, this subsection interacts the geographical location dummy variable with the air cargo indicator, and the results are shown in Table 5. According to the interpretation of Equations (6) and (7), the coefficients in the first row of Table 5 are the growth elasticity coefficients of air cargo volume on manufacturing employment after excluding a particular region. From the results of the coefficients in the first row, it can be seen that the change in air cargo volume causes a significant positive change in manufacturing employment after excluding any geographical area, indicating the reliability of the full sample results. It can also be found that after excluding the two relatively inland regions of northwest and southwest respectively, the coefficients and significance of the elasticity of growth of air cargo volume on manufacturing employment are reduced, which means that the manufacturing industries in these two regions are more dependent on the air cargo industry. However, after excluding the east region, which has more port cities, the growth elasticity coefficient of air cargo volume on manufacturing employment increases significantly. This result also confirms that “air transport services are often a key factor in the transport system of remote areas” [22].
Table 5.
Results of geographic regional heterogeneity analysis.
Among the results shown for each interaction term, there is a greater consistency with the previous results: the interaction term for the east region is significantly negative, and the interaction terms for both northwest and southwest regions are significantly positive. In terms of coefficient values, the elasticity of air cargo volume to manufacturing employment growth is the highest in southwest China with 0.211, followed by northwest China with a coefficient value of 0.163, and the lowest in east China with 0.04. Although the interaction terms in other regions are not significant, the coefficients in central China and northeast China are positive, and the coefficients in north China and south China are negative values.
6.2. Heterogeneity Analysis of Port Cities and Non-Port Cities
In the previous subsection, it is evident that regions with more port cities show significant negative heterogeneity in the elasticity of growth of air cargo volume to manufacturing employment, so this subsection focuses on the heterogeneity of port cities. Among the seven geographic regions in China, east China, north China, south China, and northeast China have port cities, so the heterogeneity of port cities and non-port cities in these four geographic regions is also analyzed separately in this subsection, and the results are shown in Table 6.
Table 6.
Results of heterogeneity analysis of port cities and non-port cities.
We find that for the full sample, there is greater heterogeneity between port cities and non-port cities. The elasticity coefficient of growth of air cargo volume to manufacturing employment in non-port cities is 0.139, while that of port cities is −0.023, which means that the growth direction of air cargo volume in port cities is significantly opposite to the growth direction of manufacturing employment. In the analysis of heterogeneity by region, the strongest heterogeneity is found between port cities and non-port cities in northeast China, followed by east China, and the coefficients of the interaction terms of port cities in north China and south China, although not significant, are equally negative. Meanwhile, we can find that the effect of air cargo on the change of manufacturing employment in non-port cities in south China is also insignificant.
6.3. Heterogeneity Analysis of Administrative Hierarchy
In this subsection, by introducing different administrative level dummy variables to interact with air cargo volume, the results are shown in Table 7, where the results in the fourth column are the results of the analysis of the interaction term between secondary gateway cities dummy variables and air cargo volume after excluding the major gateway cities to analyze the heterogeneity between secondary gateway cities and non-gateway cities. We find a highly significant heterogeneity only between major gateway cities and non-major gateway cities, and the elasticity of growth of air cargo volume to manufacturing employment in major gateway cities is calculated to be −0.259, i.e., although air cargo volume is mainly distributed in major gateway cities, the growth direction of air cargo volume in major gateway cities is significantly opposite to the growth direction of manufacturing employment. The coefficients of the secondary gateway cities interaction term, although not significant, are all positive, and especially after excluding the major gateway cities, the coefficient values increase. This means that the growth elasticity of air cargo volume to manufacturing employment is higher in secondary gateway cities compared to major gateway cities and non-gateway cities.
Table 7.
Results of heterogeneity analysis of administrative hierarchy.
6.4. Discussion of Heterogeneous Results
The above results seem to demonstrate a significant negative impact of the air cargo industry on manufacturing employment in port cities and major gateway cities consisting of municipalities and sub-provincial cities, but this seems to be the opposite of the current distribution of air cargo volumes. As shown in Figure 2 and Figure 3, the volume of air cargo in the sample is higher in port cities than in non-port cities, while the volume of air cargo is higher in major gateway cities than in non-major gateway cities. To analyze this phenomenon, the paper goes on to separately analyze the 22 port cities and the 19 major gateway cities. When assessing port cities separately, port cargo throughput was added, and the results are shown in Table 8.
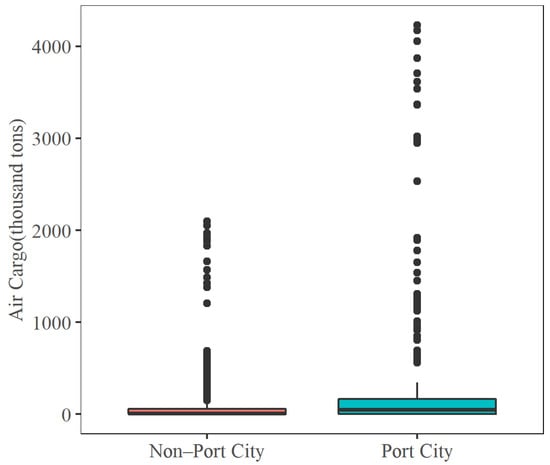
Figure 2.
Box plots of air cargo volume of port cities and non-port cities.
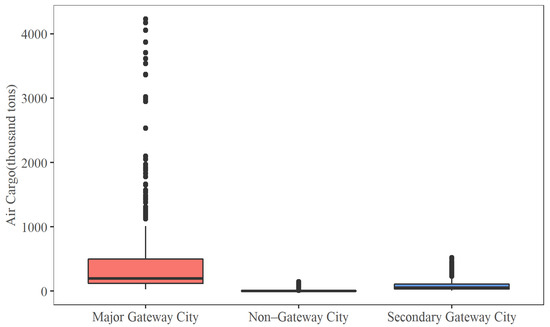
Figure 3.
Box plots of air cargo volume of major gateway cities, secondary gateway cities, and non-gateway cities.
Table 8.
Results of heterogeneity analysis of port cities and major gateway cities.
The first column of Table 8 shows the results of the port city estimation and it can be found that manufacturing in non-major gateway cities has a significant positive correlation with port cargo throughput, while the major gateway city interaction term shows a significant negative correlation at this time. The second column shows the estimated results for major gateway cities, and it can be found that the impact of air cargo volume on manufacturing employment is insignificant and the coefficients are negative for both port cities and non-port cities in major gateway cities. In other words, the change in manufacturing employment in major gateway cities is always in the opposite direction of air cargo. This is, of course, in line with the development law of first-tier cities, where manufacturing firms are bound to keep moving outward as land and labor costs continue to rise with economic development [23,24]. Meanwhile, the results for port cities show a significant correlation between manufacturing development in port cities and cargo throughput in ports, rather than air cargo volume. China’s air cargo has long relied on the belly of passenger aircraft for transportation, and the development of the air passenger industry has been concentrated in cities with developed economies and high population densities, making it uncompetitive with other modes of transportation in terms of both efficiency and cost. As stated by Yao and Yang (2008), airport development is positively correlated with economic growth, industrial structure, population density, and openness, but negatively correlated with ground transportation [25]. In the inland areas of China, which lack large ports, there are fewer plains and the construction costs of ground transportation are equally high, so their economies are more dependent on air transportation for development. Especially for remote areas, air transport is not only a facilitator of trade but also a creator of trade. The development of air transport should be considered an important stimulus to promote economic growth in remote provinces and reduce the overall spatial income and economic inequality of the country [25,26]. We hope that the current air cargo network planning in China will be biased towards inland areas in order to play a greater role as air cargo hub cities.
7. Conclusions
This study explored the impact of the air cargo industry on the regional economy by regressing panel data for 91 prefecture-level cities in China from 2006 to 2019. By using the total employment and the employment of the 19 sub-industries as indicators of regional economic development, it is found that air cargo has a significant effect on the change in employment population in manufacturing only. The same was true after using the Heckman two-stage method. This paper then uses manufacturing employment as the dependent variable to analyze the effects of air cargo on changes in manufacturing employment across geographic regions, port and non-port cities, and cities at different administrative levels by introducing dummy variable interaction terms, and significant heterogeneity was found in all cases. This is shown as follows:
- (1)
- In terms of heterogeneity across geographic regions, the two deeply inland regions—southwest and northwest—both show significant positive heterogeneity, while the eastern region, which has more coastal cities, shows significant negative heterogeneity. In terms of the elasticity of air cargo volume to manufacturing employment growth, southwest China has the highest (0.211), followed by northwest China (0.163), while east China has the lowest (0.04).
- (2)
- In terms of heterogeneity between port cities and non-port cities, port cities and non-port cities show a large heterogeneity, with the elasticity coefficient of non-port cities being significantly positive (0.139), while the elasticity coefficient of port cities is significantly negative (−0.023). Port cities also show different heterogeneity across geographic regions: northeast China and east China show significant heterogeneity in port cities, while north China and south China show negative but insignificant coefficients of heterogeneity in port cities. In the separate estimation of port cities, it is found that the stronger economic driving effect of ports than airports makes the correlation between manufacturing employment and port cargo volume higher in port cities.
- (3)
- In terms of administrative-level heterogeneity, major gateway cities consisting of municipalities directly under the central government and sub-provincial cities show a highly significant negative heterogeneity. Although the other interaction terms are not significant, the coefficient values show that the coefficient of the gateway cities is negative and the coefficient of the secondary gateway cities is positive. In a separate analysis of the major gateway cities, it is found that the manufacturing employment in the major gateway cities consistently changes in the opposite direction to air cargo, which this paper suggests is due to the continuous out-migration of manufacturing from the major gateway cities.
The overall results show that China’s air cargo industry is more conducive to the formation of manufacturing industry clusters, and in particular has a more significant impact on manufacturing industry clusters in inland areas and secondary gateway cities. Our findings will help policymakers understand the impact of air cargo development on the evolution of regional industrial structures. In today’s state of intense competition among local governments for access to air cargo hubs to promote economic development, the only way to promote sustainable development of the regional economy and air transport industry is to understand the role of air cargo in the transportation sector and to clarify the impact of air cargo on regional economic development. It is hoped that the findings of this paper can provide some insights for government departments and related markets.
Since this paper is analyzed from a supply-side perspective, i.e., the impact of air cargo on the regional economy, rather than a demand-side perspective, the conclusions of this paper cannot yet be directly used as the final selection criteria for air cargo hub cities. There are many classifications of manufacturing industries, and this paper cannot conduct an in-depth study on the relationship between the air cargo industry and the development of different manufacturing industries due to the limitation of data. Future research should analyze the impact of the air cargo industry from a more quantitative perspective and promote the development of regional economies from a more detailed industrial planning perspective. At the same time, it is necessary to further explore the economic, social, and political influences behind it and study the most appropriate development model from the supply-side and demand-side perspectives, respectively.
Author Contributions
Conceptualization, J.Z. and L.L.; methodology, J.Z.; software, J.Z. and L.L.; validation, J.Z.; formal analysis, J.Z.; investigation, J.Z. and L.L.; resources, J.Z. and L.L.; data curation, J.Z. and L.L.; writing—original draft preparation, J.Z.; writing—review and editing, J.Z., L.L., and X.S.; visualization, J.Z. and L.L.; supervision, X.S. All authors have read and agreed to the published version of the manuscript.
Funding
This research received no external funding.
Data Availability Statement
Publicly available data sets were analyzed in this study. This data can be downloaded from the official website of the Civil Aviation Administration of China and the official website of the China Statistics Bureau, here: http://www.caac.gov.cn/index.html (accessed on 1 June 2022), http://www.stats.gov.cn/ (accessed on 1 June 2022). Part of the data is from the local statistical office.
Conflicts of Interest
The authors declare that they have no conflict of interest regarding the publication of this paper.
References
- Debbage, K.G. Air Transportation and Urban-Economic Restructuring: Competitive Advantage in the US Carolinas. J. Air Transp. Manag. 1999, 5, 211–221. [Google Scholar] [CrossRef]
- Hausmann, R.; Rodrik, D. Economic development as self-discovery. J. Dev. Econ. 2003, 72, 603–633. [Google Scholar] [CrossRef]
- Gebreeyesus, M.; Iizuka, M. Discovery of the flower industry in Ethiopia: Experimentation and coordination. J. Glob. Dev. 2012, 2, 42. [Google Scholar] [CrossRef][Green Version]
- National Development and Reform Commission; Civil Aviation Administration. Opinions of the National Development and Reform Commission Civil Aviation Administration on Promoting the Development of Air Cargo Facilities; NDRC: Beijing, China, 2020. [Google Scholar]
- Butler, S.E.; Kiernan, L.J. Estimating the Regional Economic Significance of Airports; Federal Aviation Administration: Washington, DC, USA, 1992. [Google Scholar]
- Debbage, K.G. Airport Runway Slots. Ann. Tour. Res. 2002, 29, 933–951. [Google Scholar] [CrossRef]
- Goetz, A.R. Air Passenger Transportation and Growth in the U.S. Urban System, 1950–1987. Growth Chang. 1992, 23, 217–238. [Google Scholar] [CrossRef]
- Benell, D.W.; Prentice, B.E. A regression model for predicting the economic impacts of Canadian airports. Logist. Transp. Rev. 1993, 29, 139. [Google Scholar]
- Kenneth, B.; Taylor, S. International Air Transportation and Economic Development. J. Air Transp. Manag. 2000, 6, 209–222. [Google Scholar] [CrossRef]
- Brueckner, J.K. Airline Traffic and Urban Economic Development. Urban Stud. 2003, 40, 1455–1469. [Google Scholar] [CrossRef]
- Green, R.K. Airports and Economic Development. Real Estate Econ. 2007, 35, 91–112. [Google Scholar] [CrossRef]
- Percoco, M. Airport Activity and Local Development: Evidence from Italy. Urban Stud. 2010, 47, 2427–2443. [Google Scholar] [CrossRef]
- Sheard, N. Airports and Urban Sectoral Employment. J. Urban Econ. 2014, 80, 133–152. [Google Scholar] [CrossRef]
- McGraw, M.J. Perhaps the Skys the Limit? The Historical Effects of Airports on Local Economies. 2014; Unpublished manuscript. [Google Scholar]
- Sheard, N. Airport Size and Urban Growth. Economica 2019, 86, 300–335. [Google Scholar] [CrossRef]
- Kenneth, B.; Yuan, J. Airfreight Transport and Economic Development: An Examination of Causality. Urban Stud. 2013, 50, 329–340. [Google Scholar] [CrossRef]
- Kirsi, M.; Tervo, H. Air Transportation and Regional Growth: Which Way Does the Causality Run? Environ. Plan. A Econ. Space 2013, 45, 1508–1520. [Google Scholar] [CrossRef]
- Baker, D.; Merkert, R.; Kamruzzaman, M. Regional Aviation and Economic Growth: Cointegration and Causality Analysis in Australia. J. Transp. Geogr. 2015, 43, 140–150. [Google Scholar] [CrossRef]
- Van de Vijver, E.; Derudder, B.; Witlox, F. Air Passenger Transport and Regional Development: Cause and Effect in Europe. Promet-Traffic Transp. 2016, 28, 143–154. [Google Scholar] [CrossRef]
- Bilotkach, V. Are Airports Engines of Economic Development? A Dynamic Panel Data Approach. Urban Stud. 2015, 52, 1577–1593. [Google Scholar] [CrossRef]
- Carbo, J.M.; Graham, D.J. Quantifying the Impacts of Air Transportation on Economic Productivity: A Quasi-Experimental Causal Analysis. Econ. Transp. 2020, 24, 100195. [Google Scholar] [CrossRef]
- Bråthen, S.; Halpern, N. Air transport service provision and management strategies to improve the economic benefits for remote regions. Res. Transp. Bus. Manag. 2012, 4, 3–12. [Google Scholar] [CrossRef]
- Chang, Z.; Diao, M. Inter-city transportation and intra-city housing values: Estimating the redistribution effect of High Speed Rail on Shenzhen’s housing market. Urban Stud. 2022, 59, 870–889. [Google Scholar] [CrossRef]
- Murakami, J.; Cervero, R. High Speed Rail and Economic Development: Business Agglomerations and Policy Implications. In High-Speed Rail and Sustainability, Decision-Making and the Political Economy of Investment; Henriquez, B.L.P., Deakin, E., Eds.; Routledge: Abington-on-Thames, UK, 2017. [Google Scholar]
- Yao, S.; Yang, X. Airport Development and Regional Economic Growth in China. SSRN Electron. J. 2008, 1101574, 33. [Google Scholar] [CrossRef]
- Appold, S.J.; Kasarda, J.D. The airport city phenomenon: Evidence from large US airports. Urban Stud. 2013, 50, 1239–1259. [Google Scholar] [CrossRef]


Publisher’s Note: MDPI stays neutral with regard to jurisdictional claims in published maps and institutional affiliations. |
© 2022 by the authors. Licensee MDPI, Basel, Switzerland. This article is an open access article distributed under the terms and conditions of the Creative Commons Attribution (CC BY) license (https://creativecommons.org/licenses/by/4.0/).