Article

Impacts of Climate and Land Use/Cover Change on Water Yield Services in the Upper Yellow River Basin in Maqu County

1
College of Geography and Environmental Science, Northwest Normal University, Lanzhou 730070, China
2
Key Laboratory of Resource Environment and Sustainable Development of Oasis, Lanzhou 730070, China
*
Author to whom correspondence should be addressed.
Sustainability 2022, 14(16), 10363; https://doi.org/10.3390/su141610363
Submission received: 5 July 2022 / Revised: 15 August 2022 / Accepted: 18 August 2022 / Published: 19 August 2022

Abstract

:
The upper Yellow River Basin is an important ecological security barrier and a water conservation area in northwest China. The sustainability of its water yield services has generated much concern and debate. Spatial and temporal patterns of water yield factors are considered to be important scientific data. Therefore, the climate and land data of the upper Yellow River Basin in Maqu County are studied. Water yield for the period 1990–2020 was estimated using the water yield module in the InVEST model. Impacts and contribution weights of climate and land use/cover change on regional water yield were also quantified under 12 scenarios. The results indicate that (1) the average water yield in Maqu County has fluctuated and increased in the past 30 years. The increase in rainfall was more pronounced than the increase in potential evapotranspiration. Grassland areas continue to increase and unutilized land areas continue to decrease. (2) The average water yield for different types of land use during this period also varied. It showed grassland > unutilized land > forest > construction land > waterbody > cropland. (3) Climate change has a greater impact on water yield in Maqu County and further increases its contribution to regional water yield. The impact of land use/cover change was smaller and the contribution was smaller.

1. Introduction

Ecosystem services contribute to every benefit humans derive from ecosystems. It includes service delivery, management services, cultural services, and support services. It plays an important role in sustainable human social and socio-economic development [1]. Among supply services, water yield services are dedicated to important ecosystem services in watersheds. It is essential for ecosystems, agriculture, industry, human consumption, hydroelectric power, fisheries, and recreation [2]. On the one hand, water flows affect the level of water resources in global regions and are necessary for human survival and development. As a result, imbalances in water yield may hinder the sustainable development of regional economies [3]. On the other hand, water yield is closely linked to the physical geography and human activities of the area [4]. This will have a direct impact on water resources [5]. There is a need to investigate the main drivers of regional water yield change. This provides a theoretical basis for the sustainable development of regional water resources management [6].
Climate and land use/cover change is a key factor affecting water yield [7]. Climate change can affect water performance by altering precipitation and evaporation in watersheds [8]. Changes in land use/cover may alter the water cycle of watersheds, affecting evaporation, infiltration processes, and water retention patterns, which may affect water yield [9]. Several studies have examined the impact of climate and land use/cover changes on watershed water yield. For example, climate change has a significant impact on water yield in the Missouri River Basin in the United States and the Chubut River Basin in Argentina, demonstrating a positive correlation between climate and water yield [10,11]. By analyzing the effects of land use/cover changes on water yield in the upper San Pedro Basin and Miyun reservoirs in America and China, different land use/cover changes have different effects on water yield [12,13]. Taken together, these studies suggest that both climate and land use/cover changes have a profound impact on regional water yield services. However, most studies have focused only on the impact of single factors such as climate or land use/cover change on water yield. The combined effect of the two on water yield is mainly studied in the Tibetan Plateau [14], the Danjiang River Basin [15], north China [16], the agro-pastoral transitional zone of China [17], the Colorado River Basin [18], etc. A systematic assessment has not been conducted for an important nodal city in the upper Yellow River Basin, Maqu County, which is to be studied in this paper. Therefore, from the angle of water resources protection and sustainable development, this paper focuses on the comprehensive impact of both on water resource yield in Maqu County.
Scenario analysis can simulate the impacts of climate and land use/cover change on water yield services under different scenarios and inform decision-making for optimal water yield service scenarios [19]. For example, four land use/cover scenarios have been designed to assess the impact of future land use/cover changes on water yield services. Soil conservation can increase water yield [20]. Three scenarios were designed to simulate changes in water yield and it was found that precipitation change had a significant impact on water yield [21]. The impacts of multiple land use/cover change scenarios on water quality were assessed and agricultural expansion was found to lead to a significant decline in water quality in Minnesota, United States [22].
Remote sensing technology and hydrological models have developed rapidly since the 1970s. In order to realize the rational allocation of water resources, more and more scholars attempt to quantify, visualize, and refine the evaluation and analysis of regional water yield using model simulations. There are a variety of assessment models, including, inter alia, the InVEST model (Integrated Valuation of Ecosystem Services and Tradeoffs) [23], SWAT model (Soil and Water Assessment Tool) [24], and MIKE SHE model (MIKE system hydrological European) [25], etc. Among them, while the SWAT model is highly efficient for large watersheds, it allows continuous simulation. However, the model requires high parameters and the simulation results are not ideal. For the MIKE SHE model, although it does not rely on actual measurements over time, it enables complete coupling of surface and groundwater. However, it is worth noting that the spatial heterogeneity of the model is not perfect and requires a large number of hydraulic parameters. The InVEST model has significant advantages over the SWAT and MIKE SHE models. Combining GIS technology with ecosystem service assessment, refinement, and quantification has the advantages of convenient data collection, flexible parameter setting, strong spatial expressiveness, and simple operation. Domestic and international scholars widely use this in national and watershed contexts [26,27,28]. For example, countries and regions such as California in the USA [29], Tanzania in Africa [30], the Francoeli River region in northeastern Spain [31], Iran [32], and the United Kingdom [33] have used investment, technology, and enterprise development models to assess the functioning of water yield service with good results. In addition, the water yield module in the InVEST model was used to make a scientific evaluation of water yield and its spatial and temporal distribution characteristics in the Yellow River Basin and Qinghai-Tibet Plateau in China, which provides a scientific basis for improving water yield services in the study area [34,35]. Scientific evaluation of the spatial and temporal distribution of water yield areas provides a theoretical basis for the improvement of water supply services in productive areas. Investment, environment, and technology for development models have been shown to provide reliable assessments of ecosystem services, including water-related ecosystem services [36].
Water plays a vital role in maintaining the ecological balance and sustainability of the carrying capacity of watersheds [37]. The upper Yellow River Basin has a vast territory, with complex geomorphic units, diverse land types, and significant climate change. Its ecological environment is fragile. It is one of the relatively sensitive areas of global climate change. It is an important ecological function area for water conservation, windbreaks, sand control, and biodiversity conservation. Maintaining regional ecological security is of great importance [38]. Therefore, it is of great significance to study the change in water yield in the upper Yellow River Basin. It is of great significance to understand the spatiotemporal variation of water yield and to reveal the controlling factors of this variation in order to protect the ecological environment and maintain the ecological balance of the basin. In particular, Maqu County is an important water recharge area in the Yellow River Basin and plays an important role in increasing the runoff of the Yellow River Basin. The runoff of the upper Maqu River in the Yellow River Basin increased, accounting for 58.7% of the total runoff of the water source [39]. The upper Yellow River Basin is the source of clear water for the Yellow River. Temperatures in the region are relatively low. Water resources in upstream areas are dominated by precipitation. Since it is located in an alpine region, there are also some permafrost meltwater, snow and ice, and groundwater. Water is mainly concentrated in summer and autumn [40]. Therefore, it is of great significance for the management of water resources in the upper Yellow River Basin to study the water resources yield in Maqu County. However, some studies focus only on climate change, and some studies focus only on land use/cover changes. These studies ignore the effect of the combination on water yield. If we combine these two studies, regional water yield may be different. In addition, previous studies have focused on the water yield of the entire Yellow River Basin, and the upper Yellow River Basin in Maqu County has less water yield. Therefore, it is necessary to strengthen the research on water yield in the upper Yellow River Basin in Maqu County to fully understand its impact on runoff in the Yellow River Basin. Therefore, the main purpose of this study is to explore the effects of climate and land use/cover changes on water yield in the upper Yellow River Basin in Maqu County to determine the weight of their contribution to regional water yield. This will contribute to a better understanding of water yield mechanisms and the implementation of water conservation measures in the region. On this basis, the specific objectives of the study are as follows. (1) Calibration and validation of regional climate change and transitions between different land types using climate and land data from the study area from 1990 to 2020. (2) Scenario analysis using calibrated models to estimate water yield in regions and different land use types under climate and land use/cover change. (3) Determine which parameters of climate and land use/cover change are more sensitive to regional water yield impacts.

2. Materials and Methods

2.1. Study Area

Maqu County is located in southern Gansu Province, upstream of the Yellow River Basin at the eastern tip of the Qinghai-Tibet Plateau (100°45′45″–102°29′00″ E, 33°06′30″–34°30′15″ N) (Figure 1). The topography is high in the northwest and low in the southeast, mainly divided into three regions with the northwest alpine region, south-central hilly region, and east riverbank terraces, with a basin area of 1.019 × 10⁴ km2. Maqu County is characterized by an alpine, cold and humid climate with an average annual temperature of 2.9 degrees Celsius and a total annual rainfall of 611.9 mm. The main rivers are the Yellow River and its tributaries, such as the White and Black Rivers. Subalpine meadow soil is the main soil in Maqu County. There are six types of soil: alpine meadow, subalpine meadow soil, meadow soil, bog soil, peat, and black-brown. The vegetation is alpine evergreen leathery scrub, meadow, and grassland vegetation types, and the northwestern part of the area is dominated by alpine scrub meadow, the south-central part by subalpine meadow, and the eastern part by marsh and marshy meadow with a large and concentrated distribution area [41,42].

2.2. Data Sources and Processing

The data required for this study mainly include meteorological data, land use/cover data, soil data, digital elevation data (DEM), etc. Among them, annual precipitation (P) was obtained from the spatially interpolated dataset of the Resource and Environmental Science Data Center of the Chinese Academy of Sciences (https://www.resdc.cn (accessed on 17 August 2022)) (Figure 2a). Annual potential evapotranspiration (ET0) was downloaded from the month-by-month potential evapotranspiration dataset of the National Tibetan Plateau Science Data Center (https://data.tpdc.ac.cn (accessed on 17 August 2022)). The ArcGIS raster calculator was applied to obtain the data and corrected to obtain the raster data for the whole study area (Figure 2b). Soil depth and soil texture data were downloaded from the World Soil Database (http://www.fao.org (accessed on 17 August 2022)) and obtained after spatial rostering attributes, and the maximum depth of root burial of the soil was replaced by soil depth data (Figure 2c) [43]. Plant available water quantity (PAWC) was calculated from soil texture data, data from the USDA Agricultural Research Center (https://www.ars.usda.gov (accessed on 17 August 2022)), combined with an empirical formula [44] (Figure 2d). Land use/cover (LULC) data is derived from land use/cover data from the Resource and Environment Science Data Center of the Chinese Academy of Sciences (https://www.resdc.cn (accessed on 17 August 2022)), including four periods of 1990, 2000, 2010, and 2020 (Figure 2e), and the data production is produced by using Landsat TM/ETM remote sensing images as the main data source, generated by manual visual interpretation. The DEM data were obtained from the geospatial data cloud (https://www.gscloud.cn (accessed on 17 August 2022)), and the sub-Basins were divided using ArcGIS to obtain 81 sub-Basins in Maqu County (Figure 2f). Biophysical coefficients include land use type, evapotranspiration coefficient (Kc), and root depth (Table 1). Among them, taking into account the actual situation of the study area, Maqu County was divided into six primary land use types: cropland, forest, grassland, waterbody, construction land, and unutilized land. In addition, the FAO reference values (https://www.fao.org (accessed on 17 August 2022)) were used for the evapotranspiration coefficient and the standard crop coefficient was used for root depth [45].

2.3. Water Yield Model

In this paper, we use the water yield module of the InVEST model to calculate the regional water yield. The InVEST model is a set of modeling systems used to assess ecosystem services and provide decision-making solutions for ecosystem management, mainly including water production, carbon storage, habitat risk assessment, and erosion protection models [46]. The water yield model is mainly based on the Budyko hydrothermal coupled equilibrium assumption, the model assumes that all water other than evapotranspiration reaches the basin outlet, the model uses the year as the time unit and calculates in raster cells, the model assumptions are based on small basin scale hydrological processes, and finally, the results are output in small basin units [43]. The water yield Y(x) for each grid cell x in the basin is calculated as follows [43].
Y x = { 1 AET x P x } × P x
where AET(x) and P(x) are the annual actual evapotranspiration (mm) and precipitation (mm) at pixel x, respectively.
The vegetation evapotranspiration for different land use types was calculated using the formula [47].
AET x P x = 1 + PET x P x { 1 + { PET x P x } w } 1 / w
where PET(x) is the potential evapotranspiration (mm) and ω is a non-physical parameter that depends on soil and climatic factors that determine the disentanglement of precipitation runoff and evapotranspiration [48]. A watershed with a large ω-value can efficiently convert precipitation into evapotranspiration and vice versa.
PET is calculated as follows.
PET x = K c l x × ET 0 x
where Kc(lx) is the vegetation evapotranspiration coefficient at each pixel associated with LULC, taking values between 0 and 1.5, and ET0(x) is the reference evapotranspiration of pixel x, calculated using the modified Hargreaves formula [49].
ET 0 = 0.0013 × 0.408 × RA × T av + 17 × TD 0.0123 P 0.76
RA is the solar radiation, Tav is the average of daily maximum and minimum temperatures, TD is the difference between daily maximum and minimum temperatures, and P is the monthly precipitation.
w(x) is an empirical parameter and the formula for w(x) based on global data needs to be explored further, and the InVEST model uses the computational formula [50].
w x = Z AWC x P x + 1.25
where the parameter Z is a seasonal constant. It represents the regional precipitation distribution and other hydrological characteristics. Its value is closely related to the average annual number of precipitation events (for regions with the same total precipitation, the higher the number of precipitation events, the larger the Z parameter). The range of values is from 1 to 30 [51]. For example, the Z parameter in the Sanjiangyuan region of Qinghai is 3.50 [52], the Z parameter in the Shule River Basin is 3.33 [53], etc. Budyko’s dryness index theory suggests that the larger the Z parameter, the less the model results are influenced by the seasonal constant Z [54]. It was found that Maqu County, located in the upper reaches of the Yellow River Basin, has a multi-year average surface water resource of about 72 × 108 m3 [55]. These data were entered several times for adjustment and validation. When the Z parameter is 4.02, the water yield is closer to the actual runoff in the study area. The simulation of the model is the best.
AWC x = Min Rest . layer . depth , root . depth × PAWC
where PAWC is the plant’s available water content, i.e., the difference between the field water holding capacity and the wilting point, calculated using the empirical formula [53].
PAWC = 54.509 0.132 SAND 0.003 SAND 2 0.055 SILT 0.006 SILT 2 0.738 CLAY + 0.007 CLAY 2 2.699 OM + 0.501 OM 2
where SAND is the soil sand content, SILT is the soil powder content, CLAY is the soil clay content, and OM is the soil organic matter content.

2.4. Climate and Land Use/Cover Change Scenarios

Using the water yield module in the InVEST model, the water yield of the Maqu region was calculated for 1990, 2000, 2010, and 2020. To better study the effects of climate and land use/cover change on water yield, 12 scenarios were designed using the scenario analysis approach (Table 2, Table 3 and Table 4). Scenario analysis is a method of predicting the possible situations or consequences caused by a forecast object on the assumption, which showed the phenomenon or the trend would continue into the future. It is usually used to make various scenarios or projections about the future development of the forecast object, and that is an intuitive qualitative forecasting method [56]. This study assesses the impact of climate and land use/cover change on water yield over a 30-year period. Historical climate and land data were used for all scenario simulations. Scenario analysis is a method of predicting the possible situations or consequences caused by a forecast object on the assumption that a phenomenon or a trend will continue into the future. It is usually used to make various scenarios or projections about the future development of the forecast object and is an intuitive qualitative forecasting method. This study assesses the impact of climate and land use/cover change on water yield over a 30-year period. Historical climate and land data were used for all scenario simulations. The realistic scenarios are the actual conditions of climate and land use/cover in Maqu County in 1990, 2000, 2010, and 2020. The climate change scenario sets no change in land use/cover and is used to study the impact of climate change on water yield services. To study in depth the impact of climate change on water yield services in different time periods, the period 1990–2020 was subdivided into six time periods 1990–2020, 1990–2010, 1990–2000, 2000–2020, 2000–2010, and 2010–2020, corresponding to Scenario 1, Scenario 2, Scenario 3, Scenario 4, Scenario 5, and Scenario 6 under climate change scenarios. Taking Scenario 1 as an example, the climate factors of Scenario 1 are 2020 data and the land use/cover is 1990 data. Compared with the real scenario in 1990, the land use/cover data remains unchanged and the climate factors change, the impact of climate change on water yield services from 1990 to 2020 can be studied. The climate factors under the land use/cover change scenario remain unchanged, and the impact of land use/cover change on water yield services can be studied. Six time periods, 1990–2020, 1990–2010, 1990–2000, 2000–2020, 2000–2010, and 2010–2020, correspond to Scenario 7, Scenario 8, Scenario 9, Scenario 10, Scenario 11, and Scenario 12 under the land use/cover change scenario, respectively. The impact of climate change and land use/cover change on water yield services at different time periods is revealed by comparing 12 scenarios with real-life scenarios.
The extent to which climate change and land use/cover change contribute to water yield services, based on changes in water yield under different scenarios, can be quantified using the following equation.
R C = C C + L × 100 %
R L = L C + L × 100 %
where RC is the contribution of climate change to water yield services, RL is the contribution of land use/cover change to water yield services, C is the amount of change in water yield under the climate change scenario, and L is the amount of change in water yield under the land use/cover change scenario.

3. Results and Analysis

3.1. Variation Pattern of Climate Factors in Maqu County

The climatic factors of the water yield model mainly include precipitation and potential evapotranspiration. Precipitation in Maqu County was 755.85, 760.38, 799.05, and 904.50 mm in 1990, 2000, 2010, and 2020, respectively, showing a significant increase trend (48.46 mm/10 a) (Figure 3). Among them, the precipitation increased by 4.53 mm (0.60%) in 2000, 43.20 mm (5.72%) in 2010, and 148.65 mm (19.67%) in 2020 compared to 1990. The potential evapotranspiration in Maqu County was 640, 673, 661, and 726 mm in 1990, 2000, 2010, and 2020, respectively, showing an overall fluctuating increasing trend (24.6 mm/10 a) (Figure 4). Among them, the potential evapotranspiration increased by 33 mm (5.16%) in 2000, 21 mm (3.28%) in 2010, and 86 mm (13.44%) in 2020 compared to 1990.

3.2. Variation Pattern of Land Use/Cover in Maqu County

Land use/cover changes occurred in Maqu County during 1990–2020 (Figure 5 and Figure 6). In 2020, the grassland area accounted for 73.61% of the total area of Maqu County and was the most dominant land use/cover type, mainly distributed in the southwestern parts of the west, central, and southeast. Unutilized land accounts for 16.65% of the total area, mainly distributed in the southeast regions. Forest accounts for 7.96% of the total area, mainly distributed in the western and northeastern regions. In addition, the areas of the waterbody, construction land, and cropland are relatively small, each accounting for less than 2%. During 1990–2020, the grassland area increased by 95 km2 (1.39%), mainly unutilized land (719 km2) and forest (453 km2) were transformed. The area of forest decreased by 21 km2 (2.73%), mainly converted to grassland (453 km2). The area of unutilized land during this period decreased significantly by 139 km2 (8.15%), mainly transformed into grassland (719 km2). The area of cropland, forest, and unutilized land decreases and that of grassland, waterbody, and construction land increases year by year, indicating that the implementation of the policy of returning grazing land to grassland, the acceleration of unutilized land use, and economic development led to the change of land use structure in Maqu County. In addition, the average interannual variation of the forest, grassland, waterbody, construction land, and unutilized land in 2010–2020 is greater than that in 1990–2000 and 2000–2010, while the average interannual variation of cropland in 2010–2020 is smaller than that in 1990–2000 and 2000–2010.

3.3. Variation Pattern of Water Yield in Maqu County

The depth of water yield in different land use types in Maqu County from 1990 to 2020 showed differences (Table 5). From high to low, they are construction land, grassland, unutilized land, cropland, forest, and waterbody, in order.
The average water yield in Maqu County was 55.94 × 10⁸ m3, 53.61 × 10⁸ m3, 60.25 × 10⁸ m3, and 76.66 × 10⁸ m3 in 1990, 2000, 2010, and 2020, respectively, showing a fluctuating increasing trend (6.88 × 10⁸ m3/30 a) (Figure 7). Compared to 1990, the average water yield decreased by 2.33 × 10⁸ m3 (4.17%) in 2000, increased by 4.31 × 10⁸ m3 (7.70%) in 2010, and increased by 20.72 × 10⁸ m3 (37.04%) in 2020.
There were significant differences in the water yield of different land use types in Maqu County from 1990 to 2020 (Table 6). From high to low, they are grassland, unutilized land, forest, construction land, waterbody, and cropland. In general, the water yield of grassland is higher, and that construction land, waterbody, and cropland are lower.

3.4. Impact of Climate Change on Water Yield in Maqu County

Under the scenario of constant land use/cover, but climate change (Table 7), the average water yield of Scenario 1 was 76.63 × 10⁸ m3 and an increase of 20.69 × 10⁸ m3 (36.99%) over the 1990 true scenario (Figure 8a). Water yields of all land use types increased and the biggest increase was in grassland. The average water yield of Scenario 2 was 60.23 × 10⁸ m3, an increase of 4.29 × 10⁸ m3 (7.67%) over the 1990 true scenario (Figure 8b). Water yields of all land use types increased and the biggest increase was in grassland. The average water yield of Scenario 3 was 53.60 × 10⁸ m3, a decrease of 2.34 × 10⁸ m3 (4.18%) from the 1990 true scenario (Figure 8c). Water yields of all land use types decreased and the biggest decrease was in grassland. The average water yield of Scenario 4 was 76.63 × 10⁸ m3, an increase of 23.02 × 10⁸ m3 (42.94%) over the 2000 true scenario (Figure 8d). All types of land use water yield increased and the largest increase was in grassland. The average water yield in Scenario 5 was 60.24 × 10⁸ m3, an increase of 6.63 × 10⁸ m3 (12.37%) over the 2000 true scenario (Figure 8e). All types of land use water yield increased and the largest increase was in grassland. The average water yield of Scenario 6 was 76.64 × 10⁸ m3, an increase of 16.39 × 10⁸ m3 (27.20%) over the 2010 real scenario (Figure 8f). All types of land use water yield increased and the largest increase was in grassland.

3.5. Impact of Land Use/Cover Change on Water Yield in Maqu County

In the land use/cover change scenario while the climate is constant (Table 8), the average water yield of Scenario 7 is 55.97 × 10⁸ m3, an increase of 0.03 × 10⁸ m3 (0.05%) over the 1990 true scenario (Figure 9a). The increase in water yield is grassland, waterbody, and construction land, and the decrease is cropland, forest, and unutilized land. The average water yield of Scenario 8 is 55.95 × 10⁸ m3, an increase of 0.01 × 10⁸ m3 (0.02%) over the 1990 true scenario (Figure 9b). The water yield of forest, grassland, and construction land increases, and cropland, waterbody, and unutilized land decrease. The average water yield of Scenario 9 is 55.94 × 10⁸ m3, which is the same water yield as the real scenario in 1990 (Figure 9c). The water yield of construction land and unutilized land increases, and cropland, forest, grassland, and waterbody decrease. The average water yield of Scenario 10 is 53.64 × 10⁸ m3, which is 0.03 × 10⁸ m3 (0.06%) more than the real scenario in 2000 (Figure 9d). The water yield of the waterbody increases and other land use types decrease. The average water yield of Scenario 11 is 53.62 × 10⁸ m3, which is 0.01 × 10⁸ m3 (0.02%) more than the real scenario in 2000 (Figure 9e). The increase in water yield is forest, grassland, and construction land, and the decrease is cropland and unutilized land. The average water yield of Scenario 12 is 60.27 × 10⁸ m3, which is 0.02 × 10⁸ m3 (0.03%) more than the real scenario in 2010 (Figure 9f). The increase in water yield is grassland, waterbody, and construction land, and the decrease is cropland, forest, and unutilized land.

3.6. Quantification of the Contribution Degree for Water Yield

Climate change has contributed up to 99.88% of water yield during 1990–2000, while land use/cover change contributed only 0.12%. The contribution of climate change to water yield was 99.87% and that of land use/cover change was 0.13% for the period 2000–2010. The contribution of climate change to water yield from 2010 to 2020 is 99.87% and the contribution of land use/cover change is 0.13%. Overall, the contribution of climate change to water yield in Maqu County was 99.84%, and the contribution of land use/cover change to water yield was 0.16% for the period 1990–2020 (Table 9). The contribution of climate change to water yield in Maqu County was above 99% for 30 years, and the contribution of land use/cover change to water yield was below 1%. The results indicate that the contribution of climate change to water yield in the study area is much higher than that of land use/cover change.

4. Discussion

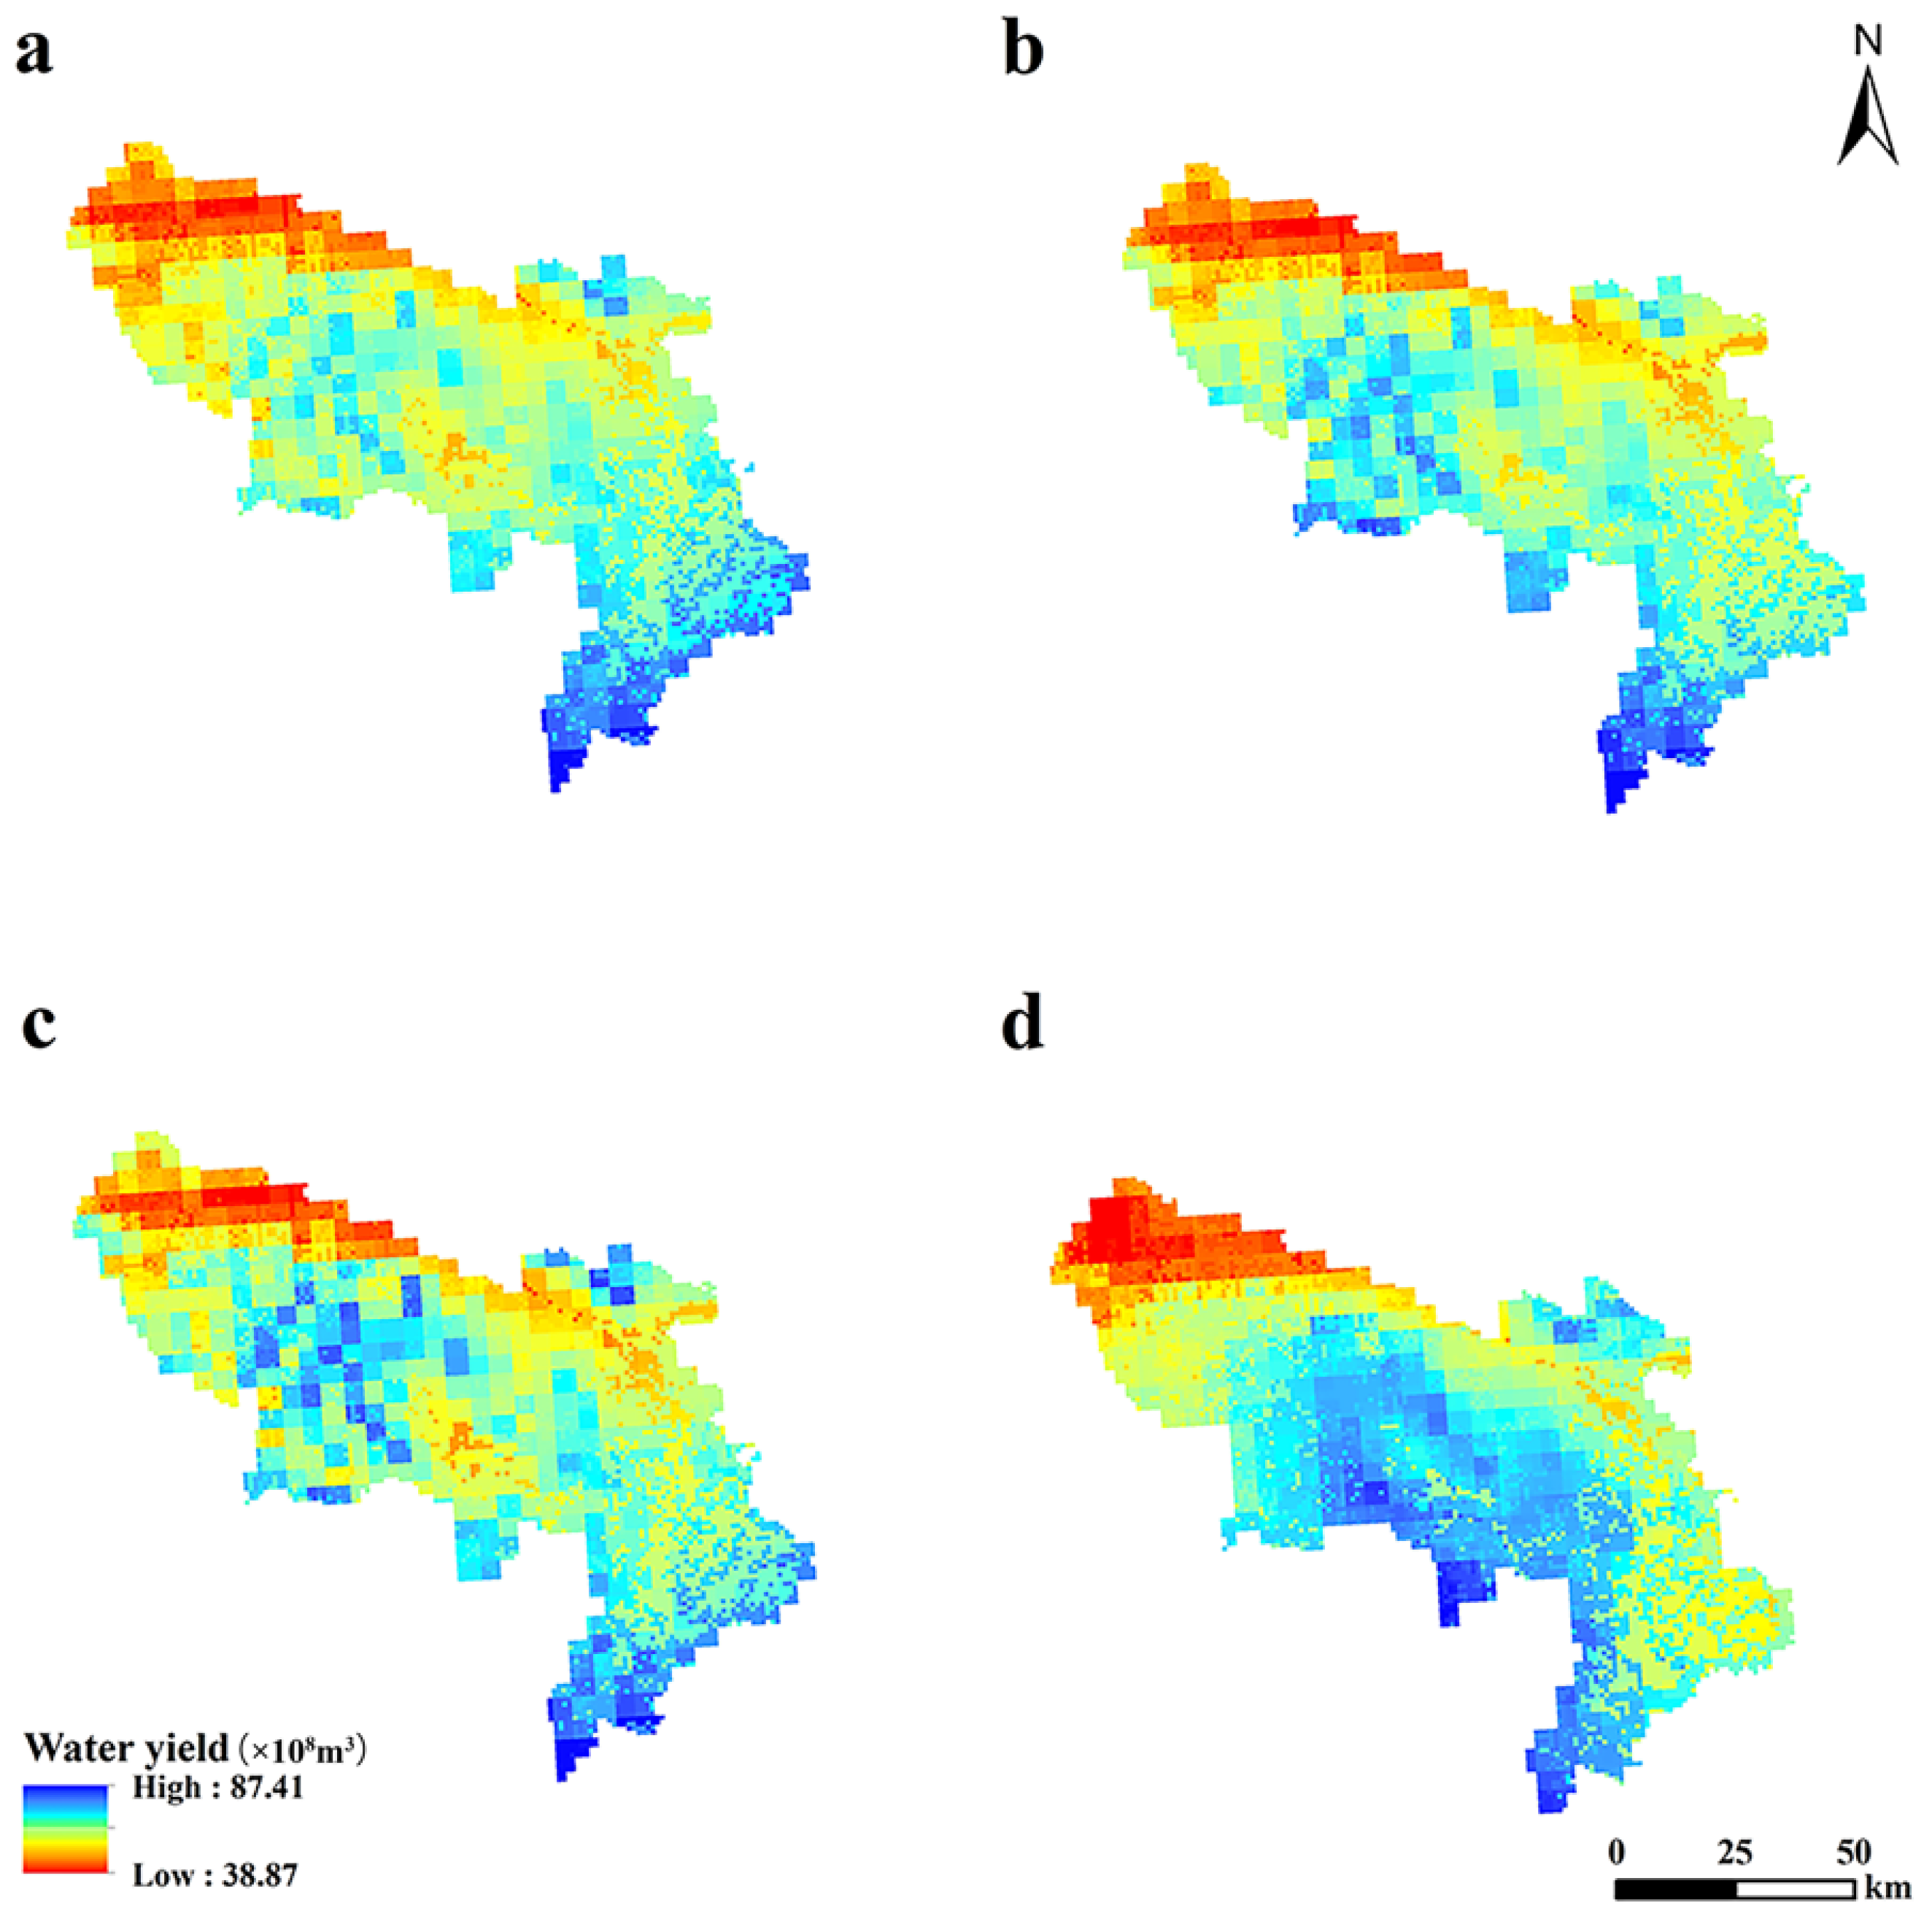
Precipitation, actual evaporation, and balance in the basin have a direct impact on the volume of water yield [57]. The results showed that water yield in Maqu County ranged from 38.87 × 10⁸ m3 to 87.41 × 10⁸ m3 between 1990 and 2020. It has significant interannual and spatial variations. The water yield in the study area showed a fluctuating upward trend (6.88 × 10⁸ m3/30 a), which is directly related to the increase in precipitation during this period. Since the turn of the 21st century, the Yellow River Basin has received more precipitation overall, and the trend of river runoff decline has slowed [58,59]. Evapotranspiration in 56.5% of the Yellow River Basin is on a downward trend, precipitation is increasing markedly, actual evaporation is decreasing, and water yield volume is bound to increase [60].
In this study, we found differences in water yield depth between different land use types, as demonstrated by construction land > grassland > unutilized land > cropland > forest > waterbody, which is consistent with many previous studies [61]. The surface of a construction site is usually made of concrete, asphalt, and cement. Precipitation tends to form runoff quickly upon arrival due to its impermeable surface. As a result, less water infiltration increases water yield [62]. The reason for the low yield of forest water is that forest vegetation has deep roots and can effectively trap precipitation. At the same time, the transpiration of trees is also strong. Forest floors can also retain precipitation through forest canopy layers, absorb precipitation from the dreaded layer, and penetrate the soil layer, reducing surface runoff and regional water yield [63]. The regulating effect of cropland and grassland on rainfall is similar to that of the forest, which is also smaller than that of the forest due to the differences in plant density and root depth. As a result, their infiltration water is lower than that of forests and water yield is relatively high. By contrast, a waterbody is most prone to runoff. This is because precipitation reaches the surface directly, but is accompanied by intense evaporation. As a result, increased water volume reduces water yield. Unutilized land filters only a small amount of water. Precipitation seeps directly into the ground or forms runoff, increasing water yield [64].
Land transfer between different land use types may lead to an increase or decrease in land yield and water resources. For example, an increase in the area of land for construction increases water yield with increasing precipitation, while an increase in forest area leads to a decrease in water yield. Compared with other types of land use, the infiltration volume of construction land is relatively small and the water yield is high. Therefore, any shift from other land use types to construction land types will lead to an increase in water yield. Urbanization has led to an increase in the area of land used for construction, which in turn has increased water yield. However, urban areas are impermeable surfaces, and most of the precipitation reaches the ground and enters urban drainage pipes, making it difficult for humans to use. Improving water supply is therefore the key to the effective use of precipitation [65].
Between 1990 and 2020, the grassland area continued to increase by 95 km2 (1.39%), mainly from the conversion of forest and unutilized land. The increase in grassland area shows that animal husbandry is the main economic development in our region, and the proportion of animal husbandry is increasing year by year. The conversion of forests and unutilized land has led to a homogenization of industrial development patterns and a reduction in the structural diversity of land use. The area of unutilized land decreased significantly by 139 km2 (8.15%) over 30 years, mainly transformed into forest, grassland, waterbody, and construction land. With the acceleration of the urbanization process, the scale of construction land continues to expand and cropland and unutilized land are converted into construction land. Therefore, land resources should be developed and utilized rationally to protect vegetation areas in order to promote the hydrological cycle and maintain the stability of the ecosystem in Maqu County.
Different types of land area in Maqu County vary greatly, with grasslands accounting for the largest proportion, about 72% of the total area, arable land and construction land accounting for less than 1% of the total area, and different types of land and water yield vary greatly. On the one hand, in the last 30 years, the yield of grassland water has generally increased due to the increase in precipitation. On the other hand, unutilized land and forests are mainly converted into grasslands, and the increase in grassland area further increased water yield [66].
According to the water balance principle, precipitation and actual evaporation are two important aspects that determine water yield [67]. Precipitation is an important variable in climate change, and actual evapotranspiration is influenced by a combination of climatic conditions and land use/cover. Climatic factors are mainly controlled by natural conditions, and human factors have less influence on precipitation. Changes in land use/cover are more affected by human activities but less by water yield, which may be due to the complexity of the change process [68]. An analysis of 12 scenarios found that between 1990 and 2020, the impacts of climate change on land use types of water yield services in Maqu County were more pronounced in 2020. Quantitative analysis of contributions showed that the contribution of climate change to water yield is much greater than that of land use/cover change, which is consistent with the findings of the Yangtze River Basin [15] and the Blue Nile River Basin [69]. That is, climate change is the main driver of water yield change in the study area. At the same time, sensitivity analysis of input parameters revealed that precipitation was the most sensitive factor affecting water yield in the upper Yellow River Basin, and land use/cover had little impact on water yield [70]. In the results of this study, this may be one of the reasons why climate change contributes more to water yield than land use/cover change.
Land use/cover change is one of the most important responses to global environmental change, terrestrial ecosystems, and global climate change [71]. Studies show that changes in land use/cover can affect climate change, mainly through biogeochemical processes and biophysical processes [72]. Conversely, climate change also affects changes in land use/cover, which can be divided into three broad categories of long-term change, interannual change, and seasonal change [73]. The study found that the most significant land use/cover changes in the western region occurred mainly in the extremely arid desert and around the Gobi [74]. This study is located in the upper Yellow River Basin in Maqu County, and the interannual variation of the different land use types in the study area is small. This indicates that climate plays an important role in land use types in the upper Yellow River Basin. At the same time, the sensitivity of cropland, forest, and waterbody to climate is gradually decreasing, while the sensitivity of grassland, construction land, and unutilized land to climate is increasing. We predict little change in cropland, forest, and waterbody, while grassland, construction land, and unutilized land will change significantly in the future. The primary cause showed the unutilized land would be gradually converted into wetlands and grasslands with abundant precipitation. On the contrary, grasslands will gradually become deserts, sand with little precipitation.
Precipitation is the main condition for water yield, and the effects of land use/cover change on water yield cannot be ignored, so combining land use/cover change with climate data to study water yield impacts is more convincing. It is important to note that the impact of land use/cover on climate conditions is often overlooked and that research is focused on specific regions with the issue of scale remaining an outstanding international issue. Therefore, this study uses the upper Yellow River Basin to model and analyze future changes in water yield in the basin while predicting future climate and land use/cover changes. Changes in climate and land use/cover are the main factors affecting water yield. Initially, most research in this area was qualitative. For example, it was concluded through comparative experiments that the flow production and sand production gradually increased with increasing rainfall intensity by using artificially simulated rainfall methods and setting four rainfall intensities [75]. The increases in urban areas in catchment areas resulted in small increases in average and high runoff, while increases in tree cover are not significant for flow change based on the relationships between high, medium, and low runoff and changes in urbanization or tree cover in catchment areas in the U.S. from 1992 to 2018 [76]. In contrast, the quantitative analysis of the effects of changes in climate and land use/cover on water yield has been a trend in recent years [77]. Therefore, we studied the factors affecting water yield in the upper Yellow River Basin in Maqu County through quantitative model simulations, and it was found that the impact of climate change on water yield in Maqu County showed a downward trend and an upward trend in land use/cover change. We expect future land use/cover changes to have a greater impact on regional water yield, so how planned land is developed in the future is critical for us. Currently, climate change is a major factor affecting water yield change. However, water yield change is still a complex ecological process driven by multi-factor coupling based on the ecological processes of the hydrological cycle. In addition to natural factors, there are socio-economic factors, policy factors, and other human-made factors. In future studies, we will consider a further analysis of factors beyond the natural factors within the scope of our study. Water conservation and utilization, as well as ecological planning and management, are fully integrated with local conditions.
Climate factors of precipitation and evaporation directly influence the formation and variation of water yield. The higher the rainfall, the higher the water yield in the basin. The heavier the rainfall, the greater the likelihood of flooding in the short term. Evaporation is mainly limited by air saturation difference and wind speed. The higher the saturation difference, the higher the wind speed, and the stronger the evapotranspiration [78]. The main effects of land use/cover change on water yield are hydrological cycle processes and water quality changes. Watershed water volume is influenced by changes in surface evapotranspiration, soil moisture status, and surface vegetation retention in the hydrological cycle [79]. In this study, the contribution of climate and land use/cover change to water yield was calculated through scenario simulation, and the results showed that climate change contributes significantly more to water yield (>99%) than land use/cover change (<1%), suggesting that climate change is indeed the most important factor affecting water yield in the study region.
While climate change is a major factor affecting water yield, the impact of land use/cover change on water yield cannot be ignored. The amount of water in the study area is mainly affected by precipitation and evaporation. The study area is mainly a pristine pastoral area with relatively few cities and a small population. Therefore, in order to better protect water resources in the studied areas, we should pay more attention to climate change, such as setting up weather monitoring stations to observe climate dynamics in real time. At the same time, some existing land patterns should not be significantly disrupted. Under the premise of maintaining ecological balance and sustainable development, a rational and effective comprehensive management policy should be implemented in Maqu County.
In this study, the scenario simulation analysis assumes that the land use/cover does not change under the change of climate conditions in order to highlight the contribution of the two others. However, the two are bivariate in the real situation. Therefore, the next stage of the study should focus on the nonlinear coupling process between them by changing or varying the model or adding the nonlinear coupling parameters of the two in the model, thus making the calculation of water yield.
This paper puts forward the following suggestions for the development of different regions in Maqu County to promote the economic and social development of Maqu County through the analysis of the spatiotemporal variation characteristics of Maqu County water yield and its influencing factors. Located in the upper Yellow River Basin, Maqu County is a typical climate-change sensitive and ecologically fragile area. To effectively monitor its climate change, we implement ecological restoration-type artificial weather projects and establish meteorological ecological monitoring systems in Gannan of the upper Yellow River. We protect the upper Yellow River through high-quality meteorological services. The central and western regions of China are mainly forests and grasslands. In the future, we will continue to implement ecological policies such as returning pastureland, landscape forests, and lakes to pasture. In the southeast, wetlands and other important ecological function areas are the main focus of security barriers and ecosystem services in the natural ecological background of Maqu County. The wetland ecological restoration and protection policies should be continued in the future. The management of degraded wetlands should strengthen the allocation and adjustment of water resources, intensify the implementation of projects for degrading and rewetting, and restore wetland vegetation. Finally, we should realize the virtuous circle of wetland protection and utilization. While promoting the development of ecological industries and the green economy, it is still necessary to formulate rational plans for urban and rural construction, make effective use of local natural resources and minimize the ecological damage caused by human factors.

5. Conclusions

From 1990 to 2020, rainfall in the upper Yellow River Basin Maqu County showed an overall upward trend. Grassland areas continue to increase, mainly from the conversion of unutilized land. Therefore, we should attach importance to grassland protection and continue to implement the policy of returning pastureland to pasture. The average water yields in 1990, 2000, 2010, and 2020 were 55.94 × 10⁸ m3, 53.61 × 10⁸ m3, 60.25 × 10⁸ m3, and 76.66 × 10⁸ m3, respectively, with fluctuating and increasing trends (6.88 × 10⁸ m3/30 a). Over the past 30 years, the average water yield of different types of land use in Maqu County also varied, as shown by grassland (44.27 × 10⁸ m3) > unused land (10.37 × 10⁸ m3) > forest (4.66 × 10⁸ m3) > construction land (1.25 × 10⁸ m3) > water (0.77 × 10⁸ m3) > cultivated land (0.31 × 10⁸ m3). Therefore, the water resources of the Yellow River should be used rationally and the water control system of the Yellow River Basin should be established. Climate change has a greater impact on water yield services, with 99.84 percent of water yield and 0.16 percent of land use/cover change in Maqu County from 1990 to 2020. Therefore, ecological restoration-based artificial weather projects are implemented in the upper Yellow River of Gannan to effectively carry out dynamic monitoring of climate change. At the same time, the impact of land use/cover change on land yield and water volume is slowly increasing, and land should be rationalized in the future.

Author Contributions

Data curation, X.C.; formal analysis, L.J. and X.C.; funding acquisition, L.J.; investigation, X.C., H.Q. and J.W.; methodology, X.C.; software, X.C.; writing—original draft, L.J. and X.C.; writing—review and editing, L.J. All authors have read and agreed to the published version of the manuscript.

Funding

This research was supported by the CAS “Light of West China” Program (2020XBZG-XBQNXZ-A), Natural Science Foundation of Gansu (No. 20JR10RA093), and the Research Ability Promotion Program for Young Teachers of Northwest Normal University (NWNU-LKQN2019-4).

Acknowledgments

We would like to thank our colleagues at the Northwest Normal University for their help in the writing process. We are grateful to anonymous reviewers and editorial staff for their constructive and helpful suggestions.

Conflicts of Interest

The authors declare no conflict of interest.

References

  1. Lang, Y.; Song, W.; Deng, X. Projected land use changes impacts on water yields in the karst mountain areas of China. Phys. Chem. Earth 2018, 104, 66–75. [Google Scholar] [CrossRef]
  2. Pessacg, N.; Flaherty, S.; Brandizi, L.; Solman, S.; Pascual, M. Getting water right: A case study in water yield modelling based on precipitation data. Sci. Total Environ. 2015, 537, 225–234. [Google Scholar] [CrossRef] [PubMed]
  3. Li, Z.; Xu, X.; Xu, C.; Liu, M.; Wang, K. Dam construction impacts on multiscale characterization of sediment discharge in two typical karst watersheds of southwest China. J. Hydrol. 2018, 558, 42–54. [Google Scholar] [CrossRef]
  4. Sun, S.; Sun, G.; Cohen, E.; McNulty, S.G.; Caldwell, P.V.; Duan, K.; Zhang, Y. Projecting water yield and ecosystem productivity across the United States by linking an ecohydrological model to WRF dynamically downscaled climate data. Hydrol. Earth Syst. Sci. 2016, 20, 935–952. [Google Scholar] [CrossRef]
  5. Smith, E.J. The Balance between Public Water Supply and Environmental Needs. Water Environ. J. 2010, 11, 8–13. [Google Scholar] [CrossRef]
  6. De Cauwer, V.; Muys, B.; Revermann, R.; Trabucco, A. Potential, realised, future distribution and environmental suitability for Pterocarpus angolensis DC in southern Africa. For. Ecol. Manag. 2014, 315, 211–226. [Google Scholar] [CrossRef]
  7. Yu, X.; Xie, X.; Meng, S. Modeling the responses of water and sediment discharge to climate change in the Upper Yellow River Basin, China. J. Hydrol. Eng. 2017, 22, 05017026. [Google Scholar] [CrossRef]
  8. Nazir, M.H.M.; Sulaiman, W.N.A.; Juahir, H. Hydrologic response characteristics of a tropical catchment to land use changes: A case study of The Nerus catchment. Environ. Earth Sci. 2015, 73, 7533–7545. [Google Scholar] [CrossRef]
  9. Kim, S.; Jung, Y. Application of the InVEST model to quantify the water yield of North Korean forests. Forests 2020, 11, 804. [Google Scholar] [CrossRef]
  10. Costa, M.J.; Salgado, R.; Santos, D.; Levizzani, V.; Bortoli, D.; Silva, A.M.; Pinto, P. Modelling of orographic precipitation over Iberia: A springtime case study. Adv. Geosci. 2010, 25, 103–110. [Google Scholar] [CrossRef]
  11. Stone, M.C.; Hotchkiss, R.H.; Stone, A.B. Climate change impacts on Missouri River Basin water yields: The influence of temporal scales. In Impacts of Global Climate Change; ASCE: Reston, VA, USA, 2005; pp. 1–10. [Google Scholar]
  12. Zhang, L.; Cheng, L.; Chiew, F.; Fu, B. Understanding the impacts of climate and landuse change on water yield. Curr. Opin. Environ. Sustain. 2018, 33, 167–174. [Google Scholar] [CrossRef]
  13. Li, Y.; Piao, S.; Li, L.Z.X.; Chen, A.; Wang, X.; Ciais, P.; Huang, L.; Xu, L.; Peng, S.; Zeng, Z.; et al. Divergent hydrological response to large-scale afforestation and vegetation greening in China. Sci. Adv. 2018, 4, 4182. [Google Scholar] [CrossRef]
  14. Li, D.; Tian, P.; Luo, H.; Hu, T.; Dong, B.; Cui, Y.; Khan, S.; Luo, Y. Impacts of land use and land cover changes on regional climate in the Lhasa River basin, Tibetan Plateau. Sci. Total Environ. 2020, 742, 140570. [Google Scholar] [CrossRef]
  15. Li, M.; Liang, D.; Xia, J.; Song, J.; Cheng, D.; Wu, J.; Cao, Y.; Sun, H.; Li, Q. Evaluation of water conservation function of Danjiang River Basin in Qinling Mountains, China based on InVEST model. J. Environ. Manag. 2021, 286, 112212. [Google Scholar] [CrossRef]
  16. Pei, H.; Liu, M.; Shen, Y.; Xu, K.; Zhang, H.; Li, Y.; Luo, J. Quantifying impacts of climate dynamics and land-use changes on water yield service in the agro-pastoral ecotone of northern China. Sci. Total Environ. 2021, 809, 151153. [Google Scholar] [CrossRef]
  17. Cao, Q.; Yu, D.; Georgescu, M.; Han, Z.; Wu, J. Impacts of land use and land cover change on regional climate: A case study in the agro-pastoral transitional zone of China. Environ. Res. Lett. 2016, 10, 124025. [Google Scholar] [CrossRef]
  18. Upreti, R. Impacts of Land Use and Land Cover Change on Urban Hydroclimate of Colorado River Basin; Arizona State University: Tempe, AZ, USA, 2017. [Google Scholar]
  19. Schirpke, U.; Candiago, S.; Vigl, L.E.; Jäger, H.; Labadini, A.; Marsoner, T.; Meisch, C.; Tasser, E.; Tappeiner, U. Integrating supply, flow and demand to enhance the understanding of interactions among multiple ecosystem services. Sci. Total Environ. 2018, 651, 928–941. [Google Scholar] [CrossRef]
  20. Gao, J.; Li, F.; Gao, H.; Zhou, C.; Zhang, X. The impact of land-use change on water-related ecosystem services: A study of the Guishui River Basin, Beijing, China. J. Clean. Prod. 2015, 163, S148–S155. [Google Scholar] [CrossRef]
  21. Zheng, H.; Zhang, L.; Zhu, R.; Liu, C.; Sato, Y.; Fukushima, Y. Responses of streamflow to climate and land surface change in the headwaters of the Yellow River Basin. Water Resour. Res. 2009, 45, W00A19. [Google Scholar] [CrossRef]
  22. Polasky, S.; Nelson, E.; Pennington, D.; Johnson, K.A. The Impact of Land-Use Change on Ecosystem Services, Biodiversity and Returns to Landowners: A Case Study in the State of Minnesota. Environ. Resour. Econ. 2011, 48, 219–242. [Google Scholar] [CrossRef]
  23. Zhang, C.; Li, W.; Zhang, B. Water Yield of Xitiaoxi River Basin Based on InVEST Modeling. J. Resour. Ecol. 2012, 3, 50–54. [Google Scholar] [CrossRef]
  24. Li, Z.; Zhang, W.C. Responses of Water Resources to Climatic Changes in the Upper Stream of the Hanjiang River Basin Based on Rainfall-Runoff Simulations. Resour. Sci. 2005, 27, 16–22. [Google Scholar] [CrossRef]
  25. Mcmichael, C.E.; Hope, A.S.; Loaiciga, H.A. Distributed hydrological modelling in California semi-arid shrublands: MIKE SHE model calibration and uncertainty estimation. J. Hydrol. 2006, 317, 307–324. [Google Scholar] [CrossRef]
  26. Cong, W.; Sun, X.; Guo, H.; Shan, R. Comparison of the SWAT and InVEST models to determine hydrological ecosystem service spatial patterns, priorities and trade-offs in a complex basin. Ecol. Indic. 2020, 112, 106089. [Google Scholar] [CrossRef]
  27. Vázquez, R.F.; Feyen, J. Assessment of the effects of DEM gridding on the predictions of basin runoff using MIKE SHE and a modelling resolution of 600 m. J. Hydrol. 2007, 334, 73–87. [Google Scholar] [CrossRef]
  28. Zhang, X.; Zhang, G.; Long, X.; Zhang, Q.; Liu, D.; Wu, H.; Li, S. Identifying the drivers of water yield ecosystem service: A case study in the Yangtze River Basin, China. Ecol. Indic. 2021, 132, 108304. [Google Scholar] [CrossRef]
  29. Shaw, M.R.; Pendleton, L.; Cameron, D.R.; Morris, B.; Bachelet, D.; Klausmeyer, K.; MacKenzie, J.; Conklin, D.R.; Bratman, G.N.; Lenihan, J.; et al. The impact of climate change on California’s ecosystem services. Clim. Change 2011, 109, 465–484. [Google Scholar] [CrossRef]
  30. Fisher, B.; Turner, R.K.; Burgess, N.D.; Swetnam, R.D.; Green, J.; Green, R.E.; Kajembe, G.; Kulindwa, K.; Lewis, S.L.; Marchant, R.; et al. Measuring, modeling and mapping ecosystem services in the Eastern Arc Mountains of Tanzania. Prog. Phys. Geogr. 2011, 35, 595–611. [Google Scholar] [CrossRef]
  31. Marquèsa, M.; Bangash, R.F.; Kumar, V.; Sharp, R.; Schuhmacher, M. The impact of climate change on water provision under a low flow regime: A case study of the ecosystem services in the Francoli river basin. J. Hazard. Mater. 2013, 263, 224–232. [Google Scholar] [CrossRef]
  32. Asadolahi, Z.; Salmanmahiny, A.; Sakieh, Y.; Mirkarimi, S.H.; Baral, H.; Azimi, M. Dynamic trade-off analysis of multiple ecosystem services under land use change scenarios: Towards putting ecosystem services into planning in Iran. Ecol. Complex. 2018, 36, 250–260. [Google Scholar] [CrossRef]
  33. Redhead, J.W.; Stratford, C.; Sharps, K.; Jones, L.; Ziv, G.; Clarke, D.; Oliver, T.H.; Bullock, J.M. Empirical validation of the InVEST water yield ecosystem service model at a national scale. Sci. Total Environ. 2016, 569, 1418–1426. [Google Scholar] [CrossRef] [PubMed]
  34. Yang, D.; Liu, W.; Tang, L.; Chen, L.; Li, X.; Xu, X. Estimation of water provision service for monsoon catchments of South China: Applicability of the InVEST model. Landsc. Urban Plan. 2019, 182, 133–143. [Google Scholar] [CrossRef]
  35. Hu, W.; Li, G.; Gao, Z.; Jia, G.; Wang, Z.; Li, Y. Assessment of the impact of the Poplar Ecological Retreat Project on water conservation in the Dongting Lake wetland region using the InVEST model. Sci. Total Environ. 2020, 733, 139423. [Google Scholar] [CrossRef] [PubMed]
  36. Logsdon, R.A.; Chaubey, I. A quantitative approach to evaluating ecosystem services. Ecol. Model. 2013, 257, 57–65. [Google Scholar] [CrossRef]
  37. Zhang, J.; Zhang, R.; Zhou, D. A study on water resource carrying capacity in the Shule river basin based on ecological footprints. Acta Prataculturae Sin. 2012, 21, 267. [Google Scholar]
  38. Liu, Y.; Lei, H. Responses of Natural Vegetation Dynamics to Climate Drivers in China from 1982 to 2011. Remote Sens. 2015, 7, 10243–10268. [Google Scholar] [CrossRef]
  39. Xue, Z.; Li, W.; Xu, D.; Wang, X.; Yang, Z. Research on eco-economic functional regionalization of important water supply region of the Yellow River in Gannan area. Chin. J. Eco-Agric. 2010, 18, 1093–1098. [Google Scholar] [CrossRef]
  40. Liu, Y.; Wang, X.; Su, Q.; Yi, S.; Miao, X.; Li, Y.; Lu, H. Late Quaternary terrace formation from knickpoint propagation in the headwaters of the Yellow River, NE Tibetan Plateau. Earth Surf. Processes Landf. 2021, 46, 2788–2806. [Google Scholar] [CrossRef]
  41. Qi, D.C.; Li, G.Y.; Chen, W.Y.; Chen, W.Q.; Su, Y.X. Present status, causes and control countermeasures of natural grassland degeneration in Maqu County. J. Desert Res. 2006, 26, 202–207. [Google Scholar]
  42. Qi, D.C.; Li, G.Y. Status, causes and protection countermeasures of wetland degradation in Maqu County in the Upper Yellow River. Wetl. Sci. 2007, 5, 341–347. [Google Scholar]
  43. Sharp, R.; Tallis, H.T.; Ricketts, T.; Guerry, A.D.; Wood, S.A.; Chaplin-Kramer, R.; Nelson, E.; Ennaanay, D.; Wolny, S.; Olwero, N.; et al. Invest Version 3.2. 0 User’s Guide; The Natural Capital Project: Stanford, CA, USA, 2015. [Google Scholar] [CrossRef]
  44. Cai, H.; Ma, W.; Zhang, X.; Ping, J.; Yan, X.; Liu, J.; Yuan, J.; Wang, L.; Ren, J. Effect of subsoil tillage depth on nutrient accumulation, root distribution, and grain yield in spring maize. Crop J. 2014, 2, 297–307. [Google Scholar] [CrossRef]
  45. Allen, R.G.; Pereira, L.S.; Raes, D.; Smith, M. Crop Evapotranspiration-Guidelines for Computing Crop Water Requirements-FAO Irrigation and Drainage Paper 56; Food and Agriculture Organization of the United Nations (FAO): Rome, Italy, 1998; Volume 300, p. D05109. [Google Scholar]
  46. Caro, C.; Marques, J.C.; Cunha, P.P.; Teixeira, Z. Ecosystem services as a resilience descriptor in habitat risk assessment using the InVEST model. Ecol. Indic. 2020, 115, 106426. [Google Scholar] [CrossRef]
  47. Komatsu, H.; Maita, E.; Otsuki, K. A model to estimate annual forest evapotranspiration in Japan from mean annual temperature. J. Hydrol. 2008, 348, 330–340. [Google Scholar] [CrossRef]
  48. Hamel, P.; Guswa, A.J. Uncertainty analysis of a spatially explicit annual water-balance model: Case study of the Cape Fear basin, North Carolina. Hydrol. Earth Syst. Sci. 2015, 19, 839–853. [Google Scholar] [CrossRef]
  49. Cruz-Blanco, M.; Santos, C.; Gavilán, P.; Lorite, I.J. Uncertainty in estimating reference evapotranspiration using remotely sensed and forecasted weather data under the climatic conditions of Southern Spain. Int. J. Climatol. 2014, 35, 3371–3384. [Google Scholar] [CrossRef]
  50. Donohue, R.J.; Roderick, M.L.; Mcvicar, T.R. Roots, storms and soil pores: Incorporating key ecohydrological processes into Budyko’s hydrological model. J. Hydrol. 2012, 436, 35–50. [Google Scholar] [CrossRef]
  51. Negash, W. Catchment dynamics and its impact on runoff generation: Coupling watershed modelling and statistical analysis to detect catchment responses. Int. J. Water Resour. Environ. Eng. 2014, 6, 73–87. [Google Scholar] [CrossRef]
  52. Jiang, C.; Li, D.; Wang, D.; Zhang, L. Quantification and assessment of changes in ecosystem service in the Three-River Headwaters Region, China as a result of climate variability and land cover change. Ecol. Indic. 2016, 66, 199–211. [Google Scholar] [CrossRef]
  53. Wu, C.; Qiu, D.; Gao, P.; Mu, X.; Zhao, G. Application of the InVEST model for assessing water yield and its response to precipitation and land use in the Weihe River Basin, China. J. Arid. Land 2022, 14, 426–440. [Google Scholar] [CrossRef]
  54. Mamat, Z.; Yimit, H.; Eziz, A.; Ablimit, A. Oasis land-use change and its effects on the eco-environment in Yanqi Basin, Xinjiang, China. Environ. Monit. Assess. 2014, 186, 335–348. [Google Scholar] [CrossRef]
  55. Waring, C. Soil water availability effects on the distribution of 20 tree species in western North America. For. Ecol. Manag. 2014, 313, 144–152. [Google Scholar] [CrossRef]
  56. Yin, L.; Pan, J.; Wang, X. Applicability of APEX model for slope scale in the Middle and Upland Huaihe River. Sci. Soil Water Conserv. 2012, 10, 1–7. [Google Scholar]
  57. Yang, J.; Xie, B.; Zhang, D.; Tao, W. Climate and land use change impacts on water yield ecosystem service in the Yellow River Basin, China. Environ. Earth Sci. 2021, 80, 72. [Google Scholar] [CrossRef]
  58. Li, L.; Shen, H.Y.; Dai, S.; Xiao, J.; Shi, X. Response to Climate Change and Prediction of Runoff in the Source Region of Yellow River. Acta Geogr. Sin. 2011, 24, 127–132. [Google Scholar] [CrossRef]
  59. Su, Z.H.; Chen, W.Z. Analysis on Runoff Variation Characteristics of Yellow River Source Region from 1956 to 2012. 2016. Available online: http://en.cnki.com.cn/Article_en/CJFDTotal-ANHE201622102.htm (accessed on 17 August 2022).
  60. Liu, Q.; Yan, C.; Zhao, C.; Yang, J.; Zhen, W. Changes of daily potential evapotranspiration and analysis of its sensitivity coefficients to key climatic variables in Yellow River basin. Trans. Chin. Soc. Agric. Eng. 2014, 30, 157–166. [Google Scholar] [CrossRef]
  61. Zhang, J.; Ross, M.A.; Geurink, J.S.; Gong, H. Modelling vadose zone moisture dynamics in shallow water table settings with the Integrated Hydrologic Model: Field-scale testing and application. Water Environ. J. 2010, 24, 9–20. [Google Scholar] [CrossRef]
  62. Lang, Y.; Song, W.; Zhang, Y. Responses of the water-yield ecosystem service to climate and land use change in Sancha River Basin, China. Phys. Chem. Earth 2017, 101, 102–111. [Google Scholar] [CrossRef]
  63. Edwards, D.P.; Tobias, J.A.; Sheil, D.; Meijaard, E.; Laurance, W.F. Maintaining ecosystem function and services in logged tropical forests. Trends Ecol. Evol. 2014, 29, 511–520. [Google Scholar] [CrossRef]
  64. Wu, J.; Zhong, X.; Peng, J.; Qin, W. Function classification of ecological land in a small area based on ecosystem service bundles: A case study in Liangjiang New Area, China. Acta Ecol. Sin 2015, 35, 3808–3816. [Google Scholar] [CrossRef]
  65. Tallis, H.; Ricketts, T.H.; Daily, G.C.; Polasky, S. Natural Capital: Theory and Practice of Mapping Ecosystem Services; Oxford University Press: Oxford, UK, 2011. [Google Scholar] [CrossRef]
  66. Jie, L.; Zhong, M.; Zeng, G.; Chen, G.; Hua, S.; Li, X.; Yuan, Y.; Wu, H.; Gao, X. Risk management for optimal land use planning integrating ecosystem services values: A case study in Changsha, Middle China. Sci. Total Environ. 2016, 579, 1675–1682. [Google Scholar] [CrossRef]
  67. Li, H.; Lu, Y.; He, W. Impact of Land Use and Land Cover Change on Runoff and Sediment Yield of Qinjiang River Basin. Soil Water Conserv. China 2016, 40–43, 77. [Google Scholar]
  68. Ayoubi, T.; Kang, D. Assessing Impacts of Landuse/Landcover Change on Surface Runoff for Panjshir Watershed:A Watershed Modelling Approach. Int. J. Eng. Tech. Res. 2019, 6, 2454–4698. [Google Scholar]
  69. Belete, M.; Deng, J.; Wang, K.; Zhou, M.; Zhu, E.; Shifaw, E.; Bayissa, Y. Evaluation of satellite rainfall products for modeling water yield over the source region of Blue Nile Basin. Sci. Total Environ. 2020, 708, 134834. [Google Scholar] [CrossRef] [PubMed]
  70. Wang, Y.J.; Li, J.; Lin, Z.H.; Tong, X.J.; Xing, L.M. Assessing the impacts of climate change on the potential evapotranspiration in the upper middle reach of Yellow River. Soil Water Conserv. 2013, 11, 48–56. [Google Scholar]
  71. Lone, T.A.; Singh, H. Land Use/Land Cover Change Detection through Remote Sensing Approach: A Case Ctudy of South Kashmir Anantnag District. 2016. Available online: http://www.journalcra.com/article/land-useland-cover-change-detection-through-remote-sensing-approach-case-study-south-kashmir (accessed on 17 August 2022).
  72. Gavade, A.B.; Rajpurohit, V.S. Systematic analysis of satellite image-based land cover classification techniques: Literature review and challenges. Int. J. Comput. Appl. 2019, 43, 514–523. [Google Scholar] [CrossRef]
  73. Yan, T.; Zhao, W.; Zhu, Q.; Xu, F.; Gao, Z. Spatial distribution characteristics of the soil thickness on different land use types in the Yimeng Mountain Area, China. Alex. Eng. J. 2020, 60, 511–520. [Google Scholar] [CrossRef]
  74. Bo, S. Spatio-Temporal Modelling of Landuse and Land Cover Change in Arid Zone, Northwest China. Ph.D. Thesis, Hong Kong Baptist University, Hong Kong, China, 2010. [Google Scholar]
  75. Chai, Y.; Zhou, B.; Lu, W.; Wu, Y. Erosion process and infiltration features of red soil slumping slope sediment under artificial simulated rainfall condition. Sci. Soil Water Conserv. 2019, 17, 10–15. [Google Scholar]
  76. Anderson, B.J.; Slater, L.J.; Dadson, S.J.; Blum, A.G.; Prosdocimi, I. Statistical Attribution of the Influence of Urban and Tree Cover Change on Streamflow: A Comparison of Large Sample Statistical Approaches. Water Resour. Res. 2022, 58, e2021WR030742. [Google Scholar] [CrossRef]
  77. Zhang, X.M.; Cao, W.H.; Yu, X.X.; Zhang, M.L.; Wang, X.D.; Zhu, B.S. Effects of land use/cover change on runoff sediment discharge in typical watershed in Loess gullied-hilly region of China. Chin. J. Appl. Ecol. 2009, 20, 121–127. [Google Scholar]
  78. Liu, Y.; Yu, K.; Zhao, Y.; Bao, J. Impacts of Climatic Variation and Human Activity on Runoff in Western China. Sustainability 2022, 14, 942. [Google Scholar] [CrossRef]
  79. Zhang, X.; Chen, X.; Zhang, W.; Peng, H.; Xu, G.; Zhao, Y.; Shen, Z. Impact of Land Use Changes on the Surface Runoff and Nutrient Load in the Three Gorges Reservoir Area, China. Sustainability 2022, 14, 2023. [Google Scholar] [CrossRef]
Figure 1. The location map of the study area.
Sustainability 14 10363 g001
Figure 2. Input data of water yield model in 2020. ((a): annual precipitation; (b): potential evaporation; (c): root depth; (d): available water content of plants; (e): land use/cover; (f): substream.)
Sustainability 14 10363 g002
Figure 3. Variation patterns of precipitation in Maqu County in 1990 (a), 2000 (b), 2010 (c), and 2020 (d).
Sustainability 14 10363 g003
Figure 4. Variation patterns of potential evapotranspiration in Maqu County in 1990 (a), 2000 (b), 2010 (c), and 2020 (d).
Sustainability 14 10363 g004
Figure 5. Variation patterns of land use/cover in Maqu County in 1990 (a), 2000 (b), 2010 (c), and 2020 (d).
Sustainability 14 10363 g005
Figure 6. Transition matrix of land use/cover in Maqu County from 1990 to 2020 (I: 1990, II: 2000, III: 2010, IV: 2020, g: cropland, l: forest, c: grassland, s: waterbody, j: construction land, w: unutilized land).
Sustainability 14 10363 g006
Figure 7. Water yield in Maqu County under real scenarios in 1990 (a), 2000 (b), 2010 (c), and 2020 (d).
Sustainability 14 10363 g007
Figure 8. Water yield in Maqu County under climate change scenarios ((a): Scenario 1, (b): Scenario 2, (c): Scenario 3, (d): Scenario 4, (e): Scenario 5, (f): Scenario 6).
Sustainability 14 10363 g008
Figure 9. Water yield in Maqu County under land use/land cover change scenarios ((a): Scenario 7, (b): Scenario 8, (c): Scenario 9, (d): Scenario 10, (e): Scenario 11, (f): Scenario 12).
Sustainability 14 10363 g009
Table 1. Biophysical coefficient table.
The Primary ClassificationThe Secondary ClassificationKcRoot Depth (mm)
CroplandDryland0.652000
ForestWooded land1.005200
Shrubland0.955200
Open woodland0.935200
GrasslandGrassland with high cover0.852600
Grassland with medium cover0.652300
Low-cover grassland0.652000
WaterbodyRiver and canal1.00100
Lakes1.001
Reservoir ponds1.00100
Beachland1.001
Construction landUrban land0.30100
Rural settlements0.20100
Other construction land0.20100
Unutilized landSandy land0.20300
Gobi0.20300
Saline land0.20300
Swampy land0.10300
Bare rocky land0.2010
Other0.201
Table 2. Real-life scenarios.
FactorsClimatic FactorsLand Use/Cover
Scenarios
Real-life scenarios199019901990
200020002000
201020102010
202020202020
Table 3. Climate change scenarios.
FactorsClimatic FactorsLand Use/Cover
Scenarios
Climate change scenariosScenario 120201990
Scenario 220101990
Scenario 320001990
Scenario 420202000
Scenario 520102000
Scenario 620202010
Table 4. Land use/cover change scenarios.
FactorsClimatic FactorsLand Use/Cover
Scenarios
Land use/cover change scenariosScenario 719902020
Scenario 819902010
Scenario 919902000
Scenario 1020002020
Scenario 1120002010
Scenario 1220102020
Table 5. Water yield depth of land use types in Maqu County under real scenarios.
Water Yield (Real Scenario) (Unit: mm)
PeriodCroplandForestGrasslandWaterbodyConstruction LandUnutilized LandMaqu County
1990576.37551.00584.11550.53594.77576.19579.64
2000533.33531.52561.99513.64541.66542.60555.45
2010607.57605.42629.40583.73609.60614.26624.25
2020770.87768.11802.64764.54808.11773.43794.30
Table 6. Water yield of land use types in Maqu County under real scenarios.
Water Yield (Real Scenario) (Unit: ×108 m3)
CroplandForestGrasslandWaterbodyConstruction LandUnutilized LandMaqu County
19900.444.2739.850.630.879.8855.94
20000.324.1138.350.580.989.2753.61
20100.334.7443.010.651.3110.2160.25
20200.145.5055.851.211.8412.1276.66
Table 7. Water yield of land use types in Maqu County under climate change scenarios.
Water Yield (Climate Change Scenario) (Unit: ×108 m3)
CroplandForestGrasslandWaterbodyConstruction LandUnutilized LandMaqu County
Scenario 10.545.7355.160.91.0913.2176.63
Scenario 20.474.7242.940.670.9510.4860.23
Scenario 30.384.1538.480.590.759.2553.60
Scenario 40.475.7154.940.911.3913.2176.63
Scenario 50.414.6842.800.651.2110.4960.24
Scenario 60.375.7855.210.911.5012.8776.64
Table 8. Water yield of land use types in Maqu County under land use/cover change scenarios.
Water Yield (Land Use/Cover Change Scenarios) (Unit: ×108 m3)
CroplandForestGrasslandWaterbodyConstruction LandUnutilized LandMaqu County
Scenario 70.104.1140.370.931.349.1255.97
Scenario 80.304.2939.890.621.219.6455.95
Scenario 90.374.2439.690.621.119.9155.94
Scenario 100.103.9539.010.811.248.5353.64
Scenario 110.264.1638.540.581.069.0253.62
Scenario 120.124.5443.530.911.539.6460.27
Table 9. Weighting of the contribution for climate and land use/cover change to water yield during 1990–2020.
Weighting of the Contribution (%)1990–20002000–20102010–20201990–2020
Climate change percentage99.8899.8799.8799.84
Land use/cover change percentage0.120.130.130.16
Publisher’s Note: MDPI stays neutral with regard to jurisdictional claims in published maps and institutional affiliations.

