Abstract
National key ecological function zones (NKEFZs) in China are critically important to maintain ecological security and accelerate the construction of the ecological civilization system. The quantitative impact of NKEFZs on green development at the county level has not received much attention. In this study, the county-level statistics of the Yanshan–Taihang Mountainous area in Hebei province from 2013 to 2018 were selected as samples. The symbiotic relationship between economy and ecology was measured and development patterns were identified using an improved Lotka–Volterra model. Then, a difference-in-differences (DID) model was used to empirically test the green development effects of establishing NKEFZs, as well as the dynamic changes of the effects and the heterogeneity of different development patterns. The results show that: (1) Green development in the sample area can be classified into four patterns: Low-High, High-Low, High-High, and Low-Low; (2) NKEFZs reduce the level of green development in the study interval and have a persistent negative effect on the level of green development; and (3) NKEFZs have a significant negative effect on areas of Low-High and High-Low development patterns, while the effect on areas of Low-Low development patterns is not significant. Overall, the results indicate that NKEFZs have a negative impact on the green development of the Yanshan–Taihang Mountainous area in Hebei Province. Finally, to promote green development in mountainous areas, the paper makes the following recommendations: Firstly, to improve the transfer payment system for NKEFZs and bring into play a long-term mechanism for the compensation effect of transfer payments. Secondly, to cultivate special industries to achieve the differentiated development of county economies. Thirdly, to accelerate the optimization and adjustment of industrial structures and promote the coordinated development of primary, secondary, and tertiary industries.
1. Introduction
China has achieved rapid economic growth in the past four decades. However, this has also been accompanied by a series of environmental problems such as environmental pollution, the over-exploitation of resources, and ecological degradation [1,2]. These problems may lead to an imbalance in ecosystem structure, reduction in the value of ecological services, and loss of biodiversity [3,4], especially in some key mountainous areas. Territorial spatial planning plays an important role in the rational development of resources and the protection of the ecological environment. It can reduce the disorder and imbalance of the spatial development of the country [5,6,7]. In 2010, the State Council of China issued the National Zoning of Main Functions, which divided the national land space into four types of main function zones: optimized exploitation, key exploitation, restricted exploitation, and prohibited exploitation [8,9]. National key ecological function zones (NKEFZs) perform important ecological functions such as water and soil conservation, water conservation, wind and sand control, and biodiversity maintenance, and are also the key zones to ensure national ecological security and ecological product supply [10]. Such zones are relatively backward in economic development, rich in ecological resources, and have a fragile security base. NKEFZs refer to areas that undertake important ecological functions and guarantee national ecological security and ecological product supply. Most of the NKEFZs are located in mountainous areas, where economic development mainly relies on agriculture, with weak industrial foundations, which make it difficult to boost the regional economy. NKEFZs restrict development activities for urbanization and industrialization, making it more difficult to transform natural resources into economic advantages. Under the premise of maintaining the ecological service function of NKEFZs, how to reduce the degree of mismatch between environmental protection costs and ecological benefits [11], opening up a new path of green development and ecological enrichment, is a realistic proposition for the construction of NKEFZs. To balance and develop the economy of counties in NKEFZs, China has established a transfer payment system for NKEFZs since 2009. NKEFZs and their transfer payment mysteries are necessary to promote the construction of ecological civilization and improve the efficiency of environmental protection [12,13] and are an important measure to optimize the spatial land pattern. However, the NKEFZs are vast and economically backward. The endogenous development of the regional economy cannot be realized only by relying on state financial support [14]. According to the China County Economic Ecological Civilization Index, there are still some mountainous counties that have established NKEFZs developing high energy-consuming industries to varying degrees, undermining the coordinated relationship between ecological protection and economic development. At present, the NKEFZs are under the policy requirement of restricting large-scale development. NKEFZs also need to meet the regional ecological demand. Under these restrictions, can NKEFZs promote green development in mountainous areas? Can it achieve a win-win situation of ecological protection and economic development? These problems are related to the effect of ecological civilization construction and the interests of the people and need to be further discussed.
There are many studies on ecological functional zones in China and other countries, and those related to this study mainly include the following five aspects. Firstly, the evaluation of the effectiveness of ecological services in NKEFZs, which includes various aspects such as water resources protection services [15], wind and sand control services [16,17], and soil and water conservation services [18]. Some researchers also have evaluated the resilience of NKEFZs [19]. Secondly, the fund allocation and compensation effect of transfer payment for NKEFZs. Several countries such as Brazil, Germany, and Portugal have implemented fiscal transfers to compensate local governments for the cost of environmental protection, mainly through direct deductions from corporate and residential taxes for ecological protection based on the development status of local governments and the status of protected zones [20]. Chinese government departments and public social organizations have played a greater role in the transfer of payments to NKEFZs. Thirdly, the degree of coupling and coordination between ecosystems and economic systems in NKEFZs. Fiscal transfers from ecologically functional zones are less pollution-intensive industrial activities [21]. However, some researchers believe that the financial transfer payment system for NKEFZs is imperfect, mainly based on emergency-type and status quo compensation, and the policy formulation lacks foresight, resulting in ecological security and economic development being uncoordinated [22] and often facing double pressure. Fourth is the relationship between NKEFZs and green development. Some researchers argue that NKEFZs will improve environmental quality [23] and will create long-term incentives for county governments to protect ecology. However, NKEFZs will cause shocks to economic growth and thus induce poverty [24], and the short-sightedness of the poor population will destroy the ecological environment and thus create a vicious circle [25], which will negatively affect the green development of NKEFZs. The fifth is the evaluation method of the level of green development of NKEFZs. The research has mainly combined the entropy–TOPSIS evaluation method, Markov chain, and barrier degree model to evaluate the green development level of ecological functional areas and explore the barrier factors of green development level [26]. However, the above methods are difficult to use for measuring the competition between economic and ecological resources and quantitatively analyzing the impact of NKEFZs on the level of green development.
Since the concept of green development was proposed, many studies have appeared for green development. These mainly deal with green policy [27,28], green economy [29], green supply chain [30,31], and many other fields. Zhang et al. (2022) examined the impact of green environmental policies on renewable energy technology innovation to provide insight into the stringency of environmental policy implementation [32]. Hou et al. (2022) studied the impact of government spending on the green economy in each country under the “Belt and Road” and explored the path of government spending for green economy development in each country [33]. Renewable energy and transportation infrastructure are important factors affecting the performance of the green tourism supply chain [34,35]. In addition, many studies have also explored the conditions for achieving green development from both economic transformation and environmental sustainability perspectives. One type of research takes the perspective of economic transformation and argues that technological innovation [36], industrial agglomeration [37], and urbanization [38] will optimize resource allocation efficiency and thus green development. Another type of research has analyzed the realization of green development from the perspective of environmental sustainability, targeting factors such as environmental technology [39], environmental regulation [40], and the transformation of energy consumption structure [41]. NKEFZs, as a major part of the main functional zones policy, will have a greater impact on green development in mountainous areas. The previous research has not paid enough attention to the impact of NKEFZs on green development.
The existing research mainly used geographical zoning as the criterion for heterogeneity analysis [42,43]. The heterogeneity of regional resource endowment and economic development level has not received sufficient attention. Therefore, we introduced an improved Lotka–Volterra model to measure the competition between economic and ecological resources. The heterogeneity of NKEFZs of different development patterns in green development is analyzed based on the measurement results of the improved L–V model. This study uses a difference-in-differences model to empirically analyze the impact of NKEFZs and their dynamic effects, taking some mountain counties in the Yanshan–Taihang Mountainous area in Hebei province from 2013 to 2018 as samples. The mechanism of the impact of the NKEFZs on the green development of mountainous areas is analyzed in depth. The conclusions are expected to provide countermeasures and suggestions for the green development of NKEFZs under the background of restricted development.
2. Model and Data
2.1. Study Area and Framework
The study area of this paper includes 64 counties in the Yanshan–Taihang Mountainous area in Hebei province (see Figure 1). The Yanshan–Taihang Mountainous area has a complex and diverse ecosystem. It is rich in biological, water, and mineral resources and has important ecosystem service functions. The economic development level of the area is lower, and it faces the double pressures of ecological protection and economic development. There are 26 counties in the ecological function zones and 38 counties in the non-ecological function zones.
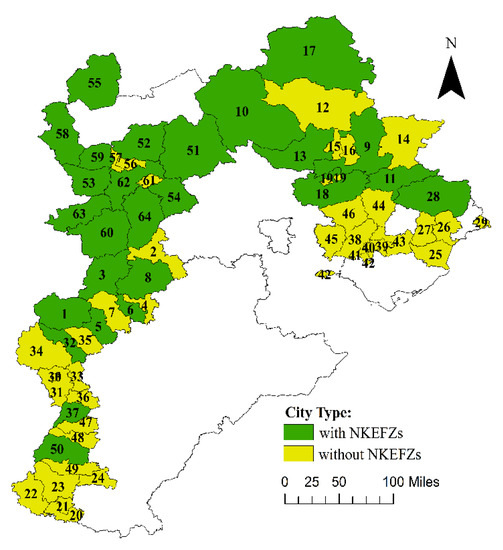
Figure 1.
Study area.
The study framework combines the Lotka–Volterra model and the difference-in-differences model (see Figure 2). Based on the L–V model to measure the symbiotic relationship between economy and ecology, the DID model analyzes the impact of NKEFZs on green development.
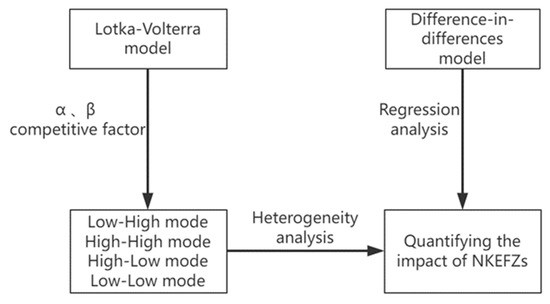
Figure 2.
Study framework.
2.2. Improved Lotka–Volterra Model
2.2.1. Model Setting
This paper uses the Lotka–Volterra interspecific competition model in biology to determine the relationship between ecological and economic development. This model has been widely used to explain the existence of competition between two systems. Current research directions relate to industrial competition [44,45], product innovation, technological progress [46], population and rent [47], and other aspects [48]. Economic development and ecological development together constitute green development. However, the two compete in terms of funding, energy, space, and environment. This competition is similar to the competition between species for survival resources. The Lotka–Volterra model can better reflect the results of the competition between economic and ecological development. Unlike simulating interspecies competition, green development research focuses on the relationship between economic and ecological development. On this basis, this paper assumes that economic development and ecological development have the same social carrying capacity and judges the relative relationship between economic development and ecological development by simulating the competition coefficient. There is competition between economic and ecological development in terms of money, energy, space, and the environment. This study establishes a Lotka–Volterra model between ecological development and economic development to measure the symbiotic relationship between the two and thus determine the green development status of the region.
Assuming that the total capacity of ecological and economic development is T, E1 and E2 represent the actual amount of ecological and economic development, respectively. r1 and r2 are the natural growth rates of ecological and economic development, respectively. α is the competitive inhibition coefficient of economic development, and β is the competitive inhibition coefficient of ecological development on economic development.
In the equilibrium state, both and are 0.
The equilibrium results are related to environmental capacity and competitive coefficients. The state analysis of E1 and E2 can be performed by simulating the values of competition coefficients α and β. This paper assesses the coordination of economic development and ecological development by comparing the relative relationship between E1 and E2:
where R represents the green development pressure. A higher R-value indicates that the area tends to be more economically developed and less ecologically developed. An R-value close to 1 indicates that the level of economic development is closer to the level of ecological development.
2.2.2. Indicators Selection
The competitive inhibition coefficient α indicates the extent to which economic development takes up resources that could have been used for ecological development. Its selected indicators include GDP, the added value of primary industry, the added value of secondary industry, the added value of tertiary industry, household registration population, urban per capita disposable income, general public budget revenue, and general public budget expenditure.
The competition inhibition coefficient β indicates the extent to which ecological development takes up resources that could have been used for economic development. The selected indicators include total sown area of crops, comprehensive air quality index, industrial sulfur dioxide emissions, industrial wastewater emissions, total industrial smoke emissions, the harmless treatment rate of domestic waste, the centralized treatment rate of sewage treatment plants, and the comprehensive utilization rate of general industrial solid waste. Using pollution emission indicators as negative indicators can reflect the constraints of environmental regulations on economic development.
2.3. Difference-in-Differences Model
2.3.1. Model Setting
The difference-in-differences (DID) method is one of the methods commonly used to assess policy effects. It is also effective in assessing the effects of NKEFZs by constructing time and individual dummy variables and multiplying the difference between the experimental and control groups. NKEFZs provide a good “quasi-natural experiment” opportunity for the DID method.
In this paper, the DID model is set as follows:
where i represents region; t represents year; GD is the level of green development; EA denotes the dummy variable of whether to establish an ecological functional area or not, which is the core explanatory variable of the model; X denotes a series of control variables; is the region fixed effect; is the time fixed effect; and ε denotes the disturbance term.
2.3.2. Indicators Selection
- (i)
- Explained variable: Green Development Level (GD)
The entropy value method is used to calculate the level of green development, based on the standardized values of each evaluation index, which are weighted and integrated according to the weights already given. In 2016, the National Development and Reform Commission published the Green Development Indicator System, which comprehensively reflects the connotation and essence of the new concept of green development. However, due to the availability of county-level data in the Taihang Mountains, this paper makes appropriate adjustments to the original indicators to construct an evaluation system of green development indicators. In this paper, the entropy value method is used to determine the weights of the indicator layer. SPSS software was used to test for multicollinearity in the sample values of all indicators. The results show that the variance expansion factors of all indicators were less than 2. It shows that the information contained in the 10 explanatory variables are independent of each other and there is no collinearity. See Table 1.

Table 1.
Green development index system.
- (ii)
- Explanatory variable: Establishment of ecological functional zones (EA)
First, set the individual dummy variable treat. Counties with established ecological functional zones are set as the experimental group (treat = 1) and counties without as the control group (treat = 0). Then, set the time dummy variable time. time = 1 refers to the years when ecological functional zones are established and time = 0 refers to the years where they are not. The interaction term treat*time is a dummy variable for counties of the experimental group, and its estimated coefficient indicates the impact of establishing NKEFZs on the level of green development in the county. Set EA = treat ⁎ time.
- (iii)
- Control variables
Level of industrial development (IN). The output value of the secondary industry has an important impact on the level of regional green development. Industries with high pollution, high energy consumption, and high material consumption are restricted or prohibited in key ecological function areas. This paper chooses the proportion of the output value of secondary industry to GDP to represent the industrial development status.
Level of agricultural development (AR). The output value of primary industry can indicate the development of agriculture, forestry, animal husbandry, fishery industries, etc. In this paper, we choose the proportion of the output value of primary industry to GDP to indicate the level of agriculturalization.
Agro-ecological environment quality (EC). The Yanshan–Taihang Mountainous area relies mainly on traditional agriculture to drive economic growth, but the excessive application of chemical fertilizers can cause adverse effects such as soil acidification and heavy metal pollution. In this paper, the intensity of agricultural fertilizer use (fertilizer application/crop sown area) is chosen to indicate the quality of the agro-ecological environment.
Greening level (VE). Vegetation cover is an important indicator of forest resources and greening level, which is expressed by the normalized vegetation index (NDVI).
2.4. Data
The data of green development level are measured by the entropy method, for which the data of ecological environment quality were obtained from the National Earth System Science Data Center (http://www.geodata.cn, accessed on 7 September 2021). PM2.5 concentration data were obtained from the Atmospheric Composition Analysis Group (ACAG) [49]. Normalized vegetation index (NDVI) data were obtained from the Data and Center for Resource and Environmental Sciences, Chinese Academy of Sciences (http://www.resdc.cn/, accessed on 13 September 2021). All the data were raster data and were parsed into county-level annual average data by ArcGIS software and spatially matched with the 64 district and county administrative units in the Yanshan–Taihang Mountains. Other data were obtained from China County Statistical Yearbook, China City Statistical Yearbook, Hebei Economic Statistical Yearbook, Hebei Province Ambient Air Quality Ranking and Publication Methods, and the statistical yearbooks of municipal cities in Hebei Province in previous years. Some missing data were filled in by mean interpolation. The descriptive statistics of the variables are shown in Table 2.
Table 2.
Descriptive statistics of the variables.
3. Results and Analysis
3.1. Improved Lotka–Volterra Model Results
3.1.1. The Results of the Improved L–V Model
The indicators and weights were input into the model to obtain the results of the α-value, β-value, and R-value of green development pressure in the sample area. The sample areas were classified into four development patterns based on whether they have higher α, β, or R values than average, namely the Low-High model, High-Low model, High-High model, and Low-Low model, as described in Table 3.
Table 3.
Development patterns.
Based on the above measurement results, Figure 3 shows the distribution of all sample indicators. Figure 3a shows the distribution of α-competition factors. The darker the red color, the higher the intensity of economic development. Figure 3b shows the distribution of β-competition factors. The deeper the green, the greater the intensity of ecological development. Figure 3c shows the distribution of green development pressure. The deeper the red, the greater the pressure of economic development on ecological development. The deeper the green, the greater the impact of ecological development on economic development. The yellow color indicates that the level of economic development is similar to the level of ecological development. Figure 3d shows the distribution of green development patterns in the sample area, where red represents the Low-High pattern, green represents the High-Low pattern, yellow represents the High-High pattern, and gray represents the Low-Low pattern.
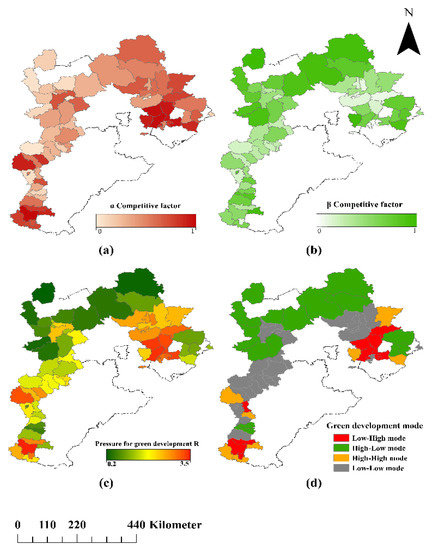
Figure 3.
(a) Distribution of α-value. (b) Distribution of β-value. (c) Distribution of green development pressure. (d) Distribution of green development model.
3.1.2. The Analysis of Green Development Patterns
The sample counties were divided into four categories based on the National Directory of Key Ecological Function Zones and the National Directory of Resource-based Cities (see Figure 4). Resource-based cities (City R) are included in the National Directory of Resource-based Cities only. Ecologically protected cities (City E) are included in the National Directory of Key Ecological Function Zones only. Resource-based ecological cities are included in both directories (City RE). Other cities (City O) are not included in either directory.
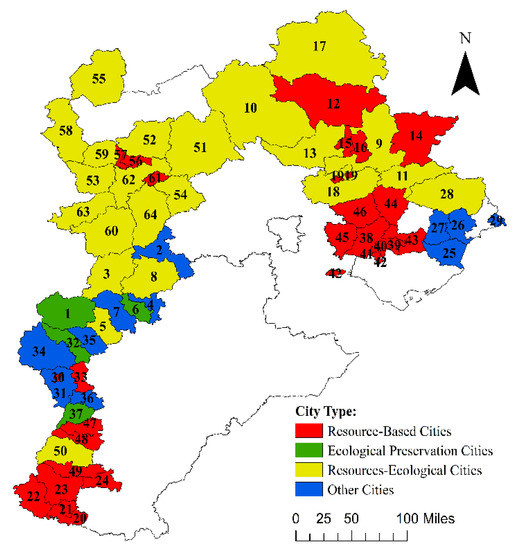
Figure 4.
Four categories of cities.
First, the environmental effects of establishing NKEFZs are not significant. The value of β indicates the pressure of ecological development of a region on its economic development. Regions with bigger β values tend to have a better environment and less pollution. However, results show that the difference in β values between the four types of cities is not significant: R-city, 0.40; E-city, 0.37; RE-city, 0.47; and O-city, 0.43. Surprisingly, City E has the lowest β-value and City RE has the highest β-value. The ecological development of non-resource-based cities designated as ecological reserves has not been significantly enhanced and the results are not satisfactory. In terms of green development patterns, all of Cities E belong to the Low-Low pattern, and 9 of the 22 Cities RE belong to the Low-Low pattern, which indicates that more than half of the cities classified as ecological reserves are low ecological and low economic cities. Combining the analysis of other indicators, this paper concludes that setting areas with poor economic development as ecological functional zones cannot achieve the goal of environmental protection. If these areas are classified as ecological functional zones, restricting the use of natural resources and limiting economic development would have a serious negative impact on the quality of life of residents, who would be discouraged from cooperating with environmental efforts and may even destroy the environment to improve living standards.
Resource-based cities have gone through a period of extensive development. This was a period of high economic growth in China, along with relatively weak awareness of environmental protection and no restrictions on resource exploitation. With increasing ecological needs, more and more ecological reserves are being established. As a result, some resource-based cities with better economic development have produced better environmental protection effects after establishing NKEFZs. However, NKEFZs still have a significant impact on local economic development. On the whole, the environmental protection effect brought by the construction of NKEFZs is not significant.
Second, green development still needs to rely on economic development. Green development needs not only to achieve economic goals but also to meet the requirements of environmental protection. Ecological development and economic development cannot be achieved without one another. The High-High pattern is a development pattern with both strong economic development and ecological development. We believe that this pattern has recently been followed by Green Development. Table 2 shows that five of the eight High-High pattern regions are from City R and three from City O. High-High patterns do not exist in cities that establish NKEFZs. All High-High pattern regions are distributed around the Low-High pattern regions. It can be seen that the intensity of ecological development has not become significantly worse in cities with faster economic development. As the economy develops and basic survival needs are met, people begin to pursue a higher level of happiness. A livable living environment is an important aspect of happiness. Thus, when the economy grows to a certain level, there are intrinsic and extrinsic incentives for environmental protection. To meet residents’ needs for a better ecological environment, the government will increase local environmental regulations, actively restrict production in highly polluting industries, and consciously work on environmental protection. The implementation of environmental regulations may have a negative impact on economic benefits in the early stage [50], but there is a “U-shaped” relationship between environmental regulations and green technology innovation. In the long run, strict environmental regulations can effectively improve the regional ecological environment. Some regions that are committed to environmental reforms have gradually shifted from the Low-High pattern to the High-High pattern and achieved green development. On the other hand, areas with faster economic development can drive the development of neighboring areas. Since the surrounding City O is not a major industrial area, there is even less pollution. O-cities around L-H model cities enter the H-H model first. Whether it is an autonomous ecological reform in the L-H model region or influencing the surrounding areas into green development, results show that green development can only be achieved by developing the economy.
Third, the construction of ecological function areas might hinder local green development. To reduce the environmental damage, the exploitation of most natural resources in ecological function areas is banned. However, government subsidies are not enough to compensate for the loss of residents. The average value of α for resource-based cities is 0.31, which is significantly bigger than for other types of cities (City E—0.11, City RE—0.16, City O—0.20). This reflects the stronger economic development of resource-based cities and is in line with the theory that regional development is determined by resource endowments. It is worth noting that the α-value is smaller in City E than in City O, and in City RE than in City R. It further indicates that the construction of cities as NKEFZs will inhibit local economic development. The α-value of City RE is even smaller than that of City O. NKEFZs make the economic development of resource-based cities less intense than that of non-resource-based cities. The NKEFZs not only prohibit the development of natural resources but also prohibit some polluting enterprises from building factories. This will further inhibit the economic development of NKEFZs. The national government can set up some areas as NKEFZs to solve the ecological security problems of the upgraded areas. For example, the Zhang-Cheng region in the sample is close to Beijing and Tianjin, and its ecological quality directly affects that of Beijing and Tianjin. To maintain the ecological security of the entire Beijing–Tianjin–Hebei region, the government has implemented large-scale ecological construction projects in the Zhang-Cheng region, such as water ecology, grassland ecology, and restoration projects. High energy consumption and high pollution is constrained. At present, the ecological environment of the Zhang-Cheng region has been effectively improved and the ecological indicators show better ecological and environmental results. However, the intensity of economic development in the Zhang-Cheng region is much lower compared to the ecological level. There is a serious imbalance between economic development and ecological development. NKEFZs have sacrificed the quality of life of residents, who have very limited sources of income. Economic development in the ecological reserve is very limited, and it is difficult to achieve green development in this state.
3.2. DID Model Results
3.2.1. Benchmark Regression Analysis
The improved Lotka–Volterra model classified the development patterns of the study area into four types. Based on the results of this model, the impact of the NKEFZs on the green development of mountainous areas was explored using the DID model. The model estimation results are shown in Table 4. It can be seen that the effect of establishing NKEFZs on the level of green development is negative regardless of whether control variables or time and area fixed effects are included or not, i.e., NKEFZs do not promote green development in mountainous areas. The coefficient of EA in the model (8) is significant at the 1% level, again proving the results of the improved Lotka–Volterra model described above. To control the differences by year and region, a subsequent model analysis was conducted using a double fixed effects model. The economic significance of the estimated coefficients from the model shows that, all else being equal, the level of green development in counties with established NKEFZs is 0.0309 units lower compared to counties without established NKEFZs.
Table 4.
Benchmark regression analysis.
Although the NKEFZs will improve the county’s ecological performance to a certain degree, they limit the county’s industrialization process in terms of industrial development, due to the need for ecological protection, which means that ecological counties cannot enjoy the development dividends brought by resource exploitation, while adding environmental protection costs and development losses. China has implemented a transfer payment system for NKEFZs, which gives more transfer payments and policy inclination to counties that have established NKEFZs. However, due to problems in the fund allocation and use, supervision, and assessment and incentive mechanism, the ecological compensation performance of the transfer payments is low, cannot fully cover the financial expenditure gap of ecological counties, and fails to truly promote the green economic development of the counties. Furthermore, the NKEFZs will limit the development of traditional resource-dependent agriculture, which will have an impact on the agricultural industry in these areas that rely mainly on traditional agriculture for economic development. In a word, the NKEFZs can protect the ecological environment of mountainous areas to a certain extent, but they do not lead ecological counties down the road of green development.
3.2.2. Parallel Trend Test and Dynamic Effect Analysis
The construction of the DID model requires satisfying the parallel trend assumption, i.e., the green development levels of established and non-established ecological functional zones should have the same trend of change before the policy is implemented. According to Jia et al. [51], this paper utilizes an empirical regression approach to test the model:
where represents the period of the test and the rest of the variables are set the same as in Equation (8). and represent the interaction terms between the time dummy variables before policy implementation in period n, the current period of policy implementation, and the n period after the policy shock, respectively. In this paper, three years before and two years after the implementation of the policy are selected for validation, and the test results are shown in Figure 5.
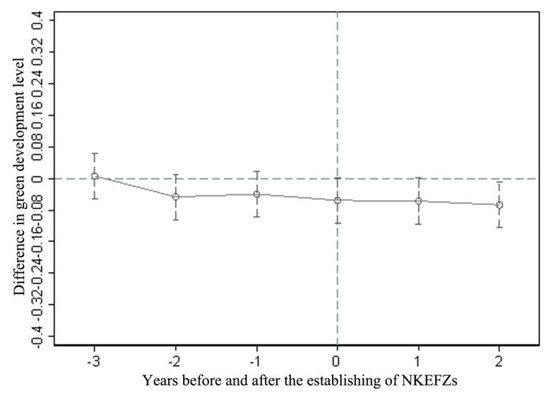
Figure 5.
Parallel trend test and dynamic effect analysis results.
As shown in Figure 5, the coefficients of the EA in each of the three years before the opening of the high-speed railway were not significantly different from zero and passed the parallel trend test. The estimated value of the treatment effect coefficient after the NKEFZs is significantly negative, but the dynamic effect on green development after it is not fully revealed, limited by data availability.
3.2.3. The Heterogeneous Analysis of Green Development Patterns
According to the benchmark regression results, the NKEFZs have a significant inhibitory effect on the economic development of ecological counties, but the impact varies for regions with different development patterns. Since there are no counties that have established NKEFZs showing the High-High development pattern, the areas of the other three patterns are included in the model for analysis in this paper.
It can be seen from the results in Table 5 that the establishment of NKEFZs has a negative impact on the level of regional green development in Low-High and High-Low patterns, while it has a positive impact on green development in the Low-Low pattern, but the regression coefficient is not significant. Regions with Low-High patterns rely mainly on resource-based industries to develop their economy. Since NKEFZs will have a great impact on these industries, and the green service industry that is born with the NKEFZs has not yet become a pillar of economic development, it is difficult to give full play to the value of the ecological resources of the region. Therefore, the NKEFZs have not yet promoted the green development of the Low-High pattern.
Table 5.
Heterogeneous analysis.
The regions with a High-Low pattern have a weak economic base and rely mainly on traditional agriculture for economic development, but the industrial chain of agricultural products in these regions is short, and large-scale characteristic agriculture has not yet been developed, so the NKEFZs will bring great pressure to the regions. Since green and ecological agricultural development patterns have not yet been formed, this, in turn, leads to a low level of green development.
For regions with a Low-Low development pattern, NKEFZs will, on the one hand, promote the improvement of the ecological environment, and on the other hand restrict the regional green development because restrictions on industrialization and urbanization may reduce local fiscal revenue, related infrastructure investment, and construction, as well as service enterprises and foreign investment. So NKEFZs do not improve the green development level of regions with a Low-Low pattern, either.
3.2.4. Robustness Tests
The robustness tests of the benchmark regression results are conducted in the following aspects. First, the study sample was randomly divided into a control group and an experimental group to construct the counterfactual hypothesis of whether to establish NKEFZs, and after re-regression, as shown in column (1) of Table 6, the estimated coefficient of EA is negative but not significant, indicating that the above findings are caused by the exogenous shock of NKEFZs, which proves the robustness of the study findings. Second, the PSM-DID method is used to estimate the model. Although the NKEFZs in China are promoted under the national comprehensive planning, the delineation of NKEFZs is inevitably disturbed by factors such as geographical location and planners’ preferences. Therefore, this paper adopts the propensity score matching method to reclassify the experimental and control groups based on the propensity score values, and then uses a DID model for estimation, and the results are shown in column (2) of Table 6. It can be seen that the coefficients for the NKEFZs are still significantly negative, proving the robustness of the study’s conclusions. Third, change the scope of the sample. After excluding seven municipal districts, the regression results are presented in column (3) of Table 6, which shows that the estimated coefficients for the NKEFZs are still significantly negative, again proving the robustness of the study findings.
Table 6.
Estimation results of robustness tests.
4. Discussion
The NKEFZs have great significance to the ecological security of the whole country or on a larger scale, and it is of great practical significance to study the impact of NKEFZs on the green development of mountainous areas. Taking Hebei Province as an example, this paper analyzes the impact of NKEFZs on green development in mountainous areas and their dynamic effects, using the DID model with county-level statistics of the Yanshan–Taihang Mountainous area, and analyzes the heterogeneity of four development patterns based on the improved Lotka–Volterra model.
Existing research has mostly studied the heterogeneity of the implementation effects of NKEFZs based on the criteria of geographical zoning [52]. Differences in resource endowments and economic development patterns in different regions can lead to differences in the effectiveness of policy implementation. Compared with the existing research, this study used the improved L–V model to measure the symbiotic relationship between economy and ecology and determine the development pattern of the study area. We then used the DID model to quantitatively analyze the impact of NKEFZs on green development. Most of the existing research on the NKEFZs policy focuses on the effects of environmental protection, and there is a lack of attention on the impact of the policy on economic development [53,54]. This paper assesses the dual impacts of the policy from the perspectives of environmental protection and economic development. Overall, the findings of this study are the same as Jiang et al., Sun et al., and Li et al. [55,56,57].
The findings of this study have some reference significance for achieving green development in mountainous areas and for ecological planning, but there are some limitations, as well. On the one hand, due to the difficulty of obtaining county statistics, the selection of indicators is incomplete and some data are missing. On the other hand, different countries have different forms of governance, thus the conclusions drawn may not apply to other countries and regions. Of course, further exploration will be needed in the future. The next phase of this study will focus on analyzing areas with different ecosystem functions and development patterns to provide targeted development strategies.
5. Conclusions
The NKEFZs are related to the ecological security of the whole country or on a larger scale, and it is of great practical significance to study the impact of their establishment on the green development of mountainous areas. This study analyzes the impact of NKEFZs on green development in mountainous areas in Hebei province and their dynamic effects using a double difference model with county-level statistics of the Yanshan–Taihang Mountainous area in Hebei province. Furthermore, this study analyzes the heterogeneity of four development patterns measured based on the improved L–V model, and the conclusions are as follows.
First, the NKEFZs do not promote green development in mountainous areas. The results of both the improved L–V model and the double difference model indicate that the green development level of counties with NKEFZs is instead lower, with counties with NKEFZs having a 0.0309 units lower green development level compared to counties without NKEFZs, at a 1% significance level.
Second, the negative impact of NKEFZs on the level of green development tends to increase as the number of years of policy implementation increases, with the level of green development two years after policy implementation decreasing by about 19% compared to the year of policy implementation.
Third, the NKEFZs in both low-high and high-low development patterns have a significant negative impact on the level of green development, while the NKEFZs in regions with low-low development patterns have no significant impact on the level of green development.
The above findings indicate that the NKEFZs in China have not formed a coordinated development relationship between ecological protection and economic development. This causes the development of NKEFZs to face two dilemmas, which adversely affect sustainable economic and social development and make it difficult to truly achieve green and sustainable development. Based on the above findings, this paper proposes the following policy recommendations:
First, improve the transfer payment system for NKEFZs and bring into play a long-term mechanism for the compensation effect of transfer payments. The economic base of the NKEFZs is weak, where large-scale industrialization and development are restricted, so it is difficult to achieve economic development through conventional industrialization and easy to miss opportunities for economic development. Therefore, the mechanism of transfer payment fund distribution should be improved, and the national financial funds should be weighted to key functional zones to stimulate the enthusiasm of county governments for ecological protection. At the same time, a monitoring system for transfer payment funds should be constructed to ensure that compensation funds can be earmarked for specific purposes and improve the efficiency of fund utilization. Improve the performance appraisal system of NKEFZs and guide the transfer of financial compensation funds to green development. Implement the permanent monitoring of ecosystem service values within the NKEFZs. Establish and implement a green promotion mechanism, and conduct ecological performance and economic performance assessments for NKEFZs.
Second, cultivate special industries to achieve the differentiated development of county economies. NKEFZs are rich in agricultural and ecological resources, suitable for the development of green agriculture, ecological industries, tourism, etc. Future industrial planning must highlight differentiated development based on local conditions, develop new economic growth sources, and achieve green economic development. Furthermore, the optimization and upgrading of traditional industries should be accelerated to develop characteristic industries for each county, give full play to their comparative advantages, and take the road of diversified development.
Third, accelerate the optimization and adjustment of industrial structure, and promote the coordinated development of primary, secondary, and tertiary industries. For primary industry, promote the development of agriculture in the direction of ecology, intensification, and industrialization, cultivate special brands, and improve the added value of agricultural products and agricultural output. For secondary industry, guide industry to take a green development path, while supporting the development of advanced manufacturing industries such as biomedicine and realize the transformation and upgrading of the county’s industry to energy-saving, emission-reducing, and efficient new industries. For tertiary industry, the development of modern service industries, such as culture and tourism, and health and elderly care, is supported by information network technology to enhance the economic benefits of tertiary industry.
Fourth, explore the path to realize the value of ecological products and services in NKEFZs. Ecological products and services are ecological resources that bring economic and social benefits. Carrying out ecological product value assessment, promoting the marketization of ecological products, and realizing the precise matching of supply and demand for ecological products can help enhance the enthusiasm for ecological protection in NKEFZs, thus promoting green and sustainable development. Promote the industrial operation of ecological products and explore the green development model with local characteristics, obtaining more economic development results through the market-oriented operation of ecological products.
Fifth, improve the employment skills of the poor and upgrade the quality of the labor force. Enrich the forms of labor force employment according to the ecological projects in NKEFZs. Strengthen labor and production and management skills training for the poor in NKEFZs. Mobilize ecological enterprises and professional cooperatives to drive their product development. At the same time, organize ecological migration for the labor force in resource-poor areas to provide employment opportunities for the remaining labor force.
Author Contributions
M.L.: conceptualization, writing—original draft, software. G.Z.: supervision, visualization, methodology. D.Y.: investigation, validation. All authors have read and agreed to the published version of the manuscript.
Funding
This work was financially supported by the Key Program of the Bureau of Science and Technology of Hebei Province (No. 20557626D), the Key Program of the Department of Education of Hebei Province (No. SD201060), and the National Social Science Foundation of China (No. 18BJY081).
Institutional Review Board Statement
Not applicable.
Informed Consent Statement
Not applicable.
Data Availability Statement
Not applicable.
Conflicts of Interest
The authors declare no conflict of interest.
References
- Zhang, Y.; Wang, W. How does China’s carbon emissions trading (CET) policy affect the investment of CET-covered enterprises? Energy Econ. 2021, 98, 105224. [Google Scholar] [CrossRef]
- Gao, J.; Zou, C.; Zhang, K.; Xu, M.; Wang, Y. The establishment of Chinese ecological conservation redline and insights into improving international protected areas. J. Environ. Manag. 2020, 264, 110505. [Google Scholar] [CrossRef] [PubMed]
- D’Amato, D.; Korhonen, J. Integrating the green economy, circular economy and bioeconomy in a strategic sustainability framework. Ecol. Econ. 2021, 188, 107143. [Google Scholar] [CrossRef]
- Liu, J.; Qu, J.; Zhao, K. Is China’s development conforms to the Environmental Kuznets Curve hypothesis and the pollution haven hypothesis? J. Clean. Prod. 2019, 234, 787–796. [Google Scholar] [CrossRef]
- BenDor, T.K.; Spurlock, D.; Woodruff, S.C.; Olander, L. A research agenda for ecosystem services in American environmental and land use planning. Cities 2017, 60, 260–271. [Google Scholar] [CrossRef]
- Mamat, K.; Du, P.; Ding, J. Ecological function regionalization of cultural heritage sites in Turpan, China, based on GIS. Arab. J. Geosci. 2017, 10, 90. [Google Scholar] [CrossRef]
- Du, W.; Yan, H.; Feng, Z.; Yang, Y.; Liu, F. The supply-consumption relationship of ecological resources under ecological civilization construction in China. Resour. Conserv. Recycl. 2021, 172, 105679. [Google Scholar] [CrossRef]
- Fan, J.; Sun, W.; Zhou, K.; Chen, D. Major function oriented zone: New method of spatial regulation for reshaping regional development pattern in China. Chin. Geogr. Sci. 2012, 22, 196–209. [Google Scholar] [CrossRef]
- Chen, M.; Liang, L.; Wang, Z.; Zhang, W.; Yu, J.; Liang, Y. Geographical thoughts on the relationship between ‘Beautiful China’and land spatial planning. J. Geogr. Sci. 2020, 30, 705–723. [Google Scholar] [CrossRef]
- Zhao, X.; Chen, H.; Zhao, H.; Xue, B. Farmer households’ livelihood resilience in ecological-function areas: Case of the Yellow River water source area of China. Environ. Dev. Sustain. 2021, 24, 9665–9686. [Google Scholar] [CrossRef]
- Zhao, Y.; Chi, W.; Kuang, W.; Bao, Y.; Ding, G. Ecological and environmental consequences of ecological projects in the Beijing–Tianjin sand source region. Ecol. Indic. 2020, 112, 106111. [Google Scholar] [CrossRef]
- Zhang, P. Target interactions and target aspiration level adaptation: How do government leaders tackle the “environment-economy” nexus? Public Adm. Rev. 2021, 81, 220–230. [Google Scholar] [CrossRef]
- Cole, K.A. A Market-Based Approach to the Protection of Instream Flow: Allowing a Charitable Contribution Deduction for the Donation of a Conservation Easement in Water Rights. Hastings W.-Nw. J. Envt’l L. Pol’y 2008, 14, 1153. [Google Scholar]
- Chen, Y.; Wang, J. Ecological security early-warning in central Yunnan Province, China, based on the gray model. Ecol. Indic. 2020, 111, 106000. [Google Scholar] [CrossRef]
- Zhai, J.; Liu, Y.; Hou, P.; Xiao, T.; Cao, G. Water conservation service assessment and its spatiotemporal features in national key ecological function zones. Adv. Meteorol. 2016, 2016, 5194091. [Google Scholar] [CrossRef]
- Xu, J.; Xiao, Y.; Xie, G.; Wang, Y.; Lei, G. Assessment of the benefit diffusion of windbreak and sand fixation service in National Key Ecological Function areas in China. Aeolian Res. 2021, 52, 100728. [Google Scholar] [CrossRef]
- Webb, N.P.; Kachergis, E.; Miller, S.W.; McCord, S.E.; Bestelmeyer, B.T.; Brown, J.R.; Chappell, A.; Edwards, B.L.; Herrick, J.E.; Karl, J.W. Indicators and benchmarks for wind erosion monitoring, assessment and management. Ecol. Indic. 2020, 110, 105881. [Google Scholar] [CrossRef]
- Caixia, Z.; Leiming, Z.; Shimei, L.; Changshun, Z. Soil conservation of national key ecological function areas. J. Resour. Ecol. 2015, 6, 397–404. [Google Scholar] [CrossRef]
- Zhang, Y.; Yang, Y.; Chen, Z.; Zhang, S. Multi-criteria assessment of the resilience of ecological function areas in China with a focus on ecological restoration. Ecol. Indic. 2020, 119, 106862. [Google Scholar] [CrossRef]
- Grieg-Gran, M. Fiscal incentives for biodiversity conservation: The ICMS Ecológico in Brazil. Int. Inst. Environ. Dev. Environ. Econ. Programme 2000. [Google Scholar] [CrossRef]
- Gong, C.; Zhang, J.; Liu, H. Do industrial pollution activities in China respond to ecological fiscal transfers? Evidence from payments to national key ecological function zones. J. Environ. Plan. Manag. 2021, 64, 1184–1203. [Google Scholar] [CrossRef]
- Liu, X.; Wang, Y. Analysis of current research on key ecological function zones in China. World For. Res. 2014, 27, 93–96. [Google Scholar]
- Ouyang, Z.; Zheng, H.; Xiao, Y.; Polasky, S.; Liu, J.; Xu, W.; Wang, Q.; Zhang, L.; Xiao, Y.; Rao, E. Improvements in ecosystem services from investments in natural capital. Science 2016, 352, 1455–1459. [Google Scholar] [CrossRef]
- Hooli, L.J. Resilience of the poorest: Coping strategies and indigenous knowledge of living with the floods in Northern Namibia. Reg. Environ. Change 2015, 16, 695–707. [Google Scholar] [CrossRef]
- Carr, E.R.; Kettle, N.P.; Hoskins, A. Evaluating poverty–environment dynamics. Int. J. Sustain. Dev. World Ecol. 2009, 16, 87–93. [Google Scholar] [CrossRef]
- Guo, L.; Qu, Y.; Tseng, M. The interaction effects of environmental regulation and technological innovation on regional green growth performance. J. Clean. Prod. 2017, 162, 894–902. [Google Scholar] [CrossRef]
- Jian, L.; Sohail, M.T.; Ullah, S.; Majeed, M.T. Examining the role of non-economic factors in energy consumption and CO2 emissions in China: Policy options for the green economy. Environ. Sci. Pollut. Res. 2021, 28, 67667–67676. [Google Scholar] [CrossRef]
- Pradhan, B.K.; Ghosh, J. A computable general equilibrium (CGE) assessment of technological progress and carbon pricing in India’s green energy transition via furthering its renewable capacity. Energy Econ. 2022, 106, 105788. [Google Scholar] [CrossRef]
- D’Amato, A.; Mazzanti, M.; Nicolli, F. Green technologies and environmental policies for sustainable development: Testing direct and indirect impacts. J. Clean. Prod. 2021, 309, 127060. [Google Scholar] [CrossRef]
- Khan, S.A.R.; Qianli, D. Does national scale economic and environmental indicators spur logistics performance? Evidence from UK. Environ. Sci. Pollut. Res. 2017, 24, 26692–26705. [Google Scholar] [CrossRef]
- Bhatia, M.S.; Gangwani, K.K. Green supply chain management: Scientometric review and analysis of empirical research. J. Clean. Prod. 2021, 284, 124722. [Google Scholar] [CrossRef]
- Zhang, D.; Zheng, M.; Feng, G.; Chang, C. Does an environmental policy bring to green innovation in renewable energy? Renew. Energy 2022, 195, 1113–1124. [Google Scholar] [CrossRef]
- Yumei, H.; Iqbal, W.; Irfan, M.; Fatima, A. The dynamics of public spending on sustainable green economy: Role of technological innovation and industrial structure effects. Environ. Sci. Pollut. Res. 2022, 29, 22970–22988. [Google Scholar] [CrossRef] [PubMed]
- Khan, S.A.R.; Quddoos, M.U.; Akhtar, M.H.; Rafique, A.; Hayat, M.; Gulzar, S.; Yu, Z. Re-investigating the nexuses of renewable energy, natural resources and transport services: A roadmap towards sustainable development. Environ. Sci. Pollut. Res. 2022, 29, 13564–13579. [Google Scholar] [CrossRef] [PubMed]
- Khan, S.A.R.; Yu, Z.; Umar, M.; Zia Ul Haq, H.M.; Tanveer, M.; Janjua, L.R. Renewable energy and advanced logistical infrastructure: Carbon-free economic development. Sustain. Dev. 2021, 30, 693–702. [Google Scholar] [CrossRef]
- Feng, Z.; Chen, W. Environmental regulation, green innovation, and industrial green development: An empirical analysis based on the Spatial Durbin model. Sustainability 2018, 10, 223. [Google Scholar] [CrossRef]
- Song, Y.; Yang, L.; Sindakis, S.; Aggarwal, S.; Chen, C. Analyzing the Role of High-Tech Industrial Agglomeration in Green Transformation and Upgrading of Manufacturing Industry: The Case of China. J. Knowl. Econ. 2022, 20, 1–31. [Google Scholar] [CrossRef]
- Cui, L.; Weng, S.; Nadeem, A.M.; Rafique, M.Z.; Shahzad, U. Exploring the role of renewable energy, urbanization and structural change for environmental sustainability: Comparative analysis for practical implications. Renew. Energy 2022, 184, 215–224. [Google Scholar] [CrossRef]
- Khan, S.A.R.; Ponce, P.; Yu, Z.; Golpîra, H.; Mathew, M. Environmental technology and wastewater treatment: Strategies to achieve environmental sustainability. Chemosphere 2022, 286, 131532. [Google Scholar] [CrossRef]
- Zou, H.; Zhang, Y. Does environmental regulatory system drive the green development of China’s pollution-intensive industries? J. Clean. Prod. 2022, 330, 129832. [Google Scholar] [CrossRef]
- Sun, H.; Chen, F. The impact of green finance on China’s regional energy consumption structure based on system GMM. Resour. Policy 2022, 76, 102588. [Google Scholar] [CrossRef]
- Chen, D.; Pan, Y.; Jin, X.; Du, H.; Li, M.; Jiang, P. The delineation of ecological redline area for catchment sustainable management from the perspective of ecosystem services and social needs: A case study of the Xiangjiang watershed, China. Ecol. Indic. 2021, 121, 107130. [Google Scholar] [CrossRef]
- Zhang, M.; Bao, Y.; Xu, J.; Han, A.; Liu, X.; Zhang, J.; Tong, Z. Ecological security evaluation and ecological regulation approach of East-Liao River basin based on ecological function area. Ecol. Indic. 2021, 132, 108255. [Google Scholar] [CrossRef]
- Lee, S.; Kim, M.; Park, Y. ICT Co-evolution and Korean ICT strategy—An analysis based on patent data. Telecommun. Policy 2009, 33, 253–271. [Google Scholar] [CrossRef]
- Du, Y.; Song, B.; Duan, H.; Tsvetanov, T.G.; Wu, Y. Multi-renewable management: Interactions between wind and solar within uncertain technology ecological system. Energy Convers. Manag. 2019, 187, 232–247. [Google Scholar] [CrossRef]
- Chakrabarti, A.S. Stochastic Lotka–Volterra equations: A model of lagged diffusion of technology in an interconnected world. Phys. A Stat. Mech. Its Appl. 2016, 442, 214–223. [Google Scholar] [CrossRef]
- Capello, R.; Faggian, A. An economic-ecological model of urban growth and urban externalities: Empirical evidence from Italy. Ecol. Econ. 2002, 40, 181–198. [Google Scholar] [CrossRef]
- Rodriguez-Gonzalez, P.T.; Rico-Martinez, R.; Rico-Ramirez, V. Effect of feedback loops on the sustainability and resilience of human-ecosystems. Ecol. Model. 2020, 426, 109018. [Google Scholar] [CrossRef]
- Van Donkelaar, A.; Martin, R.V.; Brauer, M.; Hsu, N.C.; Kahn, R.A.; Levy, R.C.; Lyapustin, A.; Sayer, A.M.; Winker, D.M. Global estimates of fine particulate matter using a combined geophysical-statistical method with information from satellites, models, and monitors. Environ. Sci. Technol. 2016, 50, 3762–3772. [Google Scholar] [CrossRef]
- Yanhua, G.; Lianjun, T.; Lin, M. The level of green development and obstacle factors in the limited development ecological zone of Jilin Province. Acta Ecol. Sin. 2020, 40, 2463–2472. [Google Scholar]
- Jia, R.; Shao, S.; Yang, L. High-speed rail and CO2 emissions in urban China: A spatial difference-in-differences approach. Energy Econ. 2021, 99, 105271. [Google Scholar] [CrossRef]
- Pan, D.; Tang, J. The effects of heterogeneous environmental regulations on water pollution control: Quasi-natural experimental evidence from China. Sci. Total Environ. 2021, 751, 141550. [Google Scholar] [CrossRef] [PubMed]
- Cao, H.; Qi, Y.; Chen, J.; Shao, S.; Lin, S. Incentive and coordination: Ecological fiscal transfers’ effects on eco-environmental quality. Environ. Impact Assess. Rev. 2020, 87, 106518. [Google Scholar] [CrossRef]
- Du, J.; Fang, S.; Sheng, Z.; Wu, J.; Quan, Z.; Fu, Q. Variations in vegetation dynamics and its cause in national key ecological function zones in China. Environ. Sci. Pollut. Res. 2020, 27, 30145–30161. [Google Scholar] [CrossRef]
- Jiang, W. Can Environmental Protection in Ecological Functional Zones Break Free from the Constraints of Focusing Just on Economic Benefits?—A Case Study of the Plateau Ecological Zone’s Tiamitcheen. Chin. J. Urban Environ. Stud. 2018, 6, 1850018. [Google Scholar] [CrossRef]
- Sun, M.; Yang, R.; Li, X.; Zhang, L.; Liu, Q. Designing a path for the sustainable development of key ecological function zones: A case study of southwest China. Glob. Ecol. Conserv. 2021, 31, e01840. [Google Scholar] [CrossRef]
- Li, G.; Li, L.; Li, X.; Chen, Y. Can the establishment of National Key Ecological Functional Zones improve air quality? An empirical study from China. PLoS ONE 2021, 16, e246257. [Google Scholar] [CrossRef]
Publisher’s Note: MDPI stays neutral with regard to jurisdictional claims in published maps and institutional affiliations. |
© 2022 by the authors. Licensee MDPI, Basel, Switzerland. This article is an open access article distributed under the terms and conditions of the Creative Commons Attribution (CC BY) license (https://creativecommons.org/licenses/by/4.0/).