
Remote Sensing for Surface Coal Mining and Reclamation Monitoring in the Central Salt Range, Punjab, Pakistan


 ,
,  ,
,  ,
,  ,
,
Abstract
:1. Introduction
2. Materials and Methods
2.1. Study Area
2.2. Data Collection and Methods
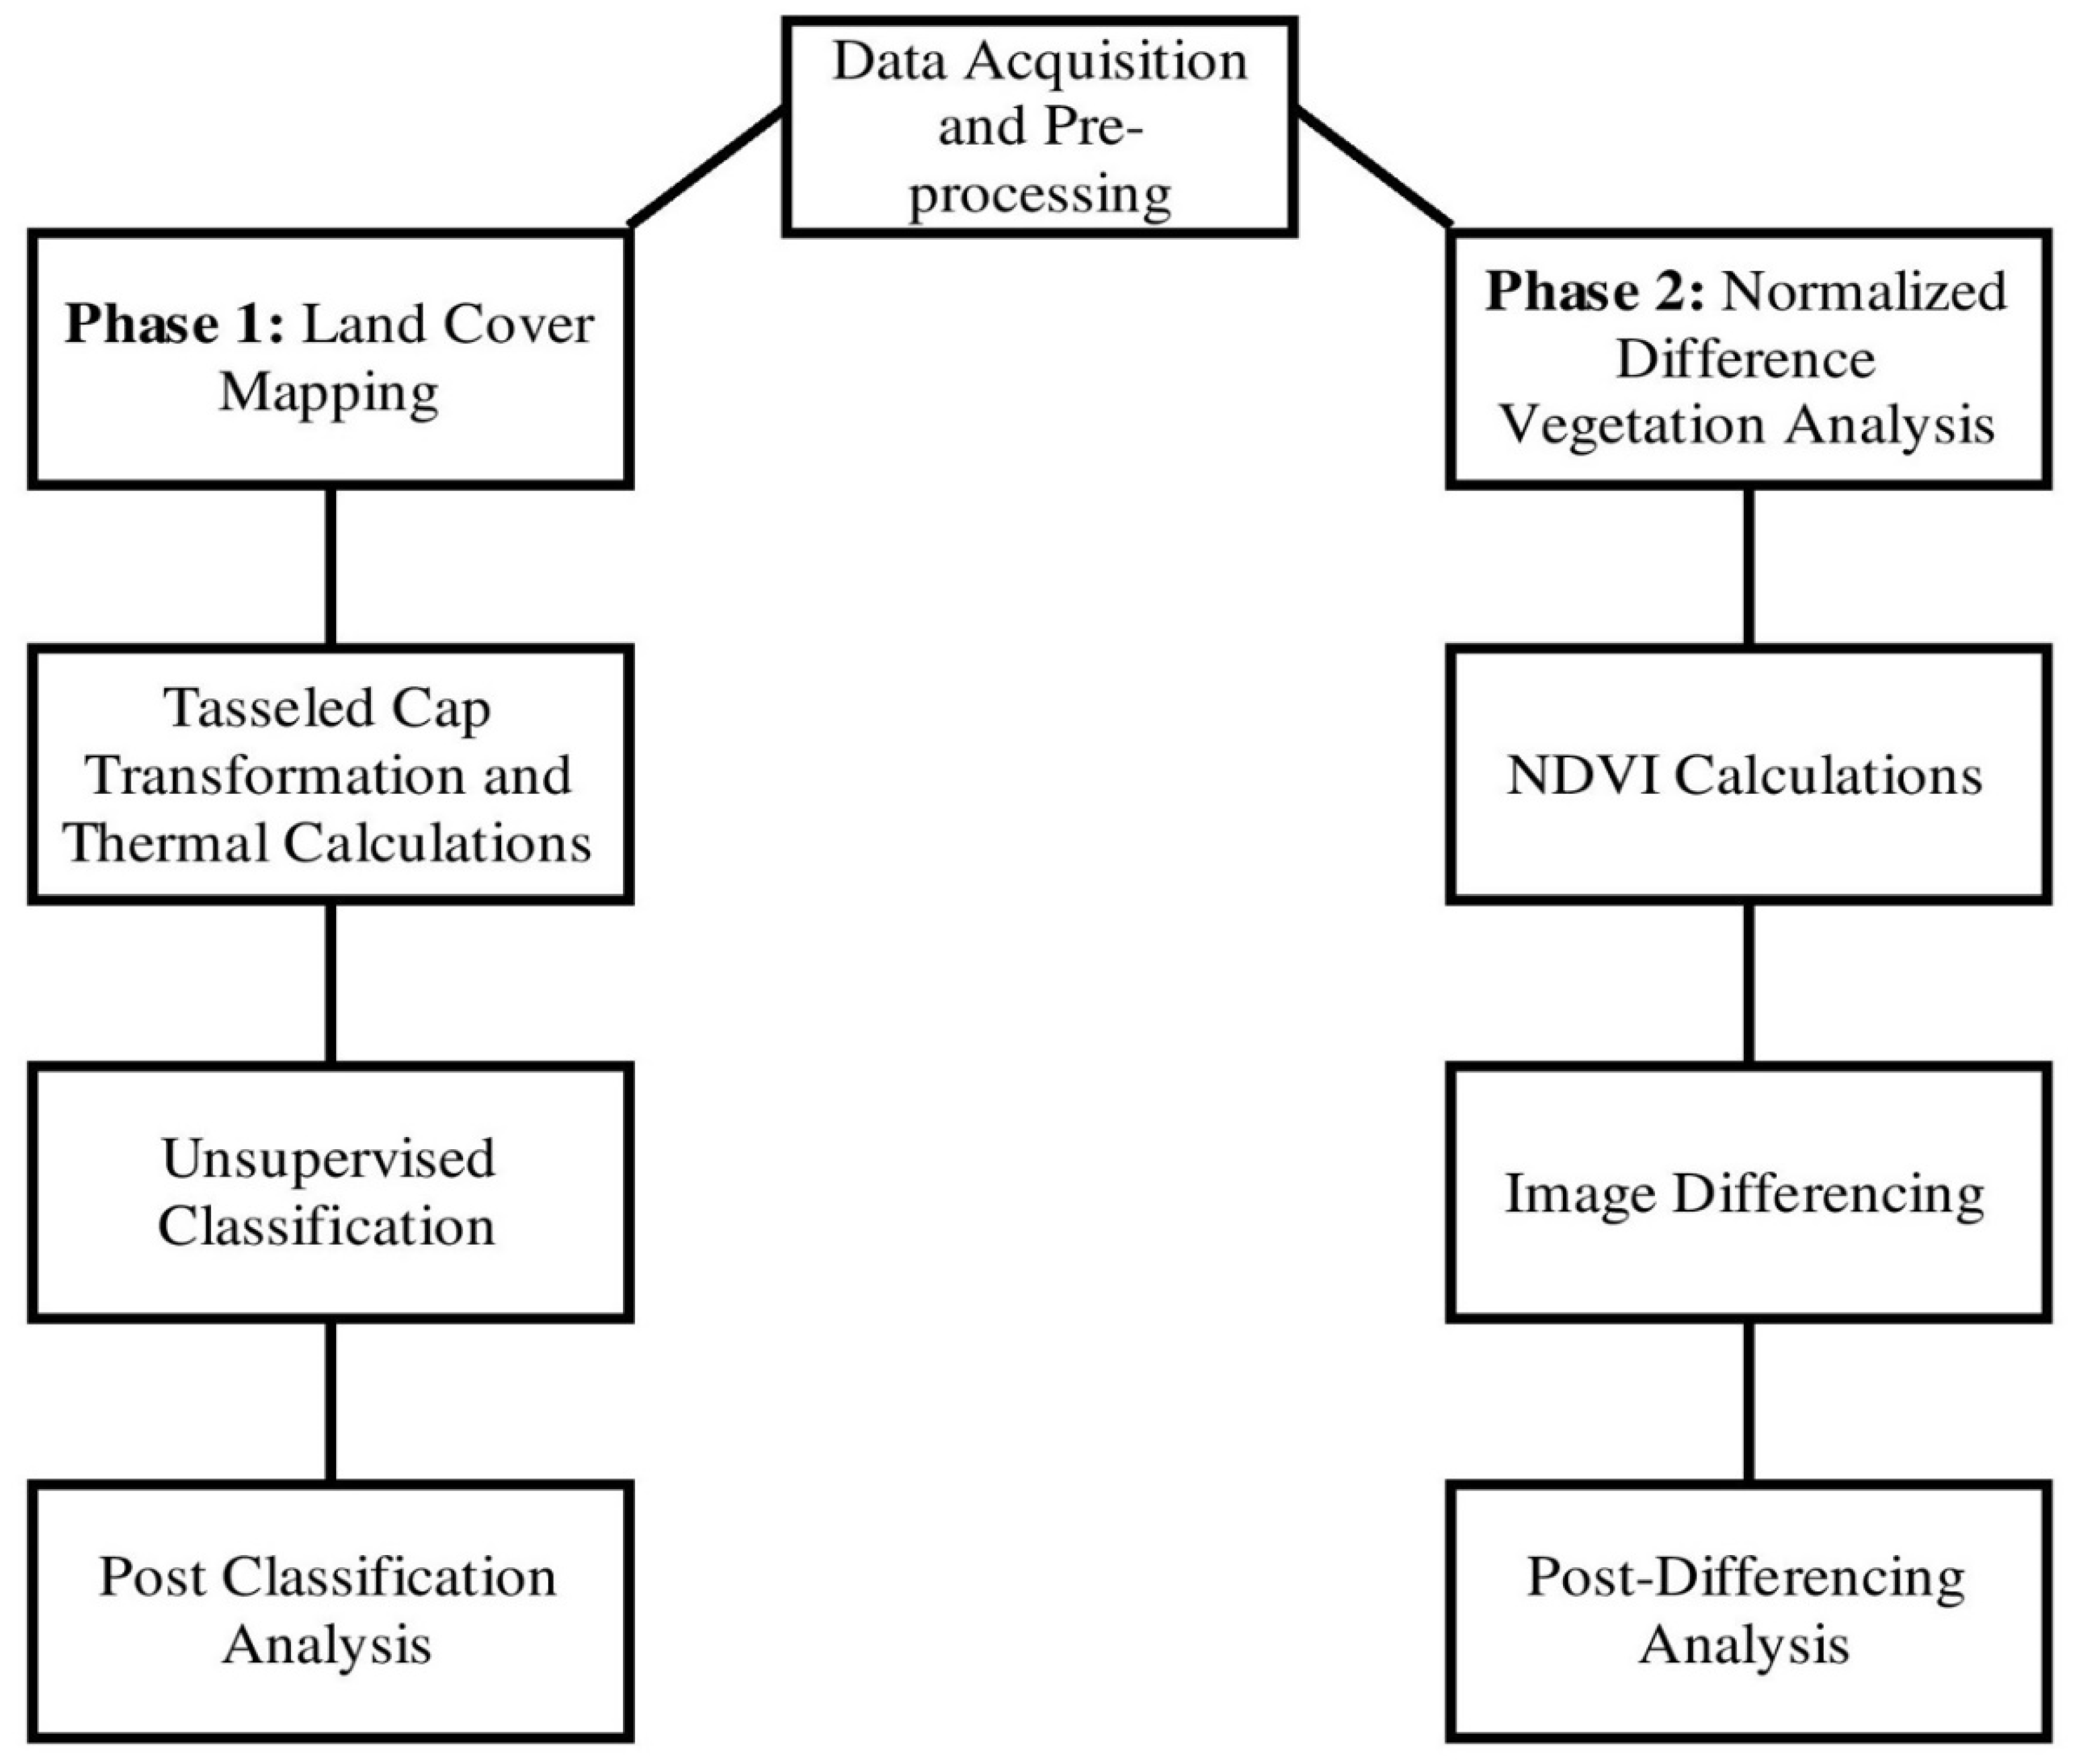
2.2.1. Data Acquisition and Preprocessing
Tasseled Cap Transformation (TC)
At-Satellite Brightness Temperature
Unsupervised Classification
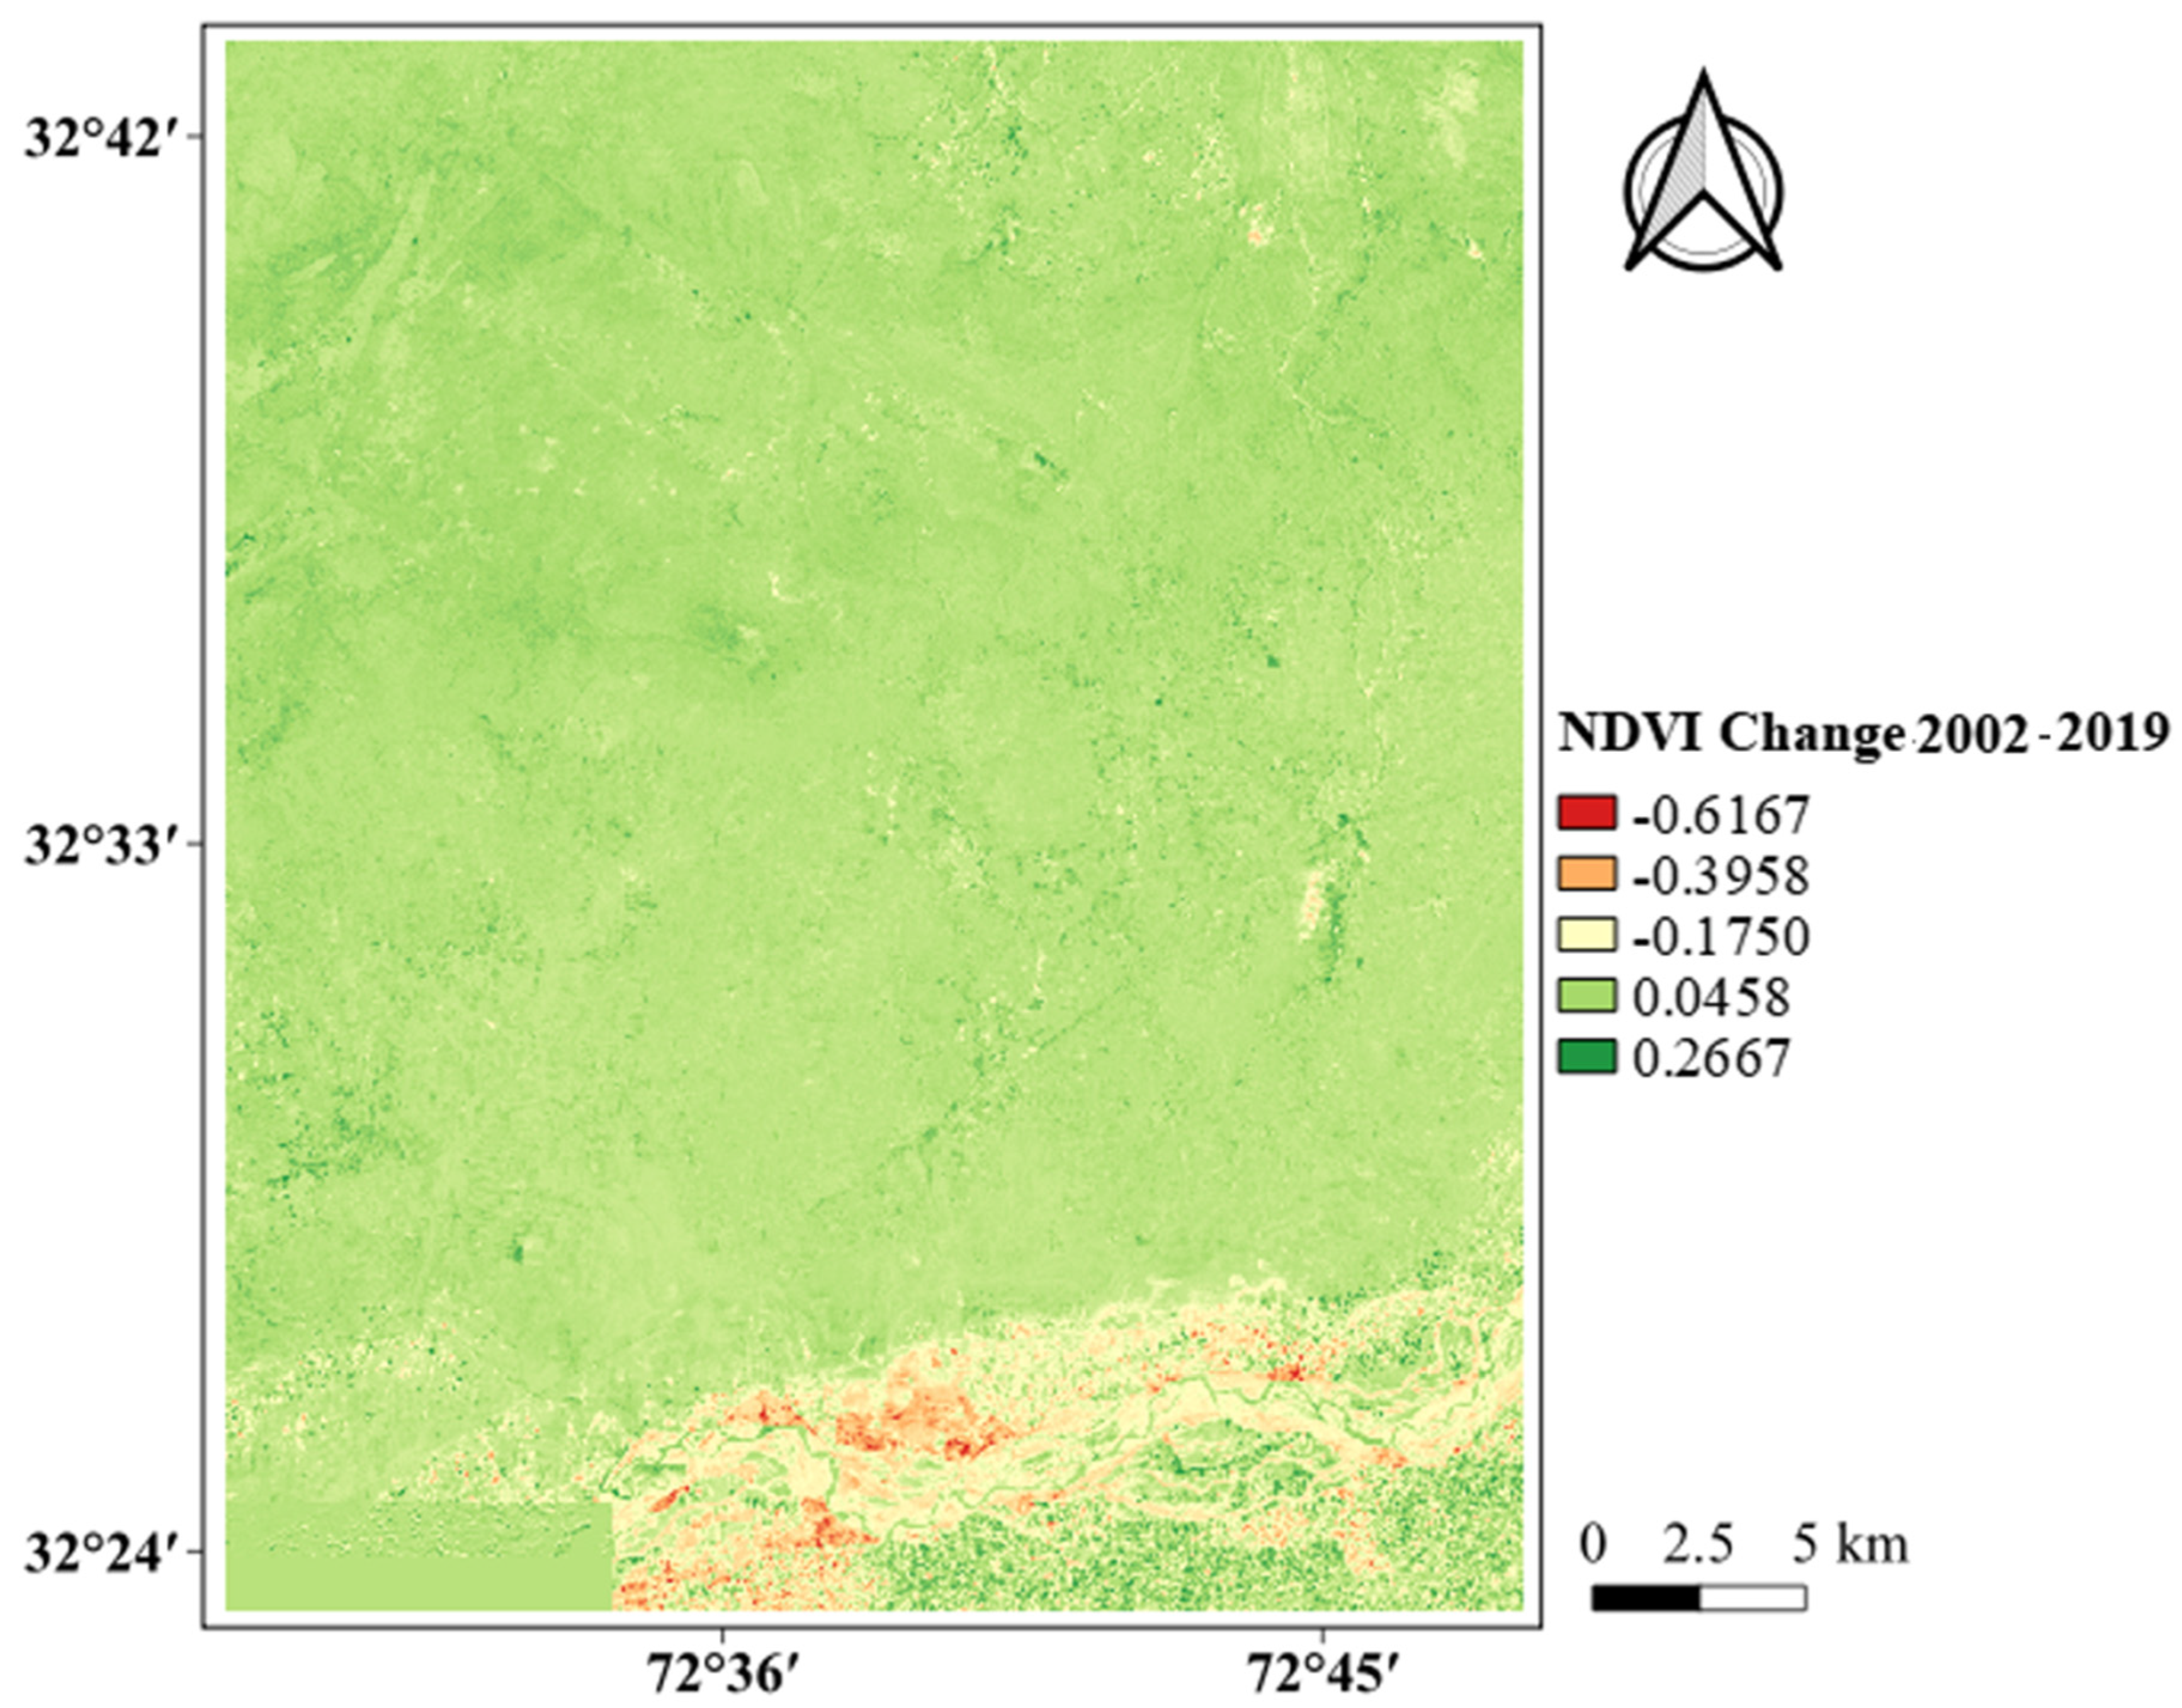
Normalized Difference Vegetation Index Change Analysis
Post-Classification and Processing Analysis
3. Results and Discussion
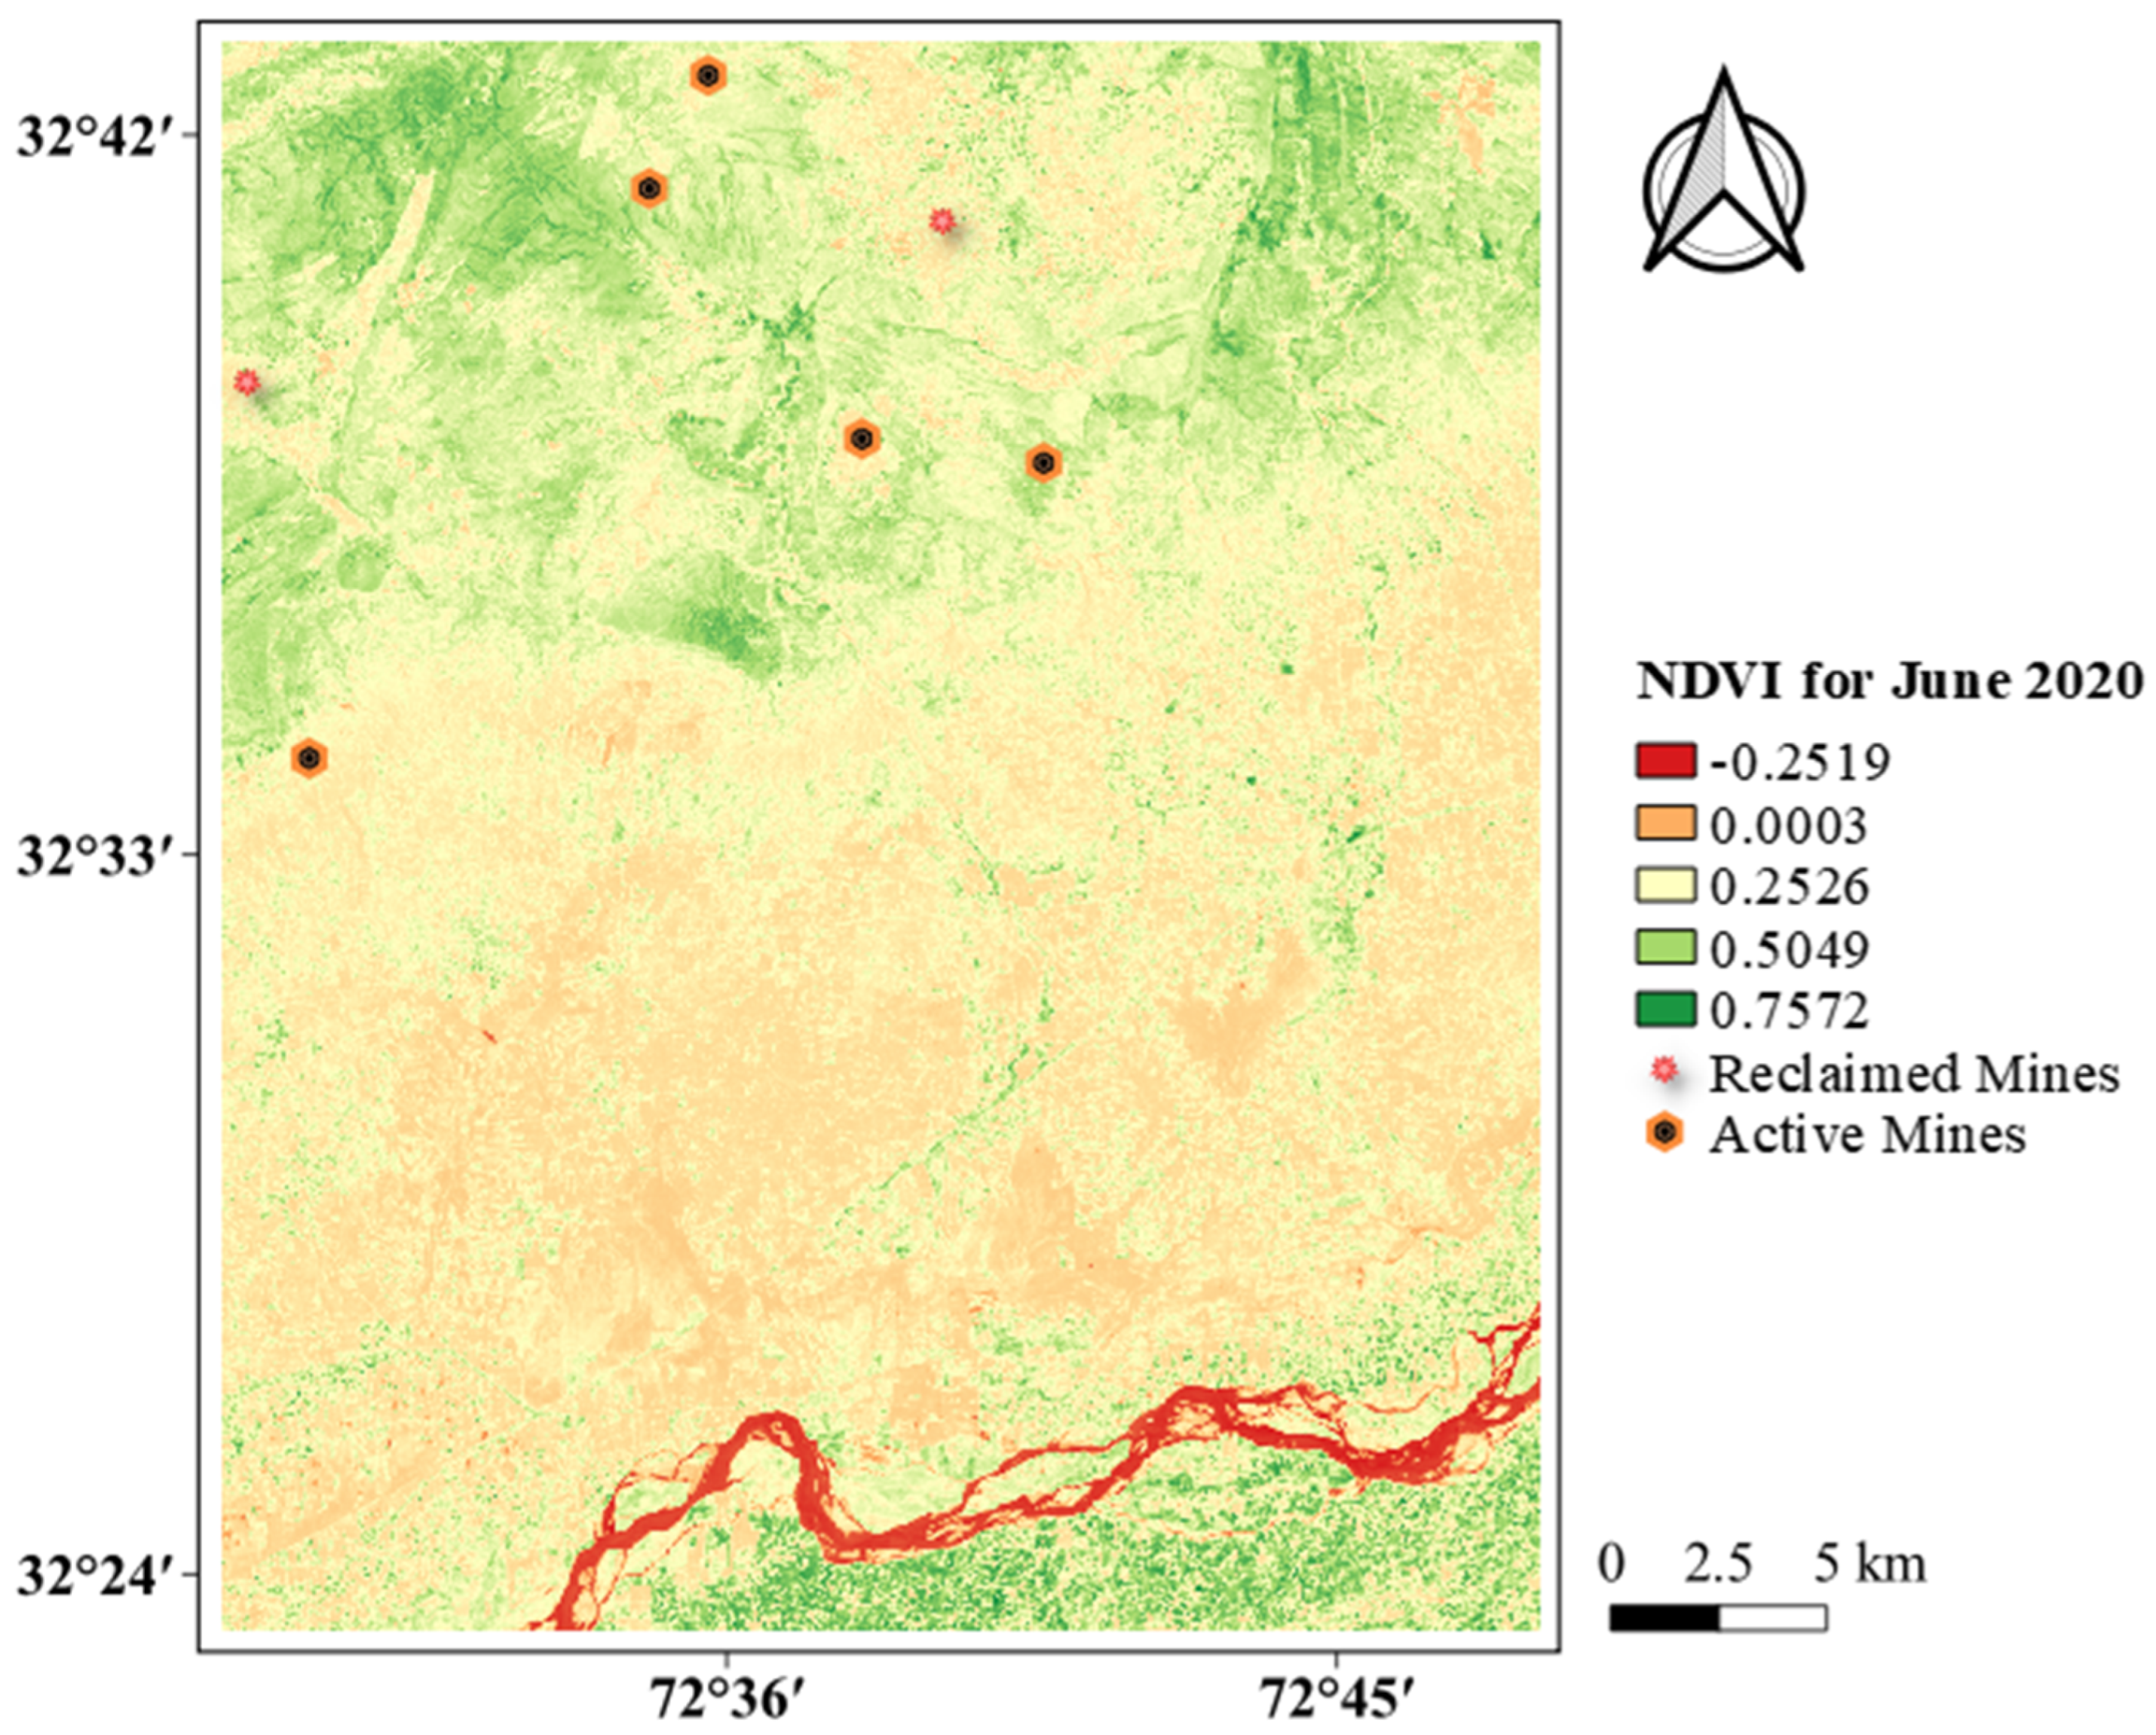
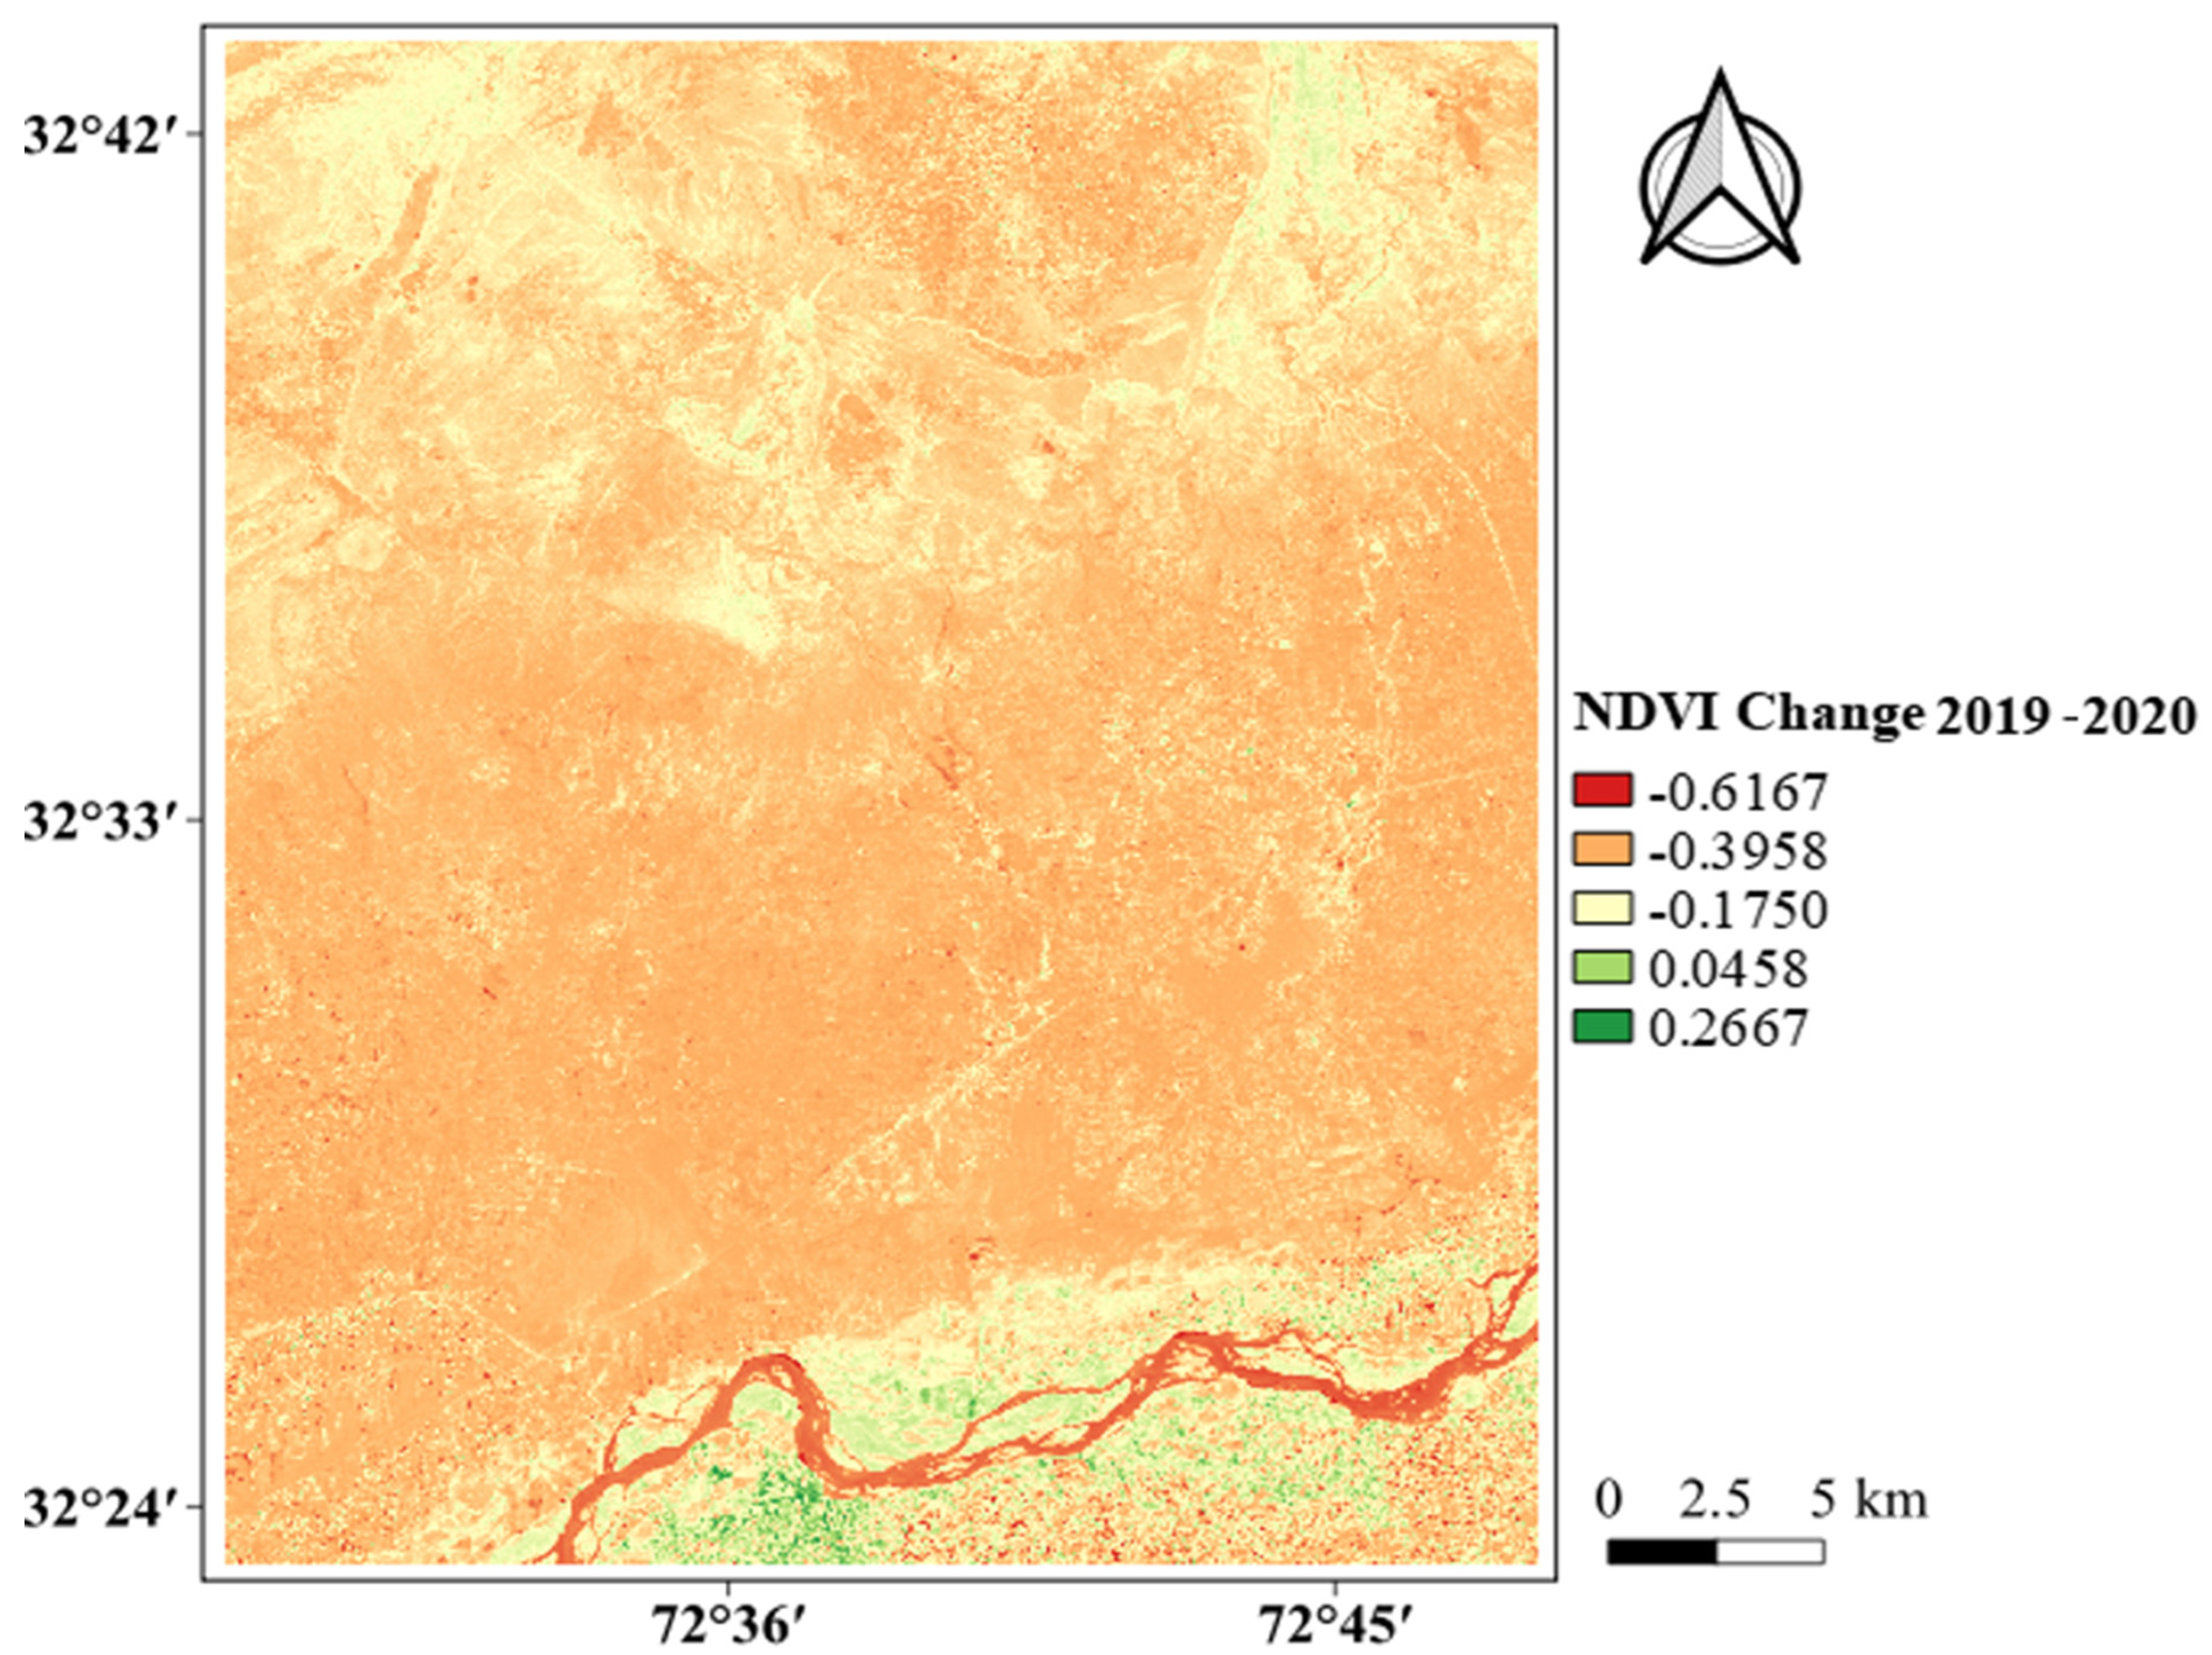
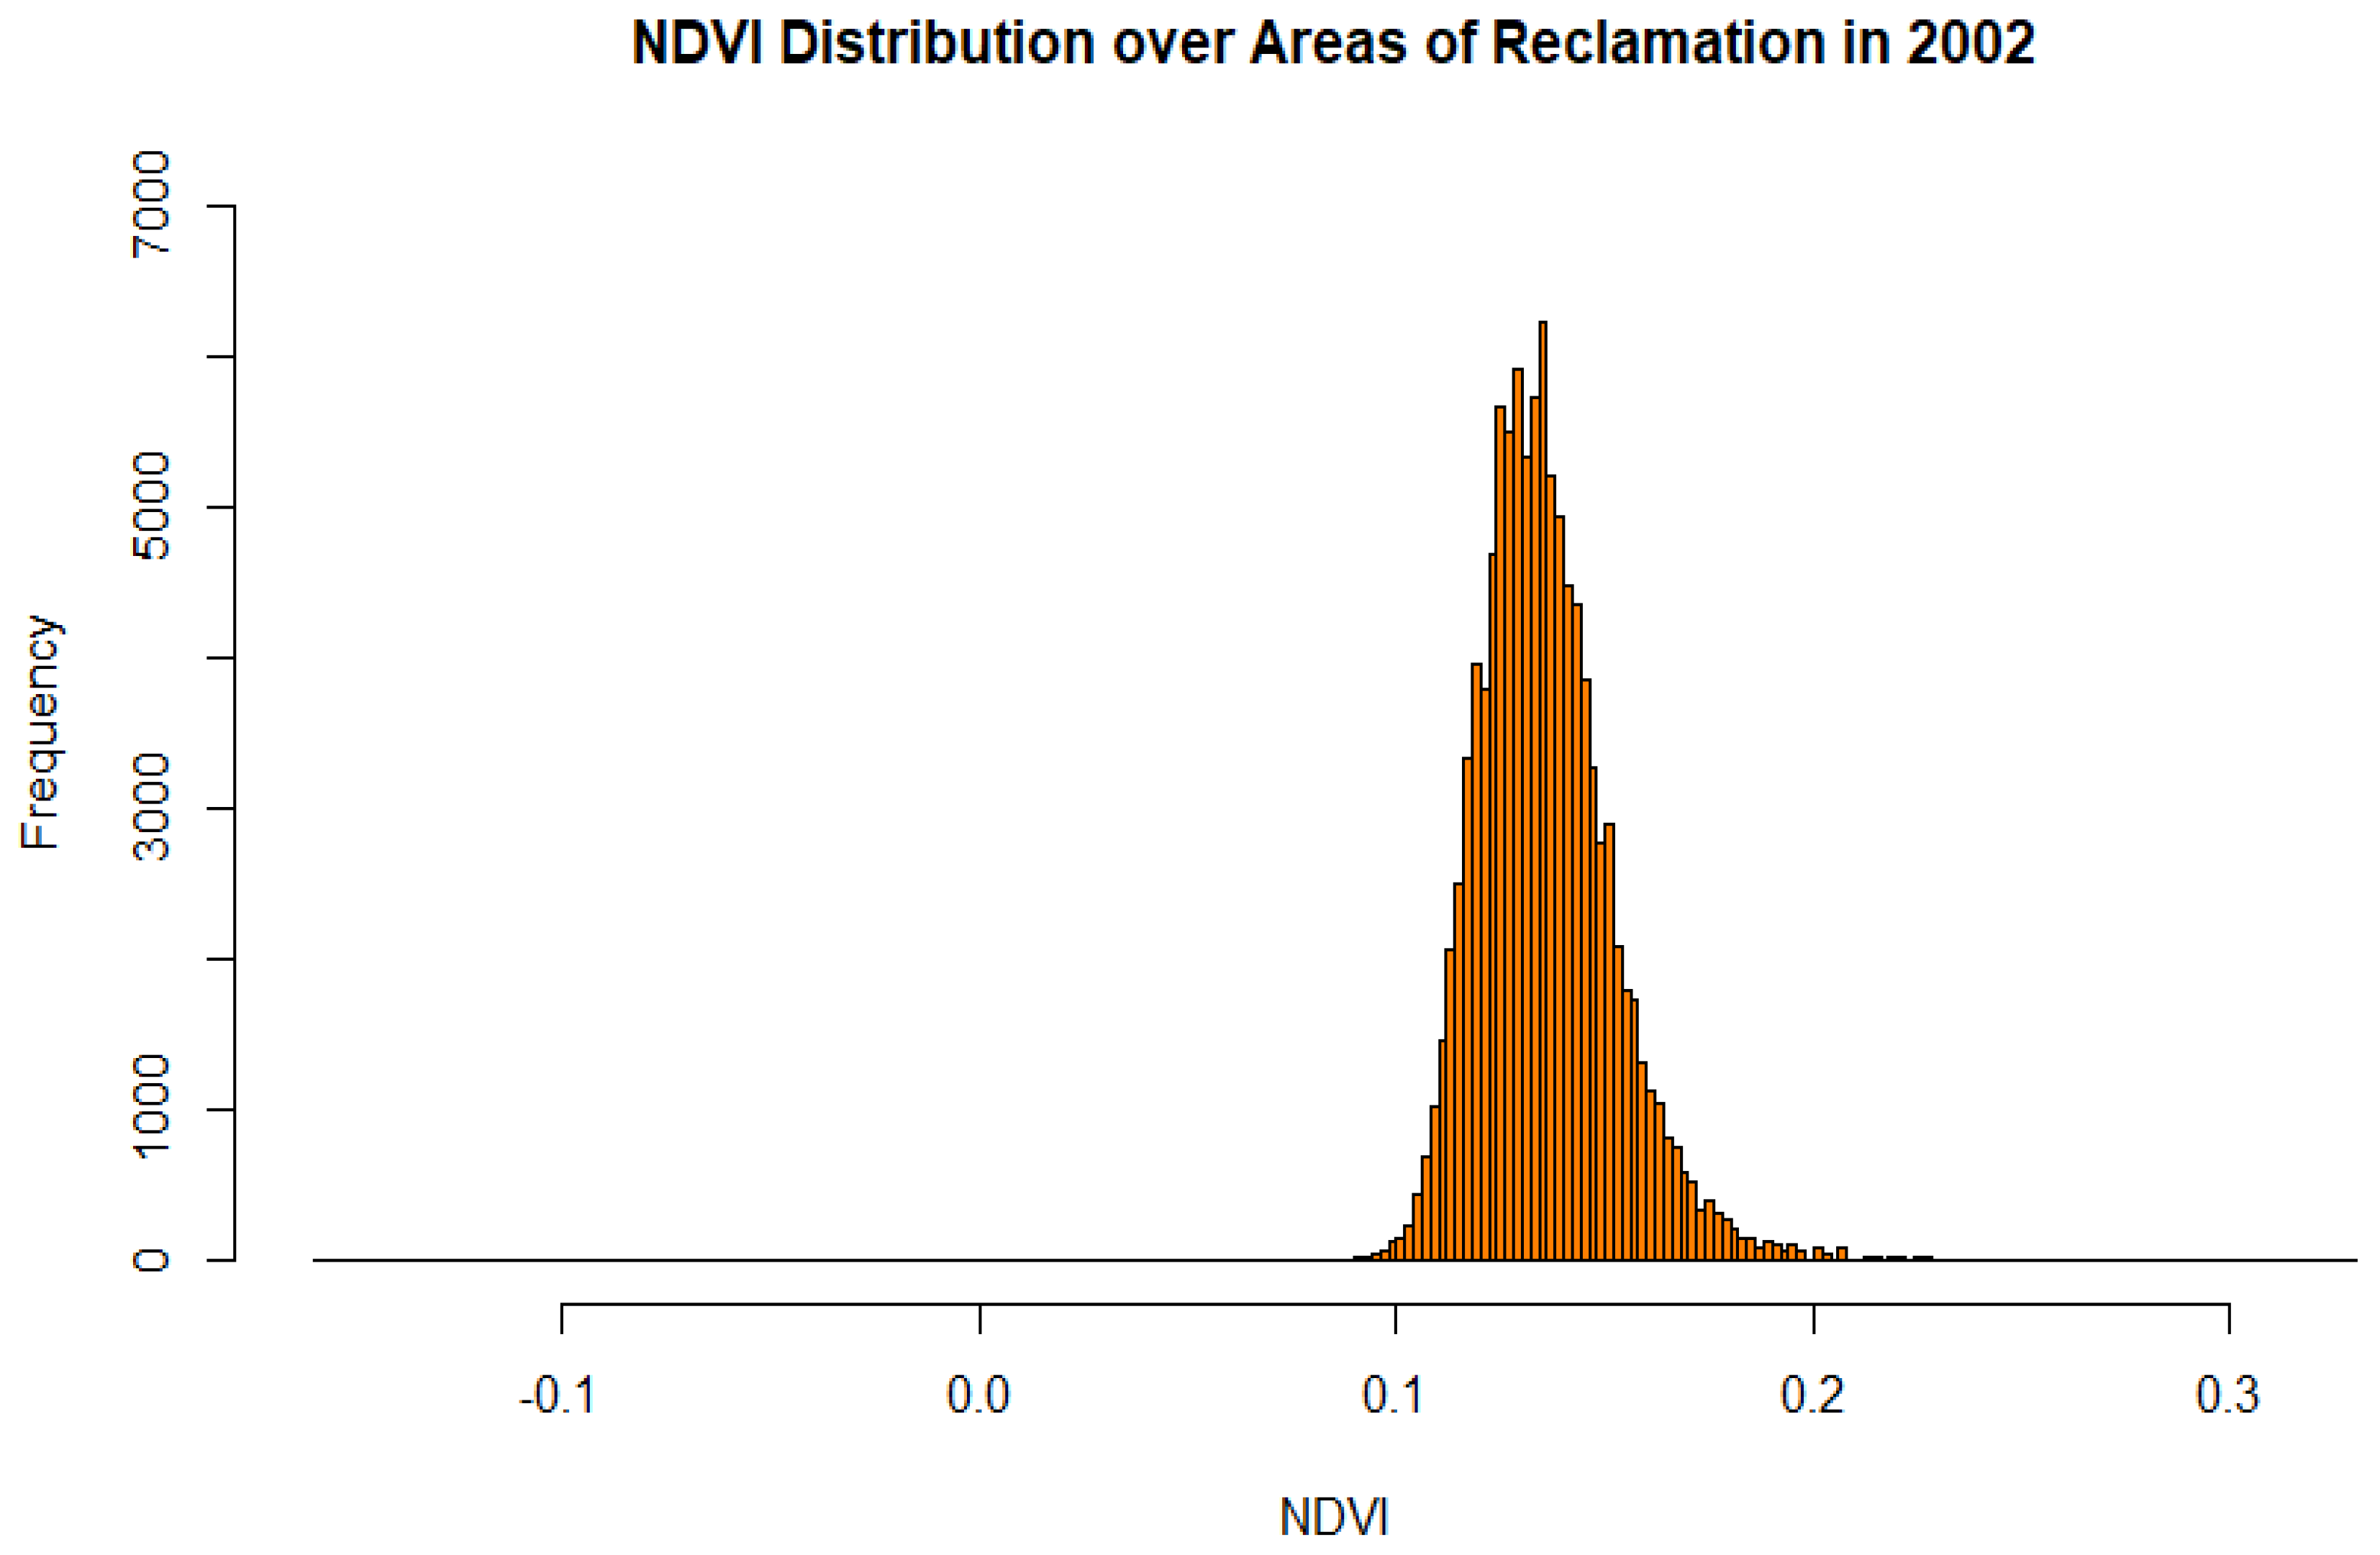
3.1. NDVI Analysis
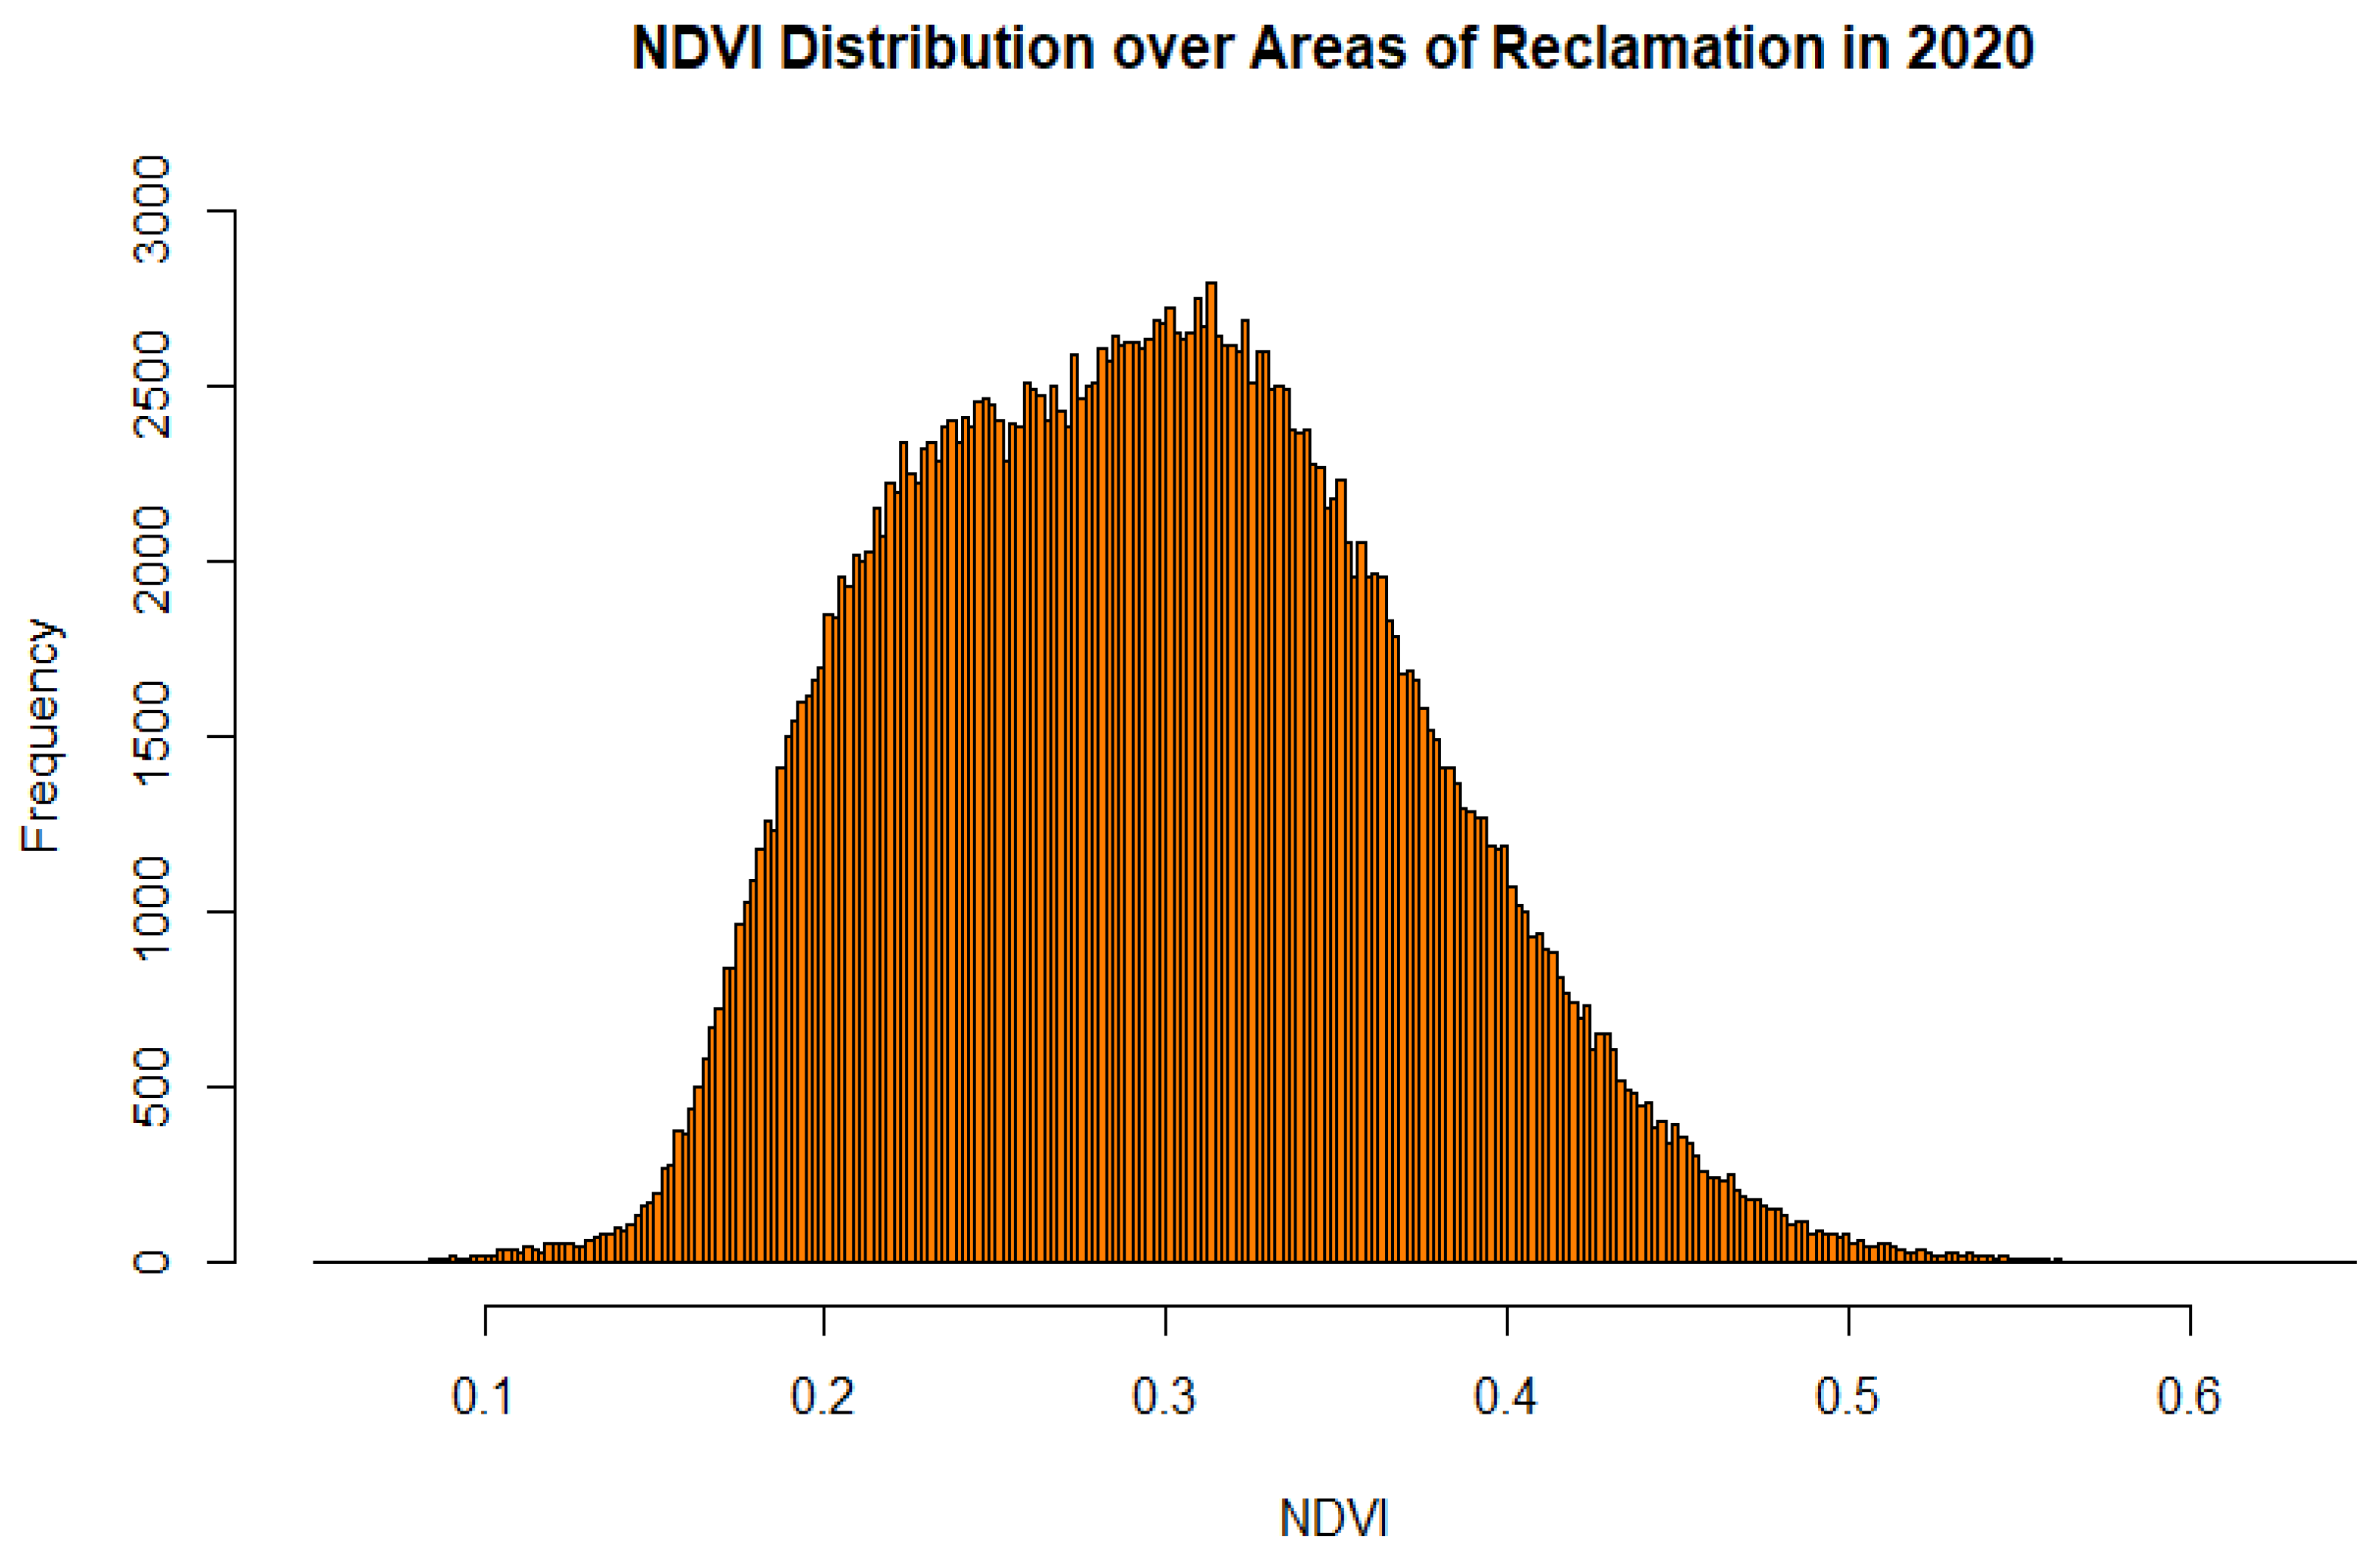
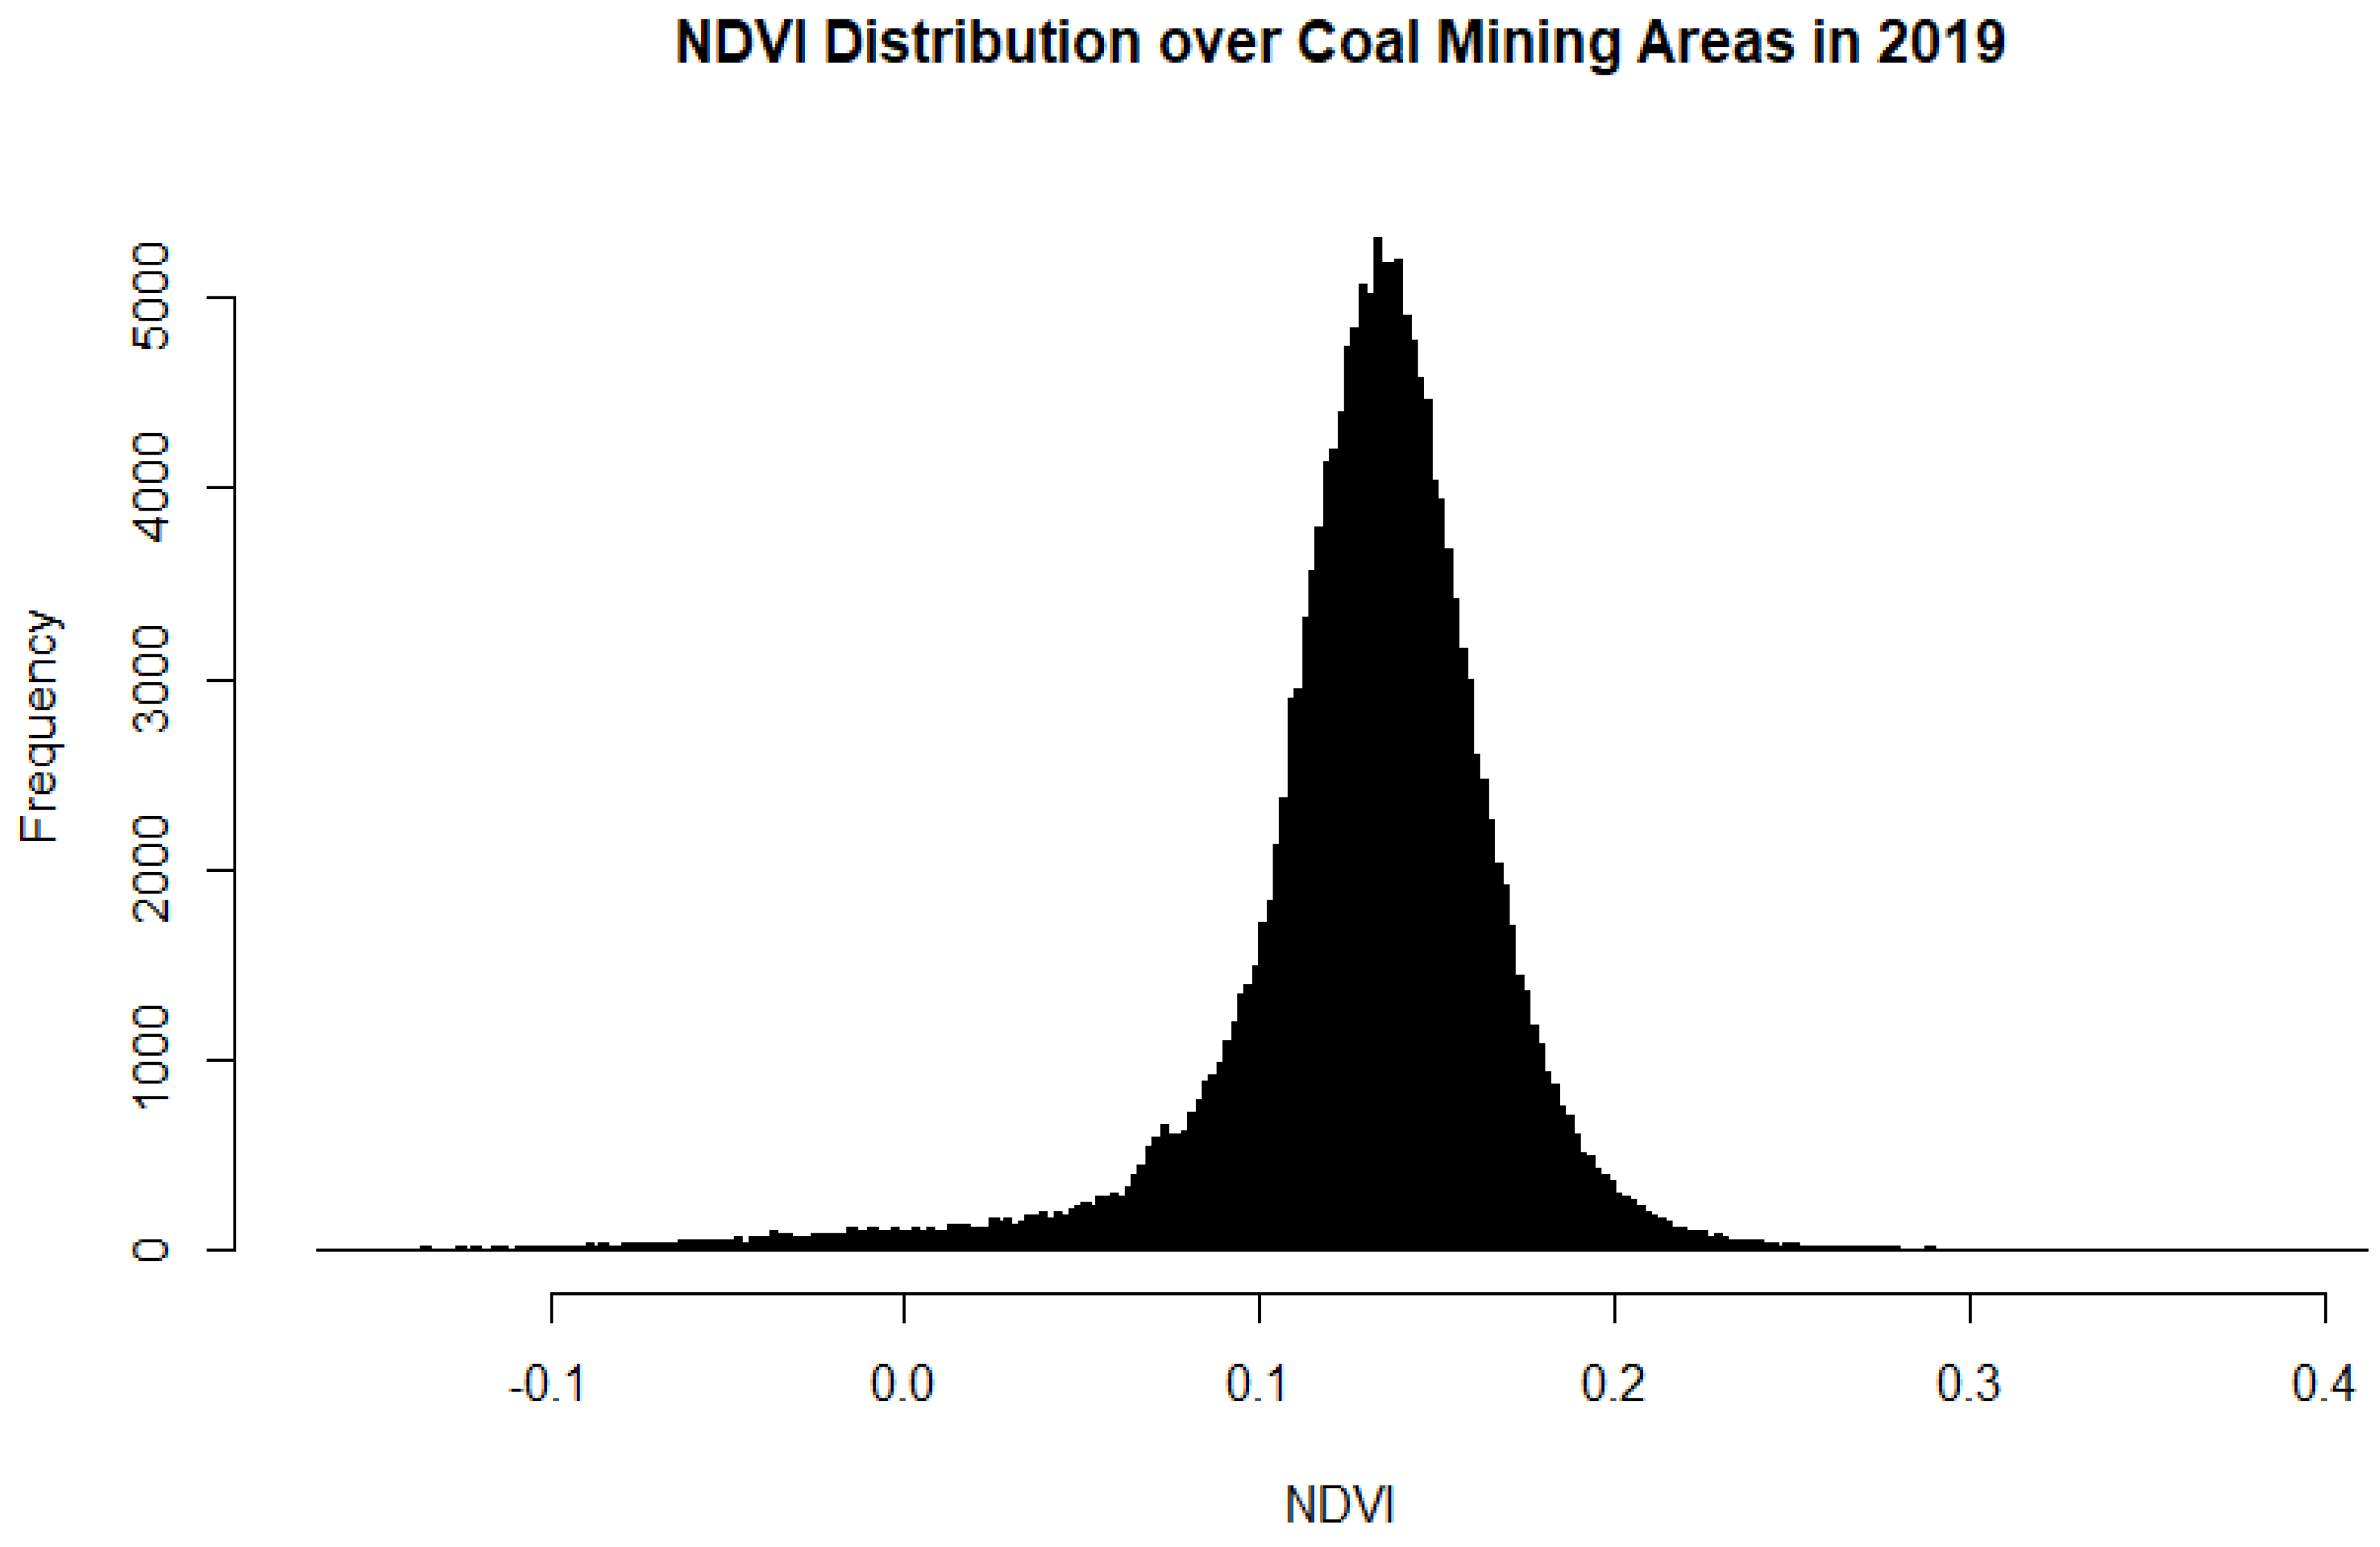
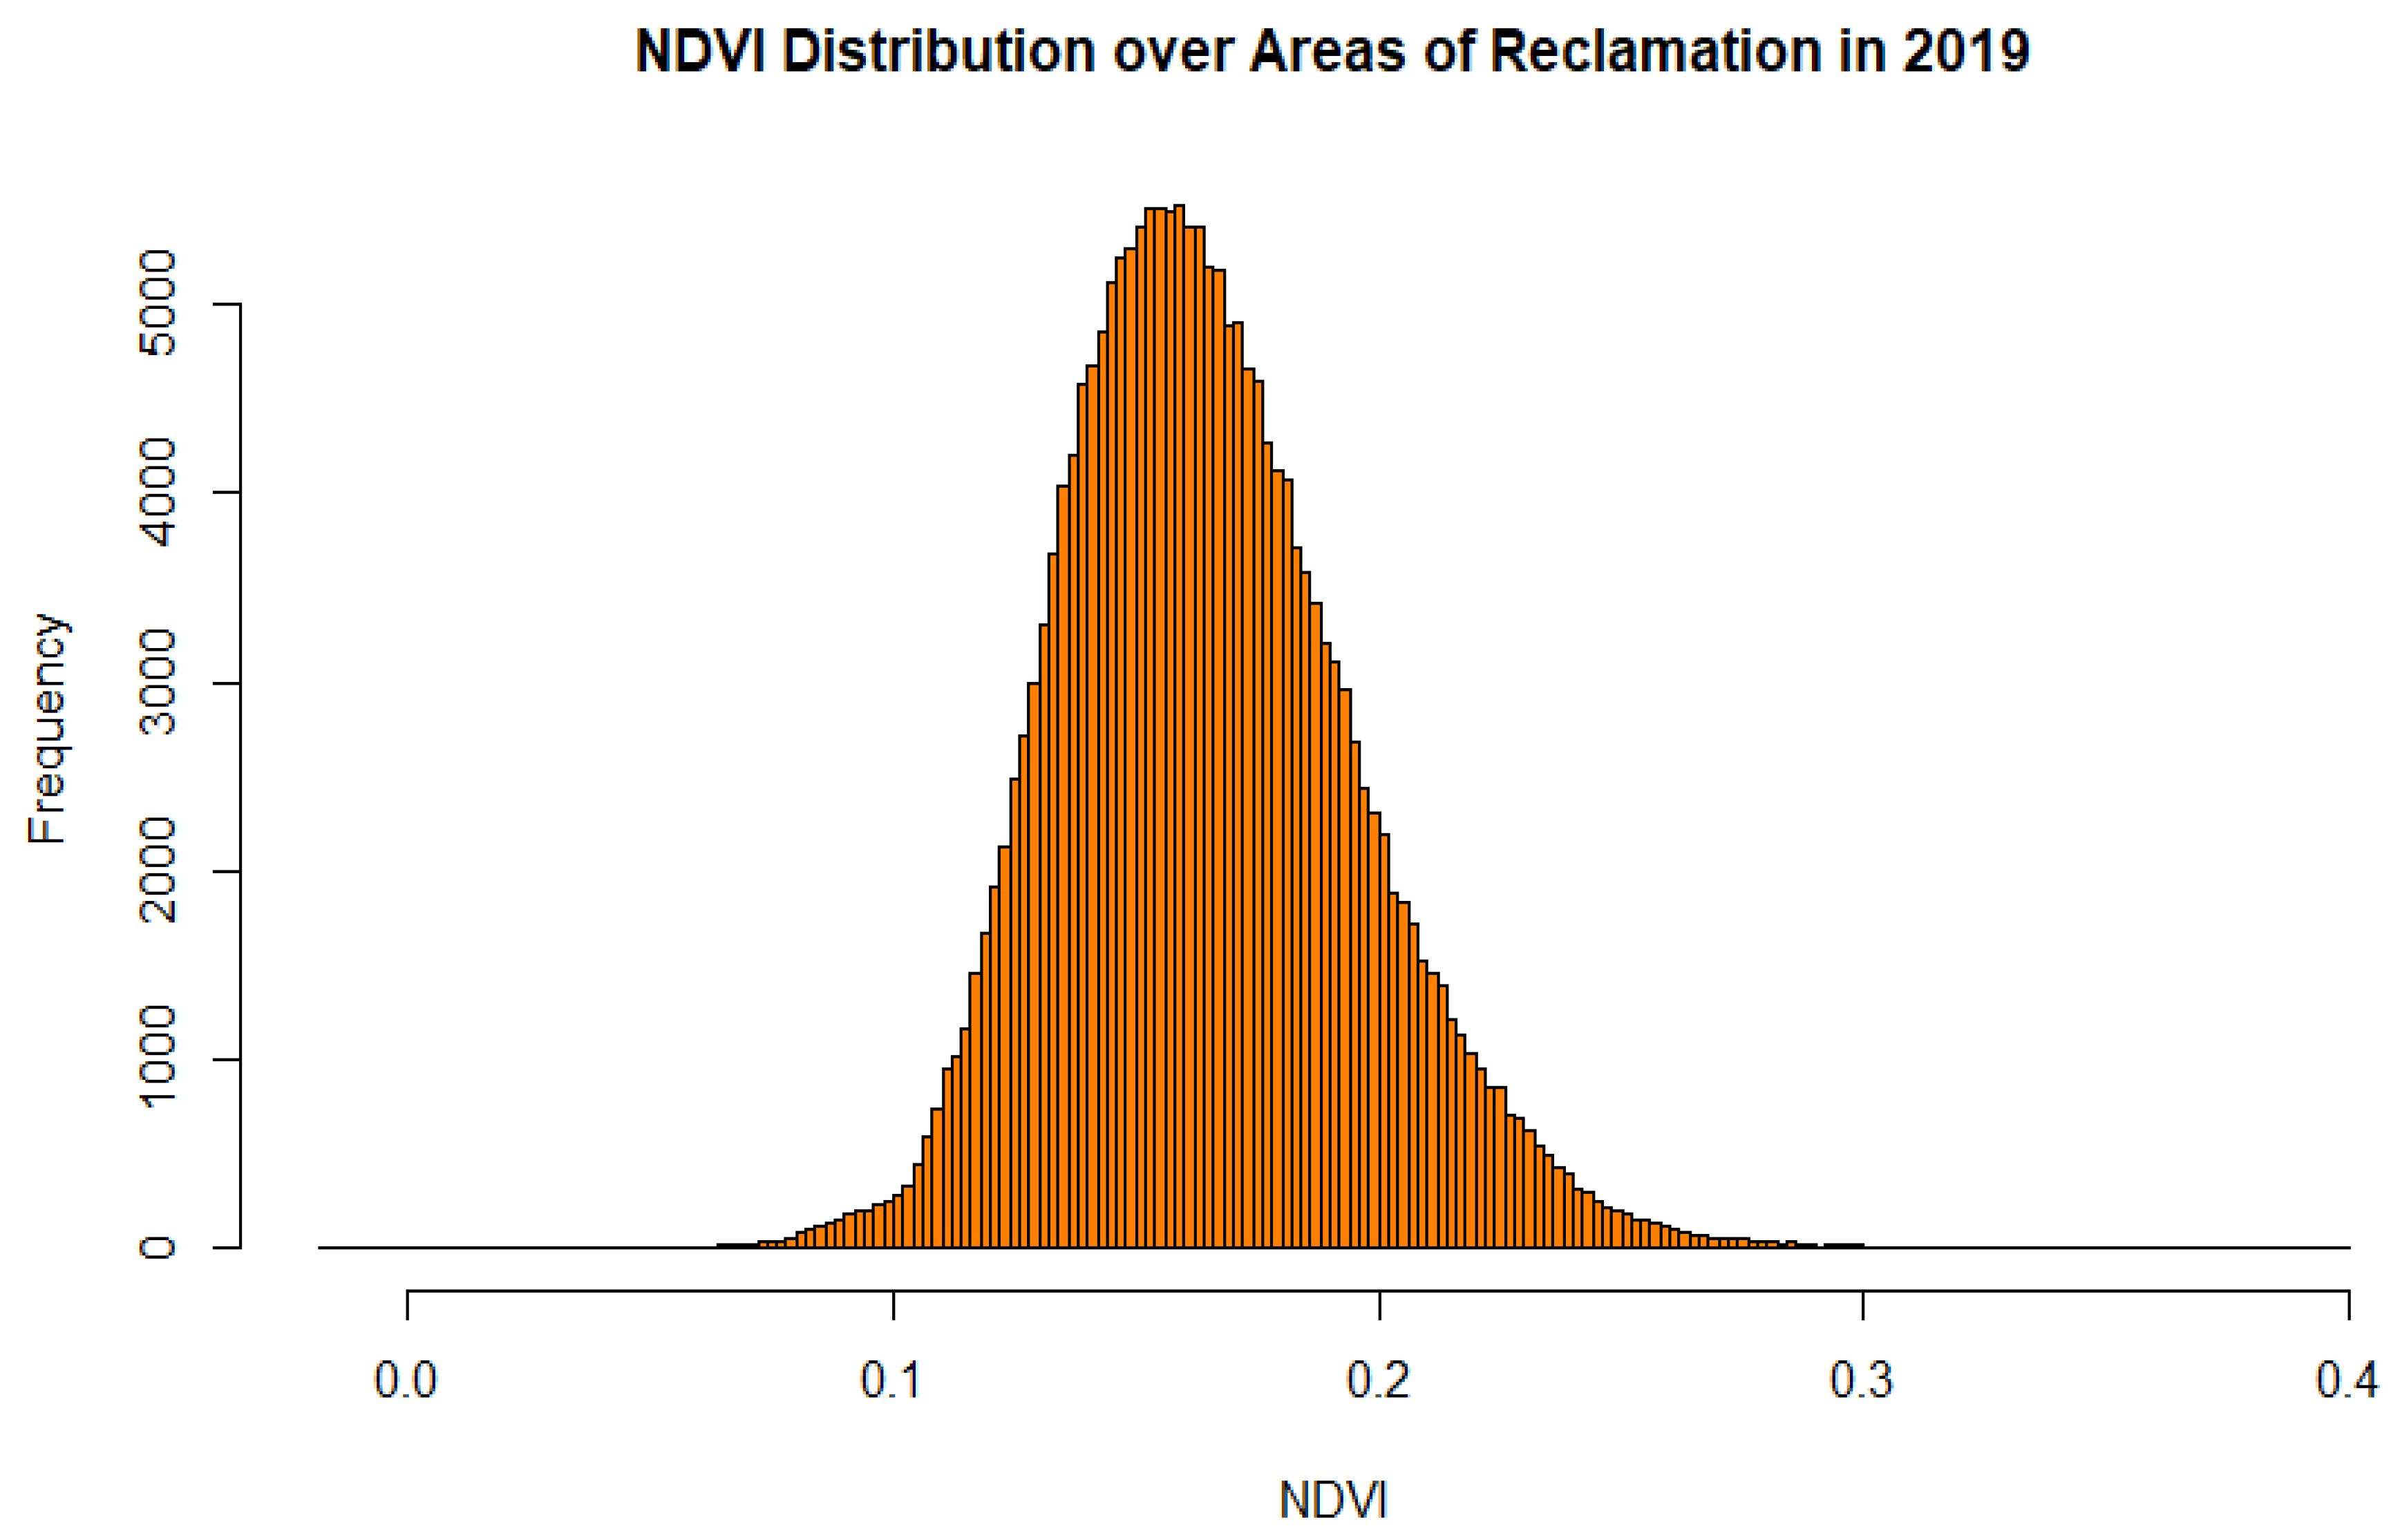
NDVI Analysis—Coal Mines and Areas of Reclamation
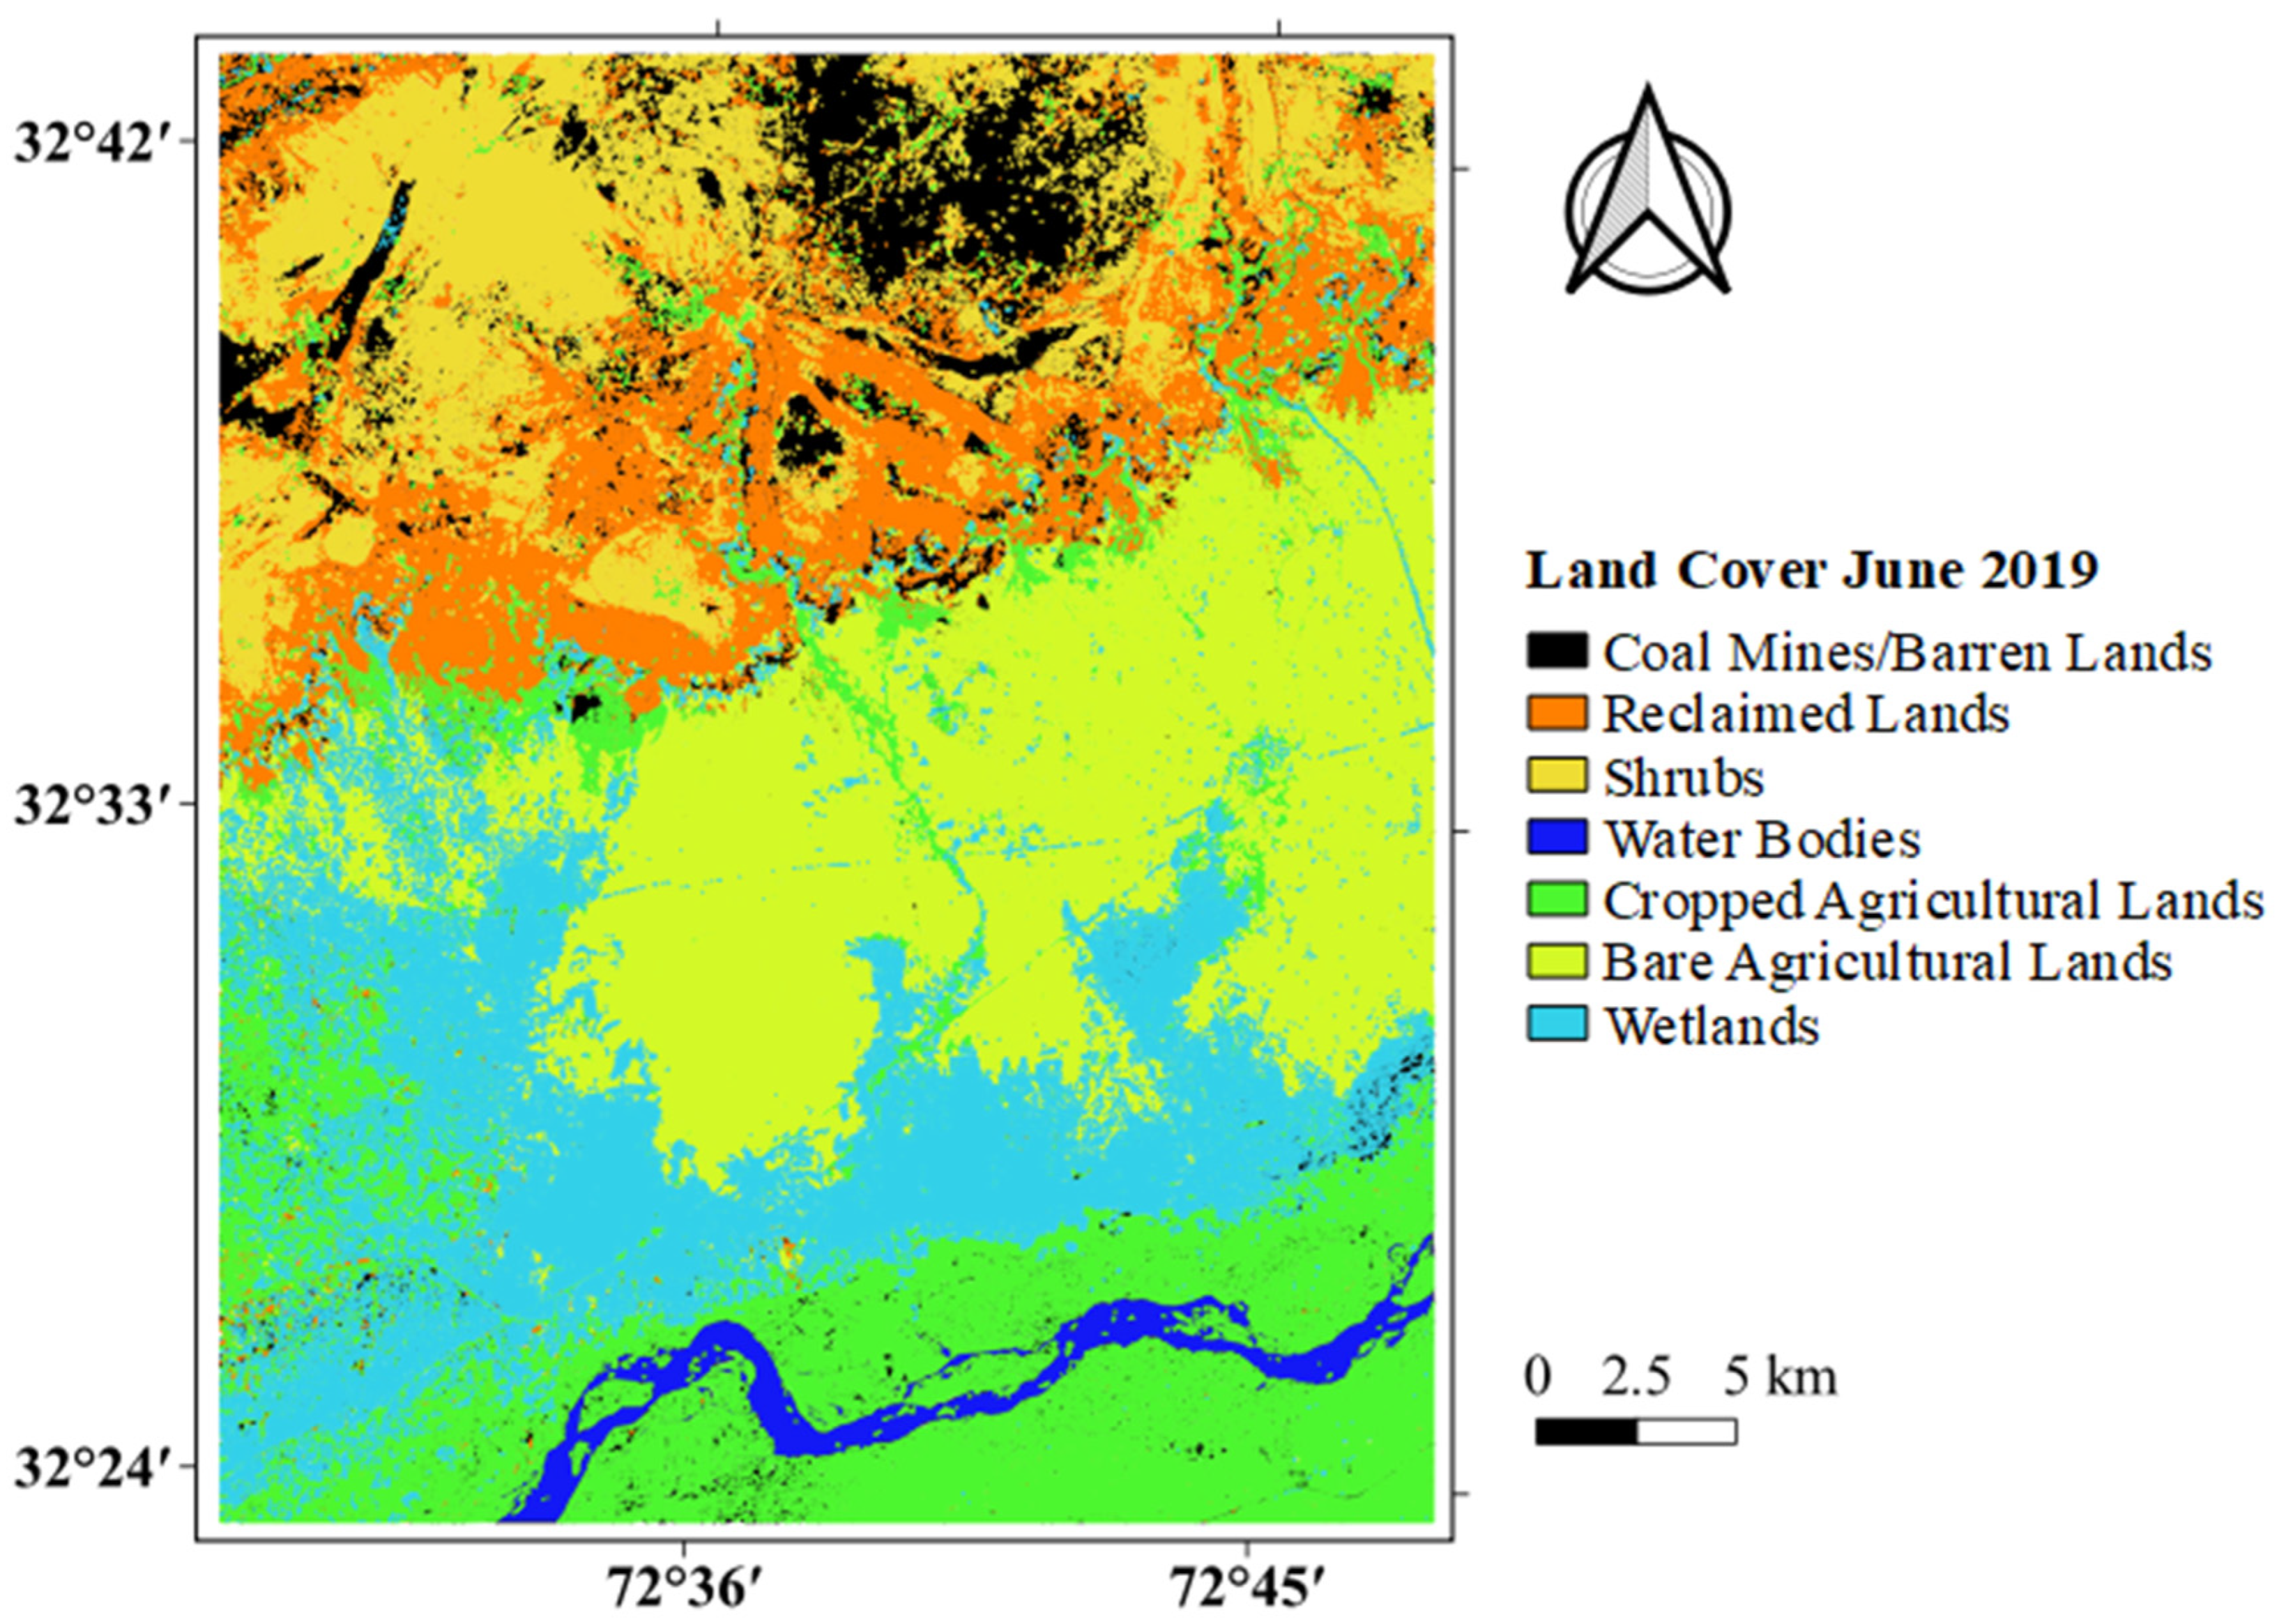
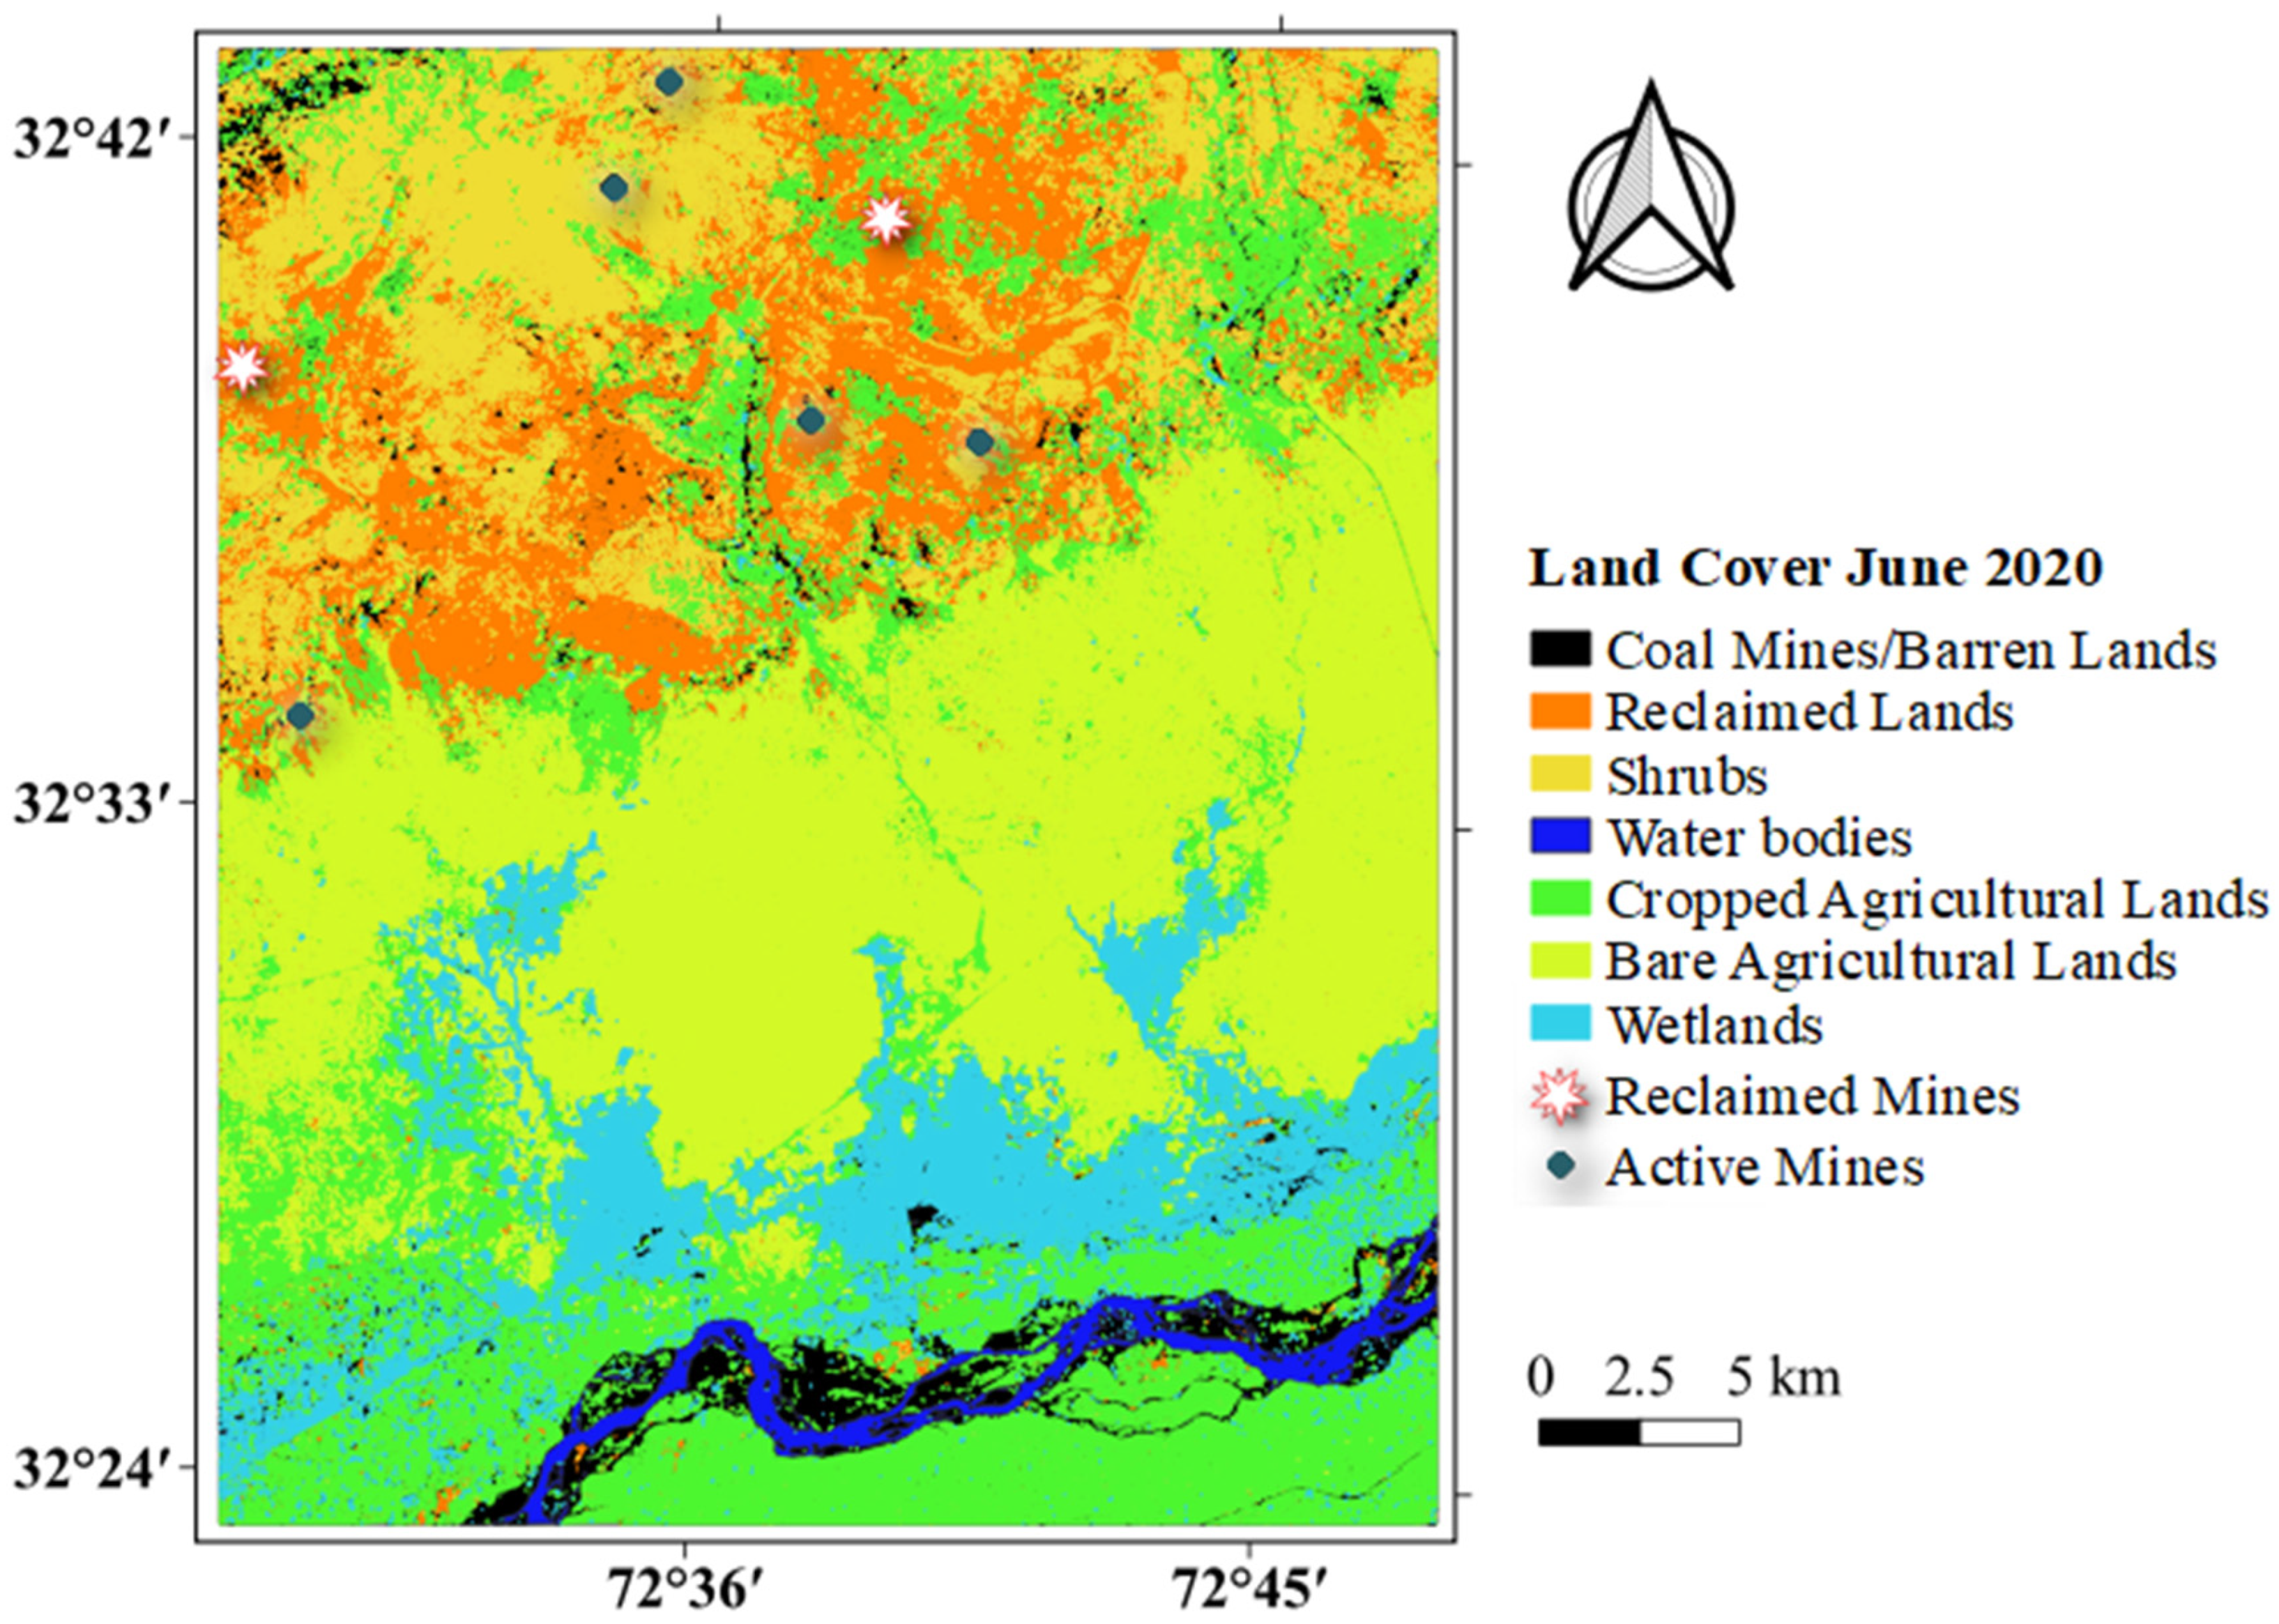
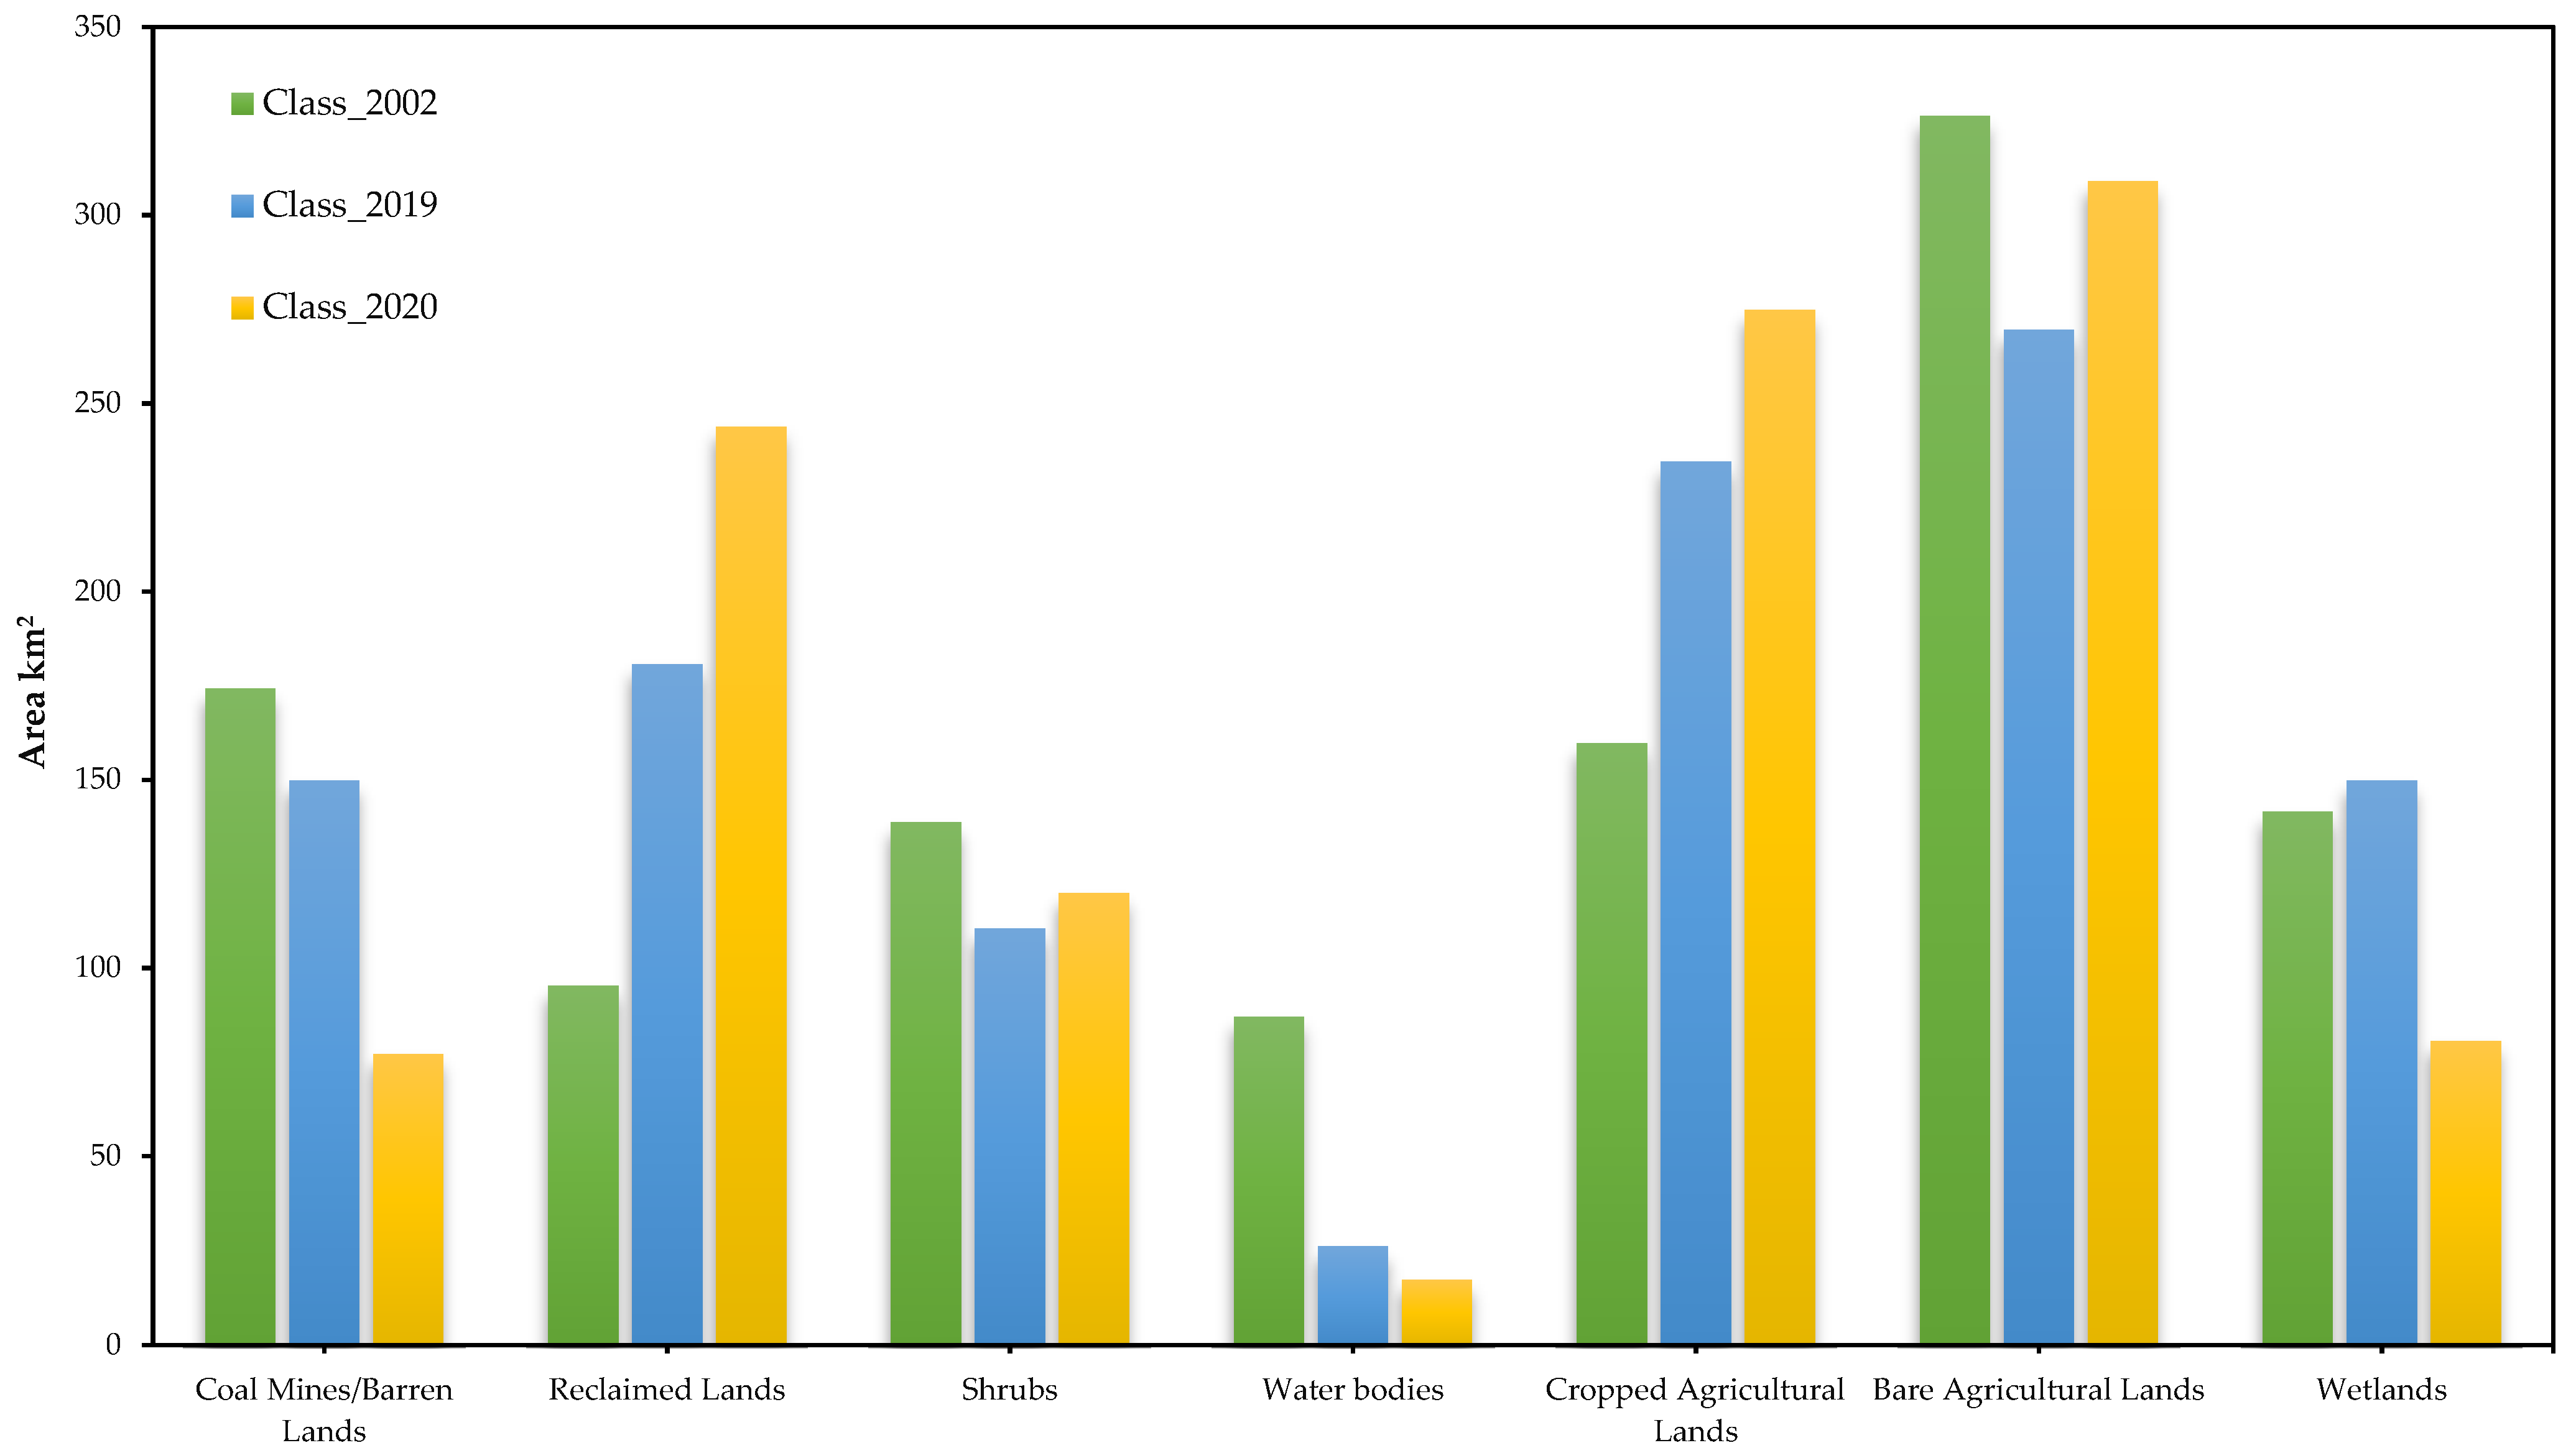
3.2. Land Cover Mapping
4. Conclusions
Author Contributions
Funding
Data Availability Statement
Acknowledgments
Conflicts of Interest
References
- Madlener, R.; Alcott, B. Energy rebound and economic growth: A review of the main issues and research needs. Energy 2009, 34, 370–376. [Google Scholar] [CrossRef]
- Mangi, H.N.; Detian, Y.; Hameed, N.; Ashraf, U.; Rajper, R.H. Pore structure characteristics and fractal dimension analysis of low rank coal in the Lower Indus Basin, SE Pakistan. J. Nat. Gas Sci. Eng. 2020, 77, 103231. [Google Scholar] [CrossRef]
- Mangi, H.N.; Chi, R.; DeTian, Y.; Sindhu, L.; He, D.; Ashraf, U.; Fu, H.; Zixuan, L.; Zhou, W.; Anees, A. The ungrind and grinded effects on the pore geometry and adsorption mechanism of the coal particles. J. Nat. Gas Sci. Eng. 2022, 100, 104463. [Google Scholar] [CrossRef]
- Kan, S.; Chen, B.; Chen, G. Worldwide energy use across global supply chains: Decoupled from economic growth? Appl. Energy 2019, 250, 1235–1245. [Google Scholar] [CrossRef]
- Rehman, S.A.U.; Cai, Y.; Mirjat, N.H.; Das Walasai, G.; Shah, I.A.; Ali, S. The Future of Sustainable Energy Production in Pakistan: A System Dynamics-Based Approach for Estimating Hubbert Peaks. Energies 2017, 10, 1858. [Google Scholar] [CrossRef]
- Singh, R.D. Principles and Practices of Modern Coal Mining; New Age International: Hong Kong, China, 2005. [Google Scholar]
- Ashraf, U.; Zhang, H.; Anees, A.; Mangi, H.N.; Ali, M.; Zhang, X.; Imraz, M.; Abbasi, S.S.; Abbas, A.; Ullah, Z.; et al. A Core Logging, Machine Learning and Geostatistical Modeling Interactive Approach for Subsurface Imaging of Lenticular Geobodies in a Clastic Depositional System, SE Pakistan. Nonrenew. Resour. 2021, 30, 2807–2830. [Google Scholar] [CrossRef]
- Lin, B.; Raza, M.Y. Coal and economic development in Pakistan: A necessity of energy source. Energy 2020, 207, 118244. [Google Scholar] [CrossRef]
- Malkani, M.S. A review of coal and water resources of Pakistan. J. Sci. Technol. Dev. 2012, 31, 202–218. [Google Scholar]
- Rauf, O.; Wang, S.; Yuan, P.; Tan, J. An overview of energy status and development in Pakistan. Renew. Sustain. Energy Rev. 2015, 48, 892–931. [Google Scholar] [CrossRef]
- Breitenlechner, E.; Hilber, M.; Lutz, J.; Kathrein, Y.; Unterkircher, A.; Oeggl, K. The impact of mining activities on the environment reflected by pollen, charcoal and geochemical analyses. J. Archaeol. Sci. 2010, 37, 1458–1467. [Google Scholar] [CrossRef]
- Shahab, A.; Qi, S.; Zaheer, M.; Rashid, A.; Talib, M.A.; Ashraf, U. Hydrochemical characteristics and water quality assessment for drinking and agricultural purposes in District Jacobabad, Lower Indus Plain, Pakistan. Int. J. Agric. Biol. Eng. 2018, 11, 115–121. [Google Scholar] [CrossRef]
- Alalimi, A.; AlRassas, A.M.; Thanh, H.V.; Al-Qaness, M.A.A.; Pan, L.; Ashraf, U.; Al-Alimi, D.; Moharam, S. Developing the efficiency-modeling framework to explore the potential of CO2 storage capacity of S3 reservoir, Tahe oilfield, China. Geomech. Geophys. Geo-Energy Geo-Resour. 2022, 8, 128. [Google Scholar] [CrossRef]
- Thanh, H.V.; Lee, K.-K. Application of machine learning to predict CO2 trapping performance in deep saline aquifers. Energy 2021, 239, 122457. [Google Scholar] [CrossRef]
- Safaei-Farouji, M.; Thanh, H.V.; Dashtgoli, D.S.; Yasin, Q.; Radwan, A.E.; Ashraf, U.; Lee, K.-K. Application of robust intelligent schemes for accurate modelling interfacial tension of CO2 brine systems: Implications for structural CO2 trapping. Fuel 2022, 319, 123821. [Google Scholar] [CrossRef]
- Watto, M.A.; Mugera, A.W. Groundwater depletion in the Indus Plains of Pakistan: Imperatives, repercussions and management issues. Int. J. River Basin Manag. 2016, 14, 447–458. [Google Scholar] [CrossRef]
- Ishtiaq, M.; Jehan, N.; Khan, S.A.; Muhammad, S.; Saddique, U.; Iftikhar, B. Potential harmful elements in coal dust and human health risk assessment near the mining areas in Cherat, Pakistan. Environ. Sci. Pollut. Res. 2018, 25, 14666–14673. [Google Scholar] [CrossRef]
- Thanh, H.V.; Yasin, Q.; Al-Mudhafar, W.J.; Lee, K.-K. Knowledge-based machine learning techniques for accurate prediction of CO2 storage performance in underground saline aquifers. Appl. Energy 2022, 314, 118985. [Google Scholar] [CrossRef]
- Feng, Y.; Wang, J.; Bai, Z.; Reading, L. Effects of surface coal mining and land reclamation on soil properties: A review. Earth-Sci. Rev. 2019, 191, 12–25. [Google Scholar] [CrossRef]
- Brunn, A.; Dittmann, C.; Fischer, C.; Richter, R. Atmospheric correction of 2000 HyMAP data in the framework of the EU-project MINEO. Image Signal Process. Remote Sens. VII 2002, 4541, 382–392. [Google Scholar] [CrossRef]
- Padmanaban, R.; Bhowmik, A.K.; Cabral, P. A Remote Sensing Approach to Environmental Monitoring in a Reclaimed Mine Area. ISPRS Int. J. Geo-Inf. 2017, 6, 401. [Google Scholar] [CrossRef]
- Millán, V.E.G.; Müterthies, A.; Pakzad, K.; Teuwsen, S.; Benecke, N.; Zimmermann, K.; Kateloe, H.-J.; Preuße, A.; Helle, K.; Knoth, C. GMES4Mining: GMES-based Geoservices for Mining to Support Prospection and Exploration and the Integrated Monitoring for Environmental Protection and Operational Security. BHM Berg Hüttenmännische Mon. 2013, 159, 66–73. [Google Scholar] [CrossRef]
- Brunn, A.; Busch, W.; Dittmann, C.; Fischer, C.; Vosen, P. Monitoring mining induced plant alteration and change detection in a german coal mining area using airborne hyperspectral imagery. In Proceedings of the Spectral Remote Sensing of Vegetation Conference, Las Vegas, NV, USA, 27 June 2003. [Google Scholar]
- Wegmuller, U.; Strozzi, T.; Werner, C.; Wiesmann, A.; Benecke, N.; Spreckels, V. Monitoring of mining-induced surface deformation in the Ruhrgebiet (Germany) with SAR interferometry. In IGARSS 2000, Proceedings of the IEEE 2000 International Geoscience and Remote Sensing Symposium, Taking the Pulse of the Planet: The Role of Remote Sensing in Managing the Environment. Proceedings (Cat. No. 00CH37120), Honolulu, HI, USA, 24–28 July 2000; IEEE: Piscataway, NJ, USA, 2000; Volume 6, pp. 2771–2773. [Google Scholar]
- Eikhoff, J. Developments in the German coal mining industry; Entwicklungen im deutschen Steinkohlenbergbau. Glueckauf 2007, 143, 10–16. [Google Scholar]
- Lein, J.K. Evaluating the utility of land satellite information for strip mine reclamation monitoring and assessment. Pap. Proc. Appl. Geogr. Conf. 2001, 24, 1998. [Google Scholar]
- Xie, Y.; Sha, Z.; Yu, M. Remote sensing imagery in vegetation mapping: A review. J. Plant Ecol. 2008, 1, 9–23. [Google Scholar] [CrossRef]
- Werner, T.T.; Mudd, G.M.; Schipper, A.M.; Huijbregts, M.A.; Taneja, L.; Northey, S.A. Global-scale remote sensing of mine areas and analysis of factors explaining their extent. Glob. Environ. Change 2019, 60, 102007. [Google Scholar] [CrossRef]
- Petersen, M.D.; Frankel, A.D.; Harmsen, S.C.; Mueller, C.S.; Haller, K.M.; Wheeler, R.L.; Wesson, R.L.; Zeng, Y.; Boyd, O.S.; Perkins, D.M.; et al. Documentation for the 2008 Update of the United States National Seismic Hazard Maps; USGS: Washington, DC, USA, 2008. [Google Scholar]
- Wulder, M.A.; White, J.C.; Goward, S.N.; Masek, J.G.; Irons, J.R.; Herold, M.; Cohen, W.B.; Loveland, T.R.; Woodcock, C.E. Landsat continuity: Issues and opportunities for land cover monitoring. Remote Sens. Environ. 2008, 112, 955–969. [Google Scholar] [CrossRef]
- Sarma, K.; Kushwaha, S.P.S. Coal Mining impact on land use/land cover in jaintia hills district of Meghalaya, India using remote sensing and GIS technique. In Proceeding of the National Conference on Geospatial Technologies, Geomatrix, Baltimore, MD, USA, 7–11 March 2005; Volume 9, pp. 28–43. [Google Scholar]
- Charou, E.; Stefouli, M.; Dimitrakopoulos, D.; Vasiliou, E.; Mavrantza, O.D. Using Remote Sensing to Assess Impact of Mining Activities on Land and Water Resources. Mine Water Environ. 2010, 29, 45–52. [Google Scholar] [CrossRef]
- Borana, S.L.; Yadav, S.K.; Parihar, S.K.; Palria, V.S. Impact analysis of sandstone mines on environment and LU/LC features using remote sensing and gis technique: A case study of the Jodhpur City, Rajasthan, India. J. Environ. Res. Dev. 2014, 8, 796. [Google Scholar]
- Vasuki, Y.; Yu, L.; Holden, E.-J.; Kovesi, P.; Wedge, D.; Grigg, A.H. The spatial-temporal patterns of land cover changes due to mining activities in the Darling Range, Western Australia: A Visual Analytics Approach. Ore Geol. Rev. 2019, 108, 23–32. [Google Scholar] [CrossRef]
- Townsend, P.A.; Helmers, D.P.; Kingdon, C.C.; McNeil, B.E.; de Beurs, K.M.; Eshleman, K.N. Changes in the extent of surface mining and reclamation in the Central Appalachians detected using a 1976–2006 Landsat time series. Remote Sens. Environ. 2009, 113, 62–72. [Google Scholar] [CrossRef]
- Obodai, J.; Adjei, K.A.; Odai, S.N.; Lumor, M. Land use/land cover dynamics using landsat data in a gold mining basin-the Ankobra, Ghana. Remote Sens. Appl. Soc. Environ. 2018, 13, 247–256. [Google Scholar] [CrossRef]
- Londoño, N.C. Sustainability Assessment of Alluvial and Open Pit Mining Systems in Colombia: Life Cycle Assessment, Exergy Analysis, and Emergy Accounting. Ph.D. Thesis, Universidad Nacional de Colombia, Medellin, Colombia, 2018. [Google Scholar]
- Dong, L.; Tong, X.; Li, X.; Zhou, J.; Wang, S.; Liu, B. Some developments and new insights of environmental problems and deep mining strategy for cleaner production in mines. J. Clean. Prod. 2018, 210, 1562–1578. [Google Scholar] [CrossRef]
- Younger, P.L.; Banwart, S.A.; Hedin, R.S. Mine Water: Hydrology, Pollution, Remediation; Springer Science & Business Media: Berlin/Heidelberg, Germany, 2002; Volume 5. [Google Scholar]
- Horrigan, L.; Lawrence, R.S.; Walker, P. How sustainable agriculture can address the environmental and human health harms of industrial agriculture. Environ. Health Perspect. 2002, 110, 445–456. [Google Scholar] [CrossRef] [PubMed]
- Krogh, M. Management of longwall coal mining impacts in Sydney’s southern drinking water catchments. Australas. J. Environ. Manag. 2007, 14, 155–165. [Google Scholar] [CrossRef]
- Wellen, C.; Shatilla, N.J.; Carey, S.K. The influence of mining on hydrology and solute transport in the Elk Valley, British Columbia, Canada. Environ. Res. Lett. 2018, 13, 74012. [Google Scholar] [CrossRef]
- Burchart-Korol, D.; Fugiel, A.; Czaplicka-Kolarz, K.; Turek, M. Model of environmental life cycle assessment for coal mining operations. Sci. Total Environ. 2016, 562, 61–72. [Google Scholar] [CrossRef]
- Khan, A.J.; Akhter, G.; Gabriel, H.F.; Shahid, M. Anthropogenic Effects of Coal Mining on Ecological Resources of the Central Indus Basin, Pakistan. Int. J. Environ. Res. Public Health 2020, 17, 1255. [Google Scholar] [CrossRef]
- Malkani, M.S.; Mahmood, Z.; Alyani, M.I.; Siraj, M. Mineral Resources of Khyber Pakhtunkhwa and FATA, Pakistan. Geol. Surv. Pak. Inf. Release 2017, 996, 1–61. [Google Scholar]
- Abbas, A.; Zhu, H.; Anees, A.; Ashraf, U.; Akhtar, N. Integrated Seismic Interpretation, 2D Modeling along with Petrophysical and Seismic Attribute Analysis to Decipher the Hydrocarbon Potential of Missakeswal Area, Pakistan. J. Geol. Geophys. 2019, 8, 455. [Google Scholar] [CrossRef]
- Ashraf, U. Analysis of Balkassar Area Using Velocity Modeling and Interpolation to Affirm Seismic Interpretation, Upper Indus Basin. Geosciences 2016, 2016, 78–91. [Google Scholar] [CrossRef]
- Ashraf, U. Development of a Computer Program for Zoeppritz Energy Partition Equations and Their Various Approximations to Affirm Presence of Hydrocarbon in Missakeswal Area. Geosciences 2017, 7, 55–67. [Google Scholar] [CrossRef]
- Malkani, M.S. A review on the mineral and coal resources of northern and southern Punjab, Pakistan. J. Himal. Earth Sci. 2012, 45, 97. [Google Scholar]
- Malkani, M.S.; Mahmood, Z. Coal Resources of Pakistan: Entry of new coalfields. Geol. Surv. Pak. Inf. Release 2017, 980, 1–28. [Google Scholar]
- Sajid, M.; Khan, N.; Shah, F.; Kashif, M.; Khan, S. Geochemical characteristics of coal seams within the Paleocene Patala Formation, Central Salt Range coal mines (Punjab), Northern Pakistan. J. Sediment. Environ. 2022, 7, 251–260. [Google Scholar] [CrossRef]
- Crist, E.P.; Cicone, R.C. A Physically-Based Transformation of Thematic Mapper Data—The TM Tasseled Cap. IEEE Trans. Geosci. Remote Sens. 1984, GE-22, 256–263. [Google Scholar] [CrossRef]
- Campbell, J.B.; Wynne, R. Introduction to Remote Sensing, 3rd ed.; Guilford Press: New York, NY, USA, 2002. [Google Scholar]
- Crist, E.P. A TM Tasseled Cap equivalent transformation for reflectance factor data. Remote Sens. Environ. 1985, 17, 301–306. [Google Scholar] [CrossRef]
- Baig, M.H.A.; Zhang, L.; Shuai, T.; Tong, Q. Derivation of a tasselled cap transformation based on Landsat 8 at-satellite reflectance. Remote Sens. Lett. 2014, 5, 423–431. [Google Scholar] [CrossRef]
- Kogan, F. Application of vegetation index and brightness temperature for drought detection. Adv. Space Res. 1995, 15, 91–100. [Google Scholar] [CrossRef]
- Hussain, M.; Liu, S.; Ashraf, U.; Ali, M.; Hussain, W.; Ali, N.; Anees, A. Application of Machine Learning for Lithofacies Prediction and Cluster Analysis Approach to Identify Rock Type. Energies 2022, 15, 4501. [Google Scholar] [CrossRef]
- Ashraf, U.; Zhang, H.; Anees, A.; Mangi, H.N.; Ali, M.; Ullah, Z.; Zhang, X. Application of Unconventional Seismic Attributes and Unsupervised Machine Learning for the Identification of Fault and Fracture Network. Appl. Sci. 2020, 10, 3864. [Google Scholar] [CrossRef]
- Yengoh, G.T.; Dent, D.; Olsson, L.; Tengberg, A.E.; Tucker, C.J., III. Use of the Normalized Difference Vegetation Index (NDVI) to Assess Land Degradation at Multiple Scales: Current Status, Future Trends, and Practical Considerations; Springer: Berlin/Heidelberg, Germany, 2015. [Google Scholar]
- Pu, R.; Gong, P.; Tian, Y.; Miao, X.; Carruthers, R.I.; Anderson, G.L. Using classification and NDVI differencing methods for monitoring sparse vegetation coverage: A case study of saltcedar in Nevada, USA. Int. J. Remote Sens. 2008, 29, 3987–4011. [Google Scholar] [CrossRef]
- Weng, Q.; Lu, D.; Schubring, J. Estimation of land surface temperature–vegetation abundance relationship for urban heat island studies. Remote Sens. Environ. 2004, 89, 467–483. [Google Scholar] [CrossRef]
- Karnieli, A.; Agam, N.; Pinker, R.T.; Anderson, M.; Imhoff, M.L.; Gutman, G.G.; Panov, N.; Goldberg, A. Use of NDVI and Land Surface Temperature for Drought Assessment: Merits and Limitations. J. Clim. 2010, 23, 618–633. [Google Scholar] [CrossRef]
- Li, H.; Zhou, Y.; Li, X.; Meng, L.; Wang, X.; Wu, S.; Sodoudi, S. A new method to quantify surface urban heat island intensity. Sci. Total Environ. 2018, 624, 262–272. [Google Scholar] [CrossRef] [PubMed]
- Meng, Q.; Zhang, L.; Sun, Z.; Meng, F.; Wang, L.; Sun, Y. Characterizing spatial and temporal trends of surface urban heat island effect in an urban main built-up area: A 12-year case study in Beijing, China. Remote Sens. Environ. 2018, 204, 826–837. [Google Scholar] [CrossRef]
- Ahmed, B.; Kamruzzaman, M.; Zhu, X.; Rahman, M.S.; Choi, K. Simulating Land Cover Changes and Their Impacts on Land Surface Temperature in Dhaka, Bangladesh. Remote Sens. 2013, 5, 5969–5998. [Google Scholar] [CrossRef]
- Mushore, T.; Odindi, J.; Dube, T.; Mutanga, O. Prediction of future urban surface temperatures using medium resolution satellite data in Harare metropolitan city, Zimbabwe. Build. Environ. 2017, 122, 397–410. [Google Scholar] [CrossRef]
- Firozjaei, M.K.; Kiavarz, M.; Alavipanah, S.K.; Lakes, T.; Qureshi, S. Monitoring and forecasting heat island intensity through multi-temporal image analysis and cellular automata-Markov chain modelling: A case of Babol city, Iran. Ecol. Indic. 2018, 91, 155–170. [Google Scholar] [CrossRef]


| Variation in NDVI Values across the Areas of Coal Mining and Areas of Reclamation within the Study Area | ||||||
|---|---|---|---|---|---|---|
| Coal 2020 | Reclaim 2020 | Coal 2019 | Reclaim 2019 | Coal 2002 | Reclaim 2002 | |
| 1st quartile | 0.03 | 0.07 | 0.05 | 0.08 | 0.09 | 0.07 |
| 2nd quartile | 0.19 | 0.23 | 0.11 | 0.14 | 0.12 | 0.12 |
| Median | 0.25 | 0.29 | 0.13 | 0.16 | 0.13 | 0.13 |
| 4th quartile | 0.30 | 0.34 | 0.15 | 0.18 | 0.14 | 0.15 |
| 5th quartile | 0.46 | 0.50 | 0.20 | 0.24 | 0.17 | 0.19 |
| Mean | 0.25 | 0.29 | 0.13 | 0.16 | 0.13 | 0.13 |
| Class Name | Description |
|---|---|
| Coal Mine/Barren Lands | Land disturbed by active mining and other non-vegetated areas. |
| Reclaimed Lands | Areas undergoing the revegetation stage of reclamation |
| Shrub | Land covered by sparse vegetation. |
| Water bodies | Wet areas are largely composed of the river but also streams |
| Cropped Agricultural Lands | Lands with crops |
| Bare Agricultural Lands | Agricultural lands that are currently without crops |
| Wetlands | Swampy areas or areas that always have water |
| Area (km2) | |||
|---|---|---|---|
| Land Cover Type | 2002 | 2019 | 2020 |
| Coal Mines/Barren Lands | 174.20 | 149.84 | 77.20 |
| Reclaimed Lands | 95.26 | 180.75 | 243.82 |
| Shrubs | 138.67 | 110.44 | 119.93 |
| Water bodies | 87.02 | 26.08 | 17.37 |
| Cropped Agricultural Lands | 159.76 | 234.46 | 274.81 |
| Bare Agricultural Lands | 326.42 | 269.52 | 309.09 |
| Wetlands | 141.51 | 149.73 | 80.64 |
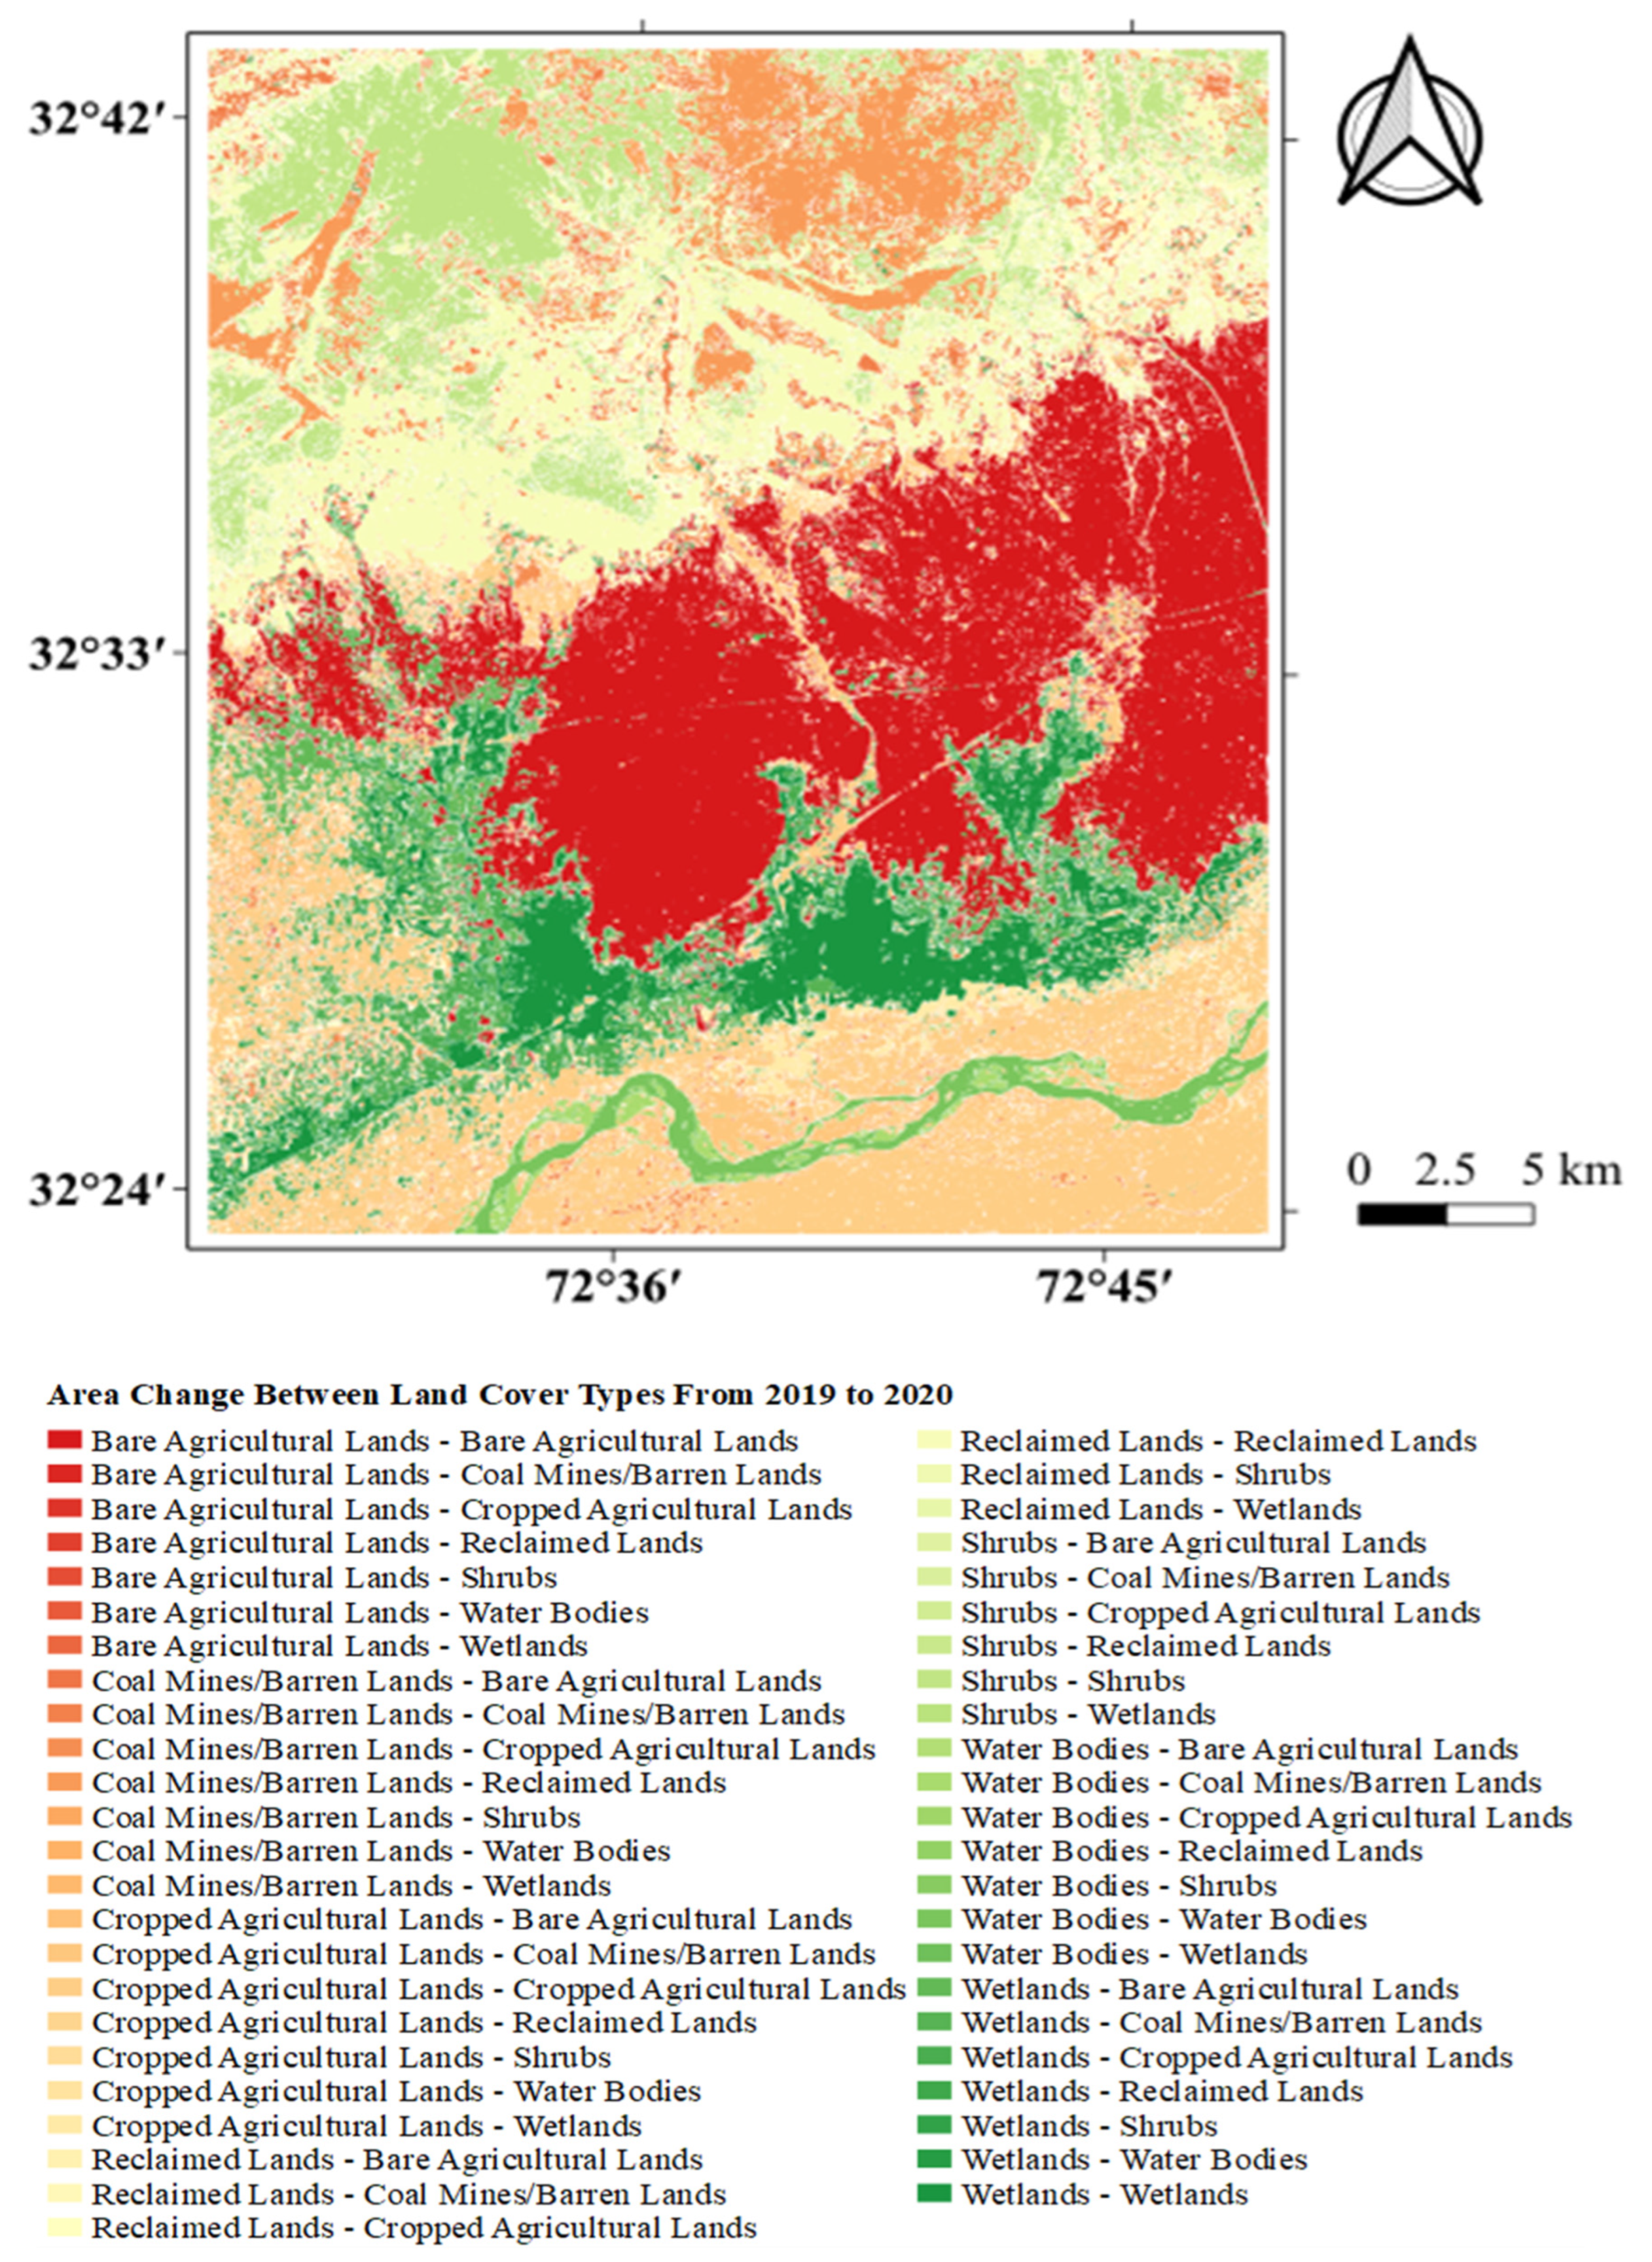
| Change (2019–2020) | Area Change (km2) |
|---|---|
| Bare Agricultural Lands—Bare Agricultural Lands | 249.72 |
| Bare Agricultural Lands—Coal Mines/Barren Lands | 0.12 |
| Bare Agricultural Lands—Cropped Agricultural Lands | 13.93 |
| Bare Agricultural Lands—Reclaimed Lands | 4.82 |
| Bare Agricultural Lands—Shrubs | 0.48 |
| Bare Agricultural Lands—Water Bodies | 0.00 |
| Bare Agricultural Lands—Wetlands | 0.43 |
| Coal Mines/Barren Lands—Bare Agricultural Lands | 3.62 |
| Coal Mines/Barren Lands—Coal Mines/Barren Lands | 23.19 |
| Coal Mines/Barren Lands—Cropped Agricultural Lands | 25.00 |
| Coal Mines/Barren Lands—Reclaimed Lands | 84.04 |
| Coal Mines/Barren Lands—Shrubs | 10.78 |
| Coal Mines/Barren Lands—Water Bodies | 0.07 |
| Coal Mines/Barren Lands—Wetlands | 3.08 |
| Cropped Agricultural Lands—Bare Agricultural Lands | 22.43 |
| Cropped Agricultural Lands—Coal Mines/Barren Lands | 26.80 |
| Cropped Agricultural Lands—Cropped Agricultural Lands | 159.48 |
| Cropped Agricultural Lands—Reclaimed Lands | 9.94 |
| Cropped Agricultural Lands—Shrubs | 1.57 |
| Cropped Agricultural Lands—Water Bodies | 1.26 |
| Cropped Agricultural Lands—Wetlands | 12.967 |
| Reclaimed Lands—Bare Agricultural Lands | 3.27 |
| Reclaimed Lands—Coal Mines/Barren Lands | 12.79 |
| Reclaimed Lands—Cropped Agricultural Lands | 20.70 |
| Reclaimed Lands—Reclaimed Lands | 115.28 |
| Reclaimed Lands—Shrubs | 28.52 |
| Reclaimed Lands—Wetlands | 0.16 |
| Shrubs—Bare Agricultural Lands | 0.14 |
| Shrubs—Coal Mines/Barren Lands | 0.68 |
| Shrubs—Cropped Agricultural Lands | 4.52 |
| Shrubs—Reclaimed Lands | 26.88 |
| Shrubs—Shrubs | 78.20 |
| Shrubs—Wetlands | 0.07 |
| Water Bodies—Bare Agricultural Lands | 0.09 |
| Water Bodies—Coal Mines/Barren Lands | 9.42 |
| Water Bodies—Cropped Agricultural Lands | 0.497 |
| Water Bodies—Reclaimed Lands | 0.08 |
| Water Bodies—Shrubs | 0.09 |
| Water Bodies—Water Bodies | 15.97 |
| Water Bodies—Wetlands | 0.17 |
| Wetlands—Bare Agricultural Lands | 29.56 |
| Wetlands—Coal Mines/Barren Lands | 3.96 |
| Wetlands—Cropped Agricultural Lands | 49.91 |
| Wetlands—Reclaimed Lands | 2.42 |
| Wetlands—Shrubs | 0.06 |
| Wetlands—Water Bodies | 0.01 |
| Wetlands—Wetlands | 63.76 |
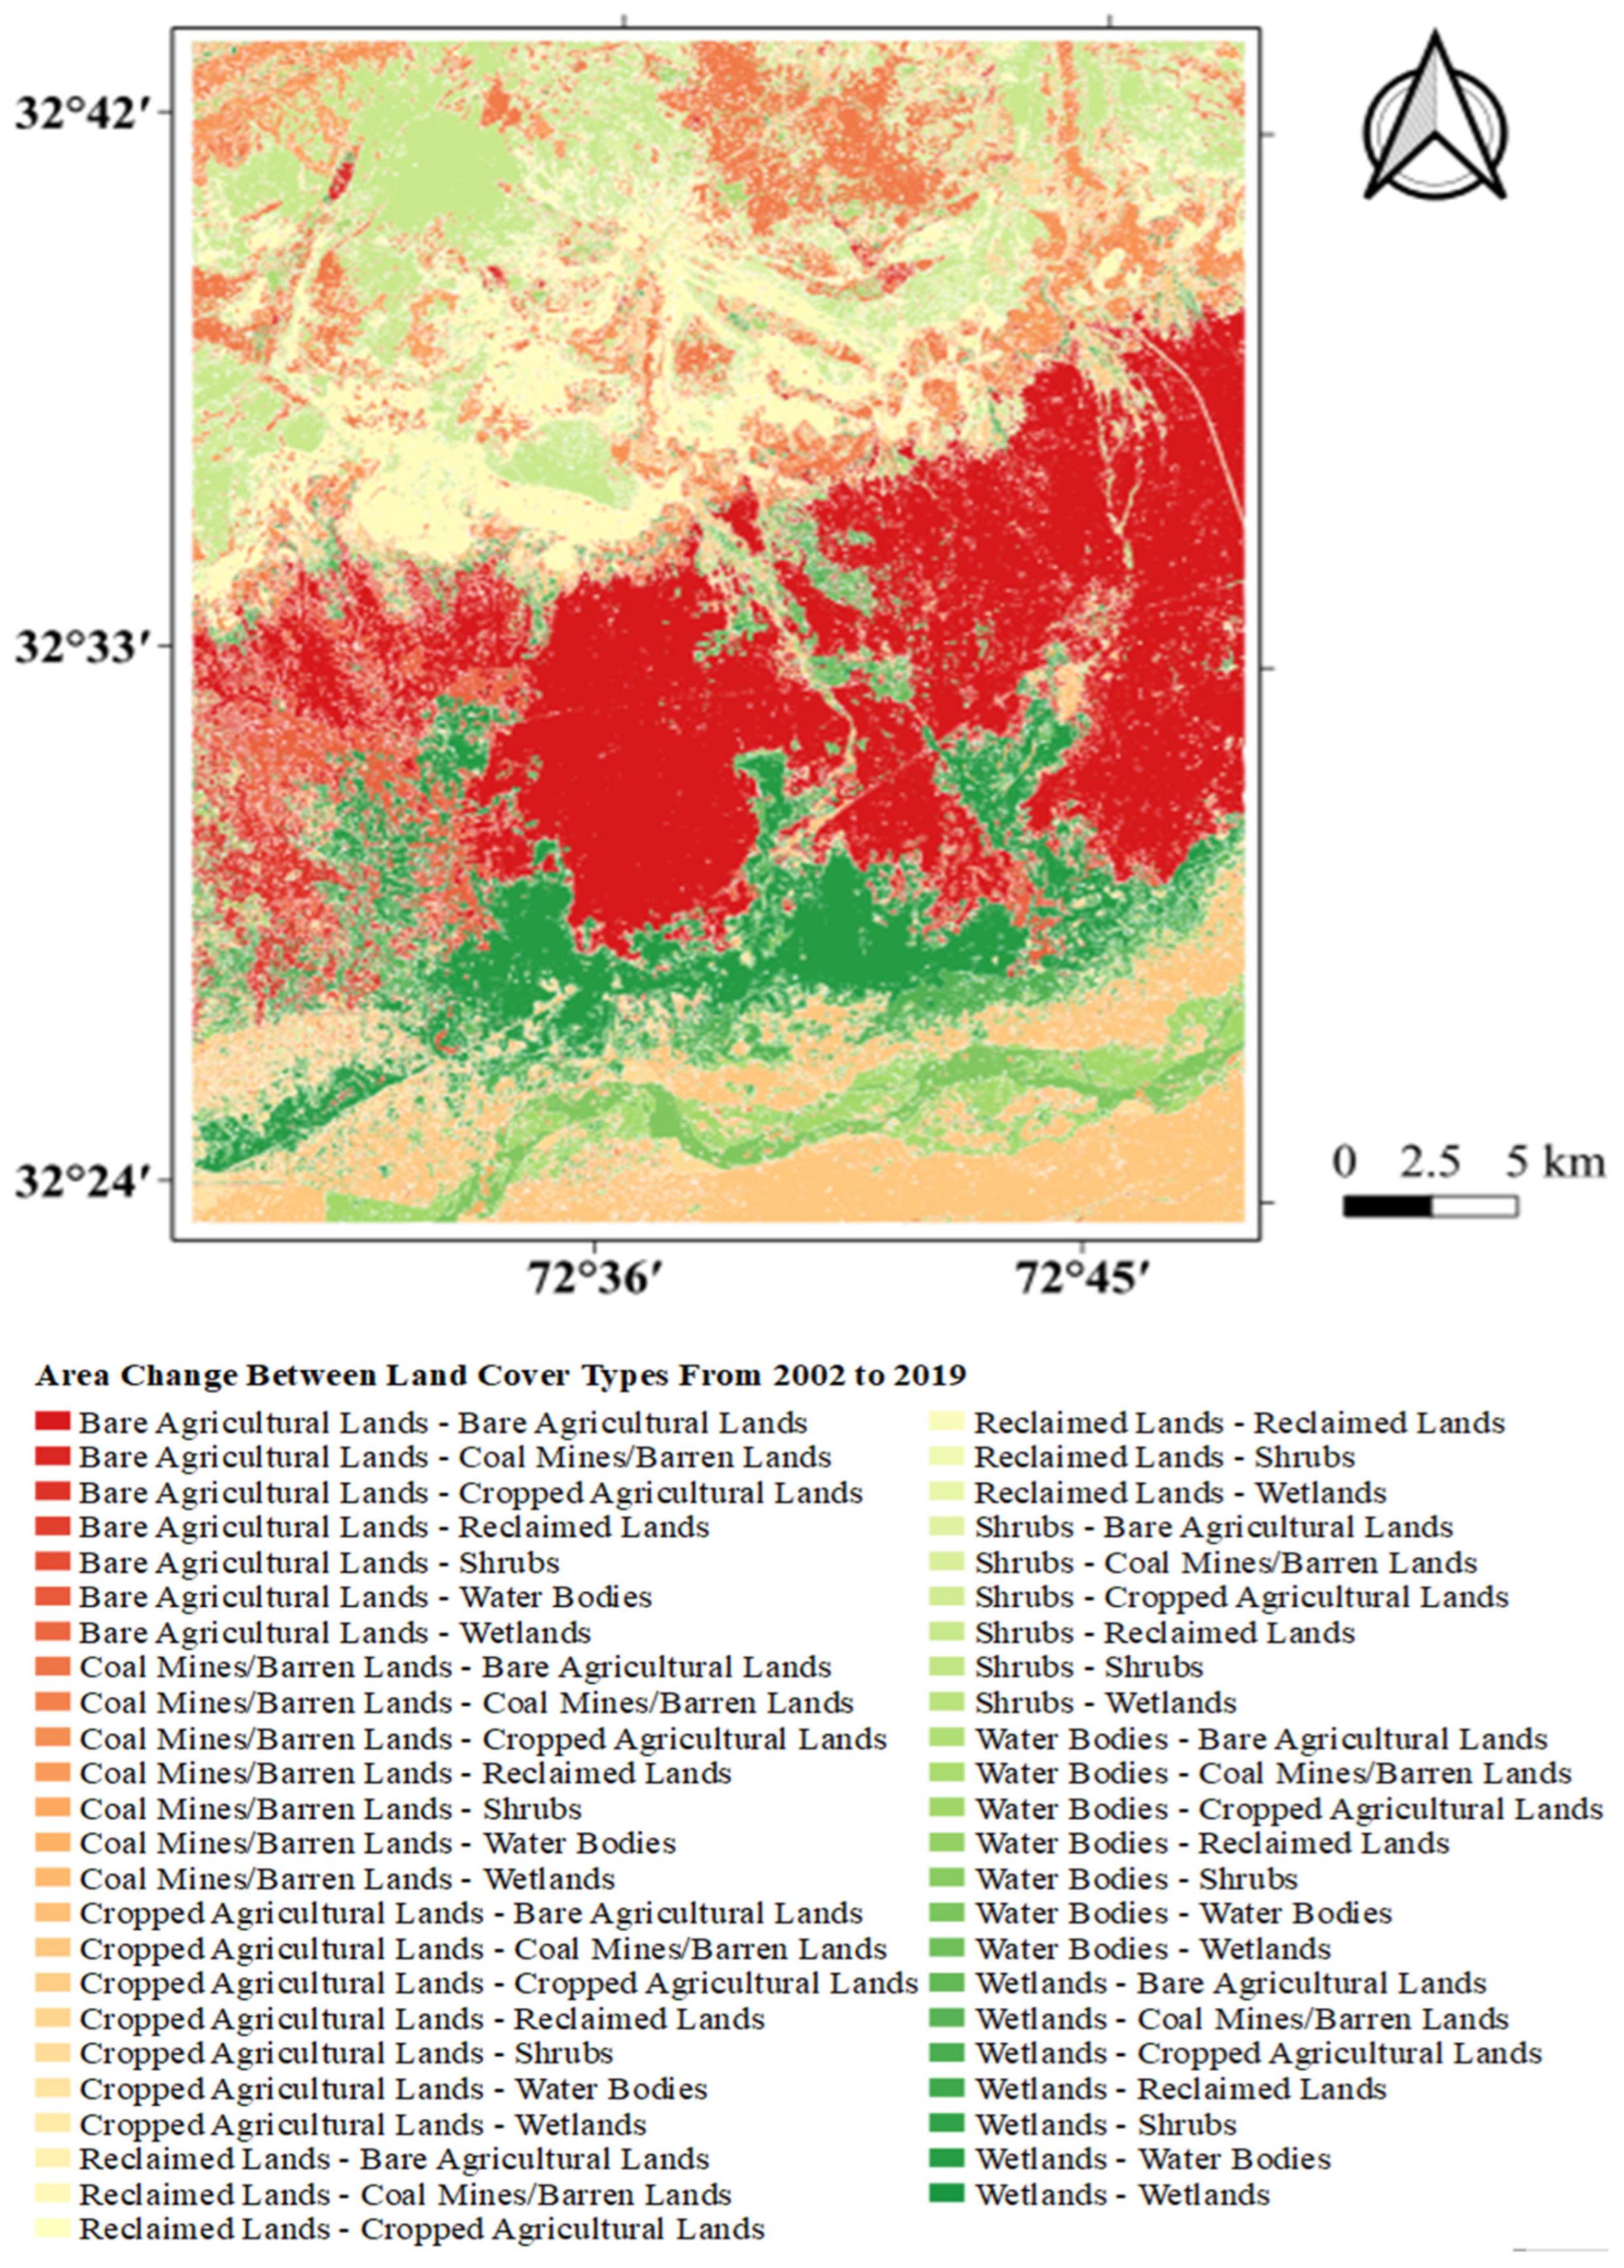
| Change (2002–2019) | Area Change (km2) |
|---|---|
| Bare Agricultural Lands—Bare Agricultural Lands | 241.64 |
| Bare Agricultural Lands—Coal Mines/Barren Lands | 5.39 |
| Bare Agricultural Lands—Cropped Agricultural Lands | 36.80 |
| Bare Agricultural Lands—Reclaimed Lands | 3.57 |
| Bare Agricultural Lands—Shrubs | 0.26 |
| Bare Agricultural Lands—Water Bodies | 0.00 |
| Bare Agricultural Lands—Wetlands | 38.40 |
| Coal Mines/Barren Lands—Bare Agricultural Lands | 6.79 |
| Coal Mines/Barren Lands—Coal Mines/Barren Lands | 76.08 |
| Coal Mines/Barren Lands—Cropped Agricultural Lands | 11.60 |
| Coal Mines/Barren Lands—Reclaimed Lands | 51.42 |
| Coal Mines/Barren Lands—Shrubs | 20.26 |
| Coal Mines/Barren Lands—Water Bodies | 2.81 |
| Coal Mines/Barren Lands—Wetlands | 4.80 |
| Cropped Agricultural Lands—Bare Agricultural Lands | 3.81 |
| Cropped Agricultural Lands—Coal Mines/Barren Lands | 14.79 |
| Cropped Agricultural Lands—Cropped Agricultural Lands | 105.88 |
| Cropped Agricultural Lands—Reclaimed Lands | 14.88 |
| Cropped Agricultural Lands—Shrubs | 3.17 |
| Cropped Agricultural Lands—Water Bodies | 3.76 |
| Cropped Agricultural Lands—Wetlands | 12.83 |
| Reclaimed Lands—Bare Agricultural Lands | 0.04 |
| Reclaimed Lands—Coal Mines/Barren Lands | 12.44 |
| Reclaimed Lands—Cropped Agricultural Lands | 1.20 |
| Reclaimed Lands—Reclaimed Lands | 74.32 |
| Reclaimed Lands—Shrubs | 7.05 |
| Reclaimed Lands—Water Bodies | 0.08 |
| Reclaimed Lands—Wetlands | 0.11 |
| Shrubs—Bare Agricultural Lands | 1.60 |
| Shrubs—Coal Mines/Barren Lands | 23.77 |
| Shrubs—Cropped Agricultural Lands | 2.34 |
| Shrubs—Reclaimed Lands | 30.87 |
| Shrubs—Shrubs | 79.13 |
| Shrubs—Water Bodies | 0.01 |
| Shrubs—Wetlands | 0.56 |
| Water bodies—Bare Agricultural Lands | 3.78 |
| Water bodies—Coal Mines/Barren Lands | 11.87 |
| Water bodies—Cropped Agricultural Lands | 43.23 |
| Water bodies—Reclaimed Lands | 2.81 |
| Water bodies—Shrubs | 0.53 |
| Water bodies—Water Bodies | 19.14 |
| Water bodies—Wetlands | 5.43 |
| Wetlands—Bare Agricultural Lands | 11.83 |
| Wetlands—Coal Mines/Barren Lands | 5.462 |
| Wetlands—Cropped Agricultural Lands | 33.39 |
| Wetlands—Reclaimed Lands | 2.85 |
| Wetlands—Shrubs | 0.02 |
| Wetlands—Water Bodies | 0.32 |
| Wetlands—Wetlands | 87.58 |
Publisher’s Note: MDPI stays neutral with regard to jurisdictional claims in published maps and institutional affiliations. |
© 2022 by the authors. Licensee MDPI, Basel, Switzerland. This article is an open access article distributed under the terms and conditions of the Creative Commons Attribution (CC BY) license (https://creativecommons.org/licenses/by/4.0/).
Share and Cite
Ali, N.; Fu, X.; Ashraf, U.; Chen, J.; Thanh, H.V.; Anees, A.; Riaz, M.S.; Fida, M.; Hussain, M.A.; Hussain, S.; et al. Remote Sensing for Surface Coal Mining and Reclamation Monitoring in the Central Salt Range, Punjab, Pakistan. Sustainability 2022, 14, 9835. https://doi.org/10.3390/su14169835
Ali N, Fu X, Ashraf U, Chen J, Thanh HV, Anees A, Riaz MS, Fida M, Hussain MA, Hussain S, et al. Remote Sensing for Surface Coal Mining and Reclamation Monitoring in the Central Salt Range, Punjab, Pakistan. Sustainability. 2022; 14(16):9835. https://doi.org/10.3390/su14169835
Chicago/Turabian StyleAli, Nafees, Xiaodong Fu, Umar Ashraf, Jian Chen, Hung Vo Thanh, Aqsa Anees, Muhammad Shahid Riaz, Misbah Fida, Muhammad Afaq Hussain, Sadam Hussain, and et al. 2022. "Remote Sensing for Surface Coal Mining and Reclamation Monitoring in the Central Salt Range, Punjab, Pakistan" Sustainability 14, no. 16: 9835. https://doi.org/10.3390/su14169835
APA StyleAli, N., Fu, X., Ashraf, U., Chen, J., Thanh, H. V., Anees, A., Riaz, M. S., Fida, M., Hussain, M. A., Hussain, S., Hussain, W., & Ahmed, A. (2022). Remote Sensing for Surface Coal Mining and Reclamation Monitoring in the Central Salt Range, Punjab, Pakistan. Sustainability, 14(16), 9835. https://doi.org/10.3390/su14169835