Article

The Negative Influence of Urban Underground Space Development on Urban Microclimate

1
Department of Art and Design, Zhengzhou College of Finance and Economics, Zhengzhou 450044, China
2
College of Architecture and Civil Engineering, Beijing University of Technology, Beijing 100124, China
3
Department of Environmental Design, School of Art and Archeology, Zhejiang University City College, Hangzhou 310015, China
4
Henan Civil Air Defense Protection System Technology and Support Center, Zhengzhou 450018, China
*
Authors to whom correspondence should be addressed.
Sustainability 2022, 14(16), 9836; https://doi.org/10.3390/su14169836
Submission received: 10 June 2022 / Revised: 1 August 2022 / Accepted: 4 August 2022 / Published: 9 August 2022

Abstract

:
The development of urban underground space can increase the green area of a city and have a positive impact on urban microclimate. However, the negative impacts of urban under-ground space development on the urban microclimate are rarely considered and analyzed. In this study, we focus on analyzing the impact of the development of underground commercial streets under determinant urban form on urban microclimate using outdoor CO concentrations as the evaluation index. In this regard, it was possible to quantitatively evaluate the influences of various development factors (e.g., development intensity of underground commercial streets; location and height of shaft exhaust; and various ground-greening configurations of transverse and vertical trees, large and small shrubs, and grasses) on the outdoor CO concentration. The results showed that higher development intensity increases outdoor CO concentration and its range of effects. Properly increasing the height of shaft exhausts, choosing a dispersed layout for shaft exhausts, and planting large shrubs on the ground in the development area of underground commercial streets can effectively reduce the impact of underground commercial street development on urban air quality.

1. Introduction

Urbanization has promoted social economy and resulted in the deterioration of urban environments in China. Improving the urban environment is an urgent issue to be considered with respect to urban planning and urban residents. To address urban environmental problems, various research and easing measures have been proposed [1,2,3,4,5,6,7]; in particular, landscape greening is accepted as an effective means of easing urban environmental problems [3], which can contribute to reduced air temperature and have a positive effect in terms of decreasing urban air pollution [1,6,8]. In recent years, some studies have suggested that the development of urban underground space is an appropriate measure to solve urban environmental problems [9,10,11]. The development of urban underground space can address the shortage of land resources, alleviate traffic congestion, and protect and improve the urban environment [9,10,11]. Accordingly, protecting and improving the urban environment has become one of the main contemporary topics with respect to the development of urban underground space. The application of this engineering practice to the development of urban underground space has received increasing attention and acceptance from the government, experts, and scholars [12].
Previous studies qualitatively pointed out that underground space development can increase the space requiring landscape greening, and numerous urban functions can be transferred underground, which could effectively improve the urban environment [13]. With the development of CFD technology, the Underground Space Research Center of Army Engineering University carried out interdisciplinary research on urban underground space, urban environment, urban planning, landscape gardening, climatology, etc. The research quantitatively evaluated the influence of different scales of underground space development on urban environment by applying numerical simulations [11]. Improvement of the urban environment was found to be closely related to the overburden thickness of underground space (OTUS) and greening configurations on the ground, suggesting positive guidelines for planning and design of underground spaces [9,10]. However, none of these studies considered and evaluated the negative influences of urban underground space development on the urban environment.
The development of urban rail transit and underground commerce can provide convenient underground travel, shopping, entertainment, and other activities for a large number of people. According to statistics, the maximum daily passenger flow at Nanjing Xinjiekou Subway Station reached 1.6 million, whereas the annual population flow in an underground commerce area was as high as 16.06 million in 2017. Because underground space is relatively confined with poor natural ventilation, its environmental quality is worse than that of outdoor spaces. The humid underground environment and the heat produced by lighting and human metabolism can easily make people uncomfortable. Radon pollution, CO2, CO, total volatile organic compounds (TVOCs), and microbial bacteria within underground spaces can negatively influence human health [13]. To ensure the safety and comfort of people living and carrying out activities underground, it is necessary to apply mechanical ventilation in order to discharge heat and pollutants from the underground space through shafts. Furthermore, it is necessary to supplement fresh air to people performing activities in underground spaces. When underground air quality is poor, it can have a secondary effect of the quality of outdoor air. Therefore, to decrease the negative influence of underground space development on the urban outdoor environment, is of considerable significance to optimize the planning and design of urban underground space.
In this study, the development of underground commercial streets under the determinant of urban form was selected as the research object, and outdoor CO concentration was chosen as an indicator to evaluate the effects of underground commercial streets on the outdoor microclimate. The aim of this study is to provide insights into the design of underground commercial streets with respect to mitigating negative impacts on the outdoor microclimate. We quantitatively studied the impact of CO concentration discharged from an underground commercial street on the outdoor microclimate under various underground commercial street development intensities, ventilation shaft arrangements, and ground-greening arrangements using ENVI-met CFD simulation software. In contrast to our previous studies [9,10], in this study, we mainly focus on the negative impact of underground space development on outdoor microclimate, which is an important supplement to the interdisciplinary research topic of underground space and urban microclimate. In addition, this study reveals the influence mechanism of underground space development on the urban microclimate and provides several suggestions for the design of underground commercial streets on the basis of the simulation results.

2. The Influence Mechanism of Underground Space Development on Urban Microclimate

The influence of urban underground space development on urban microclimate is essentially based on the theory of urban energy balance. In our previous research, we concluded that the main factors affecting the urban energy balance include three aspects: spatial form, underlying surface, and artificial heat rejection [11,13]. The development of urban underground space affects the urban microclimate by influencing the above three aspects.

2.1. Effects of Underground Space Development on Urban Spatial Form

The large-scale development of urban underground space addresses the limitations of urban above-ground and underground space by placing a large number of urban functions underground, forming a three-dimensional urban space form. Thus, developing underground space can reduce the development of urban above-ground space and change the combination of ground buildings to form novel urban spatial forms. Varying urban spatial forms can not only affect the absorption of solar radiation by structures and heat dissipation of long-wave radiation but also affect the urban wind environment, thereby affecting the urban microclimate.

2.2. Effects of Underground Space Development on Urban Underlying Surfaces

The development of urban underground space can transfer the functions of above-ground buildings with lower environmental requirements to underground space, and more ground area can be reserved for greening; therefore, the attributes of the urban underlying surface can be changed, which could have a positive impact on the urban microclimate. However, when landscape design is applied above underground buildings, the growth environment of plants differs from that of the natural environment. The selection of plant species and the matching of plants mainly depend on the OTUS.
In landscape design above underground buildings, the requirements of the OTUS ascend in the order of grasses, shrubs, and trees. The requirements for different types of plant growth on the OTUS are shown in Figure 1 [14]. The possible effects of different types of plants on the urban microclimate are shown in Table 1.

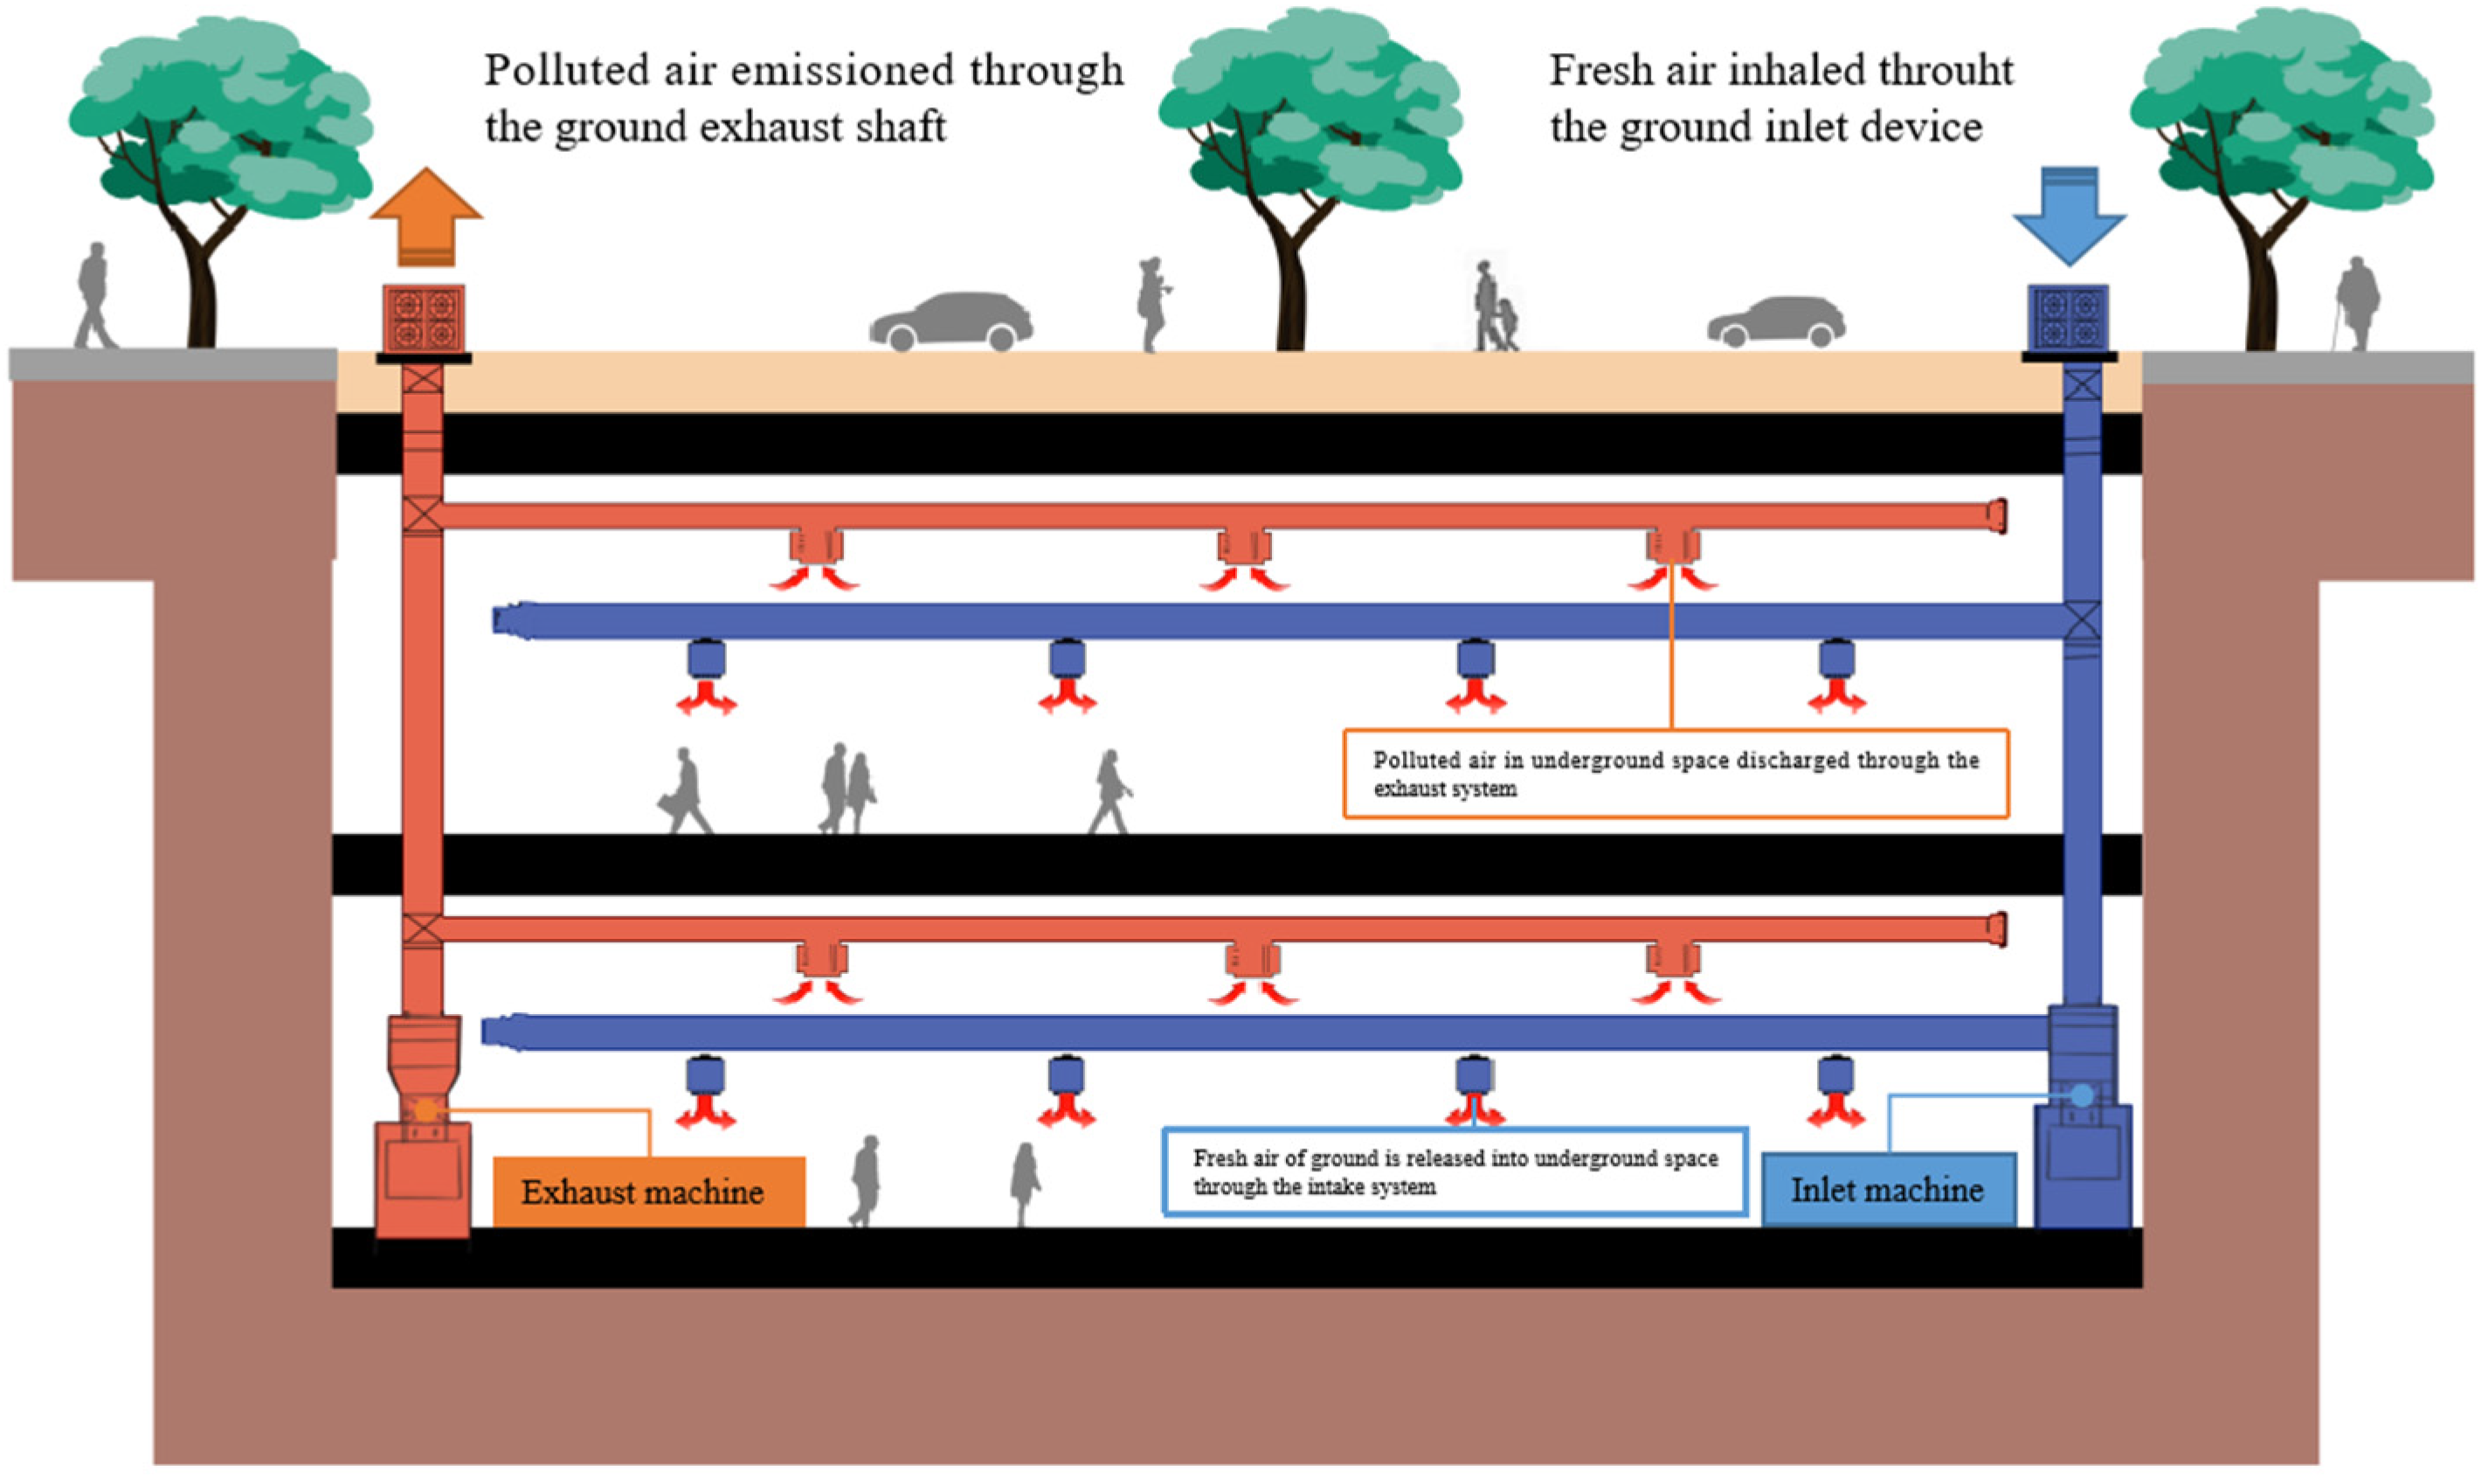
2.3. Effects on Internal Environmental Control of Urban Underground Space on Urban Microclimate

With the development of rail transit and underground commerce, people’s travel mode and lifestyle have been affected, and underground space has become an important place for urban residents to gather. In order to create an environment suitable for human survival and activities, the urban underground space environment needs to be controlled and improved by ventilation and air conditioning systems, which directly affect the city’s hot and humid environment and air quality indicators.
As shown in Figure 2, ventilation, air conditioning, and environmental control systems in underground spaces are mainly composed of fresh air systems and an exhaust air systems [11]. Exhaust air systems suck polluted air inside underground spaces into exhaust ducts and discharge the polluted air to the outside through ground exhaust shafts. In contrast, fresh air systems suck fresh air from outside into fresh air ducts and release it into underground spaces through air outlets. The combination of exhaust and fresh air systems constitute the internal ventilation systems of underground spaces.
The mechanism of influence of underground space development on urban microclimate is shown in Figure 3.

3. Research Scheme

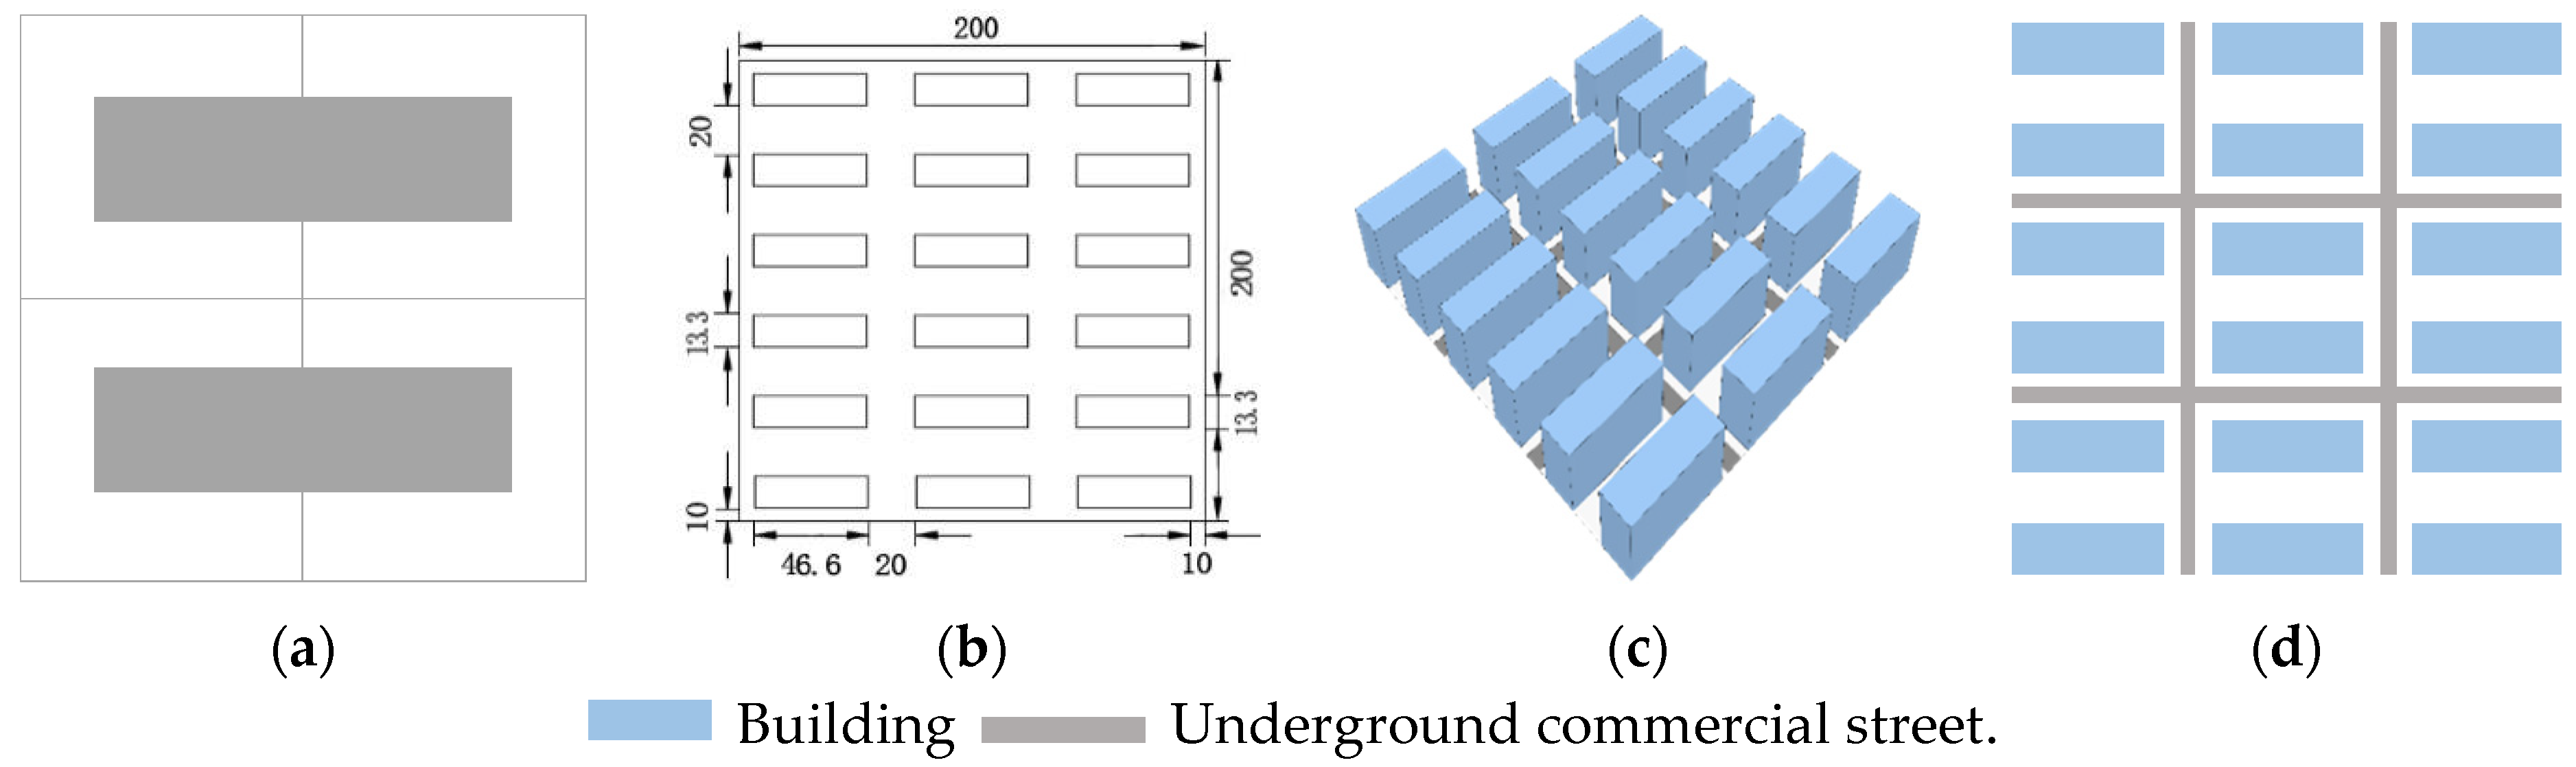
3.1. Basic Urban Form Unit

In this study, the typical determinant urban form model of urban morphology was used to analyze the influence of underground commercial street development on the out-door air quality. In the field of urban morphology, 200 m × 200 m is generally selected as the appropriate unit grid and fractal hierarchy of urban texture [15]. Therefore, in this re-search, a basic urban block scale of 200 m × 200 m was selected as a standard to establish an urban form model. The layout design of the model was based on the format of a squared figure, and it was assumed that the underground commercial streets were developed as four streets (Figure 4). Detailed model design parameters are shown in Table 2.

3.2. Case Setting

3.2.1. Evaluation Index and Evaluation Criterion

In the present study, the pollutants discharged through the exhaust shaft from an underground commercial street were selected as the research object. According to [16], the main gas pollutants in underground commercial streets are CO2 and CO. CO2 can be easily diluted outdoors and increase in its concentration with a limited impact on the health and safety of residents [17]. Accordingly, the CO concentration at a 1.5 m height was selected as an index to evaluate outdoor air quality in this study.
According to the “ambient air quality standard” (GB 3095-2012) [18], ambient air quality functions are divided into three categories with defined limits of CO concentration in different functional areas (Table 3). Class I areas refer to the natural reserves and other areas that require special protection with implemented grade I standards. Class II areas refer to residential, mixed commercial, and transportation areas with implemented grade II standards. Class III areas refer to specific industrial areas with implemented grade III standards. Urban underground commercial streets are class II functional areas, and grade II standards should be implemented, with an ambient CO concentration in the air not exceeding 10 mg/m3. Therefore, 10 mg/m3 was taken as the standard to evaluate the influence of shaft air exhaust from underground commercial streets on outdoor air quality. A CO concentration in excess of 10 mg/m3 indicates that the development of underground commercial streets causes air pollution in the outdoor urban environment. On the contrary, a CO concentration of less than 10 mg/m3 indicates that the impact of underground commercial street development on air quality is acceptable.
In this study, the spatial distribution of outdoor CO concentration was qualitatively analyzed under different scenarios. With 10 mg/m3 as the threshold value, we extracted data on the quantity (N) of CO concentrations exceeding 10 mg/m3 at each time point in different scenarios. Because the grid size in the horizontal direction is 2 m × 2 m and the area occupied by each grid is 4 m2, the pollution area exceeding 10 mg/m3 in different schemes can be calculated as 4 N m2.

3.2.2. Naming and Summary of Cases

In this study, we chose underground commercial street development intensity, the layout of exhaust shafts, and various ground-greening strategies above underground buildings as the research variables, as changes in outdoor pollutant concentrations are related to these variables. The development intensity of underground commercial streets is related to the calculation of the intensity of pollutant emissions. In this study, three cases of underground commercial street development were considered, all of which included a first floor, second floor, and third floor. The layout of exhaust shafts influences the outdoor diffusion of pollutants. Accordingly, we considered the influence of the location of exhaust outlets and the height of exhaust shafts on the diffusion of CO. We considered the location of exhaust outlets in two cases with concentrated or dispersed emissions, respectively. Regarding the height of exhaust shaft, it was divided into emissions from the zone near the ground and from the higher-altitude zone. The type of ground greening mainly depends on the OTUS. In this study, only single-plant configurations were considered for ground greening, with five types considered: transverse tree, vertical tree, large shrub, small shrub, and grass.
In the case study, the development area of each underground commercial street is 20 m × 200 m = 4000 m2. According to the Code for Fire Protection Design of Buildings [19] and the standard defining one fire protection unit for every 2000 m2 and requiring an exhaust system, two sets of exhaust systems (i.e., exhaust shafts) are required for the development of each underground commercial street. The outdoor air pollution caused by air from the shaft exhaust in underground commercial streets can be regarded as point-source pollution, whereas the area of the exhaust outlet can be used as an indicator of the size of the pollution source.
To analyze the influence of changes in the above factors on urban air quality, each model was numbered. The conventions related to naming and numbering are described in Table 4. For example, B-I1-H2-L1 denotes that in the determined urban form, in the first layer of underground commercial street, the height of the exhaust air shafts is 2 m, and the exhaust outlets are arranged in a centralized manner; B-I2-H2-L2-BS denotes that in the determined urban form, in the second layer of underground commercial street, the height of the exhaust air shafts is 2 m, the exhaust outlets are arranged in a dispersed manner, and ground greening is achieved with large shrubs. The floor plan of the case models is shown in Figure 5.

3.2.3. Simulation Settings

(1)
Simulation software
In this study, ENVI-met V4.0, a commonly used microclimate simulation software, was applied to simulate the influence of shaft exhaust in underground commercial streets on outdoor CO concentrations. In ENVI-met, it is possible to define the pollution source intensity, emission mode, pollutant category, weather conditions, greening conditions, etc., based on the user requirements. ENVI-met has been successfully applied to model outdoor pollutant diffusion, and its applicability was validated by field measurements in our previous study [9]. The mechanisms of ENVI-met with respect to dispersion and deposition of particulate matter are shown in Table 5. Detailed information about the software can be found in [20].
(2)
Source intensity setting
According to design standards [21,22,23,24,25], the limit of CO concentration in underground commercial streets is 5 mg/m3. Considering the most unfavorable conditions, 5 mg/m3 was set as the initial concentration of CO discharged from the underground commercial streets to the outside. It was assumed that the depth of each layer of the underground commercial street was 5.1 m, with the exhaust air volume of each exhaust shaft set to 2000 m2 × 5.1 m × 6 ACH = 61,200 m3/h on the first developed layer and a source intensity of E = 5 mg/m3 × 61,200 m3/h = 306,000 mg/h, i.e., 85,000 μg/s. In the scenario with two layers, the source intensity was E = 170,000 μg/s, whereas in the case with three layers, the source intensity was E = 255,000 μg/s.
(3)
Simulation parameters
In this study, meteorological data for a typical summer day in Nanjing was selected for simulation input, with the focus on business hours, i.e., from 10:00 AM to 10:00 PM. The outdoor CO concentration was analyzed throughout a 24 h period. The specific simulation parameters are shown in Table 6.

4. Analysis and Discussion

We analyzed the influence of the development intensity of the underground commercial streets, the height of exhaust shafts, and the location of exhaust shafts on outdoor urban air quality. Then, we considered and analyzed the influence of ground greening over various underground spaces on outdoor urban air quality. The cases selected for detailed analysis and their basic information are presented in Table 7. Furthermore, the selected models are shown in Figure 6. The analysis methods and concepts of other cases are similar to those selected for detailed analysis.

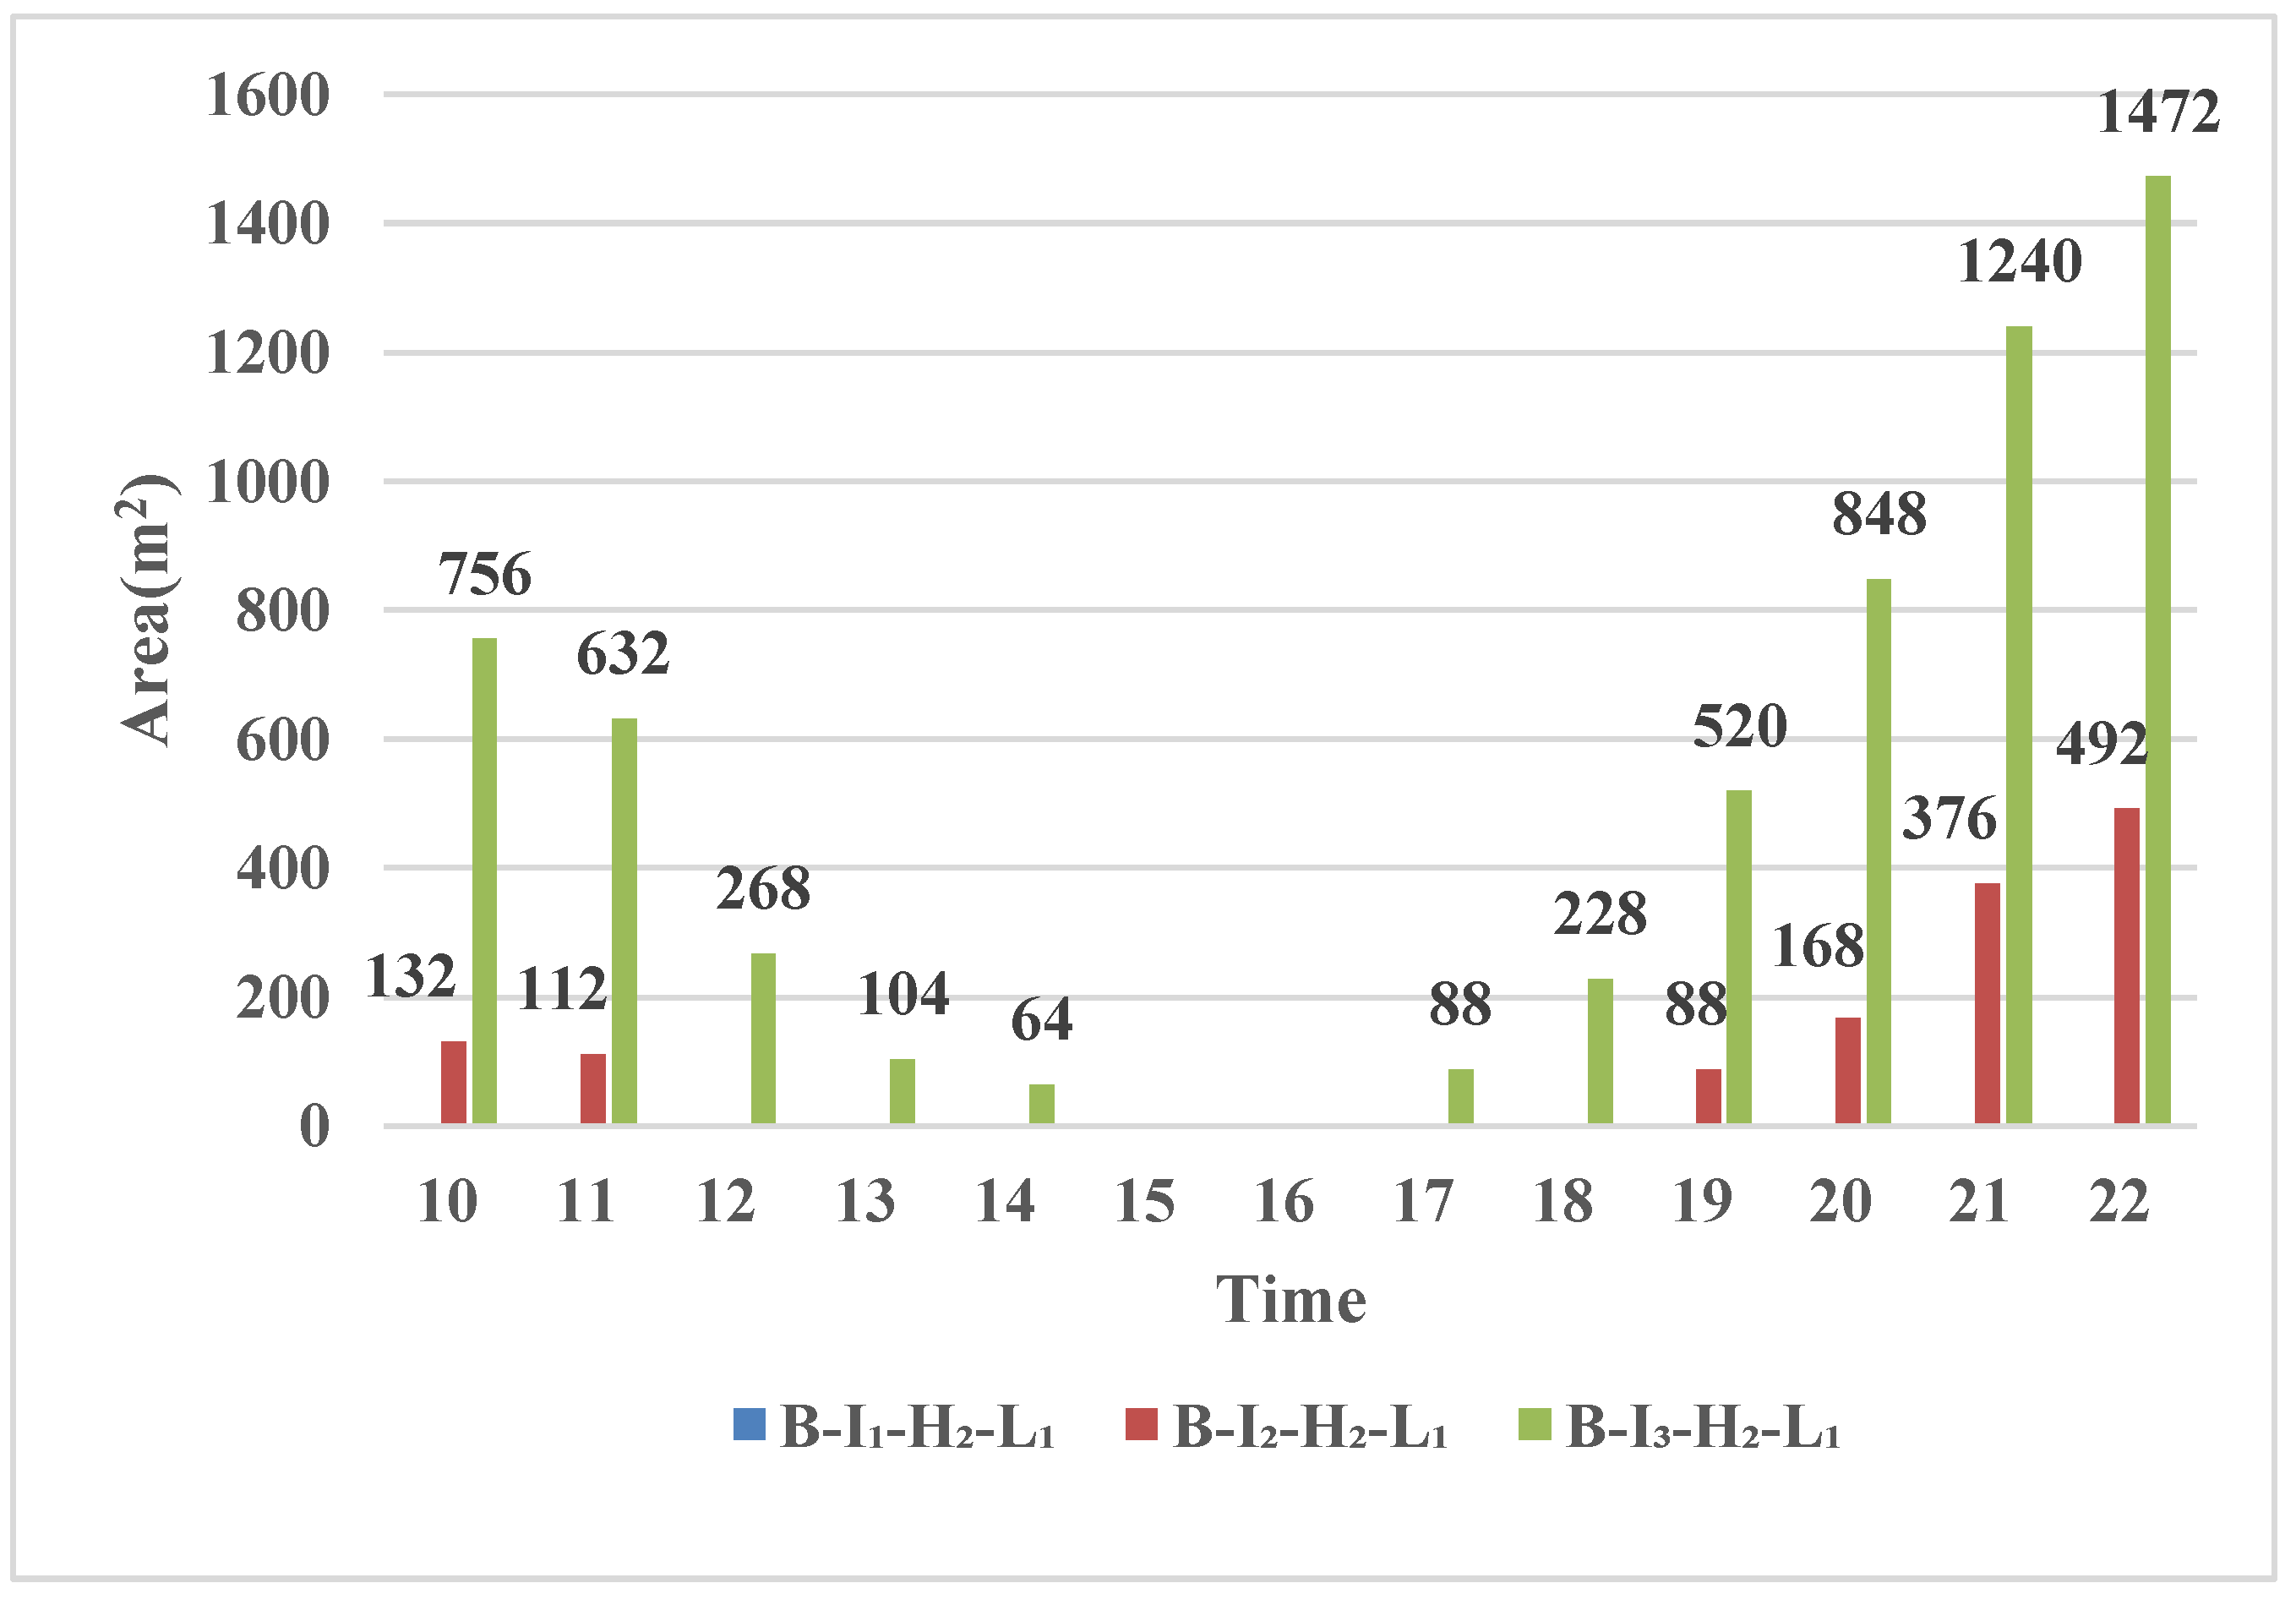
4.1. Influence of Development Intensity on Air Quality

Figure 7 shows the influence of different development intensities of underground commercial streets with a shaft exhaust height of 2 m and a centralized emission system on the outdoor CO concentration at a height of 1.5 m above the ground at 12:00 noon. The results indicate that the outdoor CO concentration is always less than 10 mg/m3 with one layer of underground commercial streets, which indicates that the influence of CO emissions from exhaust shafts on the outdoor air quality is acceptable. However, the outdoor CO concentration increases with an increase in development intensity. With three layers of underground streets, the outdoor CO concentration exceeds the allowable concentration limit of 10 mg/m3 in most areas. This situation indicates that an increase in development intensity of underground commercial streets and an increase in pollution source intensity can cause severe air pollution.
With 10 mg/m3 taken as the threshold value, the outdoor CO concentration above the threshold was analyzed at 1.5 m above the ground under different development intensities (Figure 8). As a result of changes in meteorological conditions, the regional variation in outdoor CO concentration exceeding 10 mg/m3 shows an initial decreasing trend, followed by an increase. With one layer of underground development, the outdoor CO concentration is less than 10 mg/m3 at various time periods. With two layers of underground development, the area in which the CO concentration exceeds 10 mg/m3 increases to as much as 1368 m2. With three layers of underground development, this value can reach 6220 m2, indicating that the outdoor CO concentration and the development intensity of underground commercial streets are positively correlated.

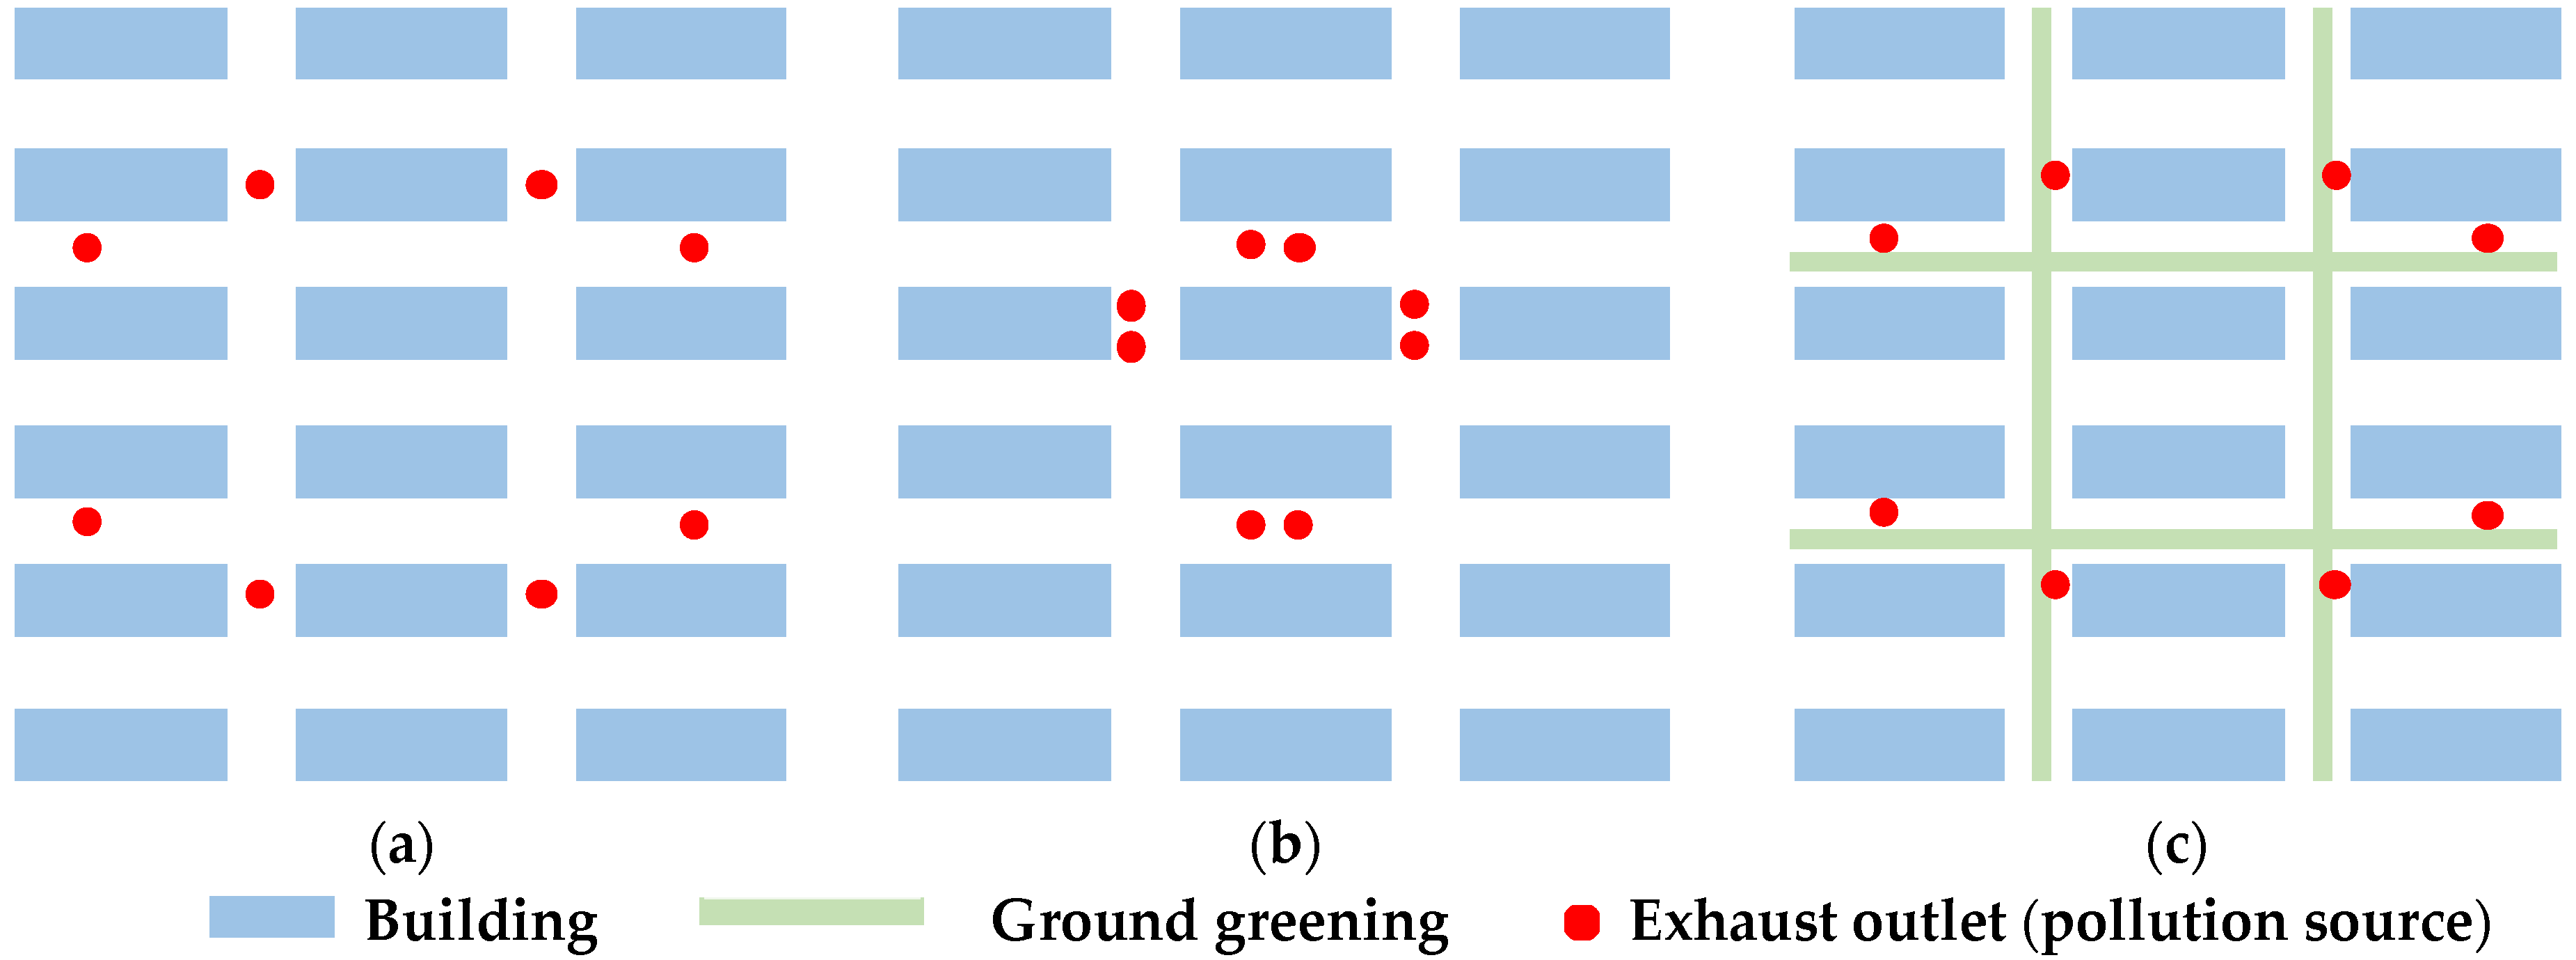
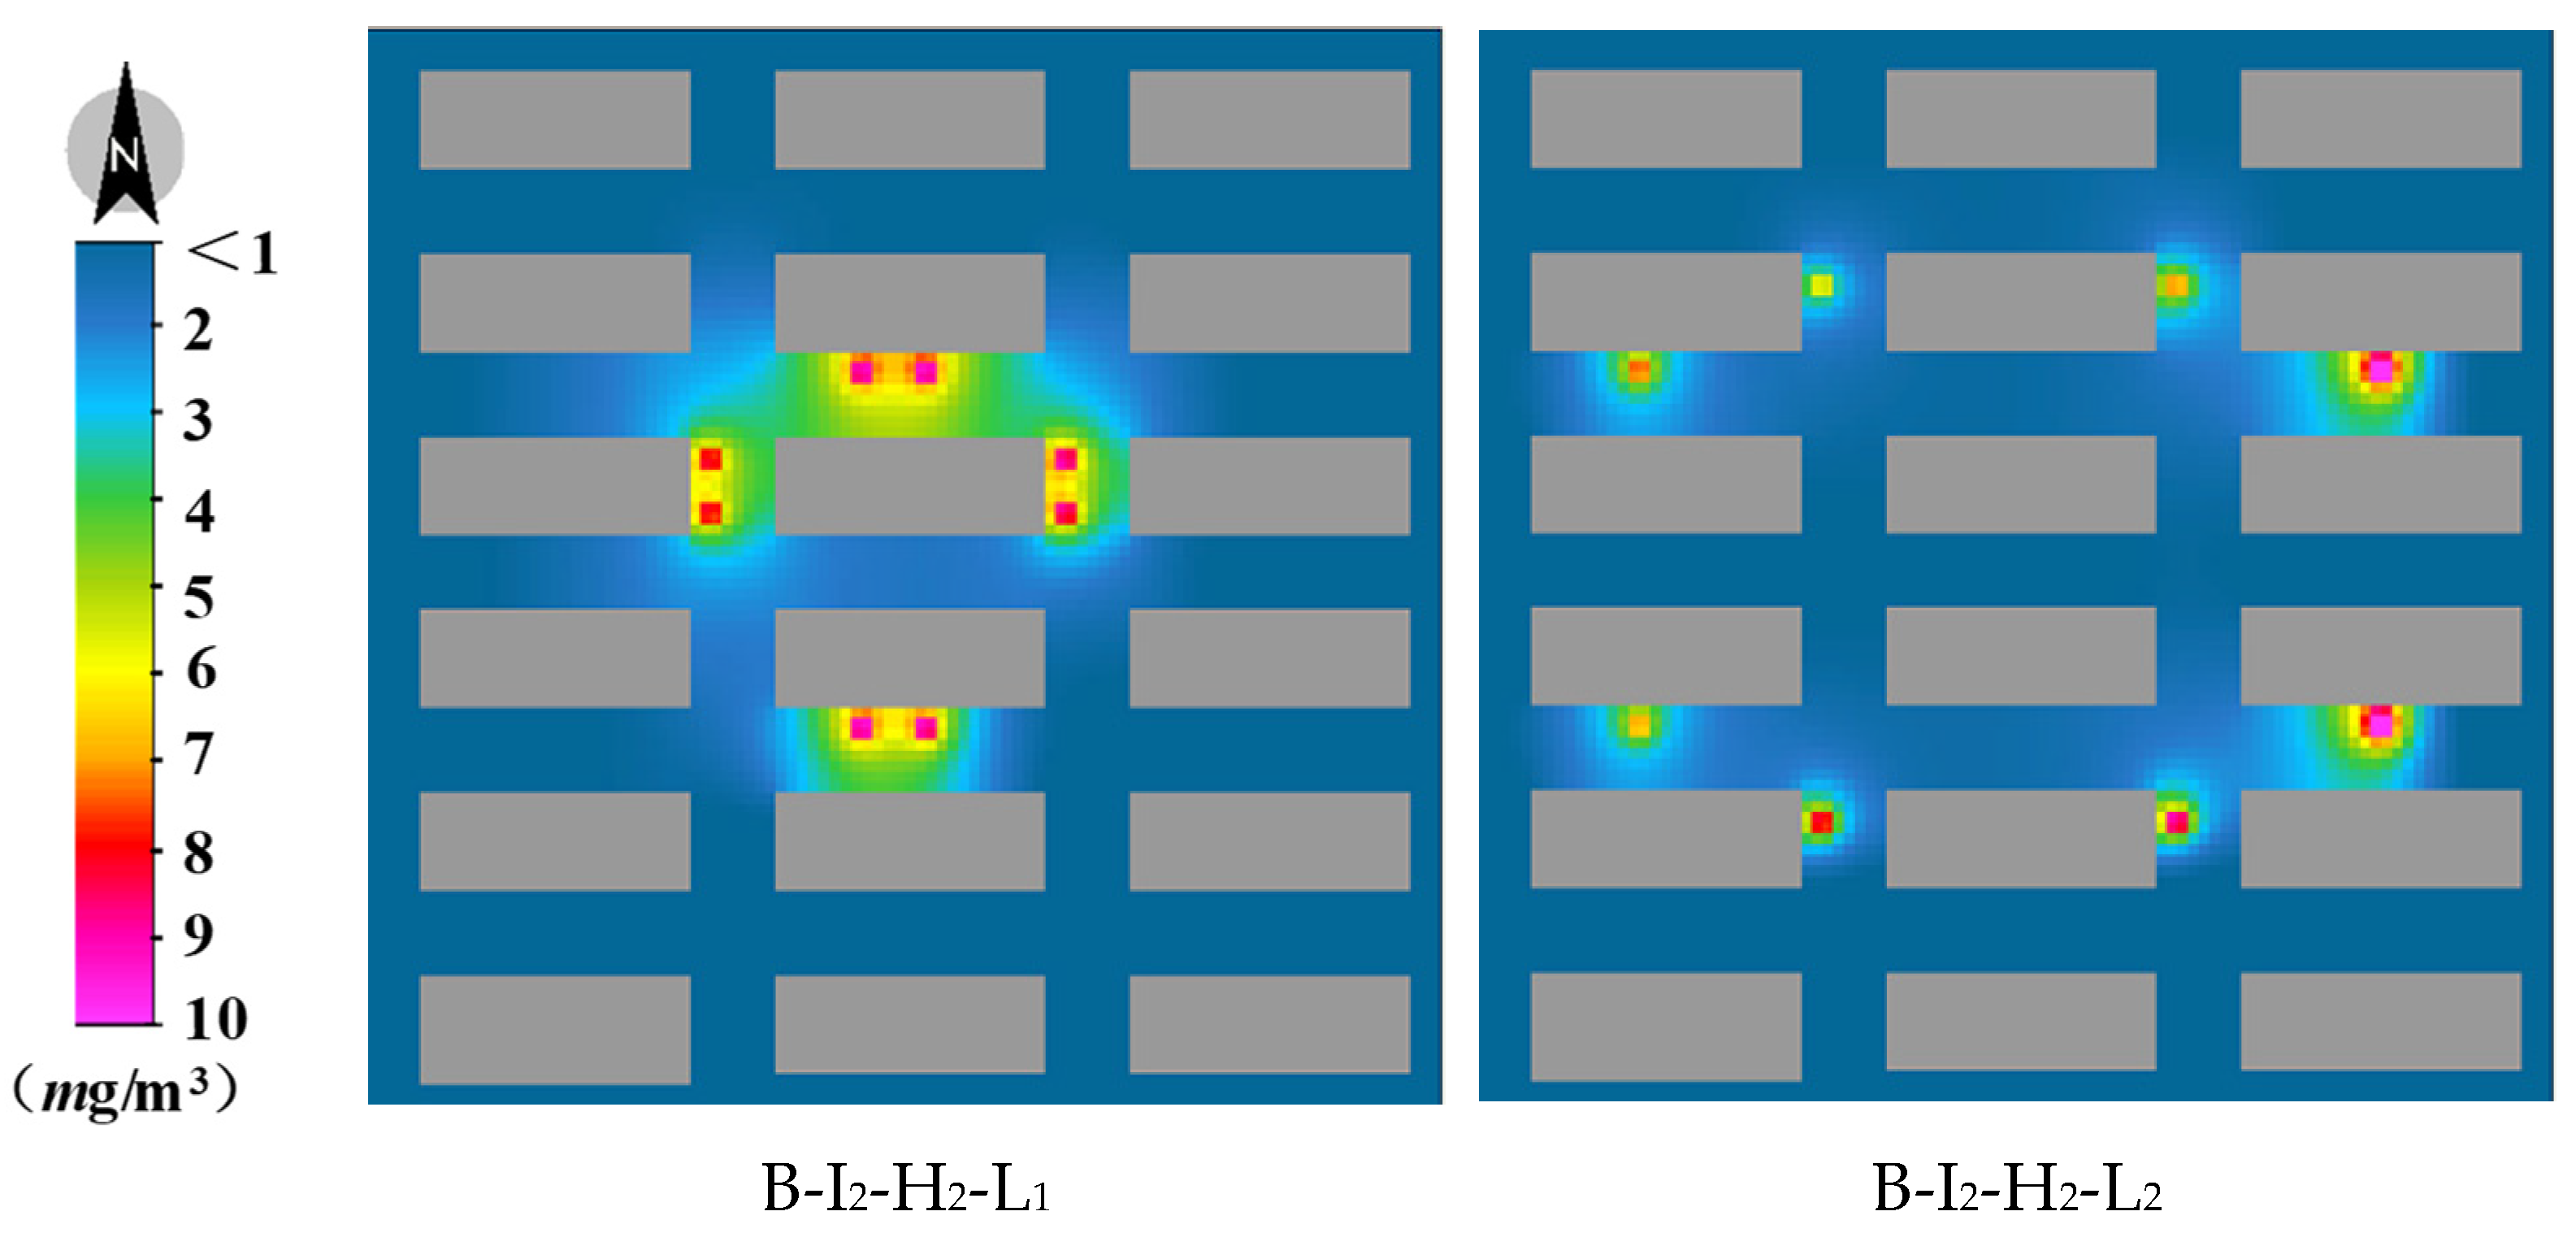
4.2. Influence of Shaft Location on Air Quality

Figure 9 shows the outdoor CO concentration with two layers of underground development with a 2 m shaft exhaust height and both centralized and dispersed emission scenarios. The outdoor CO concentration is close to or exceeds the 10 mg/m3 threshold near some of the exhaust outlets under both emission scenarios. On the contrary, when the exhaust shafts are arranged in a dispersed manner, then the CO concentration is lower than with a centralized arrangement.
With 10 mg/m3 taken as the threshold, the influence range of outdoor CO concentra-tion exceeding 10 mg/m3 with varying shaft locations was analyzed, and results are presented in Figure 10. The area in which the outdoor CO concentration exceeds 10 mg/m3 is similar under both exhaust scenario, with an initial decreasing trend, followed by an increase.
The area of outdoor CO concentration exceeding 10 mg/m3 is slightly smaller in the dispersed exhaust scenario, indicating that in the determinant urban form, a dispersed arrangement of exhaust shafts is preferrable with respect to reducing the outdoor CO concentration.

4.3. Influence of Shaft Height on Air Quality

Figure 11 shows the influence of different shaft heights on the outdoor CO concentration with two layers of underground development and with a dispersed exhaust shaft arrangement. In general, when the shaft height increases from 2 m to 5 m and to 8 m, the outdoor CO concentration decreases, indicating that an increase of the height of the exhaust shafts is conducive to reducing the CO concentration at the pedestrian level.
Figure 12 shows that with a shaft height of 2 m, the area with an outdoor CO concentration exceeding 10 mg/m3 reaches 1032 m2. With a shaft height of 5 m, the area of outdoor CO concentration exceeding 10 mg/m3 is only 120 m2, whereas with a shaft height of 8 m, the outdoor CO concentration is less than 10 mg/m3 at all times. This indicates that the taller the exhaust shaft, the smaller the area where the outdoor CO concentration exceeds 10 mg/m3. Accordingly, appropriately increasing the height of exhaust shafts is conducive to improving the outdoor air quality.

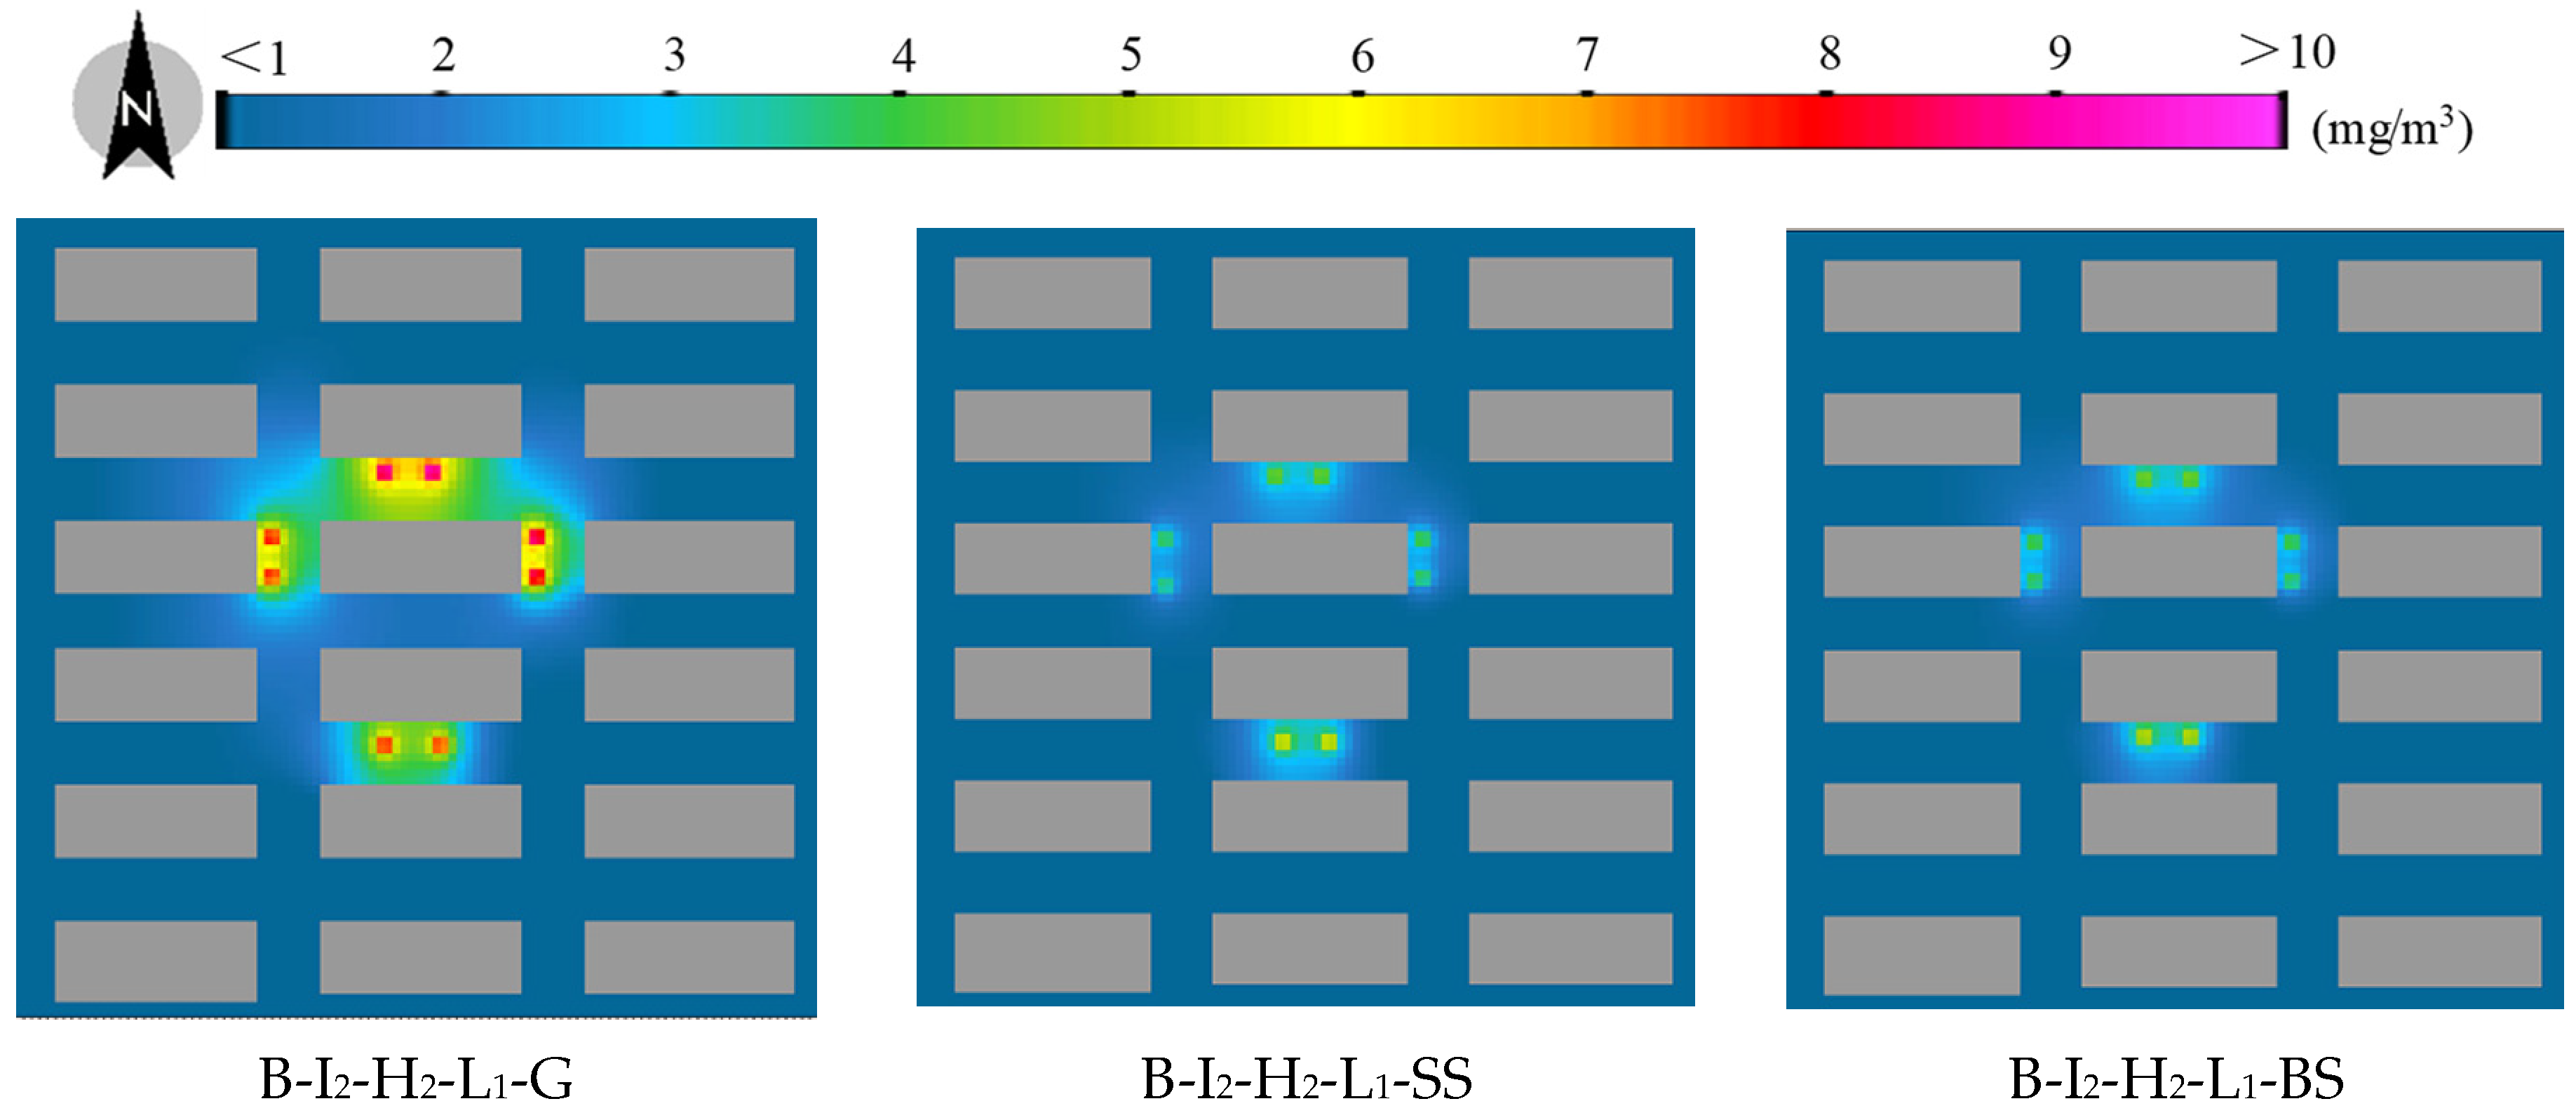
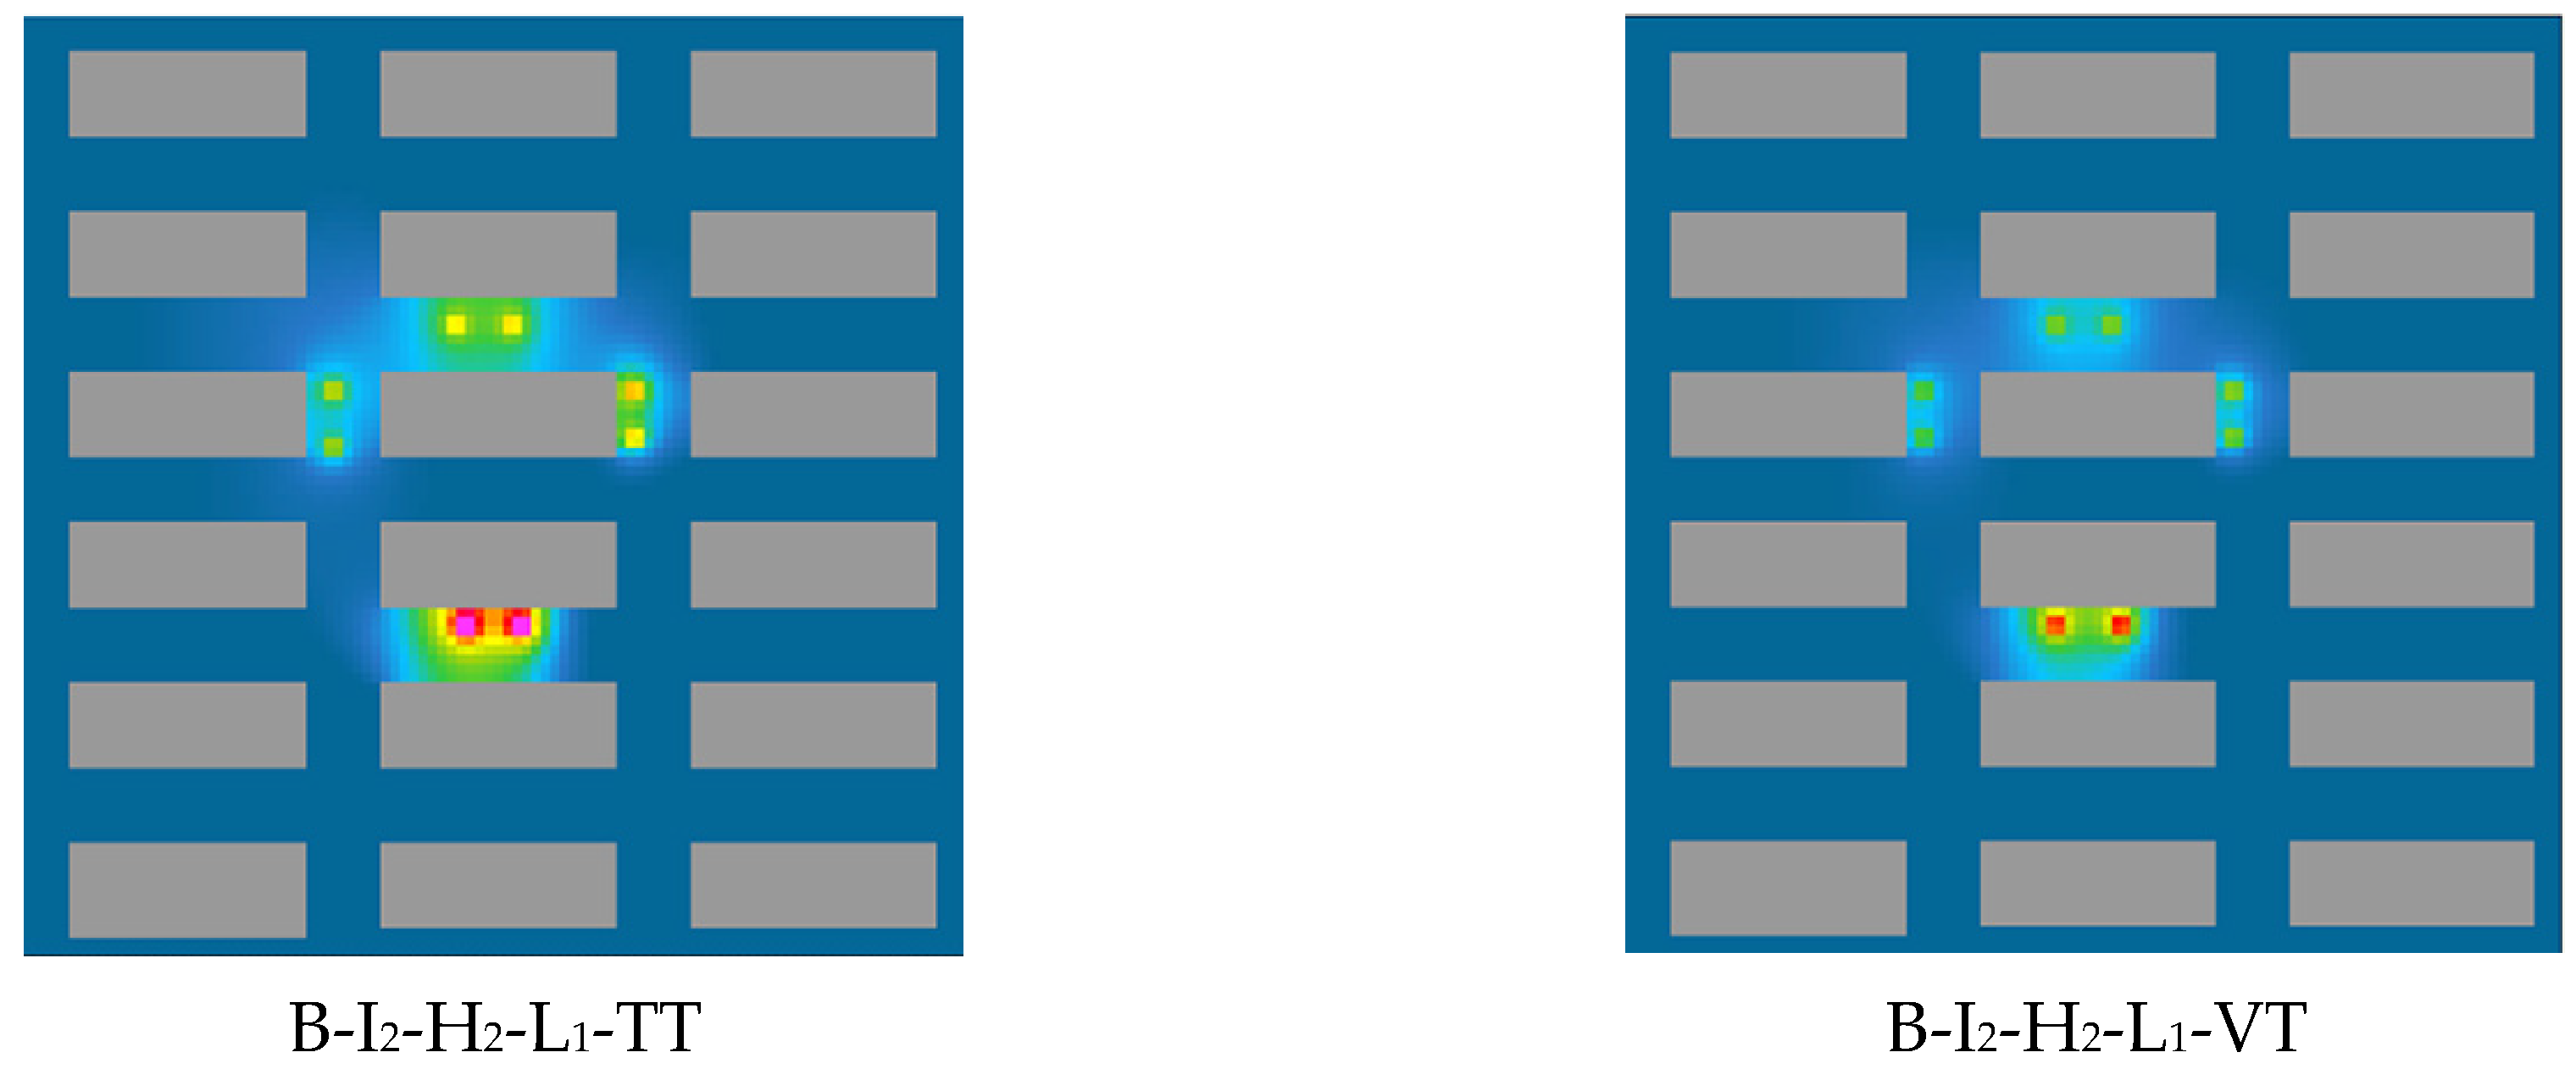
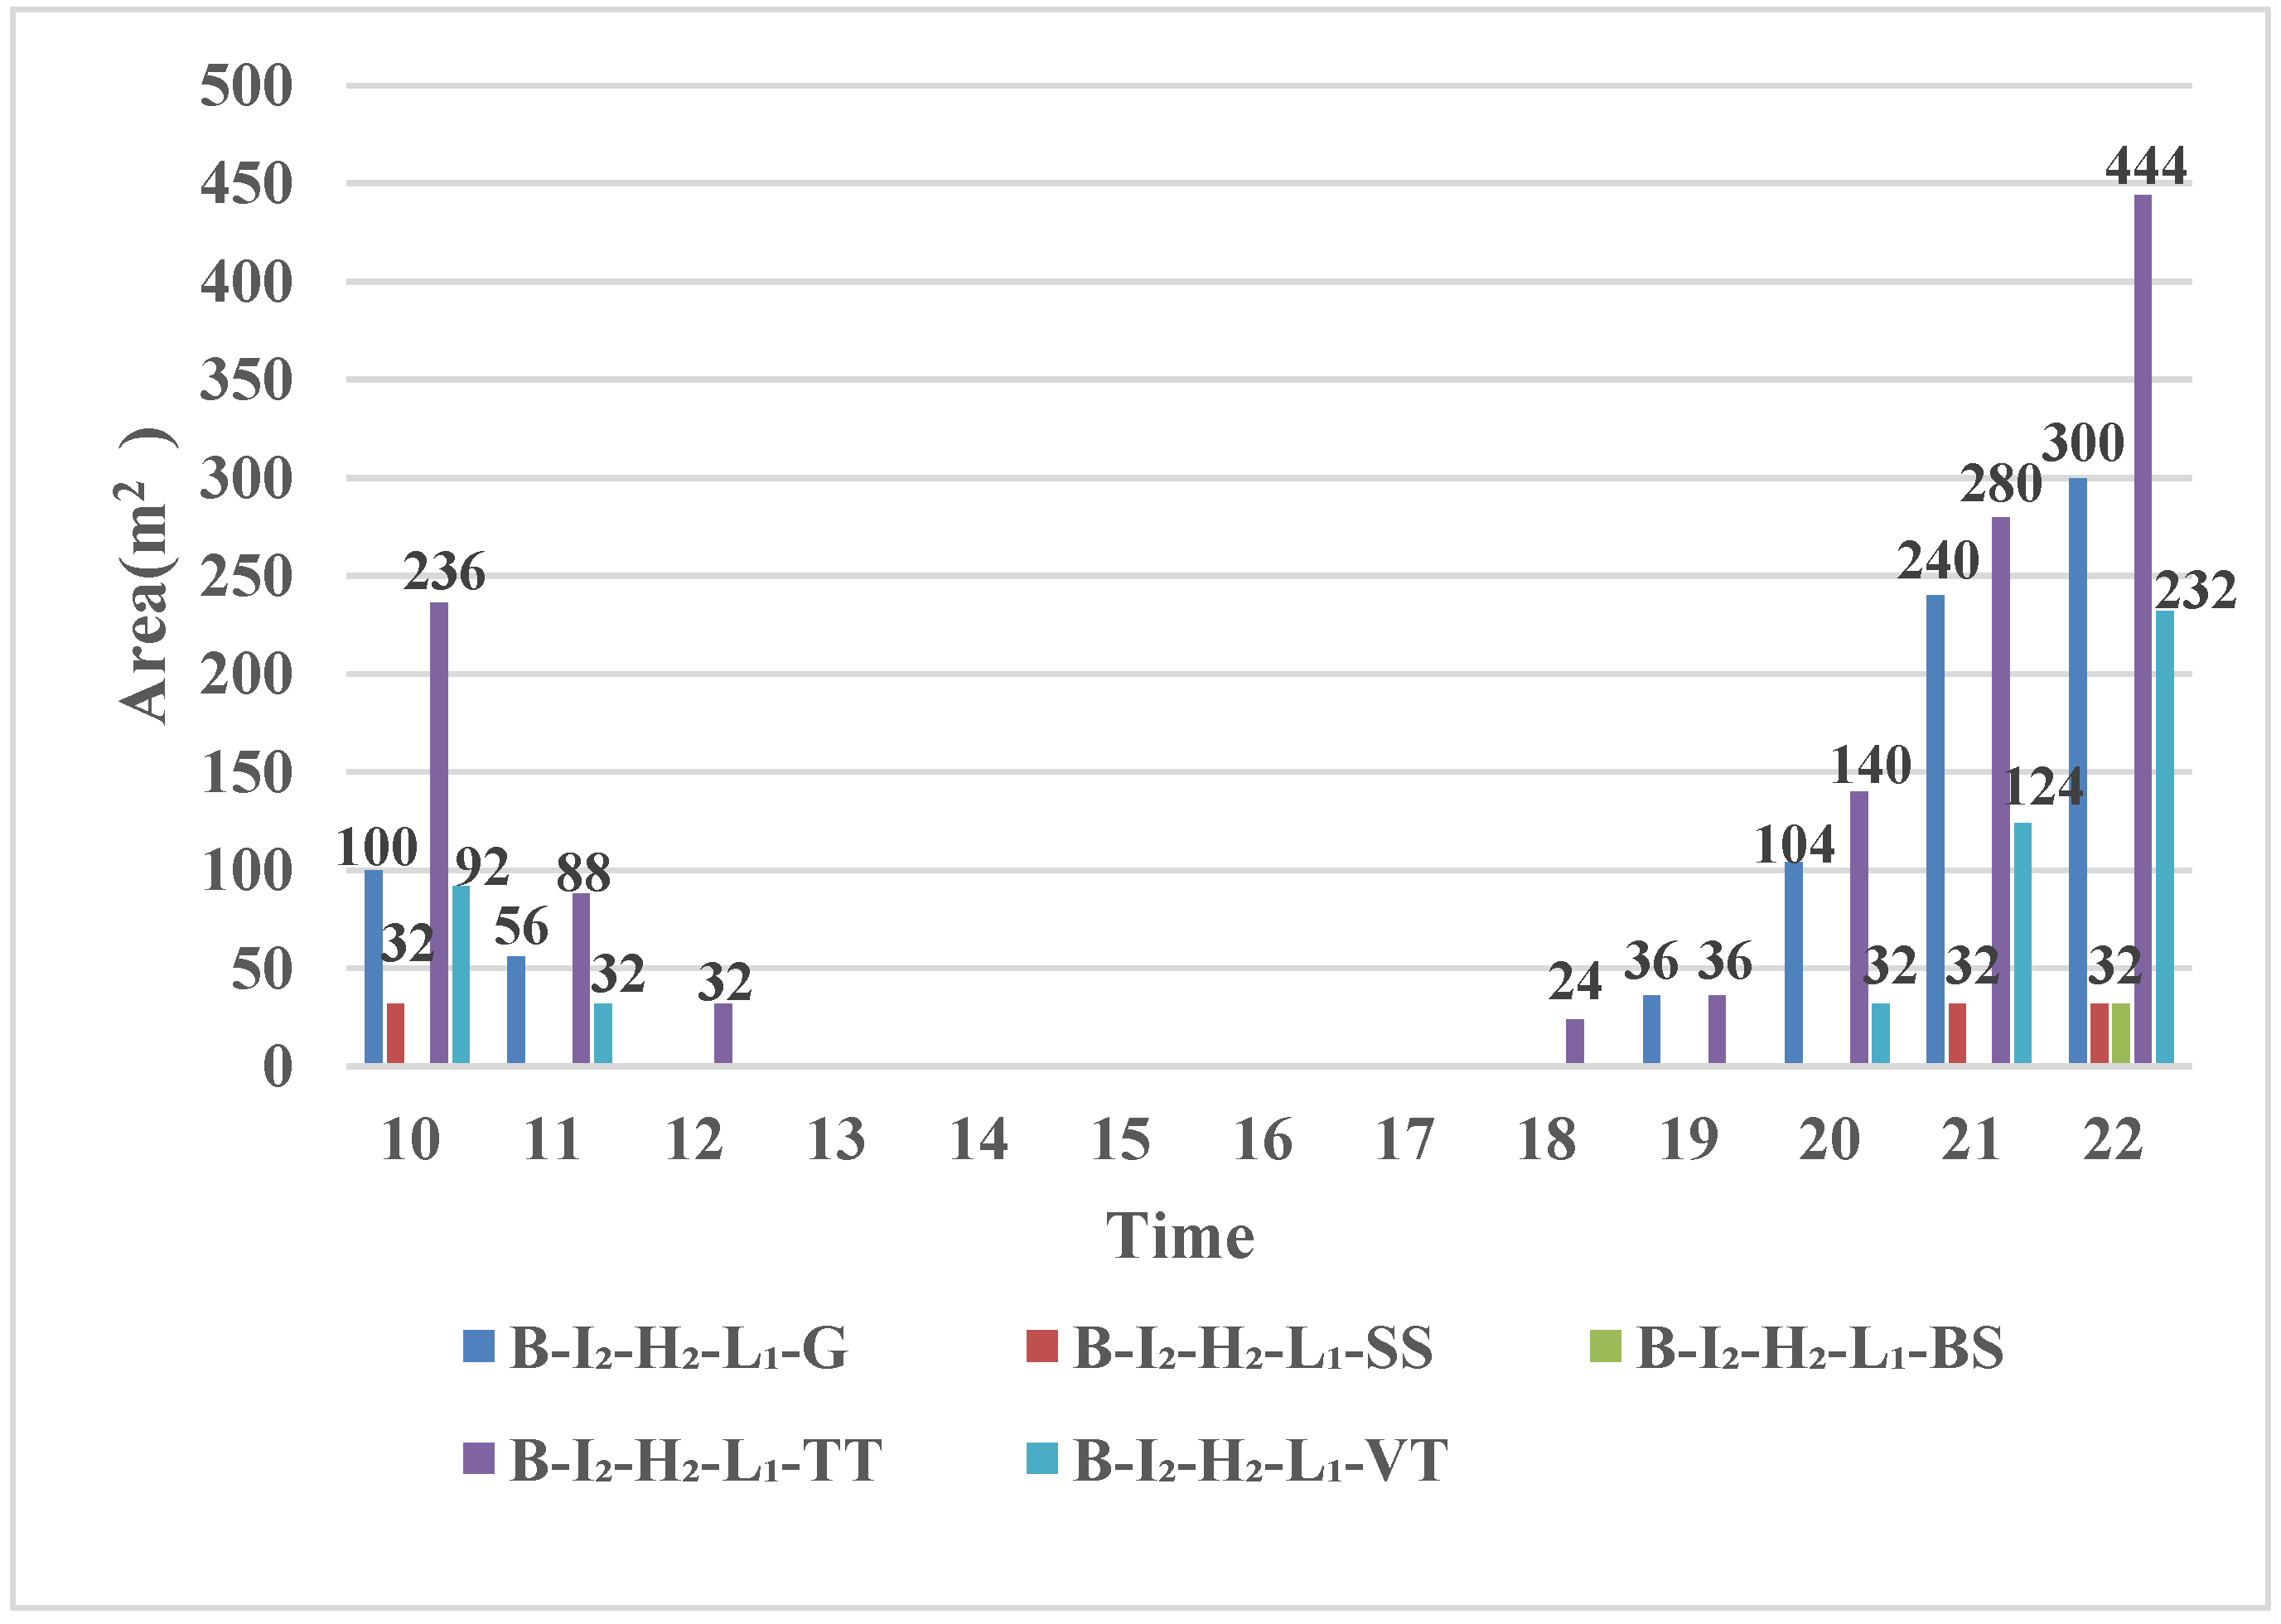
4.4. Influence of Ground Greening on Air Quality

Figure 13 shows the influence of ground greening on outdoor CO concentration with varying soil depths, two layers of underground development, a shaft exhaust height of 2 m, and a centralized emission arrangement. The outdoor CO concentration varies depending on the greening type. When grass, transverse trees, or vertical trees are used, relatively high CO concentration values close to or even exceeding 10 mg/m3 are obtained. When small shrubs or big shrubs are used, the outdoor CO concentration is significantly reduced, with similar values for the two scenarios. This indicates that the outdoor CO concentration can be effectively reduced by implementing ground greening with small or big shrubs.
The influence range of outdoor CO concentration exceeding 10 mg/m3 under different ground greening conditions is analyzed and shown in Figure 14. When transverse trees or vertical trees are applied, the obstruction of airflow due to tree canopies can decrease the diffusion of CO, resulting in an increased CO concentration. Under configurations with transverse trees and vertical trees, the area where outdoor CO concentration exceeds 10 mg/m3 reaches 1280 m2 and 512 m2, respectively. When grass is used for ground greening, the area with an outdoor CO concentration exceeding 10 mg/m3 reaches 836 m2. Finally, when small shrubs and big shrubs are applied, the area with an outdoor CO concentration exceeding 10 mg/m3 is substantially decreased to 96 m2 and 32 m2, respectively. In terms of the determinant urban form, the effects of different types of greening on outdoor CO concentration can be ranked from highest to lowest as follows: big shrub > small shrub > vertical tree > grass > transverse tree.

5. Conclusions

In order study the negative impact of underground space development on outdoor microclimate, we analyzed the development of underground commercial streets under determinant urban form and the associated outdoor concentration of discharged CO. Furthermore, we evaluated the influence of development intensity of underground commercial streets, the location and height of exhaust shafts, and ground greening on outdoor CO concentration.
(1)
The development intensity of underground commercial streets and outdoor CO concentration are positively correlated, whereas the height of exhaust shaft and the outdoor CO concentration are negatively correlated. Accordingly, the higher the development intensity, the higher the outdoor CO concentration and the larger the influence range. Furthermore, the higher the exhaust shaft height, the lower the outdoor CO concentration and the smaller the influence range.
(2)
A dispersed arrangement of exhaust shafts is more conducive to reducing the outdoor CO concentration when compared to a centralized arrangement. Therefore, to reduce the outdoor CO concentration, it is appropriate to select a dispersed arrangement for exhaust shafts.
(3)
Planted trees in the outdoor area of an underground commercial street development are not conducive to reducing the outdoor CO concentration. However, when big shrubs are planted, the area with an outdoor CO concentration exceeding 10 mg/m3 is the smallest. Accordingly, it is appropriate to plant big shrubs in the outdoor area of underground commercial street developments with the aim of reducing the outdoor CO concentration.

6. Limitations and Future Directions

This study is subject some limitations. First, we only included summertime environmental parameters in our numerical simulation and did not consider other seasonal climatic factors; therefore, our conclusions may not be easily generalized. Secondly, according to the relevant design criteria, we chose 5 mg/m3 as the initial concentration of CO discharged from the underground commercial streets to the outside, which is theoretically feasible. However, the CO concentration discharged from underground commercial streets varies constantly in reality. Finally, we only discussed the impact of CO concentration discharged from underground commercial streets on the outdoor microclimate and did not consider the impact of other discharged pollutants, such as PM10, CO2, NO, etc. Future studies should address the above limitations and focus on the positive and negative effects of different types of underground space development projects on the outdoor microclimate so as to optimize development strategies.

Author Contributions

X.C., X.Z., Q.H. and X.S. conceived and designed the study. X.C. and X.S. performed the numerical simulations analyzed the results. X.C. and X.Z. wrote the paper. Q.H. and X.S. reviewed and edited the manuscript. All authors have read and agreed to the published version of the manuscript.

Funding

This research was funded by the National Natural Science Foundation of China, grant number 51878660 and the Natural Science Foundation of Jiangsu Province, China, grant number BK20191330. The APC was funded by the National Natural Science Foundation of China (Grant No. 51878660) and the Natural Science Foundation of Jiangsu Province, China (Grant No. BK20191330).

Institutional Review Board Statement

Not applicable.

Informed Consent Statement

Not applicable.

Data Availability Statement

The details of our data are presented in the full text. In addition, we have no links to publicly available datasets.

Acknowledgments

The authors extend their appreciation to the support of the Underground Space Research Center, Army engineering university of PLA, Jiangsu Province, China.

Conflicts of Interest

The authors declare no conflict of interest.

References

  1. Qin, H.; Hong, B.; Huang, B.; Cui, X.; Zhang, T. How dynamic growth of avenue trees affects particulate matter dispersion: CFD simulations in street canyons. Sustain. Cities Soc. 2020, 61, 102331. [Google Scholar] [CrossRef]
  2. Tian, Y.; Hong, B.; Zhang, Z.; Wu, S.; Yuan, T. Factors influencing resident and tourist outdoor thermal comfort: A comparative study in China’s cold region. Sci. Total Environ. 2022, 808, 152079. [Google Scholar] [CrossRef] [PubMed]
  3. Hong, B.; Lin, B.R. Numerical studies of the outdoor wind environment and thermal comfort at pedestrian level in housing blocks with different building layout patterns and trees arrangement. Renew. Energy 2015, 73, 18–27. [Google Scholar] [CrossRef]
  4. Yang, F.; Lau, S.S.Y.; Qian, F. Thermal comfort effects of urban design strategies in high-rise urban environments in a sub-tropical climate. Archit. Sci. Rev. 2011, 54, 285–304. [Google Scholar] [CrossRef]
  5. Sugawara, H.; Shimizu, S.; Takahashi, H.; Hagiwara, S.; Narita, K.; Mikami, T.; Hirano, T. Thermal influence of a large green space on a hot urban environment. J. Environ. Qual. 2016, 45, 125–133. [Google Scholar] [CrossRef] [PubMed]
  6. Ng, E.; Chen, L.; Wang, Y.N.; Yuan, C. A study on the cooling effects of greening in a high-density city: An experience from Hong Kong. Build. Environ. 2012, 47, 256–271. [Google Scholar] [CrossRef]
  7. Zhang, T.; Hong, B.; Su, X.; Li, Y.; Song, L. Effects of tree seasonal characteristics on thermal-visual perception and thermal comfort. Build. Environ. 2022, 212, 108793. [Google Scholar] [CrossRef]
  8. Nguyen, T.; Yu, X.; Zhang, Z.; Liu, M.; Liu, X. Relationship between types of urban forest and PM2.5 capture at three growth stages of leaves. J. Environ. Sci. 2015, 27, 33–41. [Google Scholar] [CrossRef] [PubMed]
  9. Su, X.; Cai, H.; Chen, Z.; Feng, Q.; Su, X.; Cai, H.; Chen, Z.; Feng, Q. Influence of the Ground Greening Configuration on the Outdoor Thermal Environment in Residential Areas under Different Underground Space Overburden Thicknesses. Sustainability 2017, 9, 1656. [Google Scholar] [CrossRef]
  10. Su, X.; Chen, Z.; Zhao, X.; Yang, X.; Feng, Q.; Tang, H. Optimization Design of Underground Space Overburden Thickness in a Residential Area Concerning Outdoor Thermal Environment Evaluation. Sustainability 2018, 10, 3205. [Google Scholar] [CrossRef]
  11. Yang, X.; Zhao, Z.; Hua, R.; Su, X.; Ma, L.; Chen, Z. Simulation study on the influence of urban underground parking development on underlying surface and urban local thermal environment. Tunn. Undergr. Space Technol. 2019, 89, 133–150. [Google Scholar] [CrossRef]
  12. Broere, W. Urban underground space: Solving the problems of today’s cities. Tunn. Undergr. Space Technol. 2016, 55, 245–248. [Google Scholar] [CrossRef]
  13. Yang, X.B.; Chen, Z.L.; Cai, H.; Ma, L.J. A framework for assessment of the influence of China’s urban underground space developments on the urban microclimate. Sustainability 2014, 6, 8536–8566. [Google Scholar] [CrossRef]
  14. China National Building Waterproof Association. JGJ 155-2013 Technical Specification for Planted Roof; China Architecture & Building Press: Beijing, China, 2013. (In Chinese) [Google Scholar]
  15. Salat, S. Cities and Forms: On Sustainable Urbanism; Yang, L.; Yan, Z., Translators; China Architecture and Construction Press: Beijing, China, 2012. [Google Scholar]
  16. Han, Z.W.; Wang, J.; Shao, X.L.; Zhou, S.L.; Han, X.; Shi, X.W. Characteristics of air pollution in typical urban underground spaces and their purification strategies. HVAC 2009, 39, 21–30. (In Chinese) [Google Scholar]
  17. Chen, J.J.; Zhang, J.; Zhu, F.F. Analysis of underground air exhaust shaft impact on surface air quality and layout optimization. In Proceedings of the National Annual Conference of HVAC Refrigeration, Hangzhou, China, 8–12 November 2010. (In Chinese). [Google Scholar]
  18. Wang, Z.S.; Wu, T.; Che, F.; Wang, S.; Zhou, Y.H.; Qian, X.P.; Wu, X.F. Comparison of ambient air quality standards between China and foreign countries. Environ. Sci. Res. 2010, 23, 253–260. (In Chinese) [Google Scholar]
  19. Shen, W. Interpretation of the new edition of “Code for Fire Protection of Building Design” GB50016-2014. Eng. Constr. Stand. 2015, 1, 54–59. (In Chinese) [Google Scholar]
  20. Bruse, M.; Fleer, H. Simulating surface-plant-air interactions inside urban environments with a three dimensional numerical model. Environ. Model. Softw. 1998, 13, 373–384. [Google Scholar] [CrossRef]
  21. State Civil Air Defense Office, The People’s Republic of China. Gb/t 17216-1998 Environmental Health Standard for Civil Air Defense Works at Ordinary Times; China Standards Press: Beijing, China, 1998. (In Chinese) [Google Scholar]
  22. State Bureau of Technical Supervision. Gb9670-1996 Hygienic Standard for Shopping Malls (Stores) and Bookstores; China Standards Press: Beijing, China, 1996. (In Chinese) [Google Scholar]
  23. State Bureau of Technical Supervision. Gb9672-1996 Hygienic Standard for Public Transport Waiting Rooms; China Standards Press: Beijing, China, 1996. (In Chinese) [Google Scholar]
  24. Ministry of Health of the People’s Republic of China. GBZ 2-2002 Occupational Exposure Limits for Hazardous Factors in the Workplace; Law Press: Beijing, China, 1996. (In Chinese) [Google Scholar]
  25. General Administration of Quality Supervision, Inspection and Quarantine; Ministry of Health; State Environmental Protection Administration. Gb/t 1883-2002 Indoor Air Quality Standard; China Standards Press: Beijing, China, 2002. (In Chinese) [Google Scholar]
Figure 1. Overburden thickness of underground space required for the growth of different plants.
Sustainability 14 09836 g001
Figure 2. Schematic diagram of an air conditioning and exhaust system in an underground space.
Sustainability 14 09836 g002
Figure 3. Schematic diagram of the mechanism of underground space development affecting urban microclimate.
Sustainability 14 09836 g003
Figure 4. Development of underground commercial streets in determinant urban form: (a) determinant urban form, (b) model size, (c) three-dimensional model, and (d) floor plan of an underground commercial street development in determinant urban form.
Sustainability 14 09836 g004
Figure 5. Case models floor plan: (a,b) dispersed arrangement and centralized arrangement of exhaust shafts, respectively. The development intensity can be 1~3 layers, and the height of the shafts can be 2 m, 5 m, or 8 m. (c) Dispersed arrangement of shaft exhaust with ground greening. Ground greening can be achieved with transverse trees, vertical trees, large shrubs, small shrubs, or lawns, and the development intensity can be 1~3 layers, with a shaft height of 2 m, 5 m, or 8 m.
Sustainability 14 09836 g005
Figure 6. Diagrams of selected case models: Sustainability 14 09836 i001 building; Sustainability 14 09836 i002 underground commercial street; Sustainability 14 09836 i003 
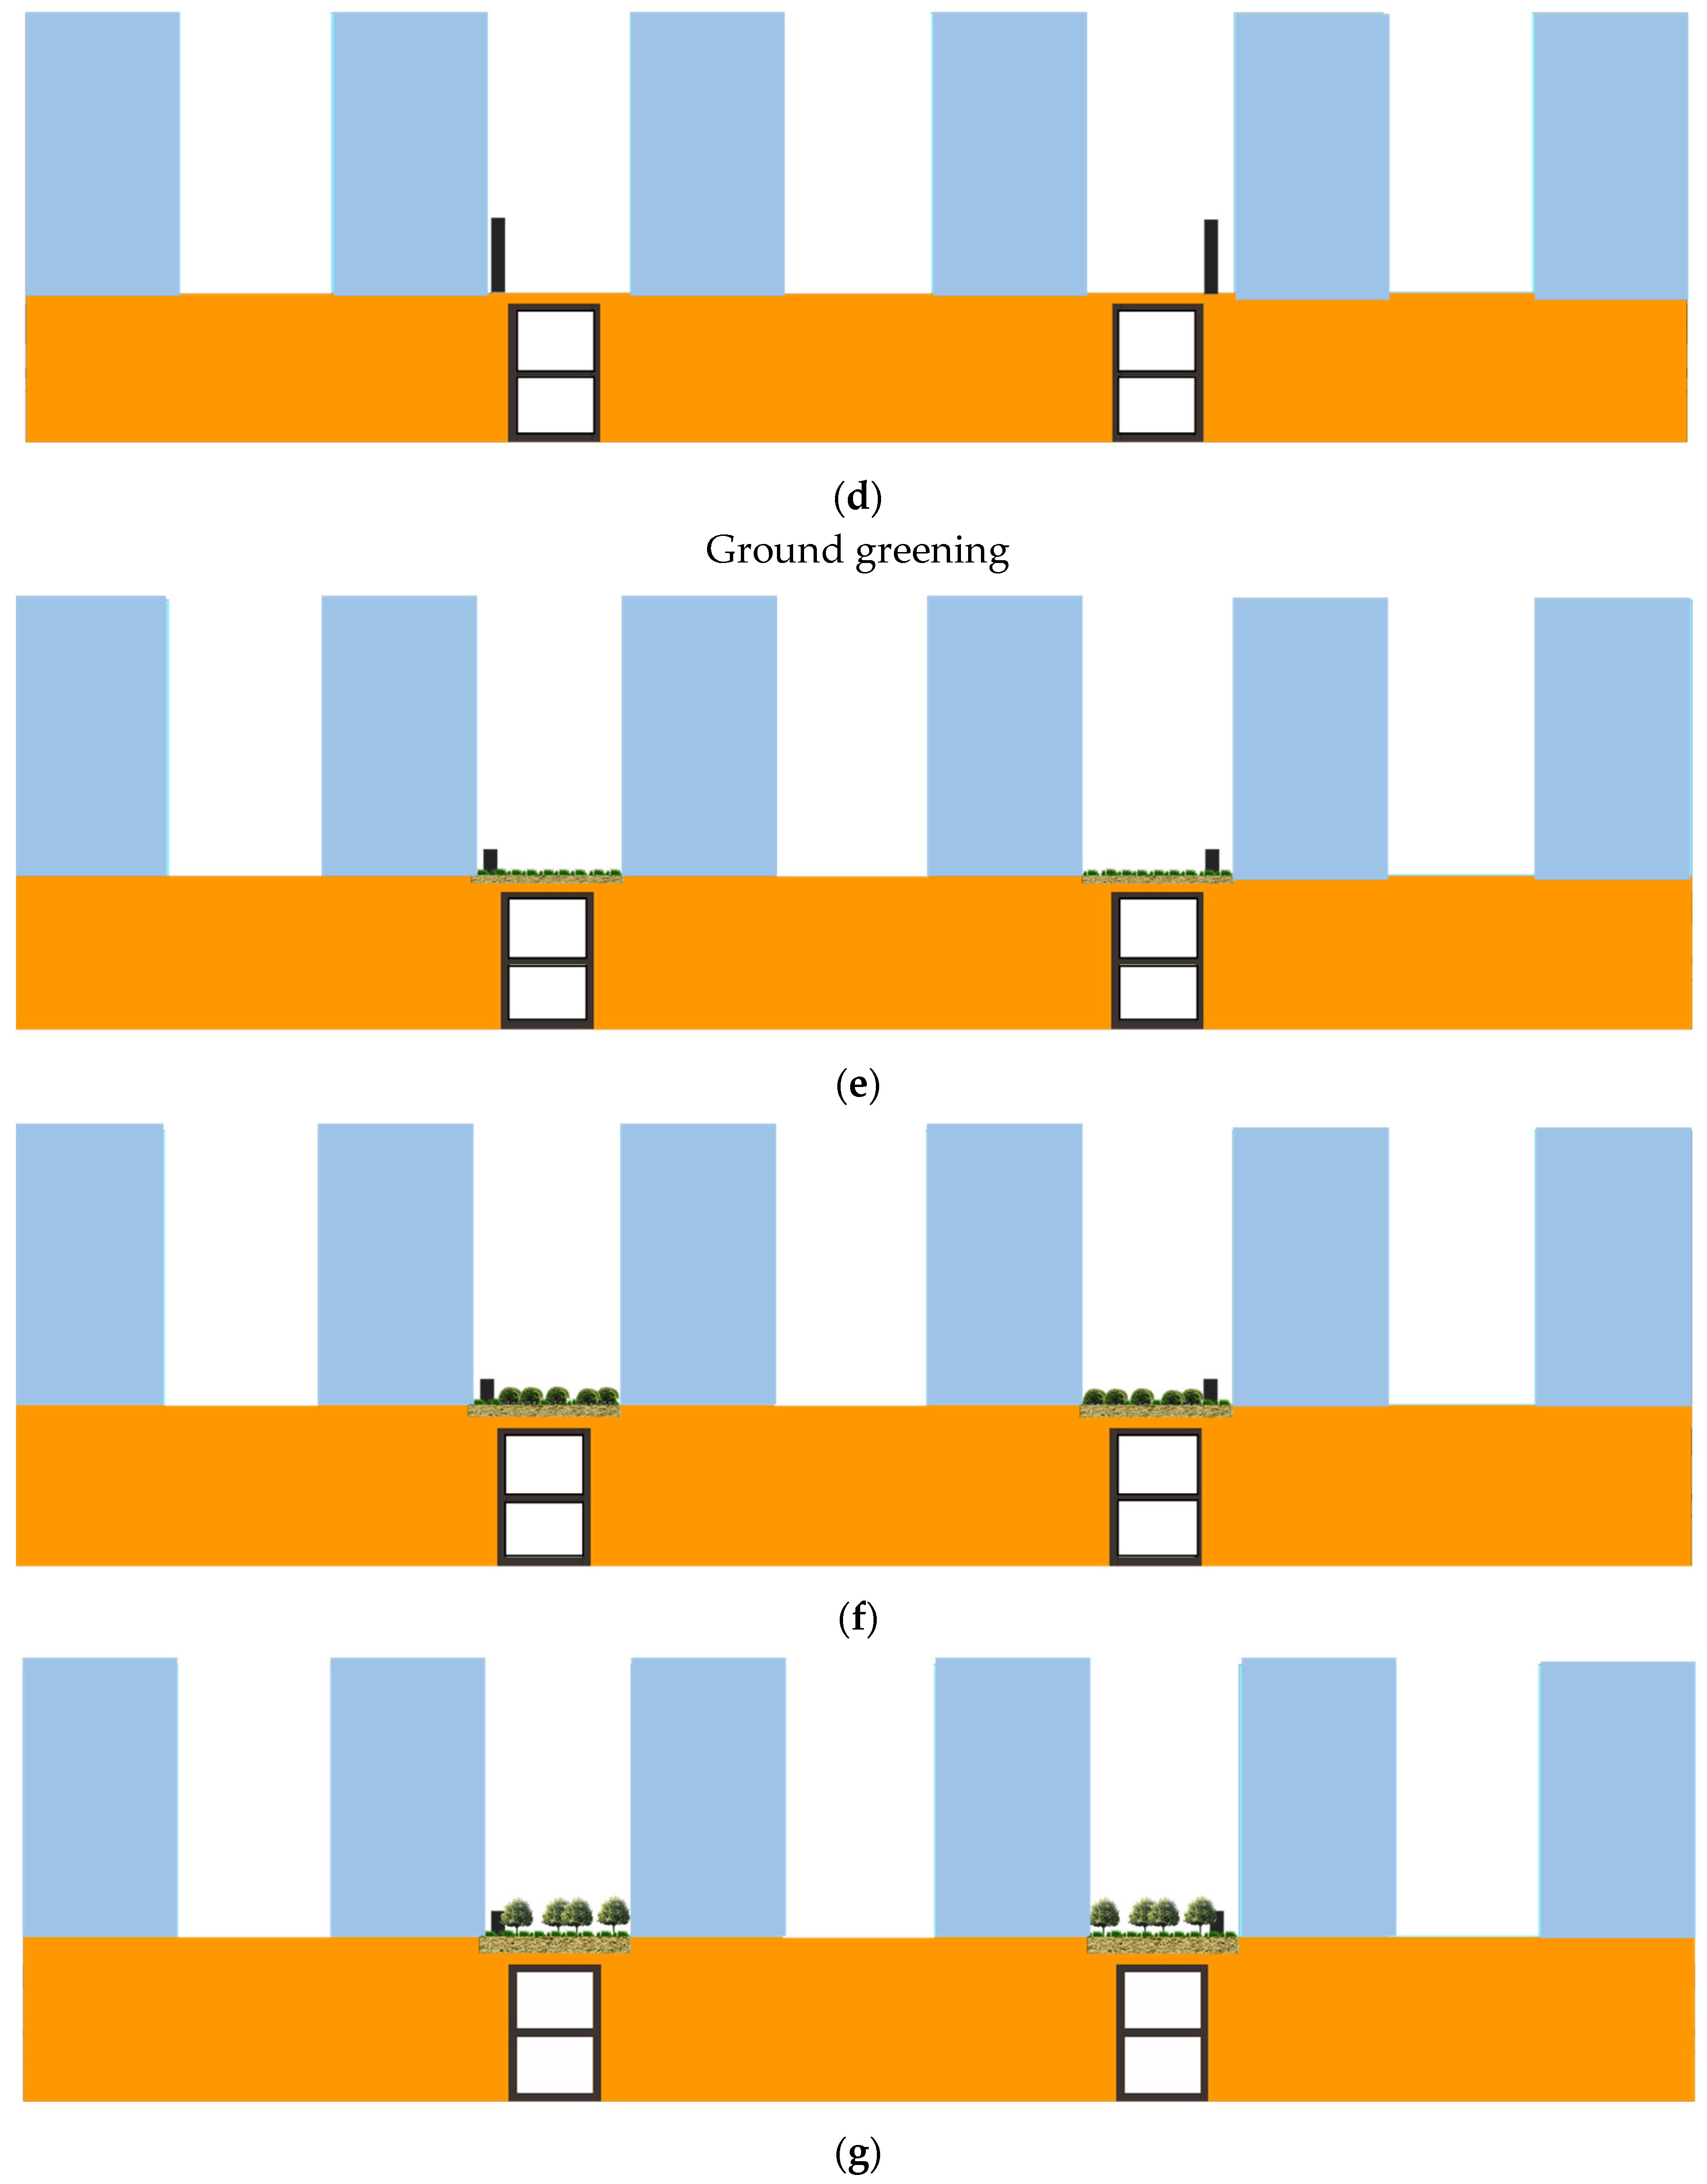
exhaust shaft. (a) B-I1-H2-L1; (b) B-I3-H2-L1; (c) B-I2-H2-L2; (d) B-I2-H8-L2; (e) B-I2-H2-L1-G; (f) B-I2-H2-L1-BS; (g) B-I2-H2-L1-VT.
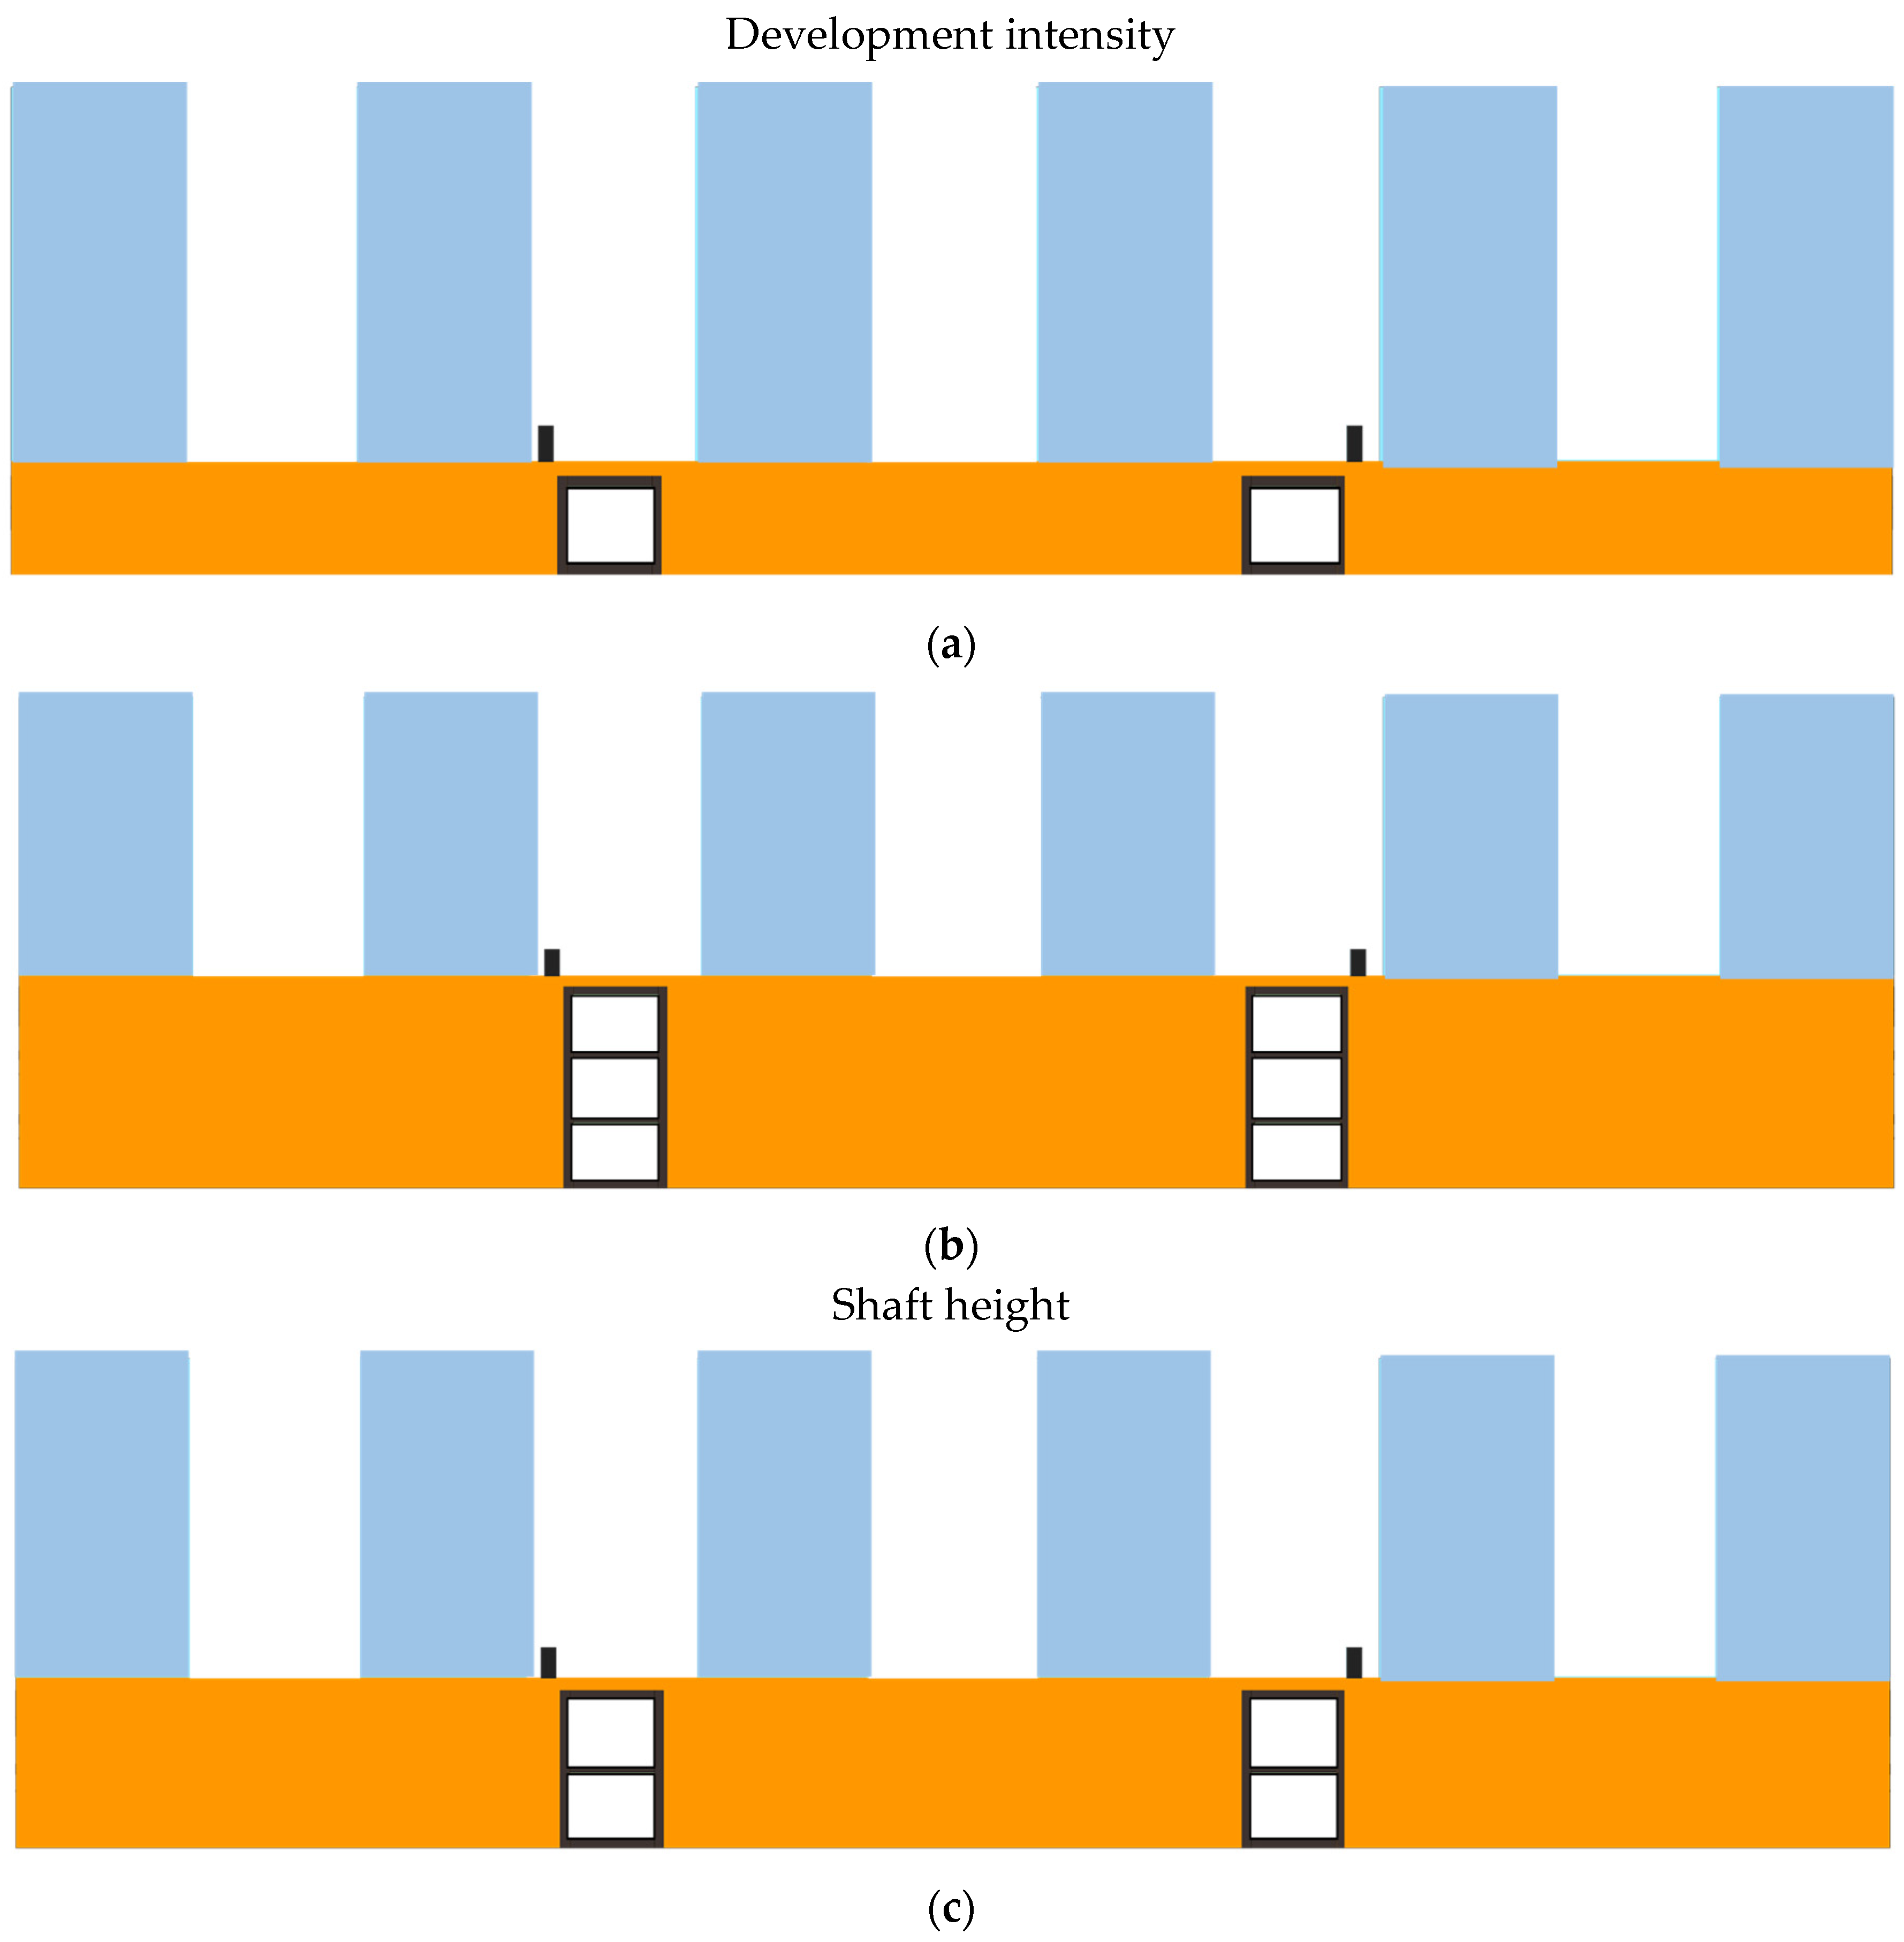
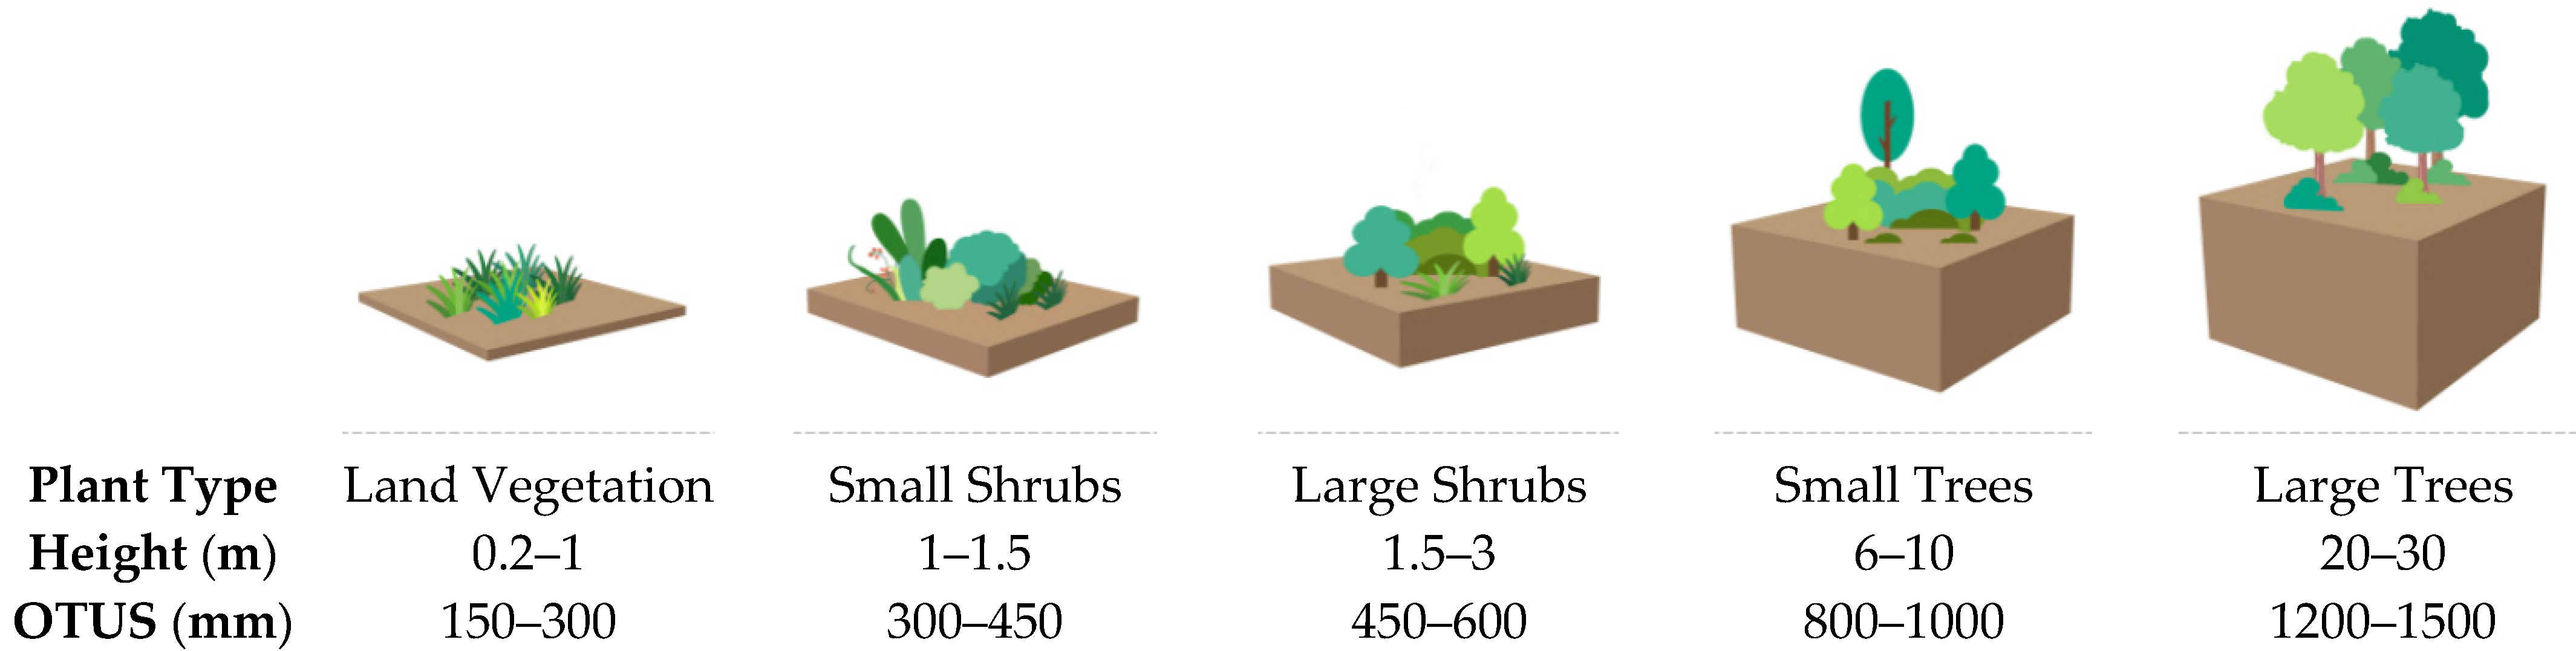
Sustainability 14 09836 g006aSustainability 14 09836 g006b
Figure 7. Influence of development intensity on outdoor CO concentration at 1.5 m above the ground at 12:00 (noon).
Sustainability 14 09836 g007
Figure 8. Influence range of outdoor CO concentration exceeding 10 mg/m3 1.5 m above the ground at different development intensities.
Sustainability 14 09836 g008
Figure 9. Effects of shaft location on outdoor CO concentration (1.5 m above ground, 12:00 noon).
Sustainability 14 09836 g009
Figure 10. Influence range of outdoor CO concentration exceeding 10 mg/m3 1.5 m above the ground under different exhaust scenarios.
Sustainability 14 09836 g010
Figure 11. Influence shaft height on outdoor CO concentration (1.5 m above the ground, 12:00 noon).
Sustainability 14 09836 g011
Figure 12. Influence range of outdoor CO concentration exceeding 10 mg/m3 1.5 m above the ground with different shaft heights.
Sustainability 14 09836 g012
Figure 13. Influence of ground greening on outdoor CO concentration 1.5 m above the ground at 12:00 (noon).
Sustainability 14 09836 g013aSustainability 14 09836 g013b
Figure 14. The influence range of outdoor CO concentration exceeding 10 mg/m3 1.5 m above the ground under different ground greening strategies.
Sustainability 14 09836 g014
Table 1. Possible effects of different types of plants on the urban microclimate.
Plant TypeUrban Microclimate
Air TemperatureWind EnvironmentRadiationRelative HumidityAir quality
Large TreesReduce solar heat gains by shading; absorb the majority of the heat and reduce the air temperature by photosynthesis and transpirationReduce the wind speed at high elevations via the plant canopy and introduce airflow from high elevations to the pedestrian height Shade, absorb, and reduce long-wave radiationIncrease the level of humidity via plant transpirationLeaf adsorption and deposition of particulate matter in the air; the plant canopy changes the wind field, hindering the horizontal and vertical transport of pollutants, resulting in increased pollutant concentrations
Small Trees
Large ShrubsAffect the wind environment at pedestrian heightPartially shade, absorb, and reduce long-wave radiation
Small ShrubsReduce land heat storage and strengthen the heat emission of soil; reduce the land surface temperature and air temperatureTypically do not affect the wind environmentReduce the ground absorption of solar radiation and reduce long-wave radiation from the ground to surroundings
Land Vegetation
Table 2. Model design parameters of determinant urban form.
Land Use Attribute Block Size (m)Building Height (m)Single Building Size (m)Plot RatioGround Building Area (m2)Building Floor HeightNumber of Building StoreysHeight–Width Ratio of Street Canyon
Commercial building200 × 2003613.3 × 46.62.5100,404.364936/20
Table 3. Limits of outdoor CO concentration.
PollutantSampling TimeConcentration LimitConcentration Unit
Grade I StandardGrade II StandardGrade III Standard
CO1 h101020mg/m3
Table 4. Case numbering conventions.
First NumberSecond NumberThird NumberFourth NumberFifth Number
Urban formUnderground commercial street development intensityH: Exhaust air shaft heightL: Exhaust air shaft arrangementGround greening
Determinant urban formI1: Development layer 1
I2: Development layer 2
I3: Development layer 3
H2: 2 m
H5: 5 m
H8: 8 m
L1: Centralized arrangement
L2: Dispersed arrangement
TT: Transverse tree
VT: Vertical tree
BS: Big shrub
SS: Small shrub
G: Grass
Table 5. The mechanisms of ENVI-met with respect to dispersion and deposition of particulate matter.
ModelEquationDescription
Atmospheric modelNavier–Stokes equations:
u t + u i u x i = p x + K m ( 2 u x i 2 ) + f ( v v g ) S u v t + u i v x i
= p y + K m ( 2 v x i 2 ) + f ( u u g ) S v w t + u i w x i
= p z + K m ( 2 w x i 2 )
Continuity equations:
u x + v y + w z = 0
E t + u i E x i = K E ( 2 E x i 2 ) + Pr T h + Q E ε E t + u i ε x i
= K ε ( 2 ε x i 2 ) + c 1 ε E Pr c 3 ε E T h c 2 ε 2 E + Q ε
For outdoor airflow, non-hydrostatic, incompressible equations are applied. The trajectory simulation of pollutants is described by the Lagrangian equation, which can simulate gas and particle diffusion.
Temperature and relative humidity are calculated based on the advection–diffusion equation. The turbulence and airflow exchange processes are based on two additional k-ε governing equations proposed by Mellor and Yamada [20].
Pollutant deposition modelDeposition caused by gravity:
X ( z ) = v s / d X ( z ) ε z
Leaf adsorption and deposition:
m p l a n t t X p l a n t ( z ) · 1 L A D ( x , y , z ) · ρ
The leaf surface is the main attachment site for particle settling. The equation governing particle deposition in ENVI-met consists of two parts: gravity-induced deposition and leaf-surface adsorption deposition. ENVI-met does not take into account the secondary suspension of particles after a brief stay on the surface.
Vegetation
model
J f , h = 1.1 ( T f T a )
J f , e v a p = γ a 1 Δ q δ f w + γ a 1 ( 1 δ c ) Δ q
J f , t r a n s = δ c ( γ a + γ s ) 1 ( 1 f w ) Δ q
The effect of vegetation on turbulence is simulated by introducing additional governing equations related to leaf area density (LAD).
Table 6. Simulation settings.
ParameterDefinitionParameter Value
Meteorological conditions
(typical meteorological conditions on a summer day in Nanjing)
Wind speed (m/s)2.4
Wind direction (°)157.5
Original atmospheric temperature (K)294.95
Outdoor atmospheric pressure (Pa)100,250
Relative humidity (%)80
Model settingsBuilding materialConcrete
Building color Gray
Number of embedded grids10
Grid dimensions (X × Y × Z)100 × 100 × 30
Grid step (X × Y × Z)2 × 2 × 7.5
Plant settingsSmall shrub1 m × 1 m × 1 m
(L × W × H)
Big shrub3 m × 3 m × 2 m
(L × W × H)
Transverse tree7 m × 7 m × 6 m
(L × W × H)
Vertical tree5 m × 5 m × 10 m
(L × W × H)
GrassH: 0.2 m
Pollution sourcePollutantCarbonic oxide (CO)
Area2 m × 2 m
Height2 m/5 m/8 m
Locationcentralized /dispersed
Source intensity85,000 μgs−1
170,000 μgs−1
255,000 μgs−1
0°, 90° 180°, and 270° denote the wind directions of north, east, south, and west, respectively; L, W, and H denote length, width, and height, respectively.
Table 7. Case summary.
Case NumberDevelopment IntensityShaft HeightShaft LocationGround Greening
(a) Development Intensity
B-I1-H2-L1I1—development layer 1H2—2 mL1—concentrationNone
B-I2-H2-L1I2—development layer 2
B-I3-H2-L1I3—development layer 3
(b) Shaft Height
B-I2-H2-L2I2—development layer 2H2—2 mL2—dispersionNone
B-I2-H5-L2H5—5 m
B-I2-H8-L2H8—8 m
(c) Shaft Location
B-I2-H2-L1I2—development layer 2H2—2 mL1—concentrationNone
B-I2-H2-L2L2—dispersion
(d) Ground Greening
B-I2-H2-L1-TTI2—development layer 2H2—2 mL1—concentrationTT-Transverse tree
B-I2-H2-L1-VTVT—Vertical tree
B-I2-H2-L1-BSBS—Big shrub
B-I2-H2-L1-SSSS—Small shrub
B-I2-H2-L1-GG—grass
Publisher’s Note: MDPI stays neutral with regard to jurisdictional claims in published maps and institutional affiliations.

