1. Introduction
Even before the COVID-19 pandemic, telework was associated with sustainability, since it was considered to be an important means to reduce congestion, the environmental impact of transportation, and energy consumption [
1,
2]. For years, the adoption of teleworking was tied to factors such as schedule flexibility [
3], worker age, education [
4,
5], and interaction with the employer’s expectations [
6].
The term telework was originally introduced in 1973 by Jack Nilles, who defined telework as an activity that “includes all work-related substitutions of telecommunications and related information technologies for travel” [
7]. Most recently, there seems to be a wide consensus regarding the following two criteria applied in order to define ‘telework’: (1) a remote work location, and (2) the use of ICTs. However, the definition of ‘telework’ has not been unanimously agreed upon, which has resulted in the exclusion of several types of workers, such as occasional or self-employed teleworkers [
8].
Important research on teleworking has been conducted for years, and some of the main research themes studied between 2000 and 2020 were as follows: telework outcomes, job satisfaction, life-work balance, career impacts, productivity-firm performance, interpersonal interaction, and social isolation. Telework outcomes refer to how telework impacts different aspects of the people and business. Job satisfaction refers to how telework specifically affects the quality of the relationship between the employees and their organizations. Life-work balance refers to how telework increases or decreases the levels of balance between life and work. Career impacts refer to how telework is an advantage or an impediment to progressing in one’s career. Productivity-firm performance refers to the impact of telework on individual and firm performance. Interpersonal interaction and social isolation refer to how telework affects employee’s opportunities to interact and engage with others [
8].
It should be noted that between 2000 and 2020, the main research themes focus on what happens after individuals become teleworkers. What happens before individuals become teleworkers does not seem to be a main research theme.
With the arrival of COVID-19 in 2020 and the start of lockdowns, the working population was urged to work from home as much as possible, and many new teleworking technologies were enabled for this population [
9]. Nevertheless, many cities across the world are currently returning to “normal”, and the urge to telework could be decreasing. In addition, the current levels of telework may not be sustained in the wake of growing evidence related to a decline in innovation and productivity [
10,
11].
After the COVID-19 pandemic, research on telework received likely its most important impulse, but the main themes studied seem to focus on what happens after individuals become teleworkers. There are studies about the telework impact on active travel (walk and cycling) [
12], mobility behavior [
13], train travel intentions [
14], job engagement [
15], and labor productivity [
16]. Nevertheless, despite the short time of the post-pandemic era, some important research has included studies about what happens before individuals become teleworkers.
In [
9], employees’ experiences and perceptions of telework during the pandemic were studied using a multiple indicator multiple cause model (MIMIC) to understand employee satisfaction with telework. This research identified factors that could affect employer’s plans to adopt telework in the long run. One positive factor is related to the benefits of telework, such as commute time savings. One negative factor is related to age, as older individuals might perceive high barriers to teleworking potentially due to difficulty with technology.
In [
14], differences and similarities among individuals in terms of attitude towards teleworking, frequency of teleworking, and future intentions related to teleworking were studied. Longitudinal data of train travelling were used, and also a latent class cluster analysis was applied to identify different types of teleworkers based on their willingness to telework. This research reported that individuals with a high willingness to telework typically present some special characteristics, such as they work for organizations that are prepared for teleworking, and they also have a job, personality, and home situation suitable for teleworking.
In [
17], factors associated with telework use in Japan were analyzed using the unique panel survey on telework. This research found worker characteristics of individuals that are likely to use telework, which are as follows: high level of education, strong ICT skills, middle age range, and women engaged in a few teamwork tasks.
These studies and other new research help to increase the understanding of factors associated with how individuals become teleworkers, but also leave remaining questions. In [
17], the question is why telework use remains relatively low in Japan, and in [
18], there is a need to explore whether promoting teleworking for employees who live far away encourages people to live further away.
A comprehensive understanding of how employees adopt teleworking technologies is important in studying its long-term viability in order to maintain and boost the benefits of teleworking for sustainability. Considering that many employees can decide if they want to adopt or reject the use of these technologies, and thus become teleworkers or remain as onsite workers, it is useful to study their decisions on adopting these technologies. In search of an appropriate theoretical model for this aim, the diffusion of innovation Theory, DoI) introduced by Everett M. Rogers in 1962 [
19] provides an excellent theoretical model, supported by four facts.
First, teleworking and the technologies that make it possible fit the definition of innovation found in the innovation literature, that is, “an idea, practice, or object that is perceived as new by an individual or other unit of adoption” [
19]. In addition, DoI theory has been used before to analyze teleworking adoption [
7,
20,
21].
Second, DoI theory is a well-developed theory that is broadly accepted and widely applied. There is a vast amount of research available on the DoI developed over the years [
22]. By 2003, it had been used in more than 5000 studies across various scientific disciplines, business, and social studies [
23].
Third, since DoI theory focuses on an individual’s own adoption decision process, it provides a different approach compared to most other theories applied to study teleworking adoption in the pandemic and post-pandemic era.
Fourth, DoI theory can be applied without the use of surveys, since an individual’s adoption decision can be modeled in many different ways. It is an important characteristic, since many of the studies about teleworking adoption use surveys as one of their study methodologies [
8]. Thus, DoI theory can help to overcome the limitation of surveys.
In DoI theory, the diffusion of innovation was defined as the process by which innovation is communicated over time among the participants in a social system [
23]. The key to adoption is that they must perceive the idea, behavior, or product as new or innovative. Thus, adoption means that a person does something different than what they had done previously.
In this theory, the accumulated number of innovation adopters over time typically describes an s-shaped curve (s-curve), with five growing stages related to five groups of adopters. Initially, the curve shows a slow growth while the first individuals adopt the innovation and these are called innovators. At the second stage, the curve shows a slightly faster growth when a new group of individuals adopt the innovation and these are called early adopters. At the third stage, a bigger growth rate is observed when the first portion of the majority of individuals adopt the innovation and they are called the early majority. At the fourth stage, the growth rate decreases when the second portion of the majority of individuals adopt the innovation and they are called the late majority. At the last stage, a smaller growth rate is observed when the last group of individuals adopt the innovation and these are called laggards. Using this approach, adopters are categorized based on their propensity to adopt the innovation.
There are many factors that impact the diffusion velocity of an innovation; this is the growth rate of the associated s-curve. Rogers reports that between “49 and 87 percent” of the variance in the adoption rate can be explained by the following five attributes: (1) relative advantage, (2) compatibility, (3) complexity, (4) trialability, and (5) observability [
23]. Each of these attributes can be described as follows.
Relative advantage is the degree to which an innovation is perceived as being better than the idea it supersedes. If a potential user does not perceive there to be a relative advantage in using the innovation, it will not be adopted. Research evidence indicates that there is a positive correlation between personal innovativeness and perceptions of relative advantage [
24].
Comparability is the degree to which an innovation fits with the existing values, past experiences, and needs of potential adopters. Research evidence suggests that the more compatible the innovation, the greater the likelihood of adoption [
25].
Complexity is the degree to which an innovation is perceived as difficult to understand and use. Research evidence indicates that complexity has an important negative impact on adoption [
26].
Trialability is the degree to which an innovation may be experimented with on a limited basis.
Observability is the degree to which the results of an innovation are visible to the adopters.
In addition, Rogers also conceptualizes about people’s innovation decision process, which involves the following five stages: (1) knowledge, (2) persuasion, (3) decision, (4) implementation, and (5) confirmation. These stages typically follow each other sequentially, and finally impacts the individual’s innovation result, either adoption or rejection [
23]. Each of these stages can be described as follows: the knowledge or awareness stage is where an individual becomes aware of the innovation and becomes interested in understanding its function. The persuasion stage is where the individual ascertains the potential value of adopting the innovation, and further explores its capabilities. The decision stage is where the individual determines whether an innovation will be adopted or rejected. The implementation stage is where the individual makes full use of innovation. The confirmation stage is where the individual decides to continue the full use of innovation.
Rogers’s contributions have provided a rich conceptual framework that has significantly influenced research on the diffusion of innovation. Nevertheless, it does not provide qualitative tools to research the diffusion of new products or the impact of different strategic variables on the diffusion process [
27]. Therefore, for a long time, researchers have been trying to develop different mathematical approaches to capture the diffusion process. They are mainly represented by quantitative models that can be divided into two categories based on their approach, aggregate and disaggregate.
The aggregate models are typically based on a formulation of differential equations that specify the flow(s) between mutually exclusive and collectively exhaustive subgroups, such as adopters and non-adopters [
28]. This model category includes the mainstream research available today, and there are also approaches based on system dynamics. These models address the innovation diffusion as a process over a complex system.
The disaggregate models are based on specific innovation decisions at an individual level, and the market response is determined by the aggregation of the individuals’ demand [
29]. In this approach, individuals are not only information transmitters; they make decisions deliberately and independently. Consequently, disaggregate models are founded much more on individual behavior than aggregate models, since they study the variable relations at a macro level.
The disaggregate models can be divided into the following three categories: microeconomic models, stochastic brand selection models, and agent-based models (ABM), which has appeared more recently.
This work shows how an agent-based model is built and applied to analyze the diffusion process of new teleworking technology on a highly heterogenous population, specifically a university population. The achieved model includes a parameter to represent the changing probability of a campus closure over time (as occurs with a lockdown). The model can also be easily modified to simulate and analyze the diffusion of new teleworking technologies on other highly heterogenous populations, such as those typically found in congested cities.
The rest of the paper is structured as follows:
Section 2 presents the model development process and its possible modifications,
Section 3 presents the simulation result obtained by running the model, and finally,
Section 4 presents a discussion.
2. Materials and Methods
The presented model has been developed following the process for model creation, validation, and verification proposed by Robert G. Sargent [
30,
31]. Adaptions of the process proposed by Quintero, and Giraldo [
32] were also included. Main process elements and activities (problem entity, conceptual model and its validation, computerized model and its verification and the model operational validation) were addressed as described below.
For the context of this work, the problem entity (System) corresponds to the dynamics created by the diffusion of a new teleworking technology in one specific university academic department in Medellín, Colombia. The technology was called SAROFI, and it has completed its diffusion process. It was launched, adopted, used for some time, and finally, it was disabled due to a technological update. It was launched in April 2011 and announced for 2 weeks via mail campaigns and briefings. After it was launched, the main adoption phase lasted 60 weeks, during which several unpredicted campus closures occurred, as stated below. Finally, two years after SAROFI was completely adopted, it was disabled.
It should be noted that even though the SAROFI diffusion process occurred before the COVID-19 pandemic, the study of this diffusion phenomenon is relevant because, from a teleworking adoption standpoint, it shares fundamental characteristics with other phenomena of teleworking technology diffusion that occurred later due to the COVID-19 pandemic. The most important aspects are related to the unpredicted campus closures, since the duration of these closures, as well as with lockdowns, was unknown. They were caused by social protests and riots and caused a sudden loss of physical access to the campus several times (they lasted for days). As a consequence, there are three main characteristics that the SAROFI diffusion process shares with other teleworking technology diffusion processes that occurred during the pandemic.
First, almost all individuals in the social system where the diffusion process occurred were surprised by the sudden, unexpected loss of physical access to their offices.
Second, telework suddenly became the only way to carry out the majority of the job, and this situation was the same for the complete social system where the diffusion process occurred.
Third, almost all individuals in the social system where the diffusion process occurred were urged to telework by an external agent, such as the government or their employer.
During the SAROFI’s diffusion process, important data were collected by authors to facilitate the study of the phenomenon and the model development. It should be noted that the diffusion process occurs on a population with high heterogeneity. It is created by the strong disparity of the academic community’s activities, profiles, and aspirations and motivations. This marked heterogeneity enhances the relevance of analyzing this diffusion process using ABM.
The development of a conceptual model was the result of an in-depth analysis and modeling task based on collected data and experience. Important data were collected during SAROFI’s diffusion process and were processed to capture information about the population and individuals’ adoption decisions. Experience was a useful modeling resource, since one of the authors was in charge of SAROFI’s design, implementation, and adoption. They suggested and tested the model’s rules about individual adoption decisions. The main components of the developed conceptual model are described in the following sections.
2.1. Model Agents
The agents identified in the conceptual model correspond to each type of individuals in the population of the specific academic division where the diffusion process occurs. Individuals were characterized by types, as follows:
Executive (executive) included people in executive positions at a university, such as deans, vice deans, office directors, etc.
Professor (professor) included people dedicated to teaching and researching activities; these positions are not time limited.
Temporary professor (temporary) included people dedicated to teaching and researching activities; these positions are time limited (less than a year).
Non-teaching employee (non-teaching) included people who are not directly dedicated to teaching and researching activities, but they are dedicated to support activities, including financial, logistic, or information technology tasks.
In addition, an agent named “environment” was included to represent changes in the environment that could affect university campus access. One can reflect on the factors that put people’s access to their physical offices at risk, as with a lockdown. This agent generates changes in other agent’s parameters, such as (1) the external influence parameter p (explained below); (2) the parameters used to evaluate the new teleworking technology and decide whether or not to adopt it. This model feature represents a phenomenon observed during SAROFI’s real diffusion process, such as when the risk of lost physical access to offices increases, the adoption rate also increases.
Regarding the agent’s main attributes, executive, professor, and temporary have the following: (1) age, (2) internal influence parameter
q, (3) percentage of work carried out through ICT %
ICT; (4) complexity threshold. Internal influence parameter
q corresponds to what is proposed in the Bass diffusion model [
33]. Percentage of work carried out through ICT corresponds to the estimated portion of activities supported by computer. Complexity threshold is a configurable value used by the agent to evaluate the new technology’s “complexity” attribute and decide if it is acceptable or not. Attributes
q and %
ICT are assigned by an inverse normal distribution function based on configurable parameters.
Agents also pass sequentially through the following four decision stages based on concepts about the diffusion of innovation process proposed by Rogers [
23]:
The last three stages are equivalent to the first three stages of DoI theory. The process described by Rogers includes an additional stage where individuals put the innovation into practice (implementation stage); however, it was not included in our model. The main reason is to focus on SAROFI’s basic adaptation decisions rather than on usage details, such as connection time or type of remote work activity.
2.2. Model Rules
The purpose of the rules is to direct agents’ decisions about their change in stage. Agents in the executive, professor and temporary categories pass through the four decision stages, while non-teaching agents only pass through three of them. It was a modelling decision derived from observation, since non-teaching individuals seem to have a simpler decision process. There are two types or rules, active-changing and passive-changing, which are described below.
Active-changing rules trigger events derived from the active diffusion phenomenon, such as passing from the unawareness to the knowledge stage by attending a promotional event. Another good example is to reach the decision stage by adopting the innovation due to a satisfactory evaluation of innovation attributes.
Passive-changing rules follow a probability approach inspired by the Bass diffusion model. They produce stage changes when a randomly generated number for each agent reaches the probability threshold determined by Equation (1), which was also taken from the Bass model [
33]. Parameter
p is the coefficient of innovation or external influence. Parameter
q is the coefficient of imitation or internal influence.
F(
t) is the total number of the same type of agents that are already in the destination stage.
The p parameter value is the same for all agents in the same type, but it is different between different types. However, it changes over time due to modifications induced by the “environment” agent. The q parameter is an individual attribute and its value is different for each agent, but always remains within configurable boundaries in the model.
Agents apply passive-changing rules during the time t of the model clock, but they always apply active-changing rules first.
The defined rules for each stage change and agent type are defined as follows.
For agents in the executive, professor, temporary, and non-teaching categories, the following rules are applied.
To pass from the unawareness to the knowledge stage, the following information is applicable:
For the active-change rule, stage changes occur when the individual is covered by innovation promotion efforts, such as briefings and promotional emails. It is applied by multiplying the number of individuals per type in the unawareness stage by the effectiveness of the promotional efforts (this parameter was named in the model as percentage effectiveness of promotion).
For the passive-change rule, stage changes occur when a randomly generated number reaches the stage change probability threshold obtained by Equation (1).
For agents in the executive, professor, and temporary categories, the following rules are applied.
To pass from the knowledge to the persuasion stage, the following information is applicable:
For the active-change rule, stage changes occur automatically for any individual in the knowledge stage. Once the change has completed the innovation’s attributes, such as relative advantage and complexity, it is evaluated using Equation (2).
The function
fage(
age) estimates the individual interest in innovation depending on age. It produces a value between 0 and 1 and the lesser the
age, the greater the interest. This function was adjusted based on hypotheses explored by Patrickson [
34], Haddon [
35] and Okubo [
17] and the authors’ observation of the SAROFI diffusion phenomenon. The term %
ICT was defined in
Section 2.1.
To pass from the persuasion to the decision stage, the following information is applicable:
For the active-change rule, stage changes occur when the evaluation result obtained by Equation (2) reaches the threshold defined for the agent. It is a configurable model parameter (this parameter was named in the model as complexity threshold).
For the passive-change rule, stage changes occurs when a randomly generated number reaches the stage change probability threshold obtained by Equation (1).
In regard to the non-teaching agents, they pass from the knowledge to the decision stage by only one passive-change rule. Stage changes occur when a randomly generated number reaches the stage change probability threshold obtained by Equation (1).
Once the conceptual model was developed, the validation task started. The validation of the conceptual model is defined as determining that the theories and assumptions that underlie the conceptual model are correct and that the model representation of the problem entity is “reasonable” for the model’s intended purpose. For this work, two main theories were chosen to underly the model, including Rogers’s innovation diffusion theory [
23] and the Bass diffusion model [
33]. The first one is the basis for the defined stages and active-changing rules. The second one is the basis for the passive-changing rules. The hypotheses of Patrickson [
34] and Haddon and Brynin [
35] were also used as a basis for the function that relates age and interest in teleworking.
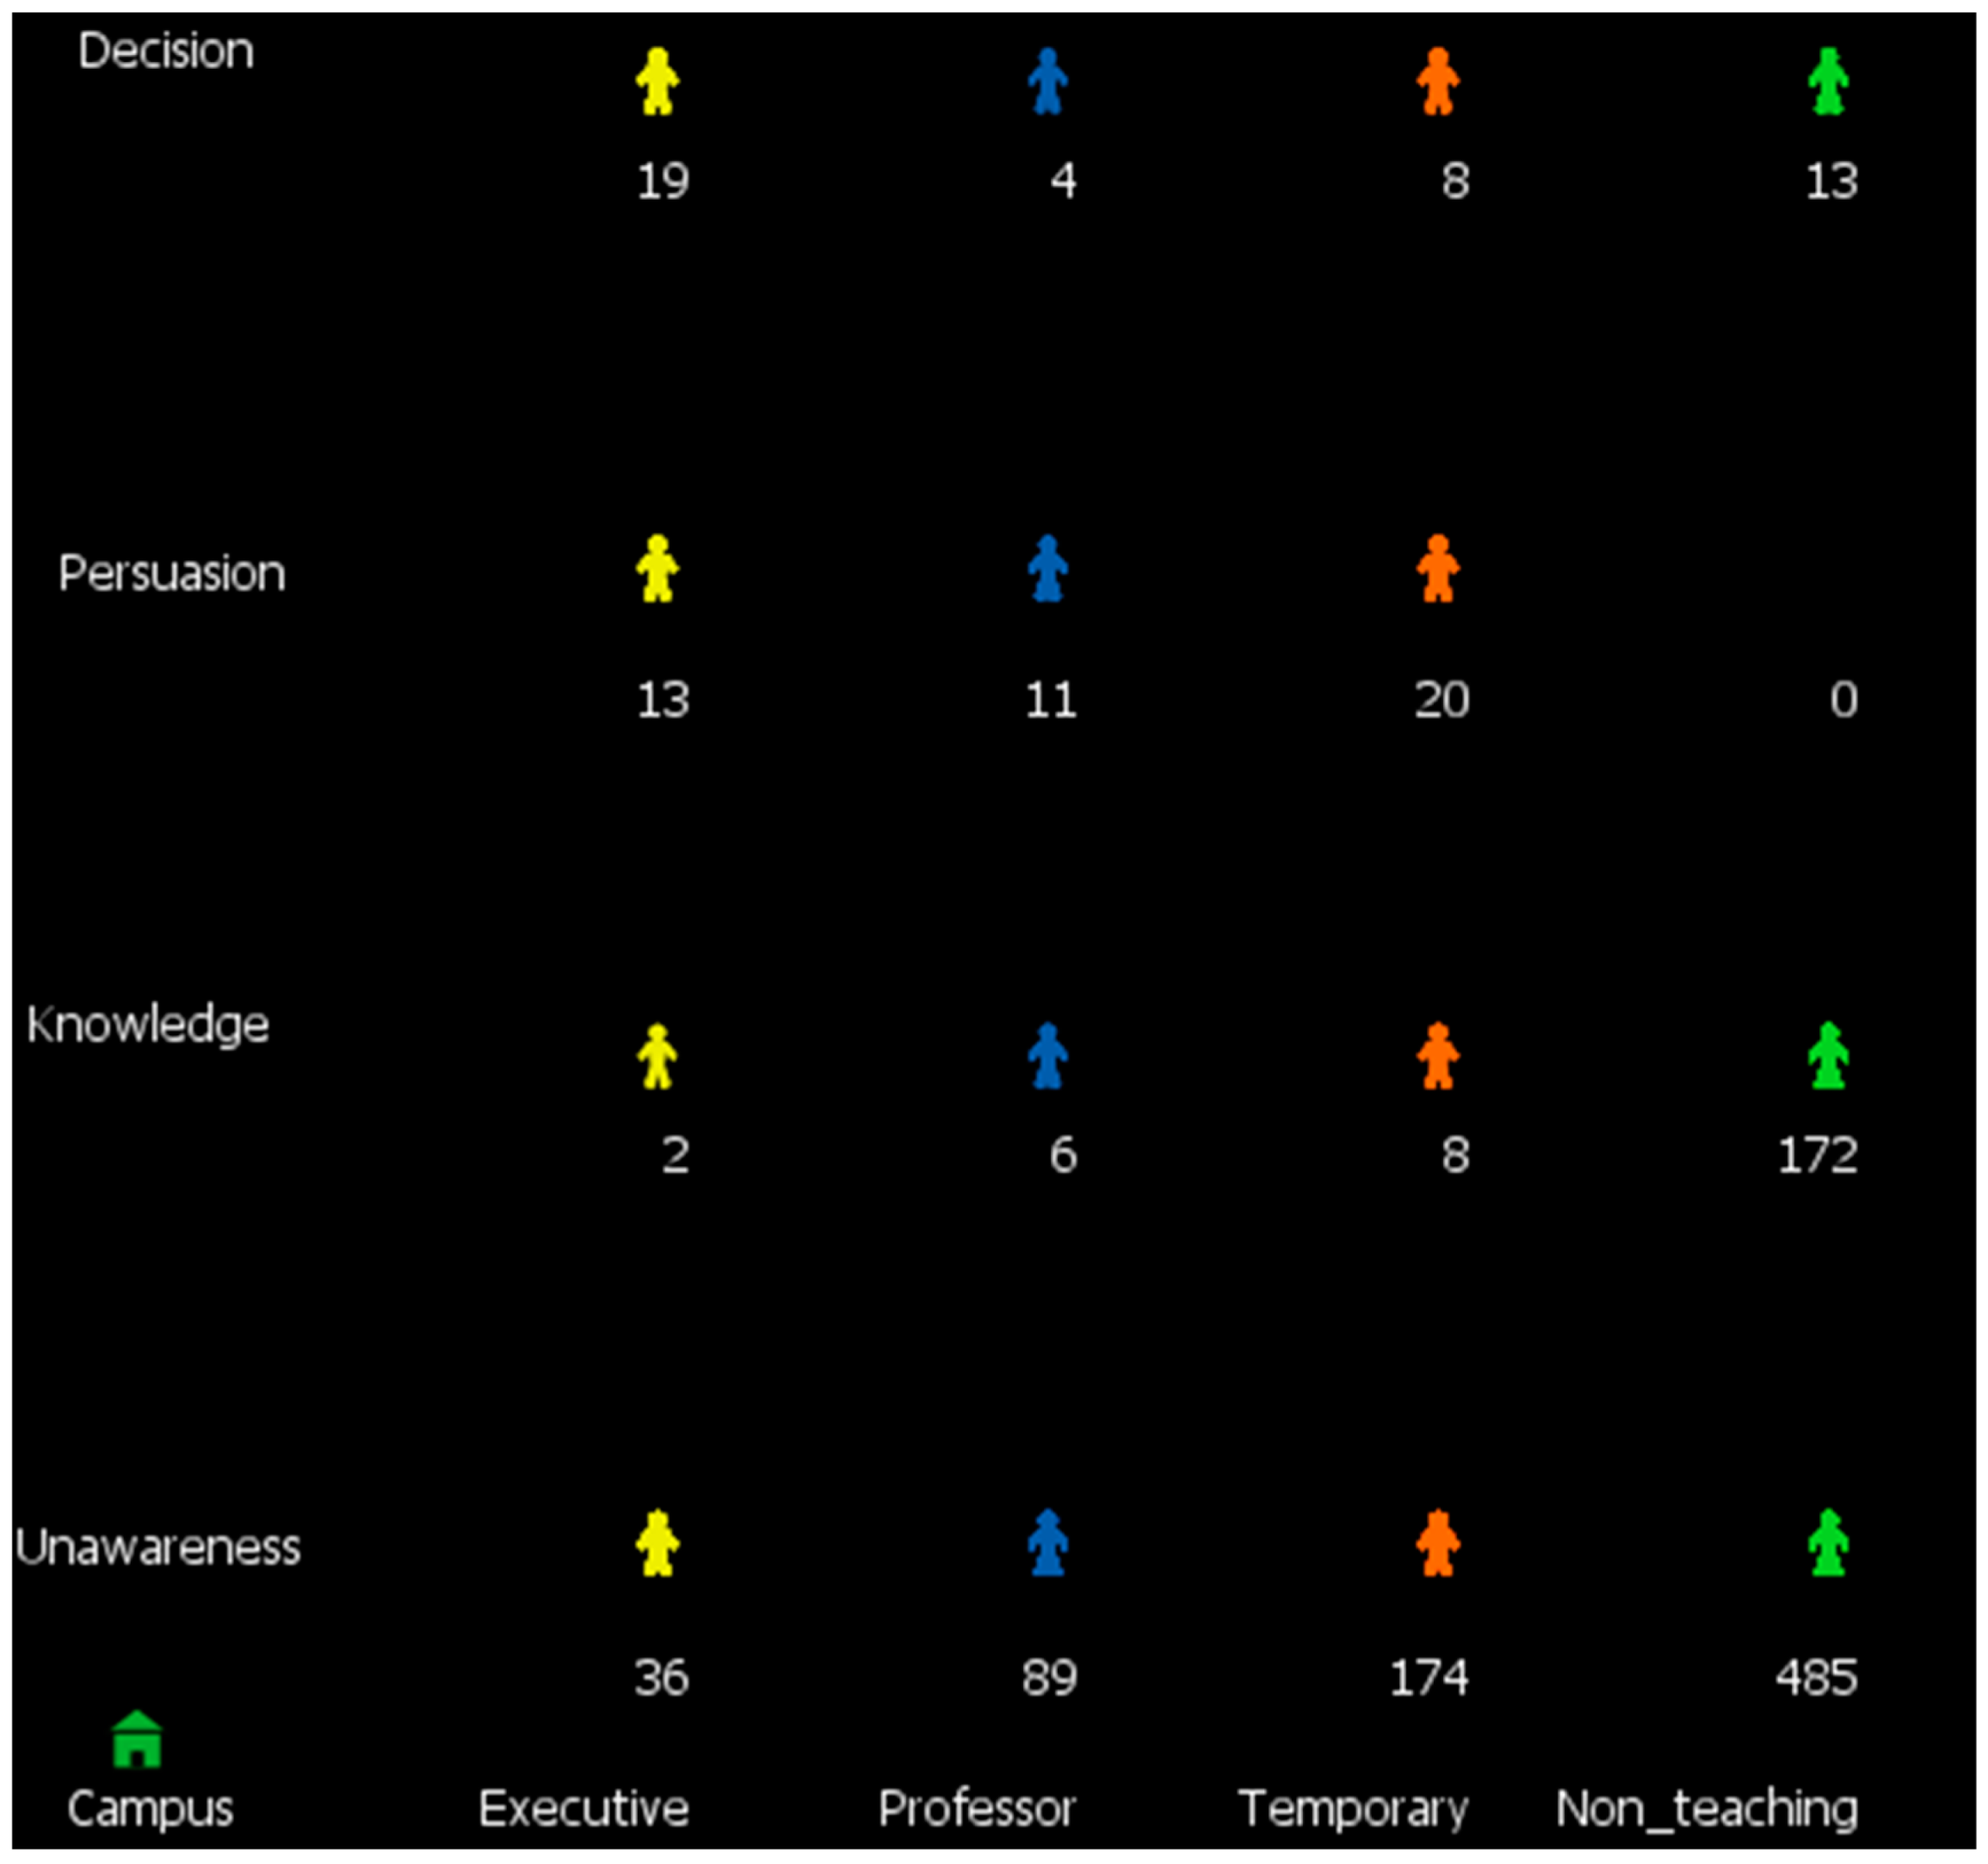
After the conceptual model was validated, it was converted into a computerized model through its implementation in the Netlogo 6.2.2 programming language, source code is available as described on
Supplementary Materials. The different types of agents were represented as “breeds” of turtles and placed on the Netlogo World’s x-axis, while the adoption stages were represented as different height levels on the y-axis. Each agent type was associated with a particular color, including yellow for executives, blue for professors, orange for temporary, and green for non-teaching. The number of agents at each stage is represented by the figure of a person and a quantity. In addition, the “environment” agent was represented by a house figure at the bottom left of the Netlogo World, and another color scheme was adopted to indicate the risk of a campus closure. A green colored house indicates a low risk, a yellow colored house indicates a medium risk, and a red colored house indicates a high risk.
Figure 1 shows a screen capture of Netlogo World for the computerized model’s interface.
As the computerized model is able to run simulations, to make the model parametrization easier, the following three sets of controls were aggregated: “number of agents”, “general parameters for all agents”, and “individual parameters for each agent type”.
The “number of agents” set contains four controls placed in the upper left of the screen. The number of agents per type that are generated with each simulation can be configured.
The “general parameters for all agents” set contains a matrix with twelve controls. Rows correspond to the following three different parameters: (1) percentage effectiveness of promotion, (2) external influence parameter p for the knowledge stage; (3) external influence parameter p for the decision Stage. Columns correspond to each agent type. Each matrix element sets the parameter indicated by row for the type of agent indicated by column.
The “individual parameters for each agent type” set contains a matrix with seventeen controls. Rows correspond to the following five different parameters: (1) mean of internal influence parameter
q, (2) standard deviation of internal influence parameter
q, (3) mean of %
ICT, (4) standard deviation of %
ICT, and (5) complexity threshold. Columns correspond to each agent type. Each matrix element set the parameter indicated by row for the type of agent indicated by column, but as mentioned, non-teaching agents only have controls associated with the internal influence parameter
q.
Figure 2 shows a screen capture for the sets of controls of the computerized model’s interface.
The computerized model also included graphics to show the accumulated number of adopters per agent type, plotted at the bottom of the screen, as they are shown in
Figure 3.
Once the computerized model was built, it was verified. This task is defined as assuring that the computer programming and implementation of the conceptual model are correct. For this aim, selected agents’ behavior was predicted by manually applying the rules, then the agent behavior in the computerized model was compared to the prediction to investigate whether it was correct or not.
Finally, the model was subjected to operational validation. This task is defined as determining that the model’s output behavior has a satisfactory range of accuracy for the model’s intended purpose over the domain of the model’s intended applicability. For this aim, cross-model validation [
36,
37] was used in order to validate that the constructed model’s output reasonability fits the output of a previously validated model, which in this case is the Bass diffusion model.
It should be noted that for operational validation, the model was not configured using the parameters associated with SAROFI’s diffusion process. The model was configured using changing parameter values in order to fit the model’s output per agent to the output predicted by the Bass diffusion model. Specifically, the model’s output in the form of an average accumulative innovation adoption curve was compared with the curve predicted by the Bass model obtained using Equation (3). Following Quintero and Giraldo [
32], this average accumulative curve was obtained by running the model 2500 times, capturing the accumulated number of adopters on each time unit (a week for this case). The average is then calculated.
The equation parameters and result were stated in
Section 2.2. The values of
p and
q were adjusted in order to obtain the best fit of
F(
t) to the model’s average output using the minimum square method [
38].
Table 1 shows the
p and
q values for each agent type that allowed for the best fit, measured by the R
2 coefficient of determination.
2.3. Possible Model Adaptations
Since all model parameter values are configurable, the model can be parametrized to meet new study requirements of a similar teleworking adoption phenomenon. If major modifications are needed, the constructed model can be modified to study other teleworking adoption phenomena on a highly heterogenous population. New agent types can be added with their own attributes, and new stage change rules can also be added. The functions that support stage change rules can also be adjusted to use other agents’ attributes. Modifications of the “environment” agent can also be applied to include more attributes and mechanisms to affect other agents’ behavior over time.
4. Discussion
The simulation results obtained by running the constructed model produced adoption curves that reasonably fit with the real adoption curves of the teleworking technology SAROFI. It demonstrates the possibilities that ABM and DoI offers to the study of teleworking adoption, specifically for highly heterogenous populations and for significant changes in adoption conditions.
The constructed model was able to reasonably reproduce the temporary increase in SAROFI’s adoption rate observed when the risk of a campus closure also increased. It demonstrates that AMB and DoI can be applied to explore the effect of significant changes in the teleworking adoption conditions, such as those resulting from the risk of general office closure, significant variations in fuel prices, and significant changes in the sustainability mindset of governments or organization leaders, among other factors.
Simulation results suggest that the main reason for the observed increase in the adoption rate of SAROFI is the increase in the risk of campus closure and the consequent increase in how useful individuals find teleworking technology. It also suggests that a high risk of campus closure reduces the complexity threshold that individuals use to determine if a teleworking technology is easy enough to use and if it is worth adopting.
The obtained results are in line with [
9,
17], since model parametrization and its simulation results indicate that, even with a general closure, age and ICT skills affect teleworking adoption, while younger workers with strong ICT skills encounter fewer obstacles when adopting telework. An important contrast with Okubo’s study [
17] is highlighted, since it was applied in Japan, and the study presented in this paper was applied in Colombia.
The results obtained also seem to be in line with [
14], since the reproduced adoption curves were generated by configuring the model with different parameters according to each job type. It supports the idea that differences in job type can affect teleworking adoption.
For the case of study presented in this paper, an explanation of the unusual changes in the adoption rate observed for the specific teleworking technology (SAROFI) was obtained. An explanation was unknown before this study and is supported by a combination of the Bass diffusion model [
33] and DoI theory [
19]. Regarding the Bass diffusion model, the explanation is related to temporal changes in external influence that actuates on individuals, represented by temporary changes in the correspondent parameter
p. Regarding DoI theory, the explanation is related to a temporary reduction in the complexity threshold that individuals use to evaluate SAROFI’s complexity and determine whether it is worth adopting. This is represented by temporal changes in the variables involved in the complexity evaluation calculation.
This study contributes to the literature on teleworking adoption by offering a specific approach to analyzing teleworking adoption processes for highly heterogenous populations and significant time changes in adoption conditions, all without the application of surveys. This contribution deals with what happens before individuals become teleworkers, which is one of the telework themes with fewer research.
This study has important practical implications for various stakeholders, especially for governments and organizational decision makers, since the external influences on possible teleworking adopters can significantly affect the adoption process. Stakeholders could try to manage conditions that impact this influence as possibilities for promoting the adoption of teleworking.
The constructed model can be modified and applied in the study of other teleworking technology adoption phenomena on highly heterogenous populations. The main model elements can be changed, such as the agents and their attributes, or stage changing rules and their base functions. Modifications of the “environment” agent can also be applied to include more attributes and mechanisms to affect other agents’ behavior over time. It allows the model to be adapted as a tool to explore the possible effect of different strategies to promote telework in specific cases, helping to evaluate ways to reduce congestion and the environmental impact of transportation in order to benefit sustainability.
The constructed model could be validated using other teleworking diffusion processes on a highly heterogenous population. Its predictive and explicative power could also be analyzed. It could allow the model to evolve and become a tool to formulate and evaluate teleworking adoption scenarios.


