
Assessing the Economic Energy Level of the Chengdu–Chongqing Economic Circle: An Integrative Perspective of “Field Source” and “Field”

Abstract
:1. Introduction
2. Literature Review
3. An Evaluation Framework of Regional EELs
3.1. Definition of Regional EELs
3.2. An Evaluation Framework of Regional EELs
3.2.1. Evaluation Indexes of Internal Comprehensive Development Levels
3.2.2. Evaluation Indexes of Urban External Economic Connection Levels
4. Preliminary Construction of a Regional EEL Evaluation System
4.1. Design Principles and Assumptions of the Regional EEL Index
4.2. Design Process of the Regional EEL Index
4.2.1. The Internal Comprehensive Development Level
4.2.2. The External Economic Connection Level
4.3. A Preliminary Framework of a Regional EEL Evaluation System
5. Quantitative Evaluation of the EEL of Chengdu and Chongqing
5.1. Data Source and Evaluation of the EEL Evaluation of Chengdu and Chongqing
5.2. Quantitative Evaluation of the EEL of Chengdu and Chongqing
5.2.1. Dimensionless Processing of Data
5.2.2. Reliability and Validity Evaluation of the EEL Index System on Chengdu and Chongqing
- (1)
- Reliability Analysis
- (2)
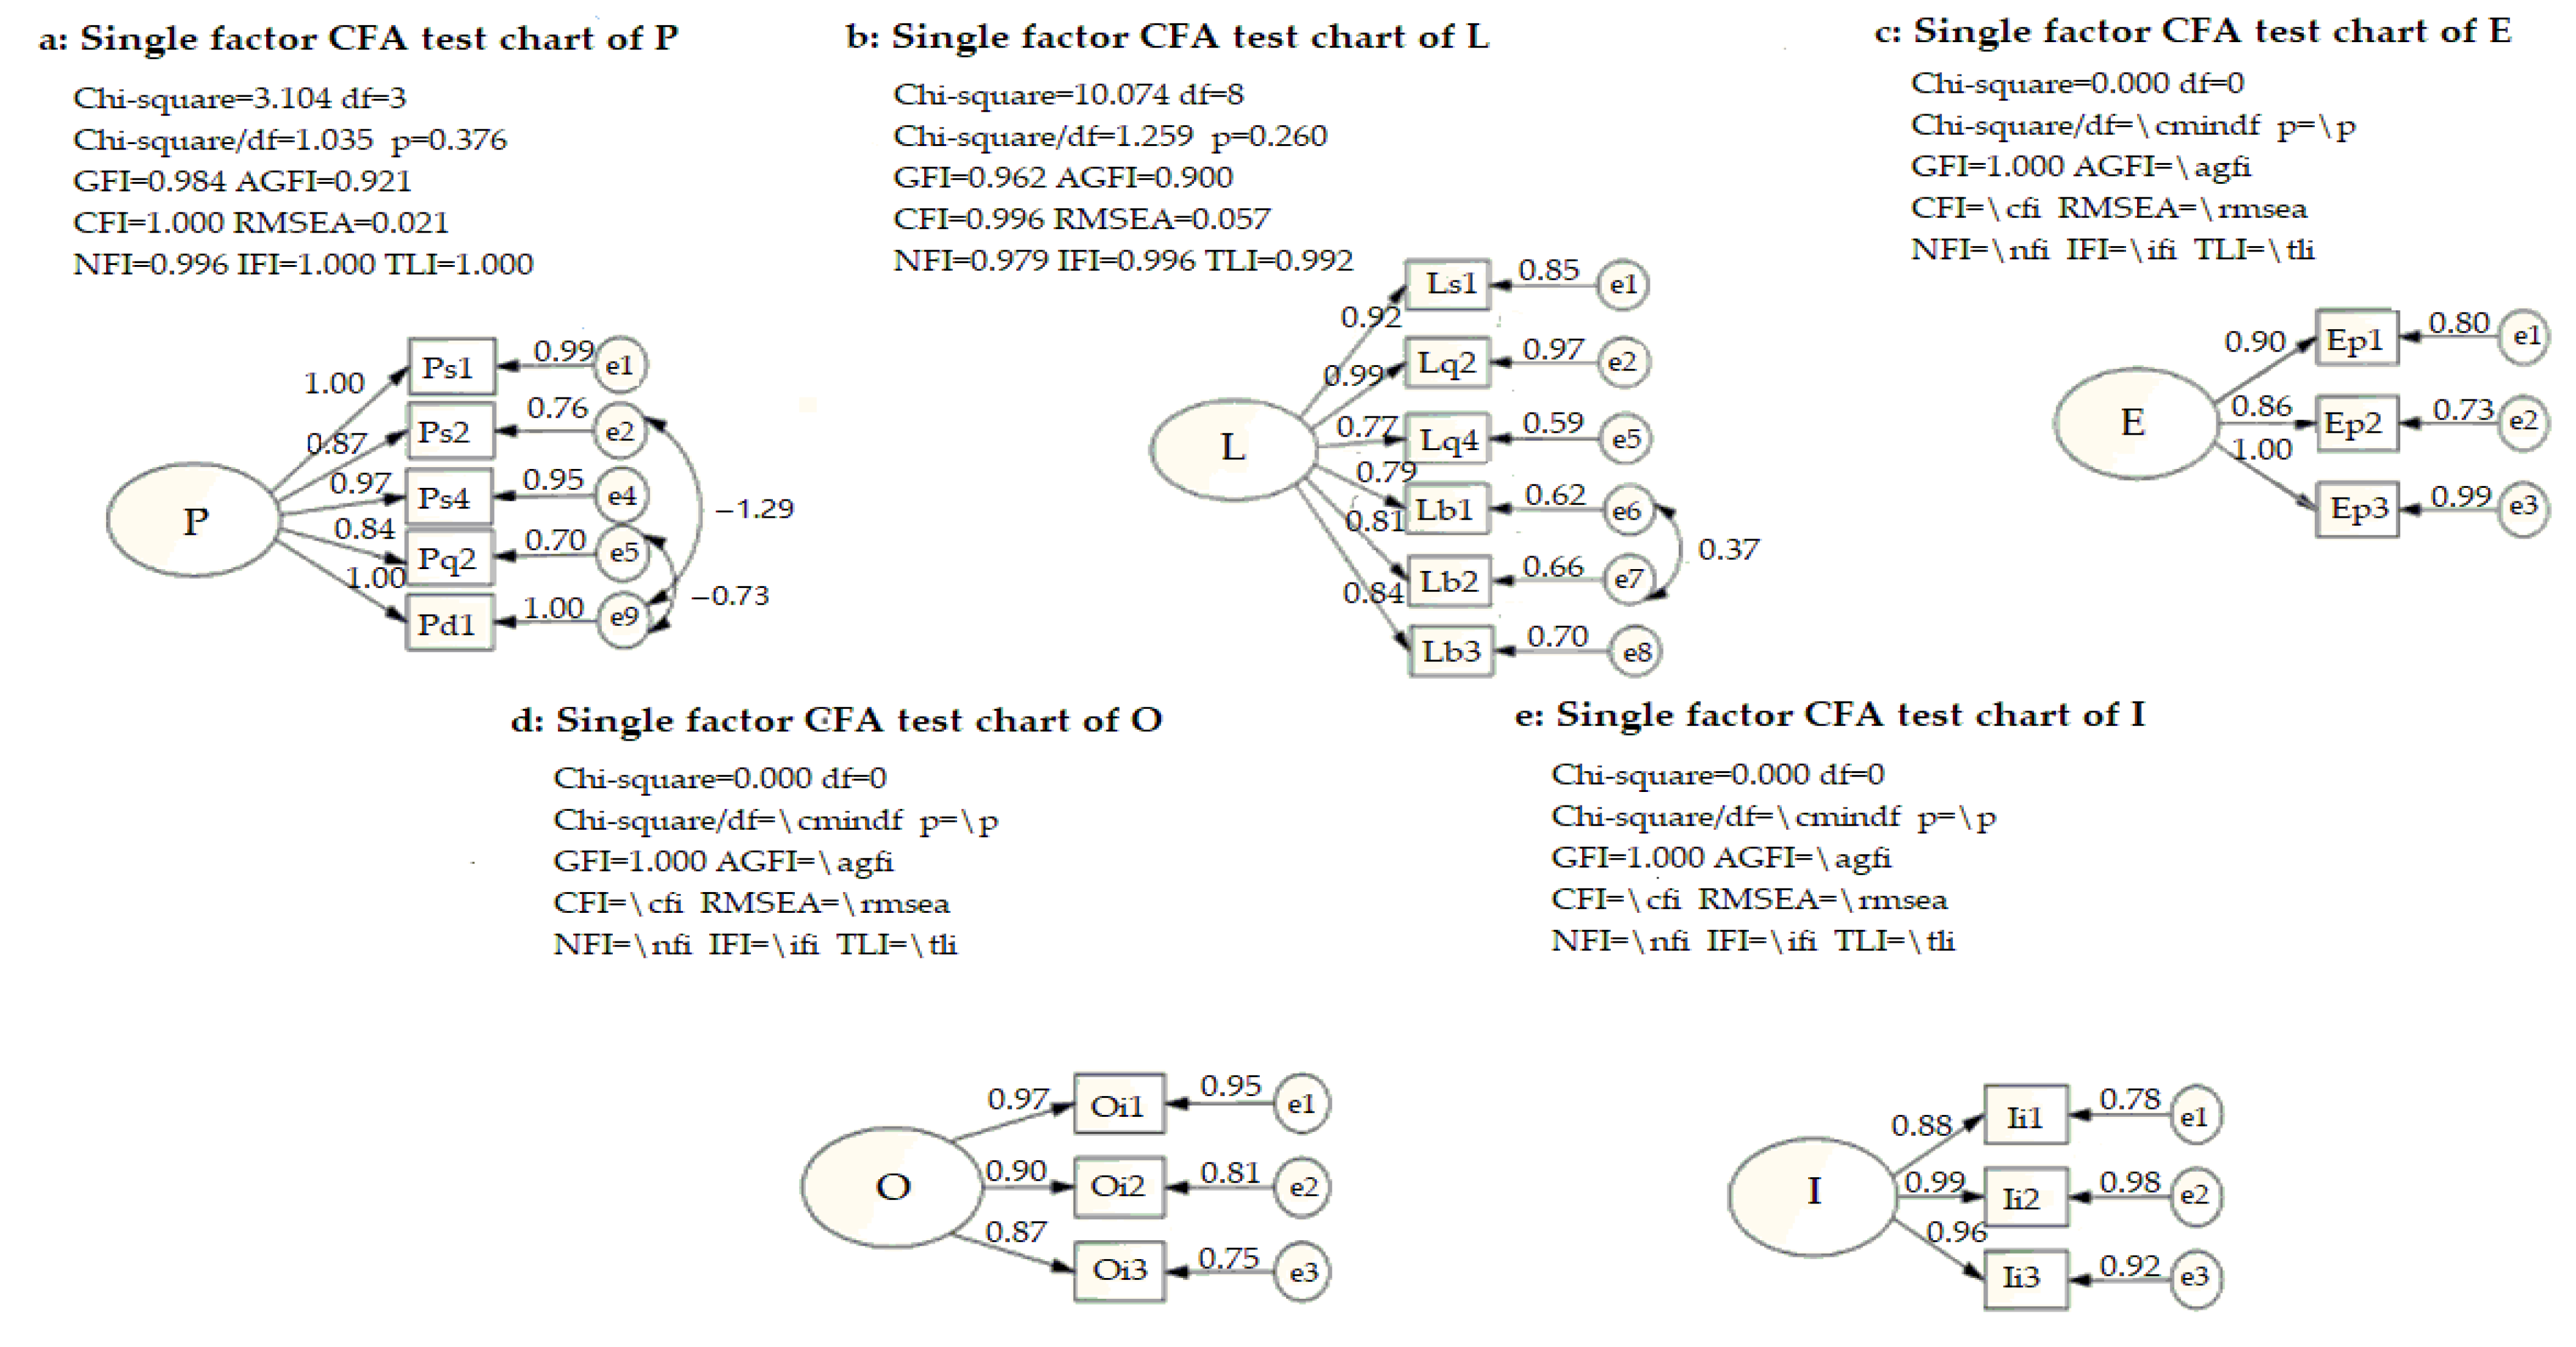
- Validity Analysis
5.2.3. Evaluation of the EEL of Chengdu and Chongqing by Fuzzy Integrals of Comprehensive Weights
- (1)
- Entropy Weight
- (2)
- Comprehensive Weight
- (3)
- λ Fuzzy Measure
- (4)
- Fuzzy Integrals
- (5)
- Steps of Applying the Proposed Evaluation System
- (6)
- Calculation Results
6. Discussion
- (1)
- The paper focuses on the evolutionary law of the indexes of PLE and OI of Chengdu–Chongqing twin cities. OI in Chongqing has always been ahead of its PLE and constitutes the main driver of its EEL. In Chengdu, on the contrary, PLE has an advantage in the later stage and has become the main driver of its the EEL. The evolution trends of PLE and OI in Chongqing are basically synchronized: They mutually influence each other, rise and fall simultaneously, and satisfy the theory of interdependent and co-existence of its “field source” and “field”. However, the evolution trends of PLE and OI in Chengdu are not necessarily synchronized, and are sometimes even in reverse order, indicating that its “field source” and “field” are not only interdependent but also have the possibility of mutual transformation.The city as an aggregated “spatial landscape“ is itself a product of interaction. Different cities have distinct initial endowments, leading to different evolutionary paths. As a mountainous city, Chongqing has poor interaction with the interiors, resulting in the unbalanced reality of “big city “ and “ big countryside “ and insufficient internal integration. However, as a western inland city, Chongqing is directly connected by the golden waterway of the Yangtze River, which fosters an export-oriented economy and a high level of interaction with the outside world (the dual circulation). After the “BRI” in 2013, it has been further strengthened to release its energy of “a new opening-up height in Western China” through “Yuxinou Railway” and “the New Western Land–Sea Corridor” resulting in a higher level of OI. In addition, a higher OI is manifested by more personnel flow, goods flow, and capital flow, which eventually contribute to such factors as technology, consumption, and investment in the internal comprehensive development level (PLE), pushing up the internal integration and improvement and PLE.In terms of Chengdu, as a plain basin, the interaction between the interiors is much easier than Chongqing, so the internal regional balance is higher than that of Chongqing, and the level of PLE is also higher than that of Chongqing. As a strong “field source”, its radiation capacity is higher than that of Chongqing, but OI in Chongqing is stronger than that of Chengdu. This is due to the fact that our underlying assumption of consistent or negligible radiation resistance does not apply to Chengdu. As an inland city, Chengdu is neither near the border nor close to a major waterway such as the golden waterway of the Yangtze River endowed to Chongqing. As such, Chengdu’s outward radiation resistance is much higher than that of Chongqing. At present, the dual international airports in Chengdu operate to reduce radiation resistance, which is the reality that PLE feeds back OI. However, the airline mainly solves the problem of the flow of personnel and high-tech products. Chengdu is still at a natural disadvantage in the external circulation of general products.The industrial structure coefficients between Chengdu and Chongqing are highly consistent, implying stiff competition between Chengdu and Chongqing in certain industries. On the other hand, from the angle of the CCEC, when Chengdu and Chongqing two central cities are considered holistically, these two cities possess complementary advantages: Chongqing has the advantage in the “external economic connection level” (OI) while Chengdu has the advantage in the “internal comprehensive development level” (PLE). The complementarity of Chongqing and Chengdu ushers in an excellent opportunity to break away from the stiff competition between them and foster joint improvement of their EELs.
- (2)
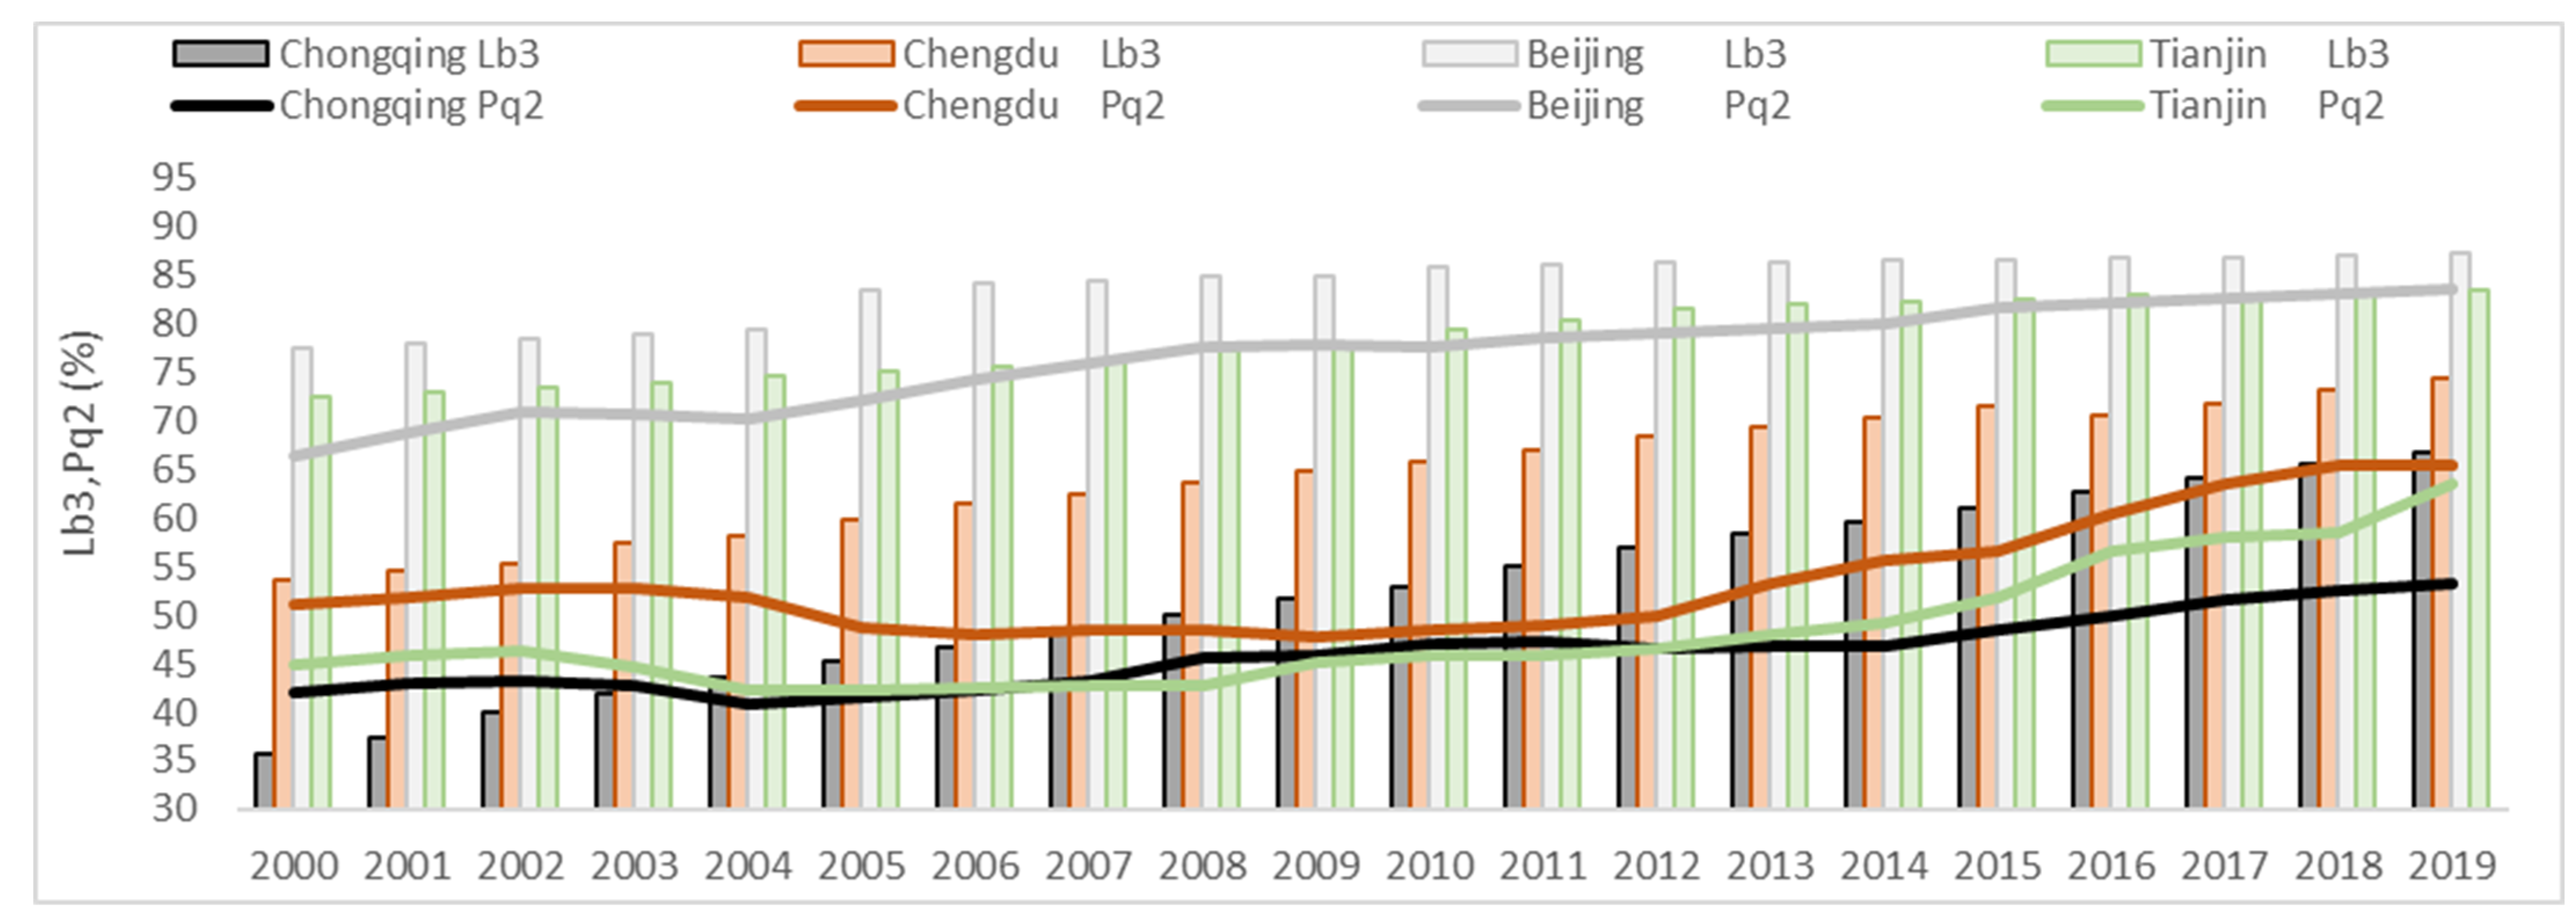
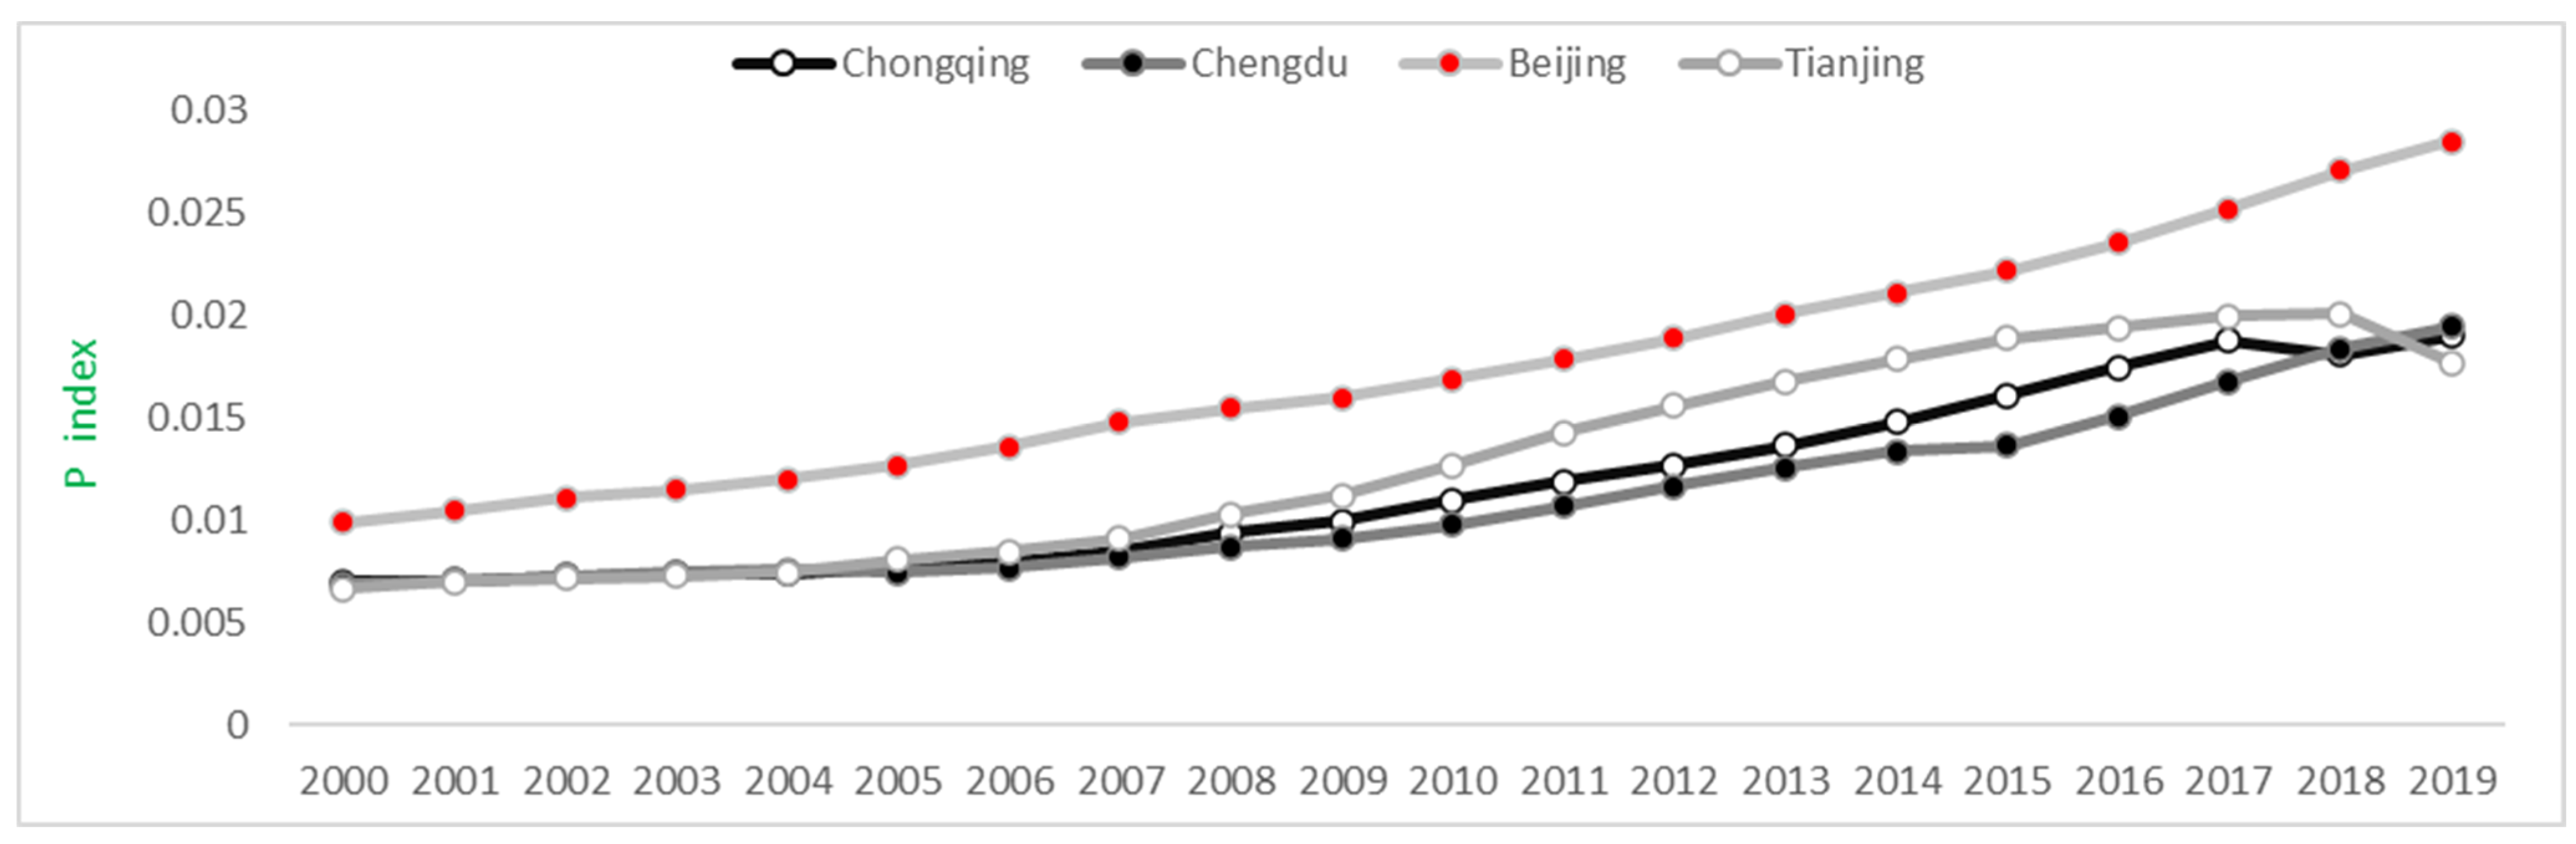
- After introducing the two benchmark cities, Beijing and Tianjin, we note the following: Firstly, for the PLE in Beijing, Tianjin, Chengdu and Chongqing, if only P is considered or the EEL is evaluated purely from the traditional production level, misleading estimations of EELs may be the result as this approach tends to overestimate old industrial bases with traditional manufacturing-oriented industries such as Tianjin and Chongqing. At the same time, it tends to underestimate the roles of life levels and ecological levels, which motivates us to propose our holistic evaluation frame-work in this research. Moreover, from the perspective of the high-quality and sustainable development of the regional economy, Tianjin and Chongqing need to focus on the improvement of L and E. As for the OI, due to the significant impact of globalization in Western China, especially after the “BRI” was implemented, inland opening-up is gradually accelerating and staging a quick catchup. Our proposed integrative evaluation system from the perspective of “field source” and “field” properly captures this trend and predicts a smaller gap in the economic energy level EEL between Eastern and Western China than that under the traditional evaluation method.
- (3)
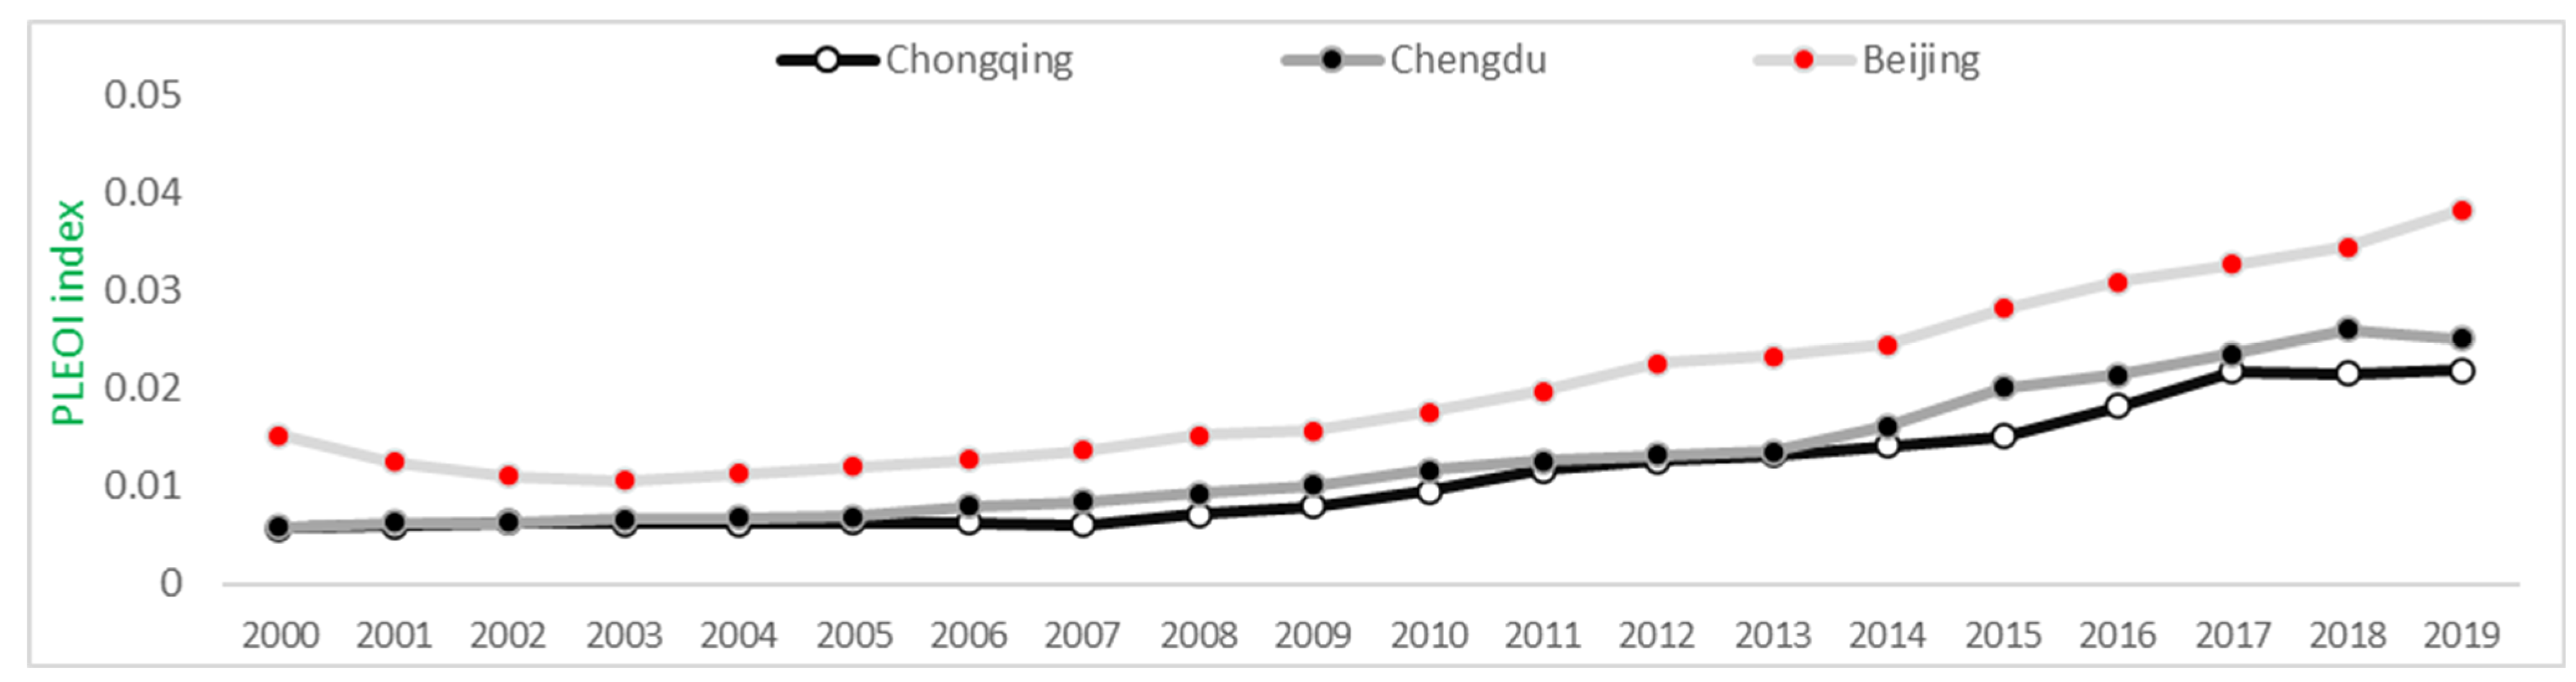
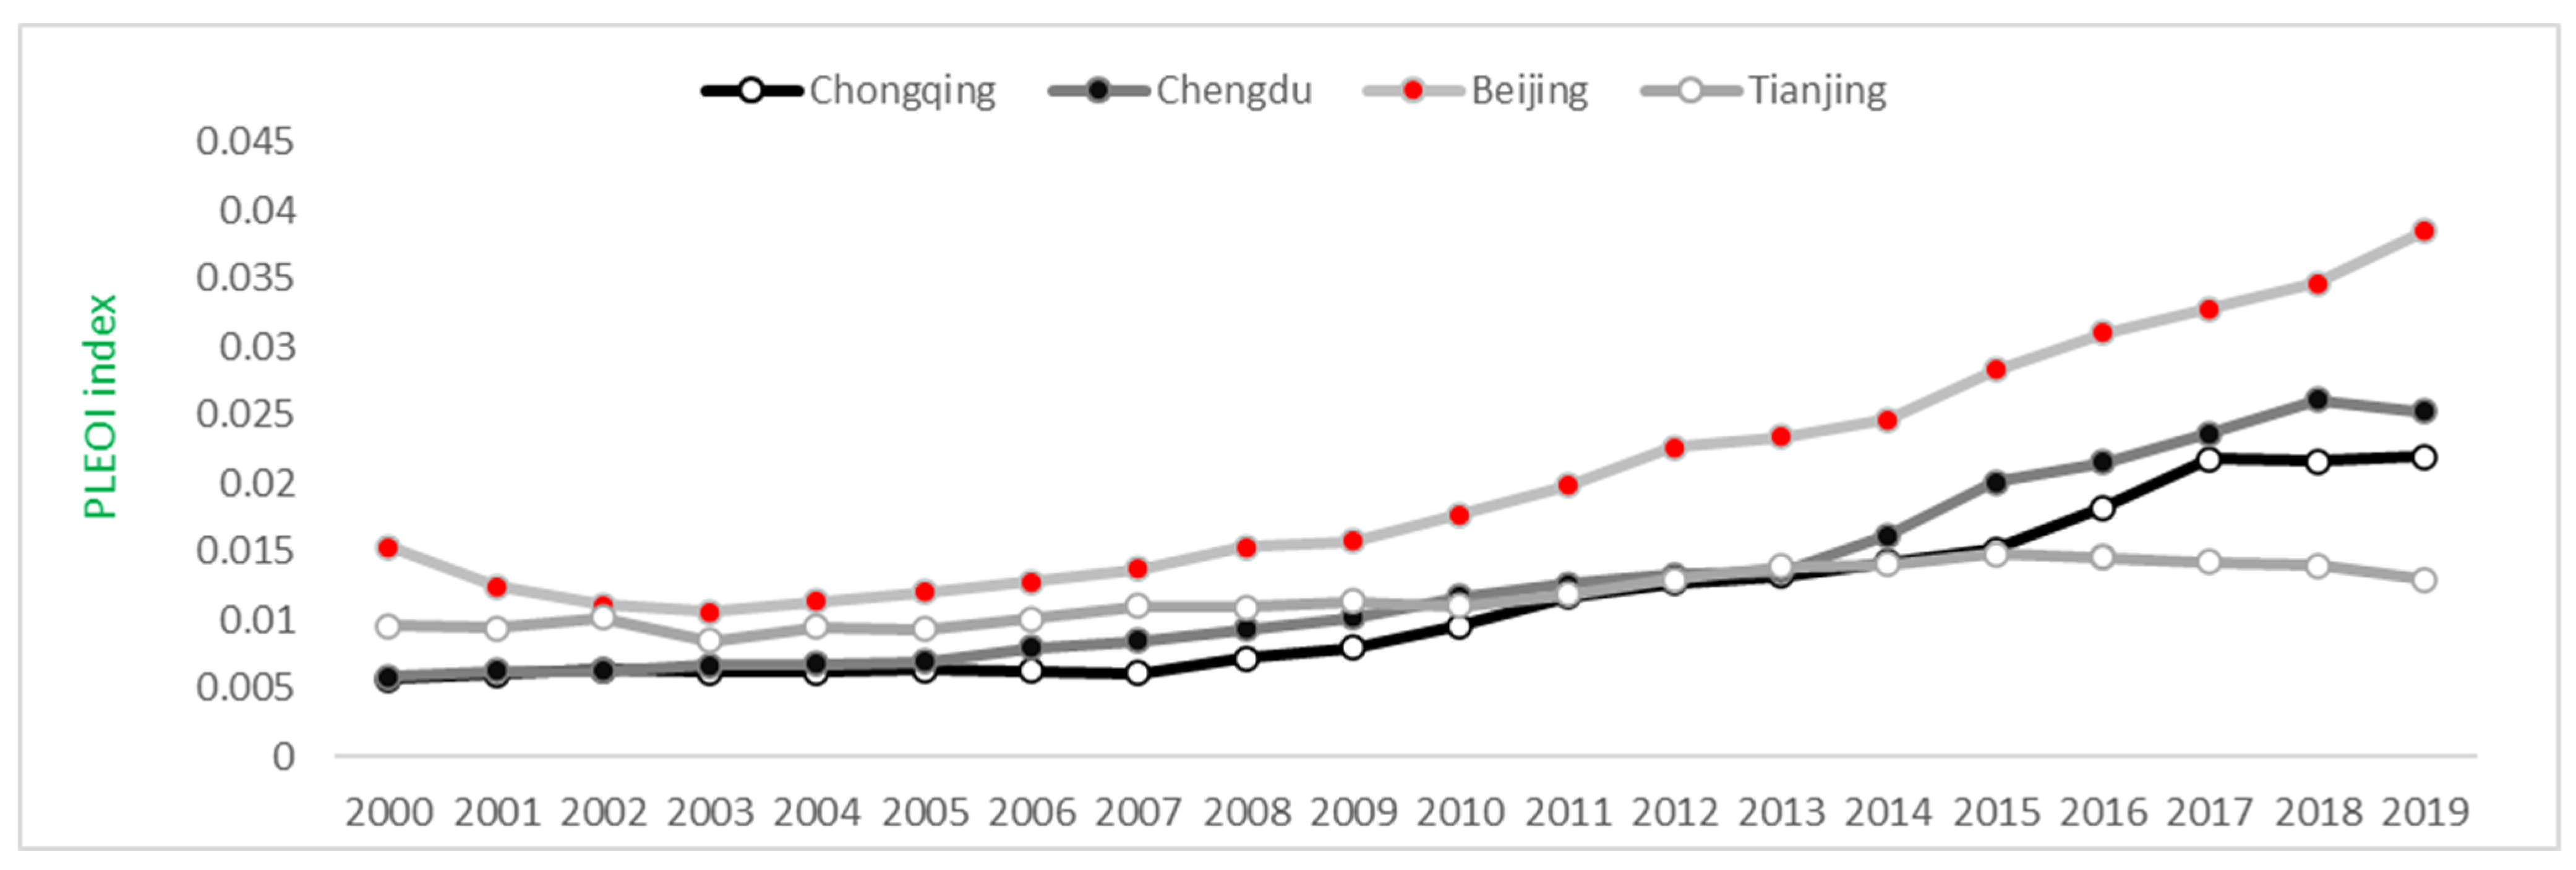
- Judging from the overall indicators of PLEOI (EEL), along the timeline, the EELs of Chengdu and Chongqing have been rising from 2000 to 2018. In 2019, due to deglobalization and the Sino–US trade war, both cities appeared to reach an inflection point. In terms of horizontal comparison, the EELs of the two cities basically overlap and stick to each other, in line with the positioning of Chengdu–Chongqing as the two leading cities in Western China. However, their EELs have been lagging behind those of Beijing, indicating more room for further improvement. After 2013, Tianjin’s EEL gradually declined, falling behind the Chengdu–Chongqing twin cities, and the gap with Beijing’s EEL is getting bigger and bigger, indicating that the economic integration of the Beijing–Tianjin–Hebei region needs to be strengthened, and Beijing is still in the siphoning state in the area.
7. Conclusions and Limitation
Author Contributions
Funding
Institutional Review Board Statement
Informed Consent Statement
Data Availability Statement
Conflicts of Interest
References
- Qu, R.; Rhee, Z.; Bae, S.J.; Lee, S.H. Analysis of Industrial Diversification Level of Economic Development in Rural Areas Using Herfindahl Index and Two-Step Clustering. Sustainability 2022, 14, 6733. [Google Scholar] [CrossRef]
- Dorota, M. Spatial differentiation in the social and economic development level in Poland. Equilib. Q. J. Econ. Econ. Policy 2018, 13, 487–507. [Google Scholar] [CrossRef]
- Borisova, L.; Borisova, D. Assessment of interregional economic integration based on the integral indicator of the level of socio-economic development. E3S Web Conf. 2021, 273, 8102. [Google Scholar] [CrossRef]
- Hryhoruk, M.; Khrushch, N.A.; Grygoruk, S.S. The Rating Model of Ukraine’s Regions According to the Level of Economic Development. Period. Eng. Nat. Sci. 2019, 7, 712–722. [Google Scholar] [CrossRef]
- Deng, M.; Chen, J.; Tao, F.; Zhu, J.; Wang, M. On the Coupling and Coordination Development between Environment and Economy: A Case Study in the Yangtze River Delta of China. Int. J. Environ. Res. Public Health 2022, 19, 586. [Google Scholar] [CrossRef]
- Wang, B.; Wei, Y.; Zhang, B. Dynamic evaluation of China’s economic development level. Stat. Decis. 2022, 38, 105–109. [Google Scholar] [CrossRef]
- Castells, M. Globalization, networking, urbanization: Reflections on the spatial dynamics of the information age. Urban Stud. 2010, 47, 2737–2745. [Google Scholar] [CrossRef]
- Losch, A. The economics of location. Economica 1956, 23, 175. [Google Scholar] [CrossRef]
- Sun, Z. City Function Theory; Economic Management Press: Beijing, China, 1998; pp. 23–36. ISBN 978-780-118-672-0. [Google Scholar]
- Han, Y.; Jiao, H.F.; Li, J.F. Research on Anhui Jianghuai urban agglomeration spatial structure optimization according to the promotion of the city-level. Econ. Geogr. 2010, 30, 1101–1106+1132. [Google Scholar] [CrossRef]
- Zhao, Q.; Wang, B.; Wang, J.Y. Study on energy level gradient distribution structure and regional economic development strategy of urban agglomeration around Bohai economic circle. J. Beijing Jiaotong Univ. 2006, 5, 28–32. [Google Scholar] [CrossRef]
- Han, Y.; Cao, X. A research on measurement and developing trend of coordination degree between city-level and eco-logical environment in the Yangtze River area of Anhui province. Resour. Environ. Yangtze Basin 2015, 24, 909–916. [Google Scholar] [CrossRef]
- Fang, D.; Sun, M. Influence of Core Cities in Yangtze River Economic Belt. Econ. Geogr. 2015, 35, 20+76–81. [Google Scholar] [CrossRef]
- Fang, Y.; Huang, W.; Zhu, H. Research on Pearl River Delta Urban Agglomeration spatial structure in the perspective of the city-level promotion. J. Guangzhou Univ. 2018, 17, 67–73. [Google Scholar] [CrossRef]
- Zhou, Z. Urban function level and modern service industry. J. Soc. Sci. 2005, 9, 11–18. [Google Scholar] [CrossRef]
- Wu, C.; Zhuo, L.; Chen, Z.; Tao, H. Spatial Spillover Effect and Influencing Factors of Information Flow in Urban Agglomerations—Case Study of China Based on Baidu Search Index. Sustainability 2021, 13, 8032. [Google Scholar] [CrossRef]
- Zeng, H. Clarification of the physical definition of a field. Earth Sci. Front. 2011, 18, 231–235. [Google Scholar]
- He, J.; Li, C.; Liu, Y.; Yu, Y. A field source-strength method for interaction scenario in network space of Metropolitan. Acta Geod. Cartogr. Sin. 2015, 44, 805. [Google Scholar] [CrossRef]
- Ren, S. The Merger of cities, city markets and city economic growth. Manag. World 2005, 21, 28–34. [Google Scholar] [CrossRef]
- Zhang, G.; Zhang, A.; Zuo, D. Discussion about city field based on econophysics. Econ. Issues 2016, 38, 18–23. [Google Scholar] [CrossRef]
- Shi, Y.; Pan, Z. Study on spatial pattern optimization of Chengdu-Chongqing economic circle. Reg. Econ. Rev. 2021, 4, 127–134. [Google Scholar] [CrossRef]
- Jin, R.; Gong, J.; Deng, M.; Wan, Y.; Yang, X. A Framework for Spatiotemporal Analysis of Regional Economic Agglomeration Patterns. Sustainability 2018, 10, 2800. [Google Scholar] [CrossRef]
- Lu, X.; Ma, L.; Sun, Z.; Xie, A. Optimization of tourism spatial structure of Beijing-Tianjin-Hebei metropolitan based on the promotion of the urban tourism energy Level. Areal Res. Dev. 2018, 37, 98–103. [Google Scholar] [CrossRef]
- Wang, J. Tourism Field Potential Energy Measurement and Enhancement Strategy Energy for Urban Agglomerations in China. Ph.D. Thesis, Ocean University of China, Qingdao, China, 30 May 2015. [Google Scholar]
- Chen, S.; Chen, D. Haze pollution, government governance and high-quality economic development. Econ. Res. 2018, 53, 20–34. [Google Scholar]
- Ma, R.; Luo, H.; Wang, H.; Wang, T. Study of evaluating high-quality economic development in Chinese regions. China Soft Sci. 2019, 7, 60–67. [Google Scholar] [CrossRef]
- Tu, J.; Kuang, R.; Mao, K.; Li, N. Evaluation on high-quality development level of Chengdu-Chongqing urban agglomeration. Econ. Geogr. 2021, 41, 50–60. [Google Scholar] [CrossRef]
- Gao, X.; Xu, Z.; Niu, F.; Long, Y. An evaluation of China’s urban agglomeration development from the spatial perspective. Spat. Stat. 2017, 21, 475–491. [Google Scholar] [CrossRef]
- Hao, F.; Zhang, S. Transportation infrastructure, economic connection and agglomeration of urban agglomeration in the Yangtze River Delta—An analysis from a spatial perspective. Explor. Econ. Probl. 2021, 42, 80–91. [Google Scholar]
- Song, J.; Guo, C.; Liu, M. Spatial-temporal evolution of economic connection pattern in Shanxi province based on dynamic of highway accessibility. Areal Res. Dev. 2020, 39, 42–46. [Google Scholar] [CrossRef]
- Li, C.; Chen, Y. Comparative analysis of flow intensity and energy level improvement of door type central cities in China. Shanghai Econ. Res. 2012, 24, 30–42. [Google Scholar] [CrossRef]
- Taylor, P.J.; Derudder, B.; Hoyler, M.; Ni, P.; Witlox, F. City-dyad analyses of China’s integration into the world city network. Urban Stud. 2014, 51, 868–882. [Google Scholar] [CrossRef]
- Poncet, S. Measuring Chinese Domestic and International Integration. China Econ. Rev. 2003, 14, 1–21. [Google Scholar] [CrossRef]
- Wang, T.; Xiao, S.; Yan, J.; Zhang, P. Regional and sectoral structures of the Chinese economy: A network perspective from multi-regional input–output tables. Phys. A Stat. Mech. Appl. 2021, 581, 126196. [Google Scholar] [CrossRef]
- Rong, C. Integrated Transport System in China Theory and Application; Economic Science Press: Beijing, China, 2013; ISBN 978-751-413-474-2. [Google Scholar]
- Shen, F.; Huang, W.; Li, D.; Ren, Y.; Huang, Y. Study on the Spatial Pattern and Coupling Degree of Highway Transportation and Economic Development of County Region in Anhui Province. Resour. Environ. Yangtze Basin 2019, 28, 2309–2318. [Google Scholar] [CrossRef]
- Yin, Y.; Xu, Z. The Coupling Synergy Effect of Economic and Environment in Developed Area: An Empirical Study from the Yangtze River Delta Urban Agglomeration in China. Int. J. Environ. Res. Public Health 2022, 19, 7444. [Google Scholar] [CrossRef]
- Fan, F.; Zhang, X.; Yang, W.; Liu, C. Spatiotemporal Evolution of China’s Ports in the International Container Transport Network under Upgraded Industrial Structure. Transp. J. 2021, 60, 43–69. [Google Scholar] [CrossRef]
- Xiao, G.; Zuo, D.; Hailemariam, T. How does China’s industrial structure change affect freight demand? Transp. Res. Rec. 2022, 2676, 417–428. [Google Scholar] [CrossRef]
- Tang, Y.; Wang, C.; Wang, R.; Xue, M.; Li, M.C. Study on the spatial correlation of regional transportation and economic development in the Yellow River Basin. Econ. Geogr. 2020, 1–14. Available online: https://kns.cnki.net/kcms/detail/43.1126.k.20201014.1342.002.html (accessed on 11 May 2022).
- Astakhova, M.; Ignatova, I. Economic Capacity as an Indicator of Sustainable Socio-economic Efficiency of a Business Entity. In Proceedings of the Sustainable Development of Environment after COVID-19, International Scientific and Practical Conference (SDEC 2021), Yekaterinburg, Russia, 14–15 March 2021; Atlantis Press: Paris, France, 2022; pp. 86–91. [Google Scholar] [CrossRef]
- Qiu, J.; Liu, Y.; Chen, H.; Gao, F. Urban network structure of Guangdong-Hong Kong-Macao greater bay area with the view of space of flows: A comparison between information flow and transportation flow. Econ. Geogr. 2019, 39, 7–15. [Google Scholar] [CrossRef]
- Fan, R.; Zhang, H. Evaluation model and promotion strategy of people’s well-being—Based on reliability, structural validity analysis and structural equation model. Econ. Manag. 2012, 34, 161–169. [Google Scholar]
- Chen, H.; Wang, L.; Wei, Y.; Ye, B.; Dai, J.; Gao, J.; Fu, H. The potential psychological mechanism of subjective well-being in migrant workers: A structural equation models analysis. Int. J. Environ. Res. Public Health 2019, 16, 2229. [Google Scholar] [CrossRef]
- Peterson, R.A. A meta-analysis of Cronbach’s coefficient alpha. J. Consum. Res. 1994, 94, 381–391. [Google Scholar] [CrossRef]
- Lu, W. SPSS for Windows Statistical Analysis; Electronic Industry Press: Beijing, China, 2002; ISBN 978-750-537-964-0. [Google Scholar]
- Krista, J.; Tarja, T.; Jaana, P.; Santtu, M. Construct validity of Advanced Practice Role Delineation tool: A confirmatory factor analysis. Int. J. Nurs. Pract. 2022, e13064. [Google Scholar] [CrossRef]
- Huang, L. Research on Resource Conditions and Action Mechanism of Supplier Factor Brand Value Formation. Ph.D. Thesis, Nankai University, Tianjin, China, 30 May 2015. [Google Scholar]
- Sun, Y.; Fan, H.; Liu, Y.; Li, Z. Construction of maritime power evaluation index system based on reliability and validity analysis. J. Shanghai Marit. Univ. 2014, 35, 26–31. [Google Scholar] [CrossRef]
- Kaiser, H.F. An index of factorial simplicity. Psychometrika 1974, 39, 31–36. [Google Scholar] [CrossRef]
- Jackson, D.L.; Gillaspy, J.A.; Purc-Stephenson, R. Reporting practices in confirmatory factor analysis: An overview and some recommendations. Psychol. Methods 2009, 14, 6–23. [Google Scholar] [CrossRef]
- Schumacker, R.E.; Lomax, R.G. A beginner’s guide to structural equation modeling. Technometrics 2004, 47, 522. [Google Scholar] [CrossRef]
- Wang, J.; Niu, F.; Peng, L.; Zhao, J. Fuzzy integral evaluation of urban rail transit financing solutions based on entropy. Archit. Technol. 2018, 49, 1342–1345. [Google Scholar] [CrossRef]
- Sugeno, M. Fuzzy measures and fuzzy integrals—A survey. In Fuzzy Automata and Decision Processes; Gupta, M.M., Saridis, G.N., Gaines, B.R., Eds.; North-Holland: New York, NY, USA, 1977; pp. 89–102. ISBN 044-400-231-6. [Google Scholar]
- Weber, S. Decomposable measures and integrals for Archimedean t-conorms. J. Math. Anal. Appl. 1984, 101, 114–138. [Google Scholar] [CrossRef]
- Murofushi, T.; Sugeno, M. An interpretation of fuzzy measures and the Choquet integral as an integral with respect to a fuzzy measure. Fuzzy Sets Syst. 1989, 29, 201–227. [Google Scholar] [CrossRef]
- Sun, J.; Hu, J.; Liu, Z. New determining principle for λ-fuzzy measure and its application. Comput. Eng. Appl. 2014, 19, 249–255. [Google Scholar] [CrossRef]
- Wang, C.; Huang, C.; Guan, H.; Zeng, T. A Comparative Analysis of Strategic Values of Four Silk-Road International Transport Corridors Based on a Fuzzy Integral Method with Comprehensive Weights. Discret. Dyn. Nat. Soc. 2020, 2020, 4760862. [Google Scholar] [CrossRef]


| Samples (PCs.) | Cronbach’ α |
|---|---|
| 80 | 0.960 |
| Index | CITC | CAID | Cronbach α | Whether the Indicator Is Reserved |
|---|---|---|---|---|
| Oi1 | 0.905 | 0.956 | 0.960 | ✓ |
| Oi2 | 0.879 | 0.957 | 0.960 | ✓ |
| Oi3 | 0.852 | 0.957 | 0.960 | ✓ |
| Ii1 | 0.867 | 0.958 | 0.960 | ✓ |
| Ii2 | 0.967 | 0.956 | 0.960 | ✓ |
| Ii3 | 0.969 | 0.956 | 0.960 | ✓ |
| Ps1 | 0.987 | 0.956 | 0.960 | ✓ |
| Ps2 | 0.824 | 0.960 | 0.960 | ✓ |
| Ps3 | 0.390 | 0.961 | 0.960 | × |
| Ps4 | 0.963 | 0.956 | 0.960 | ✓ |
| Pq1 | −0.606 | 0.962 | 0.960 | × |
| Pq2 | 0.806 | 0.960 | 0.960 | ✓ |
| Pd1 | 0.990 | 0.956 | 0.960 | ✓ |
| Pd2 | 0.982 | 0.956 | 0.960 | ✓ |
| Pd3 | 0.757 | 0.960 | 0.960 | ✓ |
| Ls1 | 0.912 | 0.956 | 0.960 | ✓ |
| Lq1 | 0.967 | 0.956 | 0.960 | ✓ |
| Lq2 | 0.973 | 0.956 | 0.960 | ✓ |
| Lq3 | 0.549 | 0.960 | 0.960 | ✓ |
| Lq4 | 0.746 | 0.960 | 0.960 | ✓ |
| Lb1 | 0.772 | 0.960 | 0.960 | ✓ |
| Lb2 | 0.785 | 0.959 | 0.960 | ✓ |
| Lb3 | 0.854 | 0.960 | 0.960 | ✓ |
| Ei1 | 0.039 | 0.968 | 0.960 | × |
| Eq1 | −0.273 | 0.963 | 0.960 | × |
| Eq2 | 0.110 | 0.961 | 0.960 | × |
| Ep1 | 0.945 | 0.956 | 0.960 | ✓ |
| Ep2 | 0.838 | 0.958 | 0.960 | ✓ |
| Ep3 | 0.912 | 0.956 | 0.960 | ✓ |
| Fitting Degree Index | The Fitting Standard | The Testing Values | ||||||
|---|---|---|---|---|---|---|---|---|
| Good Fitting | Basic Fitting | P | L | E | O | I | PLEOI | |
| Chi-square (χ2) | The smaller the better | NA | 3.10 | 10.1 | 0 | 0 | 0 | 164.2 |
| DF (degree of freedom) | NA | NA | 3 | 8 | 0 | 0 | 0 | 92 |
| Chi-square/df | 1–3 | ˂5 | 1.04 | 1.26 | NA | NA | NA | 1.79 |
| p-value | ˃0.05 | NA | 0.38 | 0.26 | NA | NA | NA | 0.00 |
| GFI (goodness of fit index) | ˃0.9 | ˃0.7 | 0.98 | 0.96 | 1 | 1 | 1 | 0.84 |
| AGFI (adjusted GFI) | ˃0.9 | ˃0.7 | 0.92 | 0.90 | NA | NA | NA | 0.70 |
| CFI (comparative fit index) | ˃0.9 | ˃0.7 | 1 | 1.0 | NA | NA | NA | 0.98 |
| RESEA (root mean square error of approximation) | 0.05–0.08 | 0.1 [52] | 0.02 | 0.06 | NA | NA | NA | 0.10 |
| NFI (normalized fit index) | ˃0.9 | ˃0.7 | 1.0 | 0.98 | NA | NA | NA | 0.95 |
| IFI (incremental fit index) | ˃0.9 | ˃0.7 | 1.0 | 1 | NA | NA | NA | 0.98 |
| TLI (Tucker–Lewis index) is also known as NNFI | ˃0.9 | ˃0.7 | 1.0 | 0.99 | NA | NA | NA | 0.96 |
| OI | PLE | ||||||||||||||||
|---|---|---|---|---|---|---|---|---|---|---|---|---|---|---|---|---|---|
| O | I | P | L | E | |||||||||||||
| Ps | Pq | Pd | Ls | Lq | Lb | Ep | |||||||||||
| Oi1 | Oi2 | Oi3 | Ii1 | Ii2 | Ii3 | Ps1 | Ps2 | Ps4 | Pq2 | Pd1 | Ls1 | Lq4 | Lb1 | Lb3 | Ep1 | Ep2 | Ep3 |
| Index | Objective Weight | Subjective Weight | Comprehensive Weight | Corresponding Upper-Level Indicators | |||
|---|---|---|---|---|---|---|---|
| Second Level | First Level | Criterion Layer | Target Layer | ||||
| Ps1 | 0.349 | 0.442 | 0.459 | Ps | |||
| Ps2 | 0.313 | 0.267 | 0.248 | ||||
| Ps4 | 0.339 | 0.292 | 0.294 | ||||
| Lb1 | 0.703 | 0.563 | 0.753 | Lb | |||
| Lb3 | 0.297 | 0.437 | 0.247 | ||||
| Ps | 0.322 | 0.335 | 0.322 | P | |||
| Pq | 0.364 | 0.368 | 0.400 | ||||
| Pd | 0.313 | 0.297 | 0.278 | ||||
| Ls | 0.532 | 0.299 | 0.488 | L | |||
| Lq | 0.263 | 0.397 | 0.321 | ||||
| Lb | 0.205 | 0.304 | 0.191 | ||||
| Ep1 | 0.349 | 0.300 | 0.326 | E | |||
| Ep2 | 0.247 | 0.420 | 0.323 | ||||
| Ep3 | 0.402 | 0.280 | 0.351 | ||||
| Oi1 | 0.322 | 0.375 | 0.362 | O | |||
| Oi2 | 0.319 | 0.293 | 0.280 | ||||
| Oi3 | 0.359 | 0.333 | 0.358 | ||||
| I i1 | 0.410 | 0.369 | 0.449 | I | |||
| I i2 | 0.215 | 0.318 | 0.203 | ||||
| I i3 | 0.375 | 0.313 | 0.348 | ||||
| P | 0.276 | 0.350 | 0.293 | PLE | |||
| L | 0.274 | 0.340 | 0.282 | ||||
| E | 0.450 | 0.310 | 0.424 | ||||
| O | 0.418 | 0.445 | 0.365 | OI | |||
| I | 0.582 | 0.555 | 0.635 | ||||
| PLE | 0.688 | 0.615 | 0.779 | PLEOI | |||
| O I | 0.312 | 0.385 | 0.221 | ||||
Publisher’s Note: MDPI stays neutral with regard to jurisdictional claims in published maps and institutional affiliations. |
© 2022 by the authors. Licensee MDPI, Basel, Switzerland. This article is an open access article distributed under the terms and conditions of the Creative Commons Attribution (CC BY) license (https://creativecommons.org/licenses/by/4.0/).
Share and Cite
Wang, C.; Song, L.; Lu, H.; Zheng, S.; Huang, C. Assessing the Economic Energy Level of the Chengdu–Chongqing Economic Circle: An Integrative Perspective of “Field Source” and “Field”. Sustainability 2022, 14, 9945. https://doi.org/10.3390/su14169945
Wang C, Song L, Lu H, Zheng S, Huang C. Assessing the Economic Energy Level of the Chengdu–Chongqing Economic Circle: An Integrative Perspective of “Field Source” and “Field”. Sustainability. 2022; 14(16):9945. https://doi.org/10.3390/su14169945
Chicago/Turabian StyleWang, Chengfu, Lijun Song, Haoqi Lu, Shuxin Zheng, and Chengfeng Huang. 2022. "Assessing the Economic Energy Level of the Chengdu–Chongqing Economic Circle: An Integrative Perspective of “Field Source” and “Field”" Sustainability 14, no. 16: 9945. https://doi.org/10.3390/su14169945
APA StyleWang, C., Song, L., Lu, H., Zheng, S., & Huang, C. (2022). Assessing the Economic Energy Level of the Chengdu–Chongqing Economic Circle: An Integrative Perspective of “Field Source” and “Field”. Sustainability, 14(16), 9945. https://doi.org/10.3390/su14169945