Article

Coupling Coordination Development of the Logistics Industry, New Urbanization and the Ecological Environment in the Yangtze River Economic Belt

1
School of Economics and Management, Fuzhou University, Fuzhou 350108, China
2
SEGi College Kuala Lumpur, University of Sunderland, Kuala Lumpur 47810, Malaysia
*
Author to whom correspondence should be addressed.
Sustainability 2022, 14(9), 5298; https://doi.org/10.3390/su14095298
Submission received: 18 March 2022 / Revised: 20 April 2022 / Accepted: 25 April 2022 / Published: 27 April 2022

Abstract

:
Achieving the coordinated development of the logistics industry, new urbanization and the ecological environment is significant for improving the efficiency of the logistics industry, urbanization level and environmental quality, but there are few studies that consider all three together. Based on the panel data of 11 provinces and municipalities in the Yangtze River Economic Belt from 2009 to 2019, this paper constructs the evaluation index system of the logistics industry, new urbanization and the ecological environment. The entropy method, coupled coordination degree model and exploratory spatial data analysis method are used to empirically analyze the spatial and temporal evolution patterns of the coupled coordination of the three systems in the Yangtze River Economic Belt. The results show that: (1) during the study period, the comprehensive development level of each subsystem and composite system in the Yangtze River Economic Belt has been improving, but there are some differences in the development among the systems in each region; (2) the coupling coordination degree of the three shows a smooth upward trend and an overall transition from near incoordination or basic coordination to the level of primary coordination or intermediate coordination, showing a spatial distribution pattern of downstream > midstream > upstream; (3) the spatial agglomeration characteristics show significant positive spatial correlation and agglomeration and are dominated by high–high agglomeration and low–low agglomeration. These reflect the enormous spatial and temporal differences in the coupling coordination of the three systems in the Yangtze River Economic Belt. The study takes the perspective of the coupled and coordinated development of the logistics industry, new urbanization and the ecological environment, which can provide references for enterprises and governments to make sustainable industrial and urbanization development strategies.

1. Introduction

In the process of China’s high-quality economic development, the logistics industry has become one of the pillar industries of the national economy. In recent years, China’s logistics industry development has achieved significant results. The data show that the volume of express business grew from 31.28 billion pieces in 2016 to 83.36 billion pieces in 2020, and the revenue of express business reached 879.5 billion yuan. In addition, the added value of China’s logistics industry reached 415.17 billion yuan in 2020. All these fully illustrate that the logistics industry plays a pivotal role in improving people’s lives, promoting employment, and driving national economic growth. New urbanization is a kind of advanced stage in urbanization, with the basic characteristics of conservation and intensification, industrial interaction, ecological livability, urban–rural integration and harmonious development [1]. Nowadays, the development of urbanization is at high speed, and according to the relevant data from the National Bureau of Statistics, the urbanization rate in China has increased from 17.6% in 1978 to 63.9% in 2020. There is a forecast that China’s urbanization rate will reach 70.12% in 2030, which will far exceed the level of other regions in the world in the same period [2]. The development of the logistics industry and urbanization has given rise to several environmental problems, such as greenhouse gas emissions, fossil and other energy consumption generated by the logistics industry [3], the depletion of natural resources and pollutant emissions caused by urbanization [4]. In fact, there is a dynamic correlation between the logistics industry, new urbanization and the ecological environment that promotes and restricts each other. On the one hand, the continuous development of urbanization has given rise to a large amount of logistics demand in the region, which provides the impetus for the development of the logistics industry in the region. On the other hand, the logistics industry has an important impact on the city’s economy, culture and social life by ensuring the supply of social production and life [5]. In addition, green development is the mainstream development approach today, representing the new development concept of sustainable development. Facing the ecological problems and economic development needs in the context of the environment, the traditional rapid urbanization and industrial development can no longer be met. Both the development of the logistics industry and the construction of new urbanization should follow the concept of green and sustainable development. Thus, it is significant to realize the coordinated development among the logistics industry, new urbanization and ecological environment.
In this context, the harmony between human activities and sustainable development has become a critical academic issue in the study of the “coupled” relationship between humans and nature. The term coupling originates from physics, referring to the physical relationship between two or more elements [6]. Similarly, in economics, coupled coordination refers to the relationship between two or more systems interacting with each other, and this coupling evolves, showing a progression from uncoordinated to coordinated [7]. Systems theory assumes that an integrated system consists of several subsystems, which are interconnected and interact with each other to optimize the system as a whole ultimately [8]. The coordination of urban sustainable development systems has been a hot research topic [9]. A review of the relevant literature reveals that coupled coordination degree models have been widely used in the study of the relationship between urbanization and the ecological environment, such as the coupling between urbanization, resource and environmental systems [10], and the coupling between tourism, urbanization and ecological environment systems [11]. However, the relationship between the logistics industry, new urbanization and ecological environment is rarely studied from the perspective of coupling and coordination. Therefore, the exploration of the relationship between these three is the weak link of the current study. Under the premise of considering the ecological environment, making full use of the factor gathering ability and industrial linkage effect of the logistics industry to promote urbanization and realize the positive interaction and coordinated development of the three systems is the key to the sustainable development of the region.
As one of the three regional development strategies of China’s 13th Five-Year Plan, the construction of the Yangtze River Economic Belt is a major construction task for China. In recent years, the level of urbanization in the Yangtze River Economic Belt has increased, and the logistics industry has also been developing rapidly. At the same time, a series of problems have been created, such as environmental damage and waste of resources. In this context, the state attaches great importance to the development of new urbanization, logistics industry, the ecological environmental protection and their mutual promotion relationship in the Yangtze River Economic Belt. It has successively issued documents such as “Guidance on Promoting the Development of Yangtze River Economic Belt by Relying on the Golden Waterway”, “Outline of the Development Plan of Yangtze River Economic Belt” and “Ecological Environmental Protection Plan of Yangtze River Economic Belt”, proposing to vigorously protect the ecological environment of the Yangtze River, innovate and drive industrial transformation and upgrading and actively promote the new urbanization [12]. With the support of national policies and environmental regulations, what is the degree of coordinated development of the logistics industry, new urbanization and ecological environment in the Yangtze River Economic Belt? Has it been effective? What are the differences between different provinces and municipalities? These are what this study will explore.
This study has the following objectives: (1) To compare and evaluate the comprehensive development levels of the logistics industry, new urbanization and ecological environment subsystems in the Yangtze River Economic Belt during the study period. (2) To measure the degree of coordination among the logistics industry, new urbanization and ecological environment in the Yangtze River Economic Belt and analyze their spatial and temporal evolutionary characteristics. (3) To examine the spatial autocorrelation of the coupling and coordination of logistics, new urbanization and ecological environment in the Yangtze River Economic Belt and analyze their spatial clustering characteristics.
The contributions of this study are as follows. First, a comprehensive system evaluation index system consisting of three subsystems: the logistics industry, new urbanization and ecological environment is constructed, and its coupling coordination degree is analyzed to fill the study gap in this area; second, the spatial and temporal evolution characteristics of the coupling coordination among these three in the Yangtze River Economic Belt are studied to provide important support for the coordinated and sustainable development of the Yangtze River Economic Belt region and the construction of a beautiful China.
The rest of the paper is organized as follows. Section 2 is a literature review, which focuses on the literature related to the relationship between the logistics industry, new urbanization and ecological environment. Section 3 introduces the materials and methods of the study, including data selection, construction of the evaluation index system and a description of the research methodology. Section 4 presents the results based on the model proposed in Section 3 regarding the integrated level of development of the subsystems, the degree of coupling and coordination of the three systems and spatial autocorrelation. Section 5 provides a discussion and puts forward relevant recommendations based on the study results. Section 6 summarizes the main conclusions of the paper.

2. Literature Review

2.1. Relationship between Logistics Industry and New Urbanization

The research on the relationship between these two can be roughly divided into two categories. One category explores the influence of one party on the other, while the other is to evaluate the degree of coordinated development between the two. For the former, scholars have found that the impact of the logistics industry on new urbanization is manifested in promoting population urbanization and driving employment. Wang et al. analyzed the impact of logistics on urbanization in special hardship areas, in which the role of road mileage in the development of population urbanization was significant [13]. Chhetri et al. used principal component analysis and spatial autocorrelation models to analyze relevant data from Australia and found that there were spatial clusters of logistics employment in the west and south of Melbourne [14]. While the impact of new urbanization on the development of the logistics industry is mainly reflected in efficiency improvement and technological innovation. Zhang used a DEA model to investigate the impact of new urbanization on logistics productivity and found that new urbanization significantly improves logistics productivity by improving transportation networks and unleashing the consumption potential of the population [15]. Wolpert and Reuter showed that urbanization has led to a near saturation of road infrastructure, which can prompt urban logistics to respond to the challenges through innovative approaches [16]. For the latter, the research perspectives and conclusions are more diversified. For example, the interaction between the logistics industry and urbanization is elaborated from the perspective of supply chain urbanization [17]. Some studies have explored the degree of coupling between the two and the hysteresis phenomenon from the perspective of coupling and coordination [18]. Among them, Pu et al. analyzed the spatio-temporal coupling and evolution mechanism of urban logistics spreading and urbanization in China and concluded that the degree of correlation between the two showed the change of uncorrelated-negative–positive correlation, and the level of coupling and coordination was continuously improved [19]. Before conducting the coupling and coordination analysis, the construction of an evaluation index system was the key. Wu constructed a logistics subsystem from three aspects: logistics capacity, development scale and demand situation, and a new urbanization subsystem from four aspects: economic, demographic, social and ecological to evaluate the coupling and coordination relationship between the two [20]. In addition, there is also a study showing that the development of China’s logistics industry and urbanization construction have a co-integration relationship and can achieve good synergistic interaction [21].

2.2. Relationship between New Urbanization and Ecological Environment

The discussion on the relationship between the two can be divided into theoretical and empirical aspects. In terms of theoretical research, since Howard (1898) first proposed the concept of the “idyllic city” [22], many scholars have researched the mechanism of coordinated development of urbanization and the ecological environment and put forward relevant theories. For example, the “Northam curve” [23], “environmental Kuznets curve” [24] and “pressure-state-response” model [25]. In China, there is, the “social-economic-natural complex ecosystem” theory [26], “urban ecological library” [27], “sustainable urban development” theory [28] and “coupling magic square” theory [29]. These have greatly enriched the theoretical results between new urbanization and ecological environment and laid the foundation for empirical research. In terms of empirical evidence and research themes, they mainly include the following: first, urbanization has a negative impact on the ecological environment, such as water pollution [30], atmospheric pollution [31] and the reduction of regional diversity [32]; secondly, urbanization has a positive impact on the ecological environment, which is manifested as the improvement of the ecological environment [33,34]; thirdly, the impact of urbanization on the ecological environment is characterized by stages; that is, the direction and degree of impact on the environment change at different development stages of urbanization [35,36]. The evaluation of the coordinated development of new urbanization and the ecological environment is mostly measured by the degree of coupling coordination. Ariken et al. established the Remote Sensing Ecological Index (RSEI) to study the coupling of urbanization and eco-environmental systems in the urban areas of the Yanqi basin, and the results showed that there is a moderate imbalance in the development of the two systems in the study area [37]. In fact, one problem in a system can directly or indirectly affect another system, eventually leading to the imbalance or even collapse of the whole system’s development. For example, due to rapid urbanization and population growth, the ecological environment deteriorates, the carrying capacity of ecological factors decreases and scarce resources make the cost of production and living increase, which eventually leads to a slowdown in the pace of urbanization [38]. For modern smart cities, their main concerns include the maintenance of ecosystems through pollution reduction and efficient use of resources, in which policies and broad citizen participation must be considered [39].

2.3. Relationship between the Logistics Industry and Ecological Environment

Most scholars tend to disagree about the relationship between the two from environmental regulation, low carbon and the relationship between environment and logistics performance. In terms of environmental regulation, there is more research discussing it as one of the factors influencing the development of the logistics industry. However, the conclusions obtained are not the same due to the inconsistent selection of research methods and measurement indicators. Some scholars believe there is a positive relationship between environmental regulation and logistics industry development, which is reflected in policy incentives and green technology innovation [40,41]. Zhang et al. used carbon emissions from the logistics industry and the value-added of the logistics industry as an environmental regulation indicator and found that the degree of environmental regulation has a significant contribution to logistics efficiency [42]. Another group of scholars holds the opposing view that there is a negative impact of environmental regulation on the development of the logistics industry, which is manifested in terms of additional costs, leading to the rise of enterprise management and administration costs and the difficulty of balancing technological innovation with the improvement of the production level [43,44]. As for low-carbon logistics, it mainly includes research on the problems and coping strategies of logistics industry development in the low-carbon context [45,46] and the research of incorporating carbon emissions into the evaluation system of logistics efficiency [47,48]. In addition, some scholars have also used coupled coordination models to study the relationship between regional logistics and ecological environment coordinated development from a low-carbon perspective. Zhou evaluated the coordinated development of regional logistics and ecological environment complex systems from input and output and resource and environment levels, respectively [49]. Bao and Li constructed a coupled index system of carbon emissions, energy consumption and the ecological environment to analyze the degree of coordinated development of carbon emissions in the logistics industry and ecological environment in the Beijing–Tianjin–Hebei region [50]. Regarding the relationship between environment and logistics performance, Lu et al. constructed the Environmental Logistics Performance Indicator (ELPI) using data from a sample of 112 countries to assess the overall performance of these sample regions in terms of green transport and logistics practices [51]. Xu constructed a system of indicators for environmental policy and eco-logistics performance to test the mechanisms of their effects [52]. The growing research on the relationship between logistics development and the ecological environment is helpful for future research.

2.4. Relationship between the Logistics Industry, New Urbanization and Ecological Environment

There are relatively few studies on the coordinated development of the composite system constituted by these three, and some studies take carbon emissions as the entry point to analyze the dynamic relationship between logistics industry growth, urbanization and carbon emissions [53,54,55]. Gong and Zhu analyzed the impact of the logistics industry network construction on urbanization development in a low-carbon economy. They concluded that the interaction between the development of the low-carbon logistics industry and urbanization construction forms a feedback system, and the development of a low-carbon logistics industry can deploy urban functions and reduce its impact on the environment [56]. In addition, some scholars have also explored the relationship between the three from other dimensions. Guo et al. researched the relationship between air pollutant emissions, logistics services and urban population growth [57]. Shee et al. empirically investigated the stratified impact of smart logistics on the sustainability dimensions (i.e., environmental, social and economic) of smart cities. Their empirical results indicate that smart logistics have an immediate positive impact on the smart city environment, which, in turn, has a positive impact on social and economic performance [58]. Cao argues that the problems of exhaust, noise and traffic congestion caused by logistics have a negative impact on the urban environment, and, therefore, an effective mechanism for evaluating the sustainability of the urban logistics industry is necessary [59].
By reviewing the related literature, we can find that scholars have provided fruitful research results on the relationship between the logistics industry, new urbanization and ecological environment. This is reflected in the continuous enrichment in the definition of relevant concepts and the design of the evaluation index system, as well as the diversification of research perspectives. However, a few points still need to be further expanded, which are summarized as follows: First, from the perspective of research, for the two systems, scholars focus on the influence of one party on the other. In fact, as two independent and interconnected systems, their relationship is not only one-way but also a two-way interaction. Secondly, from the research content, relevant research focuses on analyzing the relationship between the two systems, while there is a lack of studies exploring the coupled and coordinated development of the logistics industry, new urbanization and ecological environment as a whole. In practice, urbanization requires large amounts of human, material and financial resources, which the logistics industry can provide. At the same time, this process will inevitably impact the environment. This shows that the logistics industry, new urbanization and ecological environment are not isolated, and dealing with the relationship between the three is an important issue facing China in achieving sustainable development [60]. The Yangtze River Economic Belt is one of the most dynamic and potential core areas in China’s economic development pattern. During the rapid development of industry and urbanization, the ecological environment has been damaged to varying degrees, and uncoordinated development has occurred among the three. Therefore, studying the relationship between the logistics industry, new urbanization and ecological environment in the Yangtze River Economic Belt is crucial. Given this, this paper constructs an evaluation index system for the logistics industry-new urbanization-ecological environment system on the basis of relevant study results. It also uses comprehensive evaluation models, coupling the coordination degree model and exploratory spatial data analysis methods to research the comprehensive development level, dynamic coupling and coordination of the three systems in the Yangtze River Economic Belt, as well as the spatial variability and development trend of their coupling and coordination levels. This extends and complements the existing related research and is expected to provide a theoretical basis and decision-making reference for the coordinated and sustainable development of the logistics industry, new urbanization and ecological environment in the Yangtze River Economic Belt.

3. Materials and Methods

3.1. Indicators Selection and Data Sources

3.1.1. Indicators Selection

The logistics industry, new urbanization and ecological environment form a complex system, and the study of the coupling relationship among them requires reliable and in-depth scientific analysis. The selection of indicators in this paper includes the following steps.
First, since there is no complete and comprehensive set of evaluation index systems for the logistics industry, new urbanization and ecological environment, this study reviewed the literature on the coupling of the logistics industry and new urbanization [18,61], new urbanization and ecological environment [62,63] and the logistics industry and ecological environment [49], and initially constructed the evaluation index dimensions of the three systems.
Next, based on the literature results and consultation with experts, the first-level indicators for each of the three systems were identified. Among them, the indicator system of the logistics industry includes two aspects. On the one hand, it is the infrastructure of the logistics industry that can play a role in guaranteeing the development of the logistics industry; on the other hand, it is the scale of logistics industry development, which reflects the effectiveness achieved by the development of the logistics industry. For China’s new urbanization, many scholars have studied it from population urbanization, economic urbanization, social urbanization and spatial urbanization. We follow this framework and construct the main indicators from four perspectives. Population urbanization is a manifestation of urban population concentration, economic urbanization is a manifestation of urban economic development, social urbanization reflects the improvement of urban infrastructure and spatial urbanization reflects the change of land use in urbanization. The index system of the ecological environment includes three aspects. First, the ecological environment’s status, which is a reflection of the ecological status and development level. Second, ecological environment pressure, which is expressed as the emission of wastewater, waste gas and waste residue. Third, ecological environment response, which reflects the government’s attention to environmental pollution control and the measures taken.
Then, according to the actual situation of the Yangtze River Economic Belt, based on the principles of science and accessibility, the secondary indicators were screened using the frequency statistics method. After being adjusted in consultation with experts, the secondary indicators of each system were determined.
Finally, the final composite system evaluation indicator system was determined. The logistics industry indicator system consists of 2 primary indicators and 9 secondary indicators. The new urbanization indicator system consists of 4 primary indicators and 12 secondary indicators. The ecological environment indicator system consists of 3 primary indicators and 9 secondary indicators. On this basis, the entropy method is applied to determine the weight of each indicator, the detailed indicators and their respective weights are shown in Table 1.

3.1.2. Data Sources

This paper takes 11 provinces and municipalities in the Yangtze River Economic Belt as the study object, with the study years from 2009 to 2019. Therefore, we used 11 years of provincial-level data from the relevant regions. To ensure the continuity and authenticity of the data, the data of relevant indicators are mainly obtained from the China Statistical Yearbook (2009–2019) and the China Environmental Statistical Yearbook (2009–2019), as well as statistical yearbooks of provinces or municipalities of the Yangtze River Economic Belt (2009–2019), and statistical bulletins of national economic and social development (2009–2019).

3.2. Methods

3.2.1. The Entropy Method

The entropy method is an objective assignment method that determines the weights based on the magnitude of the information loadings of each variable [64,65], and its main calculation steps are as follows.
First, a sample standardization matrix is constructed.
Assume that the number of evaluation objects is n and the number of evaluation indicators is m. For positive-type indicators:
Y i j = X i j m i n ( X j ) m a x ( X j ) m i n ( X j )
For inverse-type indicators:
Y i j = m a x ( X j ) X i j m a x ( X j ) m i n ( X j )
where X i j is the original data of the indicator, m a x ( X j ) is the maximum value of the j-th indicator data, m i n   ( X j ) is the minimum value of the j-th indicator data and Y i j is the normalized data value.
Second, the information entropy value of each indicator is calculated.
Find the information entropy value:
E j = 1 l n ( n ) i = 1 n p i j l n p i j
The p i j value is calculated as follows:
p i j = Y i j i = 1 n Y i j
where n is the number of evaluation objects and E j is the information entropy value of the index.
Third, find the weight of each indicator.
Find the coefficient of variability of each indicator based on the information entropy value:
g j = 1 E j
Then find the weights W j :
W j = g j j = 1 m g j
where m is the number of indicators and W j is the j-th indicator weight.
Fourth, seek the comprehensive development index.
The CDA is the quantitative value of the level of comprehensive development and is calculated as follows:
    U i = j = 1 m W j Y i j
where U i denotes the comprehensive development index of the i-th evaluation object; W j denotes the weight of the j-th indicator; Y i j is the standardized data value.

3.2.2. The Coupling Coordination Degree Model

The coupling coordination degree is used to measure the degree of harmony and consistency between systems or between elements within the system in the development process [66,67]. Let U 1 , U 2 , U 3 represent the comprehensive indices of the development level of the logistics industry, new urbanization and ecological environment, respectively, and obtain the coupling degree model as follows:
C = 3 × ( U 1 × U 2 × U 3 ) 1 / 3 U 1 + U 2 + U 3
In the above equation, the coupling degree C takes a range of [0, 1], the closer the value of C is to 1, the higher the coupling degree and the stronger the correlation between systems, the closer C is to 0, the lower the coupling degree, that is, the weaker the correlation between systems.
Although the coupling degree can reflect the strength of inter-system interactions, it cannot reflect the level of coordinated development between systems. Therefore, the coupling coordination degree model needs to be introduced:
T = a U 1 + b U 2 + c U 3
D = ( C × T ) 1 / 2
where D denotes the coupling coordination degree, C denotes the coupling degree, T denotes the reconciliation coefficient of the three systems; a, b, c are the pending coefficients of the three systems in turn, a + b + c = 1 . In this paper, the three systems of the logistics industry, new urbanization and ecological environment are considered to play the same role in the overall coordinated development of the Yangtze River Economic Belt, so they all take the value of 1/3. The criteria for dividing the coupling coordination degrees are shown in Table 2 [68].

3.2.3. The Exploratory Spatial Data Analysis

Exploratory spatial data analysis (ESDA) is a method for studying the spatial distribution relationships of elements, including global spatial autocorrelation and local spatial autocorrelation [69,70].
The global spatial autocorrelation mainly adopts the global Moran index to reflect the factor clustering of spatial units. The calculation formula is as follows:
I = n i = 1 n j = 1 n W i j ( x i x ) ( x j x ) i = 1 n j = 1 n W i j i = 1 n ( x i x ) 2
where I is the global Moran index; n is the number of spatial units; x i , x j are the spatial unit observations; w i j is the spatial weight matrix. The values of the Moran index range in [−1, 1], and the closer the value is to 1, the higher the spatial agglomeration, the closer it is to −1, the higher the spatial dispersion, and the closer it is to 0, the higher the spatial randomness.
The local spatial autocorrelation mainly uses the local Moran index to examine the variability of the local area spatial units from the neighboring spatial units. The calculation formula is as follows:
I i = ( x i x ¯ ) S 3 j = 1 n W i j ( x j x ¯ )
where I i is the local Moran index, and the other variables have the same meaning as before. If I i is positive, it means that the spatial difference between the region and its neighboring region I is not significant; if I i is negative, it means that the spatial difference between the region and its neighboring region I is significant.

4. Results

4.1. Analysis of the Level of Development of Subsystems and Comprehensive Systems

The respective comprehensive development indices of the logistics industry, new urbanization and ecological environment in the Yangtze River Economic Belt are measured according to the entropy method and Equation (7), the comprehensive evaluation value common to the three systems is measured according to Equation (9) and the results obtained are shown in Figure 1, Figure 2, Figure 3 and Figure 4.
In terms of the logistics industry subsystem (Figure 1), the development level of logistics in each region has been developed to different degrees between 2009 and 2019. Overall, it shows a trend of a low starting point and gradually expanding horizontal differences. In 2009, the evaluation value of the logistics industry in each region was around 0.1. As time goes by, the gap between regions becomes more and more obvious. Among them, the downstream region of the Yangtze River Economic Belt (Zhejiang, Jiangsu, etc.) has a rapid development in the logistics industry due to its high level of economic development, excellent infrastructure, such as highways and railroads, as well as its superior geographic location, and the greater influence of opportunities, such as Internet shopping, especially Zhejiang Province, relying on its good industrial foundation. While the middle and upper reaches of the region, especially Yunnan and Guizhou, due to their remote location and more backward transportation facilities, make the logistics industry development level low, only showing a slow upward trend and increasing the gap with the downstream areas.
In terms of the new urbanization subsystem (Figure 2), new urbanization development in 11 provinces and municipalities in the Yangtze River Economic Belt is relatively slow, and the gap between regions is gradually narrowing. Among them, the downstream region represented by Shanghai is still at the forefront after 11 years of development, which is due to the fact that the downstream region has maintained a higher level of urbanization development. As shown in Figure 2, the gap between Shanghai, the highest-rated value, and Chongqing, the lowest-rated value, was 0.291 in 2009. By 2019, the gap between the urbanization development levels of each region has narrowed, and the difference between the maximum and minimum values is 0.244. One possible reason for this is that with the introduction of the Yangtze River Economic Belt concept, there are closer economic ties between the relevant provinces and cities, and the trend of the urban division of labor has come to the fore, which, in turn, has promoted the development of new urbanization in each province and city within the scope. In addition, the development of new urbanization has been highly valued, and the state has introduced a series of relevant policies to support it; further, urban public service capacity, infrastructure construction and urbanization construction has achieved great results, and the gap between provinces and municipalities has been decreasing.
In terms of the ecological environment subsystem (Figure 3), the ecological environment level of each region starts from a high level and shows a fluctuating upward trend. As can be seen from Figure 3, the ecological environment evaluation value of each region in 2009 was concentrated between 0.3 and 0.5, which is higher compared to the evaluation value of the logistics industry and new urbanization, which indicates that all provinces and municipalities in the Yangtze River Economic Belt have a better ecological foundation. This is due to the strong awareness of environmental protection, and the development of regions in response to the national development concept of “green water and green mountains are the silver mountain of gold” [71]. In terms of the upward trend, there are certain fluctuations in all regions. Although Zhejiang Province, as a downstream region, is still at the highest level, the middle and upper regions, represented by Jiangxi and Chongqing, also maintain a high level, and regional differences are no longer particularly obvious. In particular, the ecological environment level of Guizhou province has improved more between 2009 and 2019, and its evaluation value has risen from 0.365 to 0.686, surpassing the downstream regions, such as Shanghai and Jiangsu. This also indicates to some extent that the ecological environment level in the downstream areas with a more developed economy, better industrial base and higher urbanization level is not necessarily higher than in the upstream areas, and attention should be paid to the protection of the ecological environment while developing the economy.
In terms of the comprehensive evaluation values of the three systems of the logistics industry, new urbanization and ecological environment (Figure 4), the upward trend of the comprehensive development level of the three systems in each region of the Yangtze River Economic Belt is steady, and the overall trend is getting better. Horizontally, the spatial differences among provinces and municipalities gradually stabilize, showing an overall regional difference of downstream > midstream > upstream. Zhejiang Province has the highest comprehensive development level because it maintains a high level of development in all subsystems. While Guizhou Province has a better development in the ecological environment subsystem, its logistics industry and new urbanization system are relatively poorly developed, so its comprehensive development level is still the lowest. From a vertical perspective, the overall comprehensive development of the logistics industry, new urbanization and ecological environment in the Yangtze River Economic Belt tend to be optimized, thanks to the strong support of national policies and the attention of local governments, which makes the comprehensive development quality steadily improve. Overall, the highest level of development was in the ecological system, followed by the new urbanization system, and finally, the logistics industry system, indicating that the government’s call for ecological protection is being practiced.

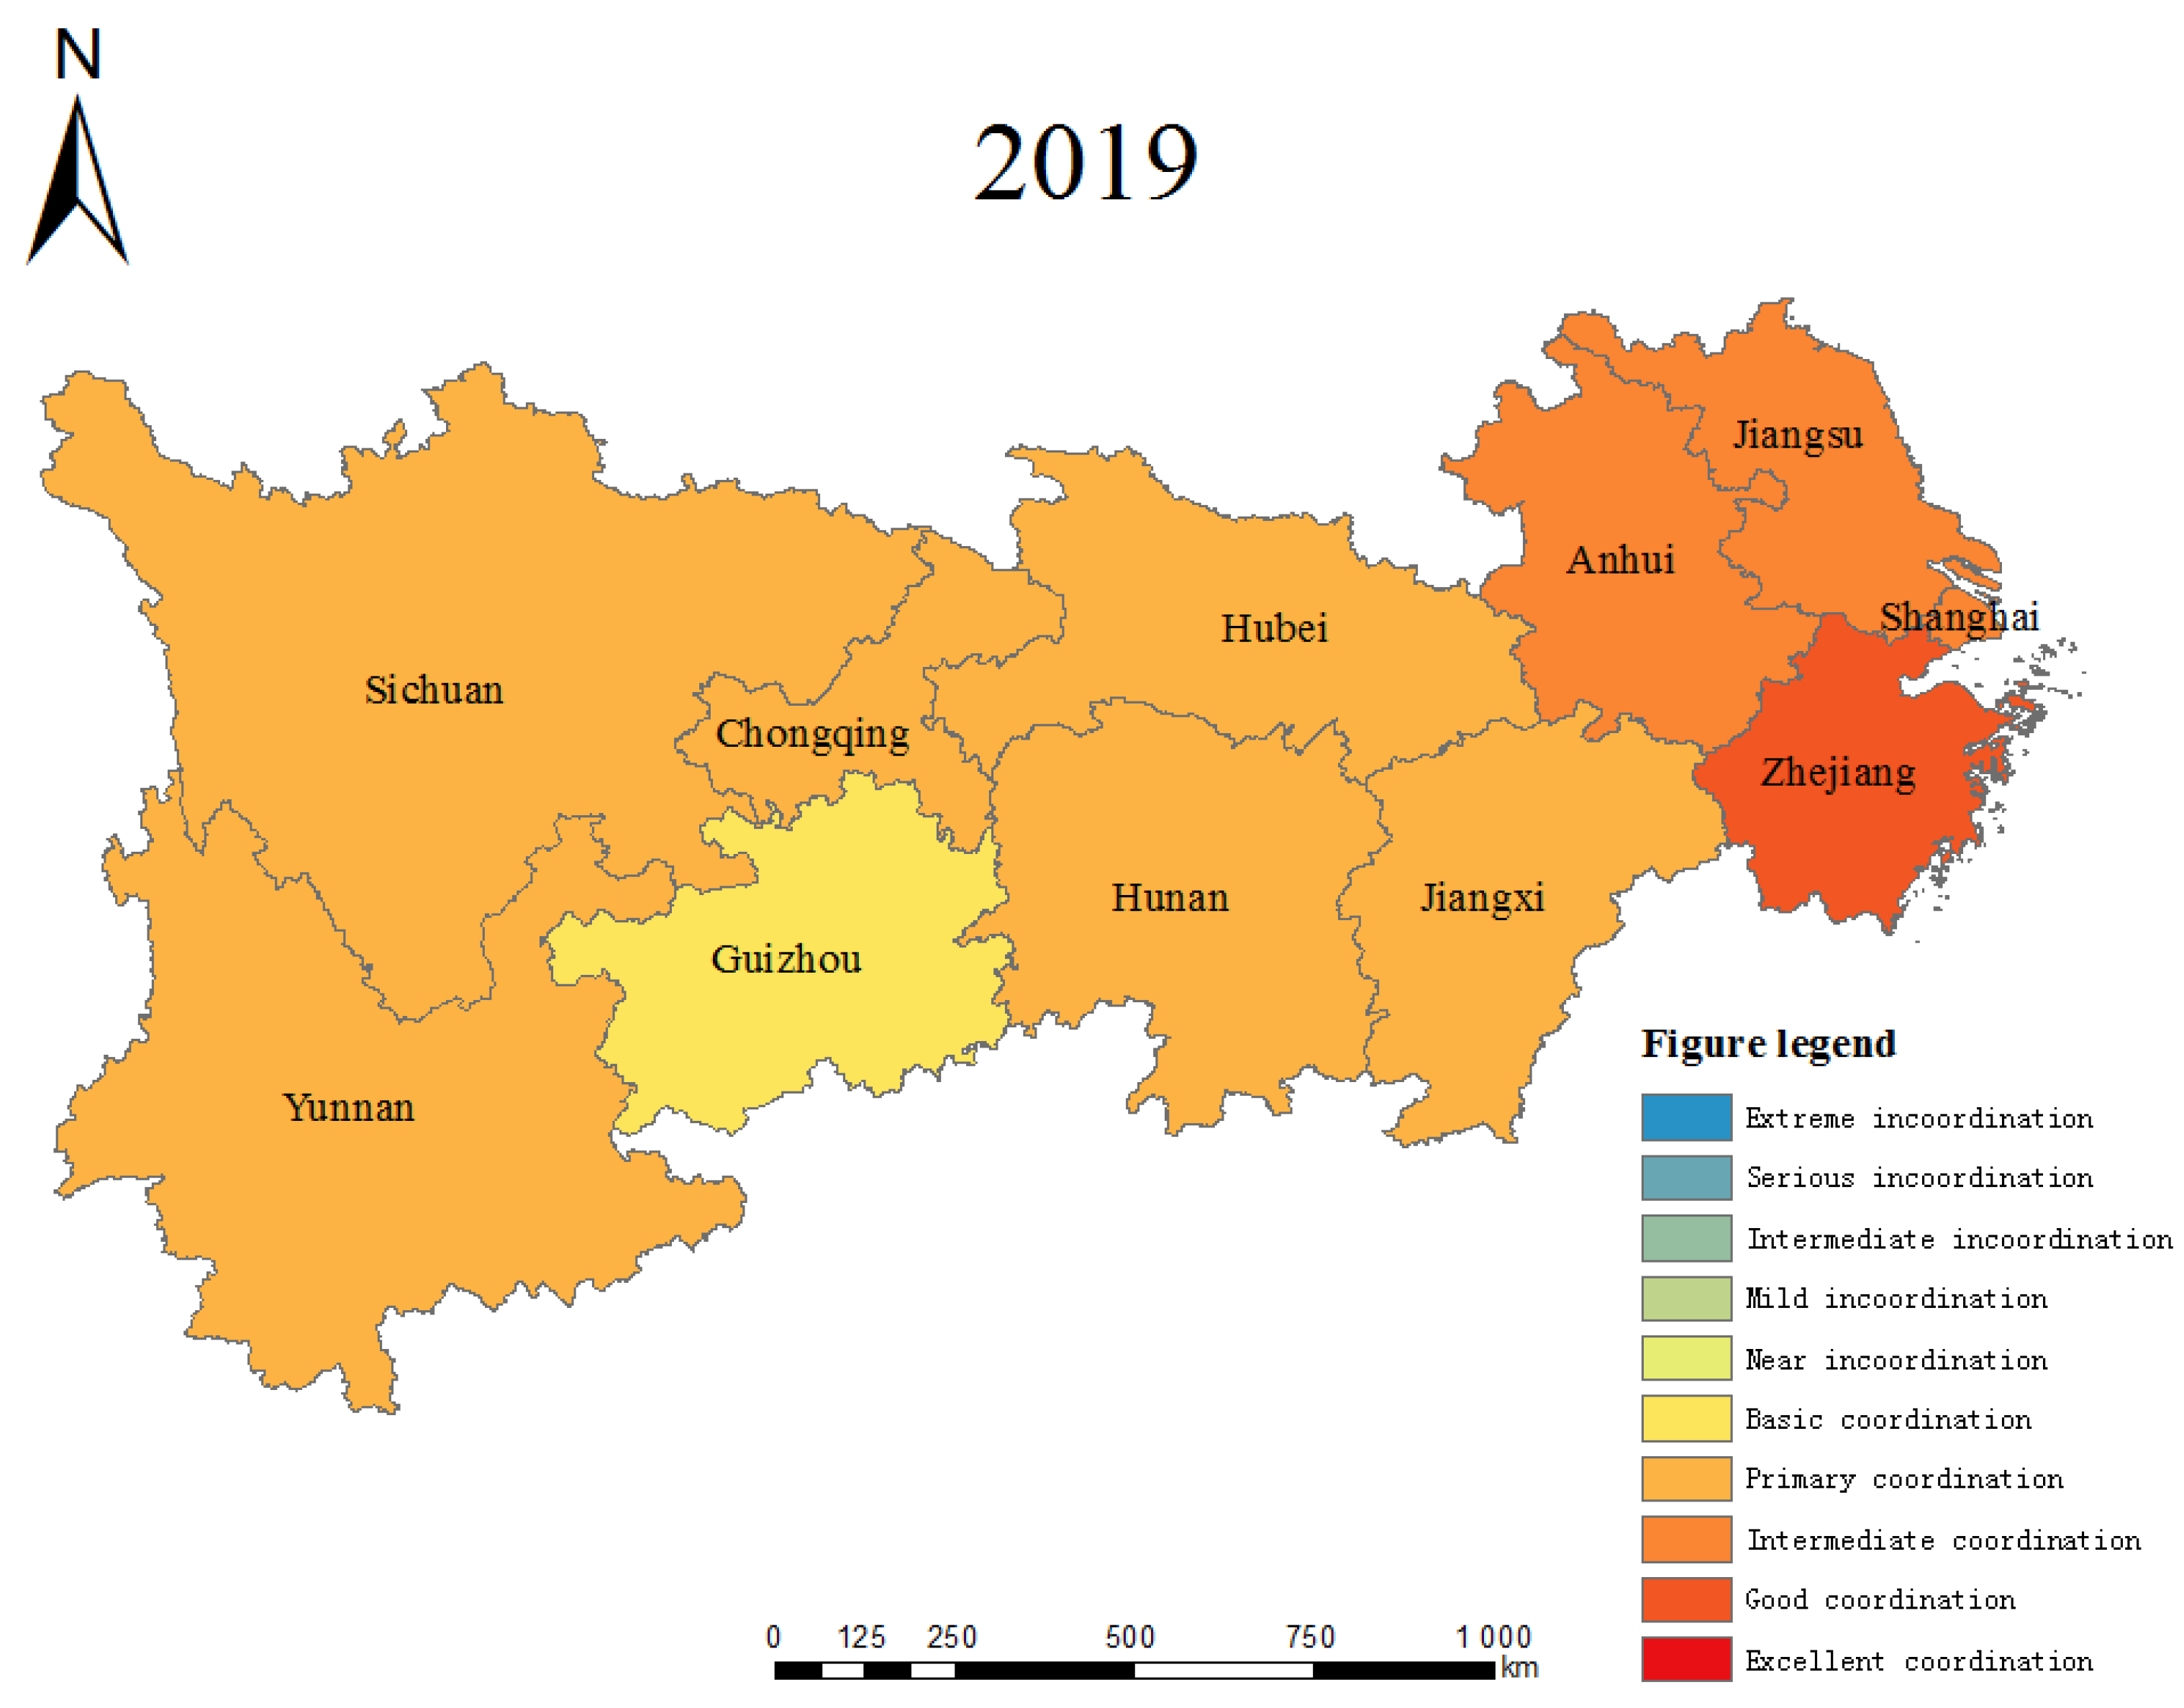
4.2. Analysis of the Spatial and Temporal Evolution of the Coupling and Coordination of the Logistics Industry, New Urbanization and Ecological Environment

According to the coupling coordination degree model, as shown in Equation (10), the results of coupling coordination degree measurement for each province and municipality in the Yangtze River Economic Belt are obtained as shown in Table 3 (due to the limitation of space, this part only lists the coupling coordination degree of each province and municipality in the Yangtze River Economic Belt in 2009, 2014 and 2019). Overall, the coupling coordination degree of the three major systems in the Yangtze River Economic Belt shows a rising trend. In terms of time, in 2009, the coordination degree of each region was between 0.35 and 0.6, and the coordination level of most regions was basic coordination or near incoordination. While in 2019, as the coordination degree rose to between 0.55 and 0.85, the number of regions at the primary coordination level and above increased to 10, indicating that the coupling coordination of the logistics industry, new urbanization and ecological environment in the Yangtze River Economic Belt has been greatly improved. This is mainly due to the fact that, on the one hand, the new urbanization process in the Yangtze River Economic Belt is accelerating, and the logistics industry is also developing greatly as the region strengthens cooperation under the relevant support of funds and policies. On the other hand, under the leadership of the new development concept, the government has increased its efforts on the ecological environmental protection and innovated a new model of green development, which has led to the continuous improvement of environmental quality. By provinces and municipalities, Shanghai, Jiangsu and Zhejiang, as developed regions in the Yangtze River Economic Belt, have reached the basic coordination level of the three systems in 2009, while only Hunan Province in the upper and middle regions reached this level. By 2019, Shanghai, Jiangsu and Anhui entered the ranks of intermediate coordination provinces and municipalities. Zhejiang is the only province to reach a good level of coordination by virtue of its higher level of urbanization, better ecological environment and especially the rapid development of the logistics industry brought about by e-commerce. The other provinces and municipalities, except Guizhou, have also reached the primary coordination level. Due to the relatively backward development of the logistics industry and new urbanization, Guizhou has only reached a barely coordinated level overall, despite some progress in the ecological environment.
To further analyze the spatial differences and evolution of the coupled and coordinated development levels of the logistics industry, new urbanization and ecological environment in 11 provinces and municipalities in the Yangtze River Economic Belt, the coupled and coordinated values obtained in Table 3 were visualized using ArcGIS software in 2009, 2014 and 2019, and the results are shown in Figure 5. As can be seen from the figure, the level of coordination of the logistics industry, new urbanization and ecological environment coupling in the Yangtze River Economic Belt has improved during the 11 years from 2009 to 2019. However, the overall spatial distribution pattern has not changed significantly, showing the spatial distribution characteristics of downstream > midstream > upstream. Specifically, downstream Zhejiang, Jiangsu, Shanghai and Anhui have all achieved medium to high levels of coordination. As more developed provinces and municipalities in the Yangtze River Economic Belt, they have greater advantages in terms of resources, technology, information and talents. Other provinces and municipalities in the midstream and upstream have a weaker foundation of their own, and although they have not reached the coordination level of the downstream, the differences between them are smaller, and judging from their coordination trends, they are also steadily moving toward the middle and high levels.
Overall, the coupling and coordination level of the logistics industry, new urbanization and ecological environment in the Yangtze River Economic Belt is gradually improving, but there are still some differences in the coordination level among provinces and municipalities. In recent years, the country has vigorously advocated ecological civilization construction. While vigorously developing the logistics industry, local governments also attach great importance to the ecological environmental protection and strengthen the benign interaction between the logistics industry and the ecological environment [65]. At the same time, localities actively respond to the requirements of new urbanization, drive urbanization development with the logistics industry, strengthen the integration of the logistics industry with new urbanization and the ecological environment and improve the coupling coordination.

4.3. Analysis of the Spatial Agglomeration Characteristics of Coupling Coordination

4.3.1. Global Spatial Autocorrelation Analysis

To further explore the spatial correlation of the coupling and coordination degree of the logistics industry, new urbanization and ecological environment in the Yangtze River Economic Belt, according to Equation (11), the global Moran’s I index from 2009 to 2019 was calculated using the GeoDa software, and its dynamic change characteristics were analyzed, and the results were obtained as shown in Table 4. As can be seen from Table 4, the global Moran index ranges from 0.418 to 0.617 during the study period, all of which are positive, which indicates that there is a significant positive spatial correlation between the coordinated development of the logistics industry, new urbanization, and ecological environment in the Yangtze River Economic Belt. That is, in provinces and municipalities with higher coupling coordination, the coupling coordination in their neighboring regions is also higher, and vice versa. In terms of the development trend, the Moran index of the whole period shows a fluctuating upward trend. Among them, the rising trend is more obvious between 2009 and 2015, and the Moran index value in the later years is still greater than that in 2009, although it decreases compared with 2015. This indicates that the spatial agglomeration intensity of the coupled and coordinated development level of provinces and municipalities in the Yangtze River Economic Belt has weakened, but the spatial agglomeration effect still exists. The above results reflect that the spatial distribution of coupling and coordination differences in the Yangtze River Economic Belt is not random and that there is a mutual influence between neighboring provinces and municipalities in their development. Therefore, regional collaboration should be strengthened to further improve the level of coupling and coordination among the three systems in the Yangtze River Economic Belt.

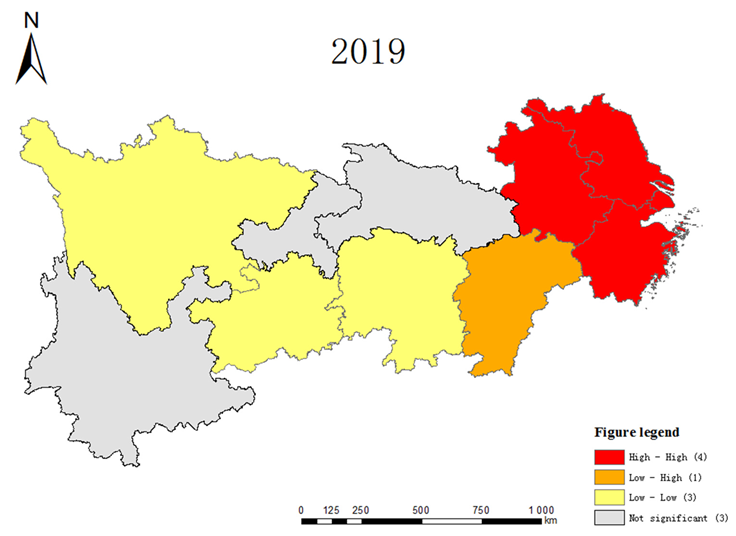
4.3.2. Local Spatial Autocorrelation Analysis

To reflect the local spatial characteristics of the coupling coordination degree, according to Equation (12), GeoDa software was used to conduct a local spatial autocorrelation analysis of the coupling coordination degree of each province and municipality in the Yangtze River Economic Belt in 2009, 2014 and 2019, respectively, and local Moran’s I scatter plots and LISA clustering plots were drawn, as shown in Figure 6 and Figure 7, respectively.
Figure 6 shows that most provinces and municipalities are in the first and third quadrants, indicating that the level of coupling coordination among provinces and municipalities is positively correlated. Specifically, the number of provinces and municipalities in the first quadrant (high–high) and the third quadrant (low–low) did not change significantly in 2009, 2014 and 2019. Only the positions of individual provinces and municipalities changed, which indicates that those provinces and municipalities with a higher level of coordinated development have maintained a high level of concentration for more than a decade, but at the same time, those provinces and municipalities with a weaker foundation and a lower level of coordination originally have not been able to get rid of the relatively lagging situation. Furthermore, in terms of their distribution characteristics, the provinces and municipalities falling into the first quadrant were relatively concentrated in 2009 and 2014, while those falling into the third quadrant were more dispersed, and the opposite was true in 2019. This reflects that in 2009 and 2014, provinces and municipalities with higher coupling coordination had less individual differences in agglomeration, and those with lower coupling coordination had more individual differences in agglomeration, and this situation was reversed in 2019 [72].
Figure 7 shows that both high and low agglomeration regions increase over time at a significant level of 5%. Among them, provinces and municipalities with less spatial variation and higher levels of coordination within and around the regions themselves are primarily located in the downstream region of the Yangtze River Economic Belt. These provinces and municipalities have been the center of economic development in the Yangtze River Economic Belt and China, and the close economic and transportation links have led to the mutual circulation of capital, talents and technology in the region and a high level of regional integration. Provinces and municipalities with smaller spatial differences but lower levels of coordination between the region itself and its neighbors are concentrated in the midstream and upstream of the Yangtze River Economic Belt. These provinces and municipalities have a relatively low level of economic development and closed transportation, making the development of the logistics industry and urbanization slower, while the development of the surrounding areas is also lacking, thus forming a low-lying agglomeration, and these to a certain extent hinder the improvement of the ecological environment. In terms of significance, although there are still some areas where the agglomeration effect is not significant, the number is gradually shrinking, reflecting an increase in the level of significance in some areas, indicating the existence of some spatial correlation between provinces and municipalities, leading to an increased trend of interconnection and mutual influence with neighboring areas.

5. Discussion

The coupled and coordinated relationship between the logistics industry, new urbanization and ecological environment is a large and complex whole, and it is important to realize the coordinated development of the three systems, which has an important role in promoting the high-quality economic development and the improvement of people’s living standard and sense of well-being. However, the literature on the coupled and coordinated development of the logistics industry, new urbanization and ecological environment is still relatively scarce, and most of the literature focuses on the relationship between the two and focuses on the influence of one party on the other, without analyzing the evolutionary characteristics of their coupling and coordination. Therefore, based on the existing study results, this paper selects the Yangtze River Economic Belt as a representative region and analyzes the coupling and coordination relationship between the logistics industry, new urbanization and ecological environment by constructing a comprehensive evaluation index system, which provides a new study perspective on the relationship among the three. At the same time, it provides theoretical support for the coordinated development among the three systems of the Yangtze River Economic Belt and enriches the theoretical system of existing studies to a certain extent.
As an important densely populated area and industrial bearing area in China, the Yangtze River Economic Belt is an early demonstration belt for ecological civilization construction, whose importance is self-evident. In recent years, with the implementation and deepening of the development strategy of the Yangtze River Economic Belt, the region has achieved remarkable construction results, which provides favorable conditions for the coordinated development among the systems. From the study results, in general, the logistics industry, new urbanization and ecological environment of each province and municipality in the Yangtze River Economic Belt have developed to different degrees, the degree of coupling and coordination among the three systems has been improving, and the degree of spatial correlation of coupling and coordination has been gradually enhanced. Specifically, there are still some differences in the development levels of logistics, urbanization and environment among provinces and municipalities, which reflects the uneven development status of each region. In terms of the coordination degree and its spatial distribution characteristics, the regions with higher coordination degrees are concentrated in the downstream regions represented by Zhejiang and Shanghai; the regions with lower coordination degrees are concentrated in the upstream and midstream regions, such as Jiangxi and Guizhou. This reflects that the spatial differentiation of the Yangtze River Economic Belt is small in local areas, but the overall internal spatial differences are large, and polarization is serious. This is mainly due to the unique location and resource advantages of the downstream areas with well-developed transportation networks and close connections; while the upstream and midstream regions are restricted in development due to factors such as remote location and lack of resources. These results reflect that government policies play a crucial role in promoting the logistics industry, new urbanization and sustainable development of the ecological environment. The Yangtze River Economic Belt has 40% of the country’s population and 44.1% of the economy [73], has seen a number of government policies to support its development and an increase in the coordination of the coupling of the three systems, which indicates that the policies implemented for the development of the region have achieved great results. However, the disparities between different provinces and municipalities indicate that the relevant policies need to be further improved and need to be analyzed specifically according to the characteristics of each location.
Based on the above findings, this paper makes the following suggestions:
(1)
Make up for the shortcomings and formulate development strategies according to local conditions. The development level of all three systems in each region of the Yangtze River Economic Belt is not the same. Therefore, each province and municipality should identify their own short boards as soon as possible to achieve efficient development. For provinces and municipalities lagging in the logistics industry, they should increase the infrastructure construction of the logistics industry and focus on building a new logistics system. Similarly, for provinces and municipalities lagging in new urbanization, they should improve the level of urban public services and plan urban space scientifically. For the provinces and municipalities lagging in the ecological environment, they should change the development concept and increase the financial and technical investment in local environmental pollution control.
(2)
Maintain the advantages and promote system integration through integrated linkage. For provinces and municipalities that have already reached the primary coordination and above development level, it is important to maintain this good development trend and ensure that the level of advantageous systems and the quality of coordinated development among systems continue to improve steadily. In addition, it is important to strengthen the integration and linkage in the process of development. While accelerating the urbanization process, they should focus on the optimization of industrial structures and the improvement of environmental quality. While promoting the development of the logistics industry, they should also pay attention to the protection of the ecological environment, increase the use of green technology and develop low-carbon logistics.
(3)
Strengthen cooperation and achieve coordinated development for mutual benefit. Provinces and municipalities in the Yangtze River Economic Belt should strengthen intra-regional ties and exchanges, build a platform for coordinated development and realize the open sharing of resources. In addition, local governments should actively guide and promote inter-regional interconnection and complementary advantages. Thus, the provinces and municipalities with a high level of coordination can better play the role of radiation and guidance for neighboring provinces and municipalities and even the whole region and promote the integrated development of the Yangtze River Economic Belt.
The findings and suggestions of this paper summarize the coupled development patterns of logistics, urbanization and environment and their evolutionary trends in the provinces and municipalities of the Yangtze River Economic Belt. This provides some ideas for building a modern industrial system, achieving high-quality urbanization and accelerating the construction of ecological civilization in the region. The scientific value of this paper was to identify the spatial and temporal evolution characteristics of the level of coupled and coordinated development of the logistics industry, new urbanization and ecological environment in the Yangtze River Economic Belt based on existing studies and related theories, which will help the development of related studies and policy formulation, and also provide a reference for the coordinated development of other regions.
However, our paper has the following limitations. On the one hand, due to the limitation of data acquisition, this paper has to discard some valuable indicators in the process of constructing the indicator system, which may not fully reflect the characteristics of the logistics industry, urbanization and ecological environment in the Yangtze River Economic Belt, and this may affect the integrity of the coupling coordination to some extent. On the other hand, although the coupling coordination of the three systems in the 11 provinces and cities of the Yangtze River Economic Belt is identified in two dimensions, spatial and temporal, the study still remains at the macro level of the provincial level and future study can be further narrowed down to the municipal and even county-level study units to make the study results more precise and thus provide more targeted suggestions for the improvement of inter-system coordination.

6. Conclusions

The following conclusions are drawn from the empirical analysis of this paper:
(1)
In terms of the comprehensive development level of each system and composite system, the comprehensive evaluation value of each subsystem and composite system of the Yangtze River Economic Belt from 2009 to 2019 shows an upward trend and changes toward a better state. Among them, the logistics system shows a trend of a low starting point and gradually expanding horizontal difference; the new urbanization system shows a trend of relatively slow development and gradually narrowing the gap between regions; the ecosystem shows a trend of a high starting point and rising fluctuation.
(2)
In terms of the level of coordinated development of the logistics industry, new urbanization and ecological environment, the degree of coupling and coordination of the three major systems in the Yangtze River Economic Belt provinces and municipalities showed a smooth upward trend from 2009 to 2019, and overall transitioned from near incoordination or basic coordination to the level of primary coordination or intermediate coordination. In addition, although the level of coupling and coordination of these three systems has improved during these 11 years, the overall spatial distribution pattern has not changed significantly, showing the spatial distribution characteristics of downstream > midstream > upstream.
(3)
In terms of the spatial clustering characteristics of coupling coordination, the global analysis results indicate that there is a significant positive spatial correlation among the coordinated development of the three systems in the Yangtze River Economic Belt, and this spatial correlation tends to fluctuate and increase. The local analysis results show that there is heterogeneity and agglomeration in the coordinated development of the three systems in 11 provinces and municipalities in the Yangtze River Economic Belt. The heterogeneity is mainly manifested by the greater degree of coordination in the downstream region than in the midstream and upstream region, and the agglomeration is mainly manifested by the spatial clustering of provinces and municipalities with similar degrees of coupling coordination in local regions and is dominated by high–high and low–low agglomeration.
Our findings may provide references for governmental departments to promote regional logistics supply-side reform effectively, high-quality development of new urbanization and ecological civilization construction. Although this paper discusses the spatio-temporal correlation between the logistics industry, new urbanization and ecological environment from the perspective of coupling and coordination, due to the limitations in the selection of indicators, the deeper quantitative relationship between the three still needs to be studied. The emergence of more study results and improvement of methods in the future will help to construct a more accurate evaluation index system so as to analyze the coupling and coordination relationship among these three systems more accurately and promote the realization of people-oriented sustainable development.

Author Contributions

Conceptualization and methodology, J.P.; software, J.P.; validation and formal analysis, J.P.; investigation and resources, J.P. and H.C.; data curation, H.C.; writing—original draft preparation, J.P.; writing—review and editing, C.Y.; visualization, J.P.; supervision, C.Y.; project administration, C.Y.; funding acquisition, C.Y. All authors have read and agreed to the published version of the manuscript.

Funding

This research was funded by “the National Social Science Foundation of China”, grant number (19FJYB043) and “the Fujian Soft Science Research Program”, grant number (2021R0019).

Institutional Review Board Statement

Not applicable.

Informed Consent Statement

Not applicable.

Data Availability Statement

The processed data required to reproduce these findings cannot be shared at this time as the data also forms part of an ongoing study.

Conflicts of Interest

The authors declare no conflict of interest.

References

  1. Tang, H.; Liu, Y.; Ma, X. Effect evaluation of coordinated development between tourism industry and new urbanization—A case study of Zhangjiajie. Econ. Geogr. 2017, 37, 216–223. [Google Scholar]
  2. Bai, X.; Shi, P.; Liu, Y. Society: Realizing China’s urban dream. Nature 2014, 509, 158–160. [Google Scholar] [CrossRef] [Green Version]
  3. Xu, X.-F.; Hao, J.; Deng, Y.-R.; Wang, Y. Design optimization of resource combination for collaborative logistics network under uncertainty. Appl. Soft Comput. 2017, 56, 684–691. [Google Scholar] [CrossRef]
  4. Ahmed, K.; Ahmed, S. A predictive analysis of CO2 emissions, environmental policy stringency, and economic growth in China. Environ. Sci. Pollut. Res. 2018, 25, 16091–16100. [Google Scholar] [CrossRef] [PubMed]
  5. He, J.; Wu, N.J.; Guan, C.L.; Qiu, Y.G. Study on the coordination of logistics industry and economic development coupling in the middle reaches of Yangtze River city cluster. J. Zhongnan Univ. Econ. law. 2019, 4, 89–99. [Google Scholar]
  6. He, J.; Wang, S.; Liu, Y.; Ma, H.; Liu, Q. Examining the relationship between urbanization and the eco-environment using a coupling analysis: Case study of Shanghai, China. Ecol. Indic. 2017, 77, 185–193. [Google Scholar] [CrossRef]
  7. Ma, Y.F.; Zhang, C.H.; Liu, J.S.; Gao, Y.; Pang, W. Coupling with tourism: A new approach to sustainable development research. Tour. Hosp. Prospect. 2018, 2, 1–19. [Google Scholar]
  8. Gallagher, R.; Appenzeller, T. Beyond reductionism. Science 1999, 284, 79. [Google Scholar] [CrossRef]
  9. Li, W.; Yi, P. Assessment of city sustainability—Coupling coordinated development among economy, society and environment. J. Clean. Prod. 2020, 256, 120453. [Google Scholar] [CrossRef]
  10. Cui, X.; Fang, C.; Liu, H.; Liu, X. Assessing sustainability of urbanization by a coordinated development index for an Urbanization-Resources-Environment complex system: A case study of Jing-Jin-Ji region, China. Ecol. Indic. 2019, 96, 383–391. [Google Scholar] [CrossRef]
  11. Zhang, T.; Li, L. Research on temporal and spatial variations in the degree of coupling coordination of tourism–urbanization–ecological environment: A case study of Heilongjiang, China. Environ. Dev. Sustain. 2021, 23, 8474–8491. [Google Scholar] [CrossRef]
  12. Deng, Z.B.; Zong, S.W.; Su, C.W.; Chen, G. Study on the coupled and coordinated development of ecological civilization construction and new urbanization in the Yangtze River Economic Belt and the driving factors. Econ. Geogr. 2019, 39, 78–86. [Google Scholar]
  13. Wang, R.; Ji, X.F.; Chen, F. The mechanism of the impact of logistics economy on urbanization in contiguous special hardship areas. Resour. Dev. Mark. 2018, 34, 1533–1538. [Google Scholar]
  14. Chhetri, P.; Butcher, T.; Corbitt, B. Characterising spatial logistics employment clusters. Int. J. Phys. Distrib. Logist. Manag. 2014, 44, 221–241. [Google Scholar] [CrossRef]
  15. Zhang, N. The influence mechanism of new urbanization on the improvement of logistics production efficiency in China—Based on the moderating effect of new infrastructure construction. Bus. Econ. Res. 2021, 12, 95–98. [Google Scholar]
  16. Wolpert, S.; Reuter, C. Status quo of city logistics in scientific literature: Systematic review. Transp. Res. Rec. 2012, 2269, 110–116. [Google Scholar] [CrossRef]
  17. Danyluk, M. Supply-Chain Urbanism: Constructing and Contesting the Logistics City. Ann. Am. Assoc. Geogr. 2021, 111, 2149–2164. [Google Scholar] [CrossRef]
  18. Wu, Y.; Ni, W.H. An empirical study on the efficiency of coupled development of new urbanization and logistics industry. Bus. Econ. Res. 2020, 15, 98–101. [Google Scholar]
  19. Pu, Y.M.; Wang, R.; Chen, F.; Ji, X.F.; Li, J.M. Spatio-temporal Coupling and Evolution Mechanism of Urban Logistics Sprawl and Urbanization. J. Highw. Transp. Res. Dev. 2021, 38, 152–158. [Google Scholar]
  20. Wu, B.; Yin, J.; Bo, H.Z.; Liu, T.; Shao, M.H. Measurement of the interaction between regional logistics and new urbanization development. J. Highw. Transp. Res. Dev. 2022, 39, 160–166. [Google Scholar]
  21. Ding, B.; Duan, Y.Y. Research on the relationship between the development of China’s logistics industry and new urbanization. Stat. Decis. Mak. 2017, 16, 56–59. [Google Scholar]
  22. Howard, E. Tomorrow, a Peaceful Path to Social Reform; Cambridge University Press: Cambridge, UK, 2010. [Google Scholar]
  23. Kuznets, S. Economic growth and income equality. USA Econ. Rev. 1955, 45, 1–28. [Google Scholar]
  24. Grossman, G.M.; Krueger, A.B. Economic growth and the environment. Q. J. Econ. 1995, 110, 353–377. [Google Scholar] [CrossRef] [Green Version]
  25. Tong, C. Review on environmental indicator research. Res. Environ. Sci. 2000, 13, 53–55. [Google Scholar]
  26. Ma, S.J.; Wang, R.S. Socio-economic-natural complex ecosystem. J. Ecol. 1984, 4, 1–9. [Google Scholar]
  27. Wang, R.S.; Liu, J.G. Principles of ecological reservoirs and their role in the study of urban ecology. Urban. Environ. Urban Ecol. 1988, 1, 20–25. [Google Scholar]
  28. Ma, C.D. Countermeasures for sustainable urban development in China. Ecol. Econ. 2000, 10, 4–7. [Google Scholar]
  29. Liu, H.M.; Fang, C.L.; Li, Y.H. The coupled human and natural cube: A conceptual framework for analyzing urbanization and eco-environment interactions. Acta Geogr. Sin. 2019, 74, 1489–1507. [Google Scholar]
  30. Al-Kharabsheh, A.; Ta’Any, R. Influence of urbanization on water quality deterioration during drought periods at South Jordan. J. Arid Environ. 2003, 53, 619–630. [Google Scholar] [CrossRef]
  31. Anwar, M.; Zhang, X.L.; Yang, D.G. Atmospheric environmental pollution effects of urbanization process in Atushi city. Geogr. Arid Reg. 2012, 35, 274–280. [Google Scholar]
  32. Harveson, P.M.; Lopez, R.R.; Collier, B.A.; Silvy, N.J. Impacts of urbanization on Florida Key deer behavior and population dynamics. Biol. Conserv. 2007, 134, 321–331. [Google Scholar] [CrossRef]
  33. Chan, K.M.; Vu, T.T. A landscape ecological perspective of the impacts of urbanization on urban green spaces in the Klang Valley. Appl. Geogr. 2017, 85, 89–100. [Google Scholar] [CrossRef]
  34. Hou, Y.; Zhang, Y.Q.; Wu, B. Ecological and environmental impacts of urbanization process in sandy areas. Soil Water Conserv. Bull. 2013, 33, 97–102. [Google Scholar]
  35. Henderson, V. The Urbanization Process and Economic Growth: The So-What Question. J. Econ. Growth 2003, 8, 47–71. [Google Scholar] [CrossRef]
  36. Xiao, P.; Su, J. An empirical study on the impact of urbanization on ecological and environmental quality—Taking the Dongting Lake Rim region as an example. Financ. Econ. Theory Pract. 2019, 40, 150–155. [Google Scholar]
  37. Ariken, M.; Zhang, F.; Liu, K.; Fang, C.; Kung, H.-T. Coupling coordination analysis of urbanization and eco-environment in Yanqi Basin based on multi-source remote sensing data. Ecol. Indic. 2020, 114, 106331. [Google Scholar] [CrossRef]
  38. Wu, H.; Gai, Z.; Guo, Y.; Li, Y.; Hao, Y.; Lu, Z.-N. Does environmental pollution inhibit urbanization in China? A new perspective through residents’ medical and health costs. Environ. Res. 2020, 182, 109128. [Google Scholar] [CrossRef]
  39. Tseng, M.-L.; Tran, T.P.T.; Ha, H.M.; Bui, T.-D.; Lim, M.K. Sustainable industrial and operation engineering trends and challenges Toward Industry 4.0: A data driven analysis. J. Ind. Prod. Eng. 2021, 38, 581–598. [Google Scholar] [CrossRef]
  40. Chen, S.H. The game analysis of negative externality of environmental logistics and governmental regulation. Int. J. Environ. Pollut. 2013, 51, 143. [Google Scholar] [CrossRef]
  41. Ren, R.; Hu, W.; Dong, J.; Sun, B.; Chen, Y.; Chen, Z. A Systematic Literature Review of Green and Sustainable Logistics: Bibliometric Analysis, Research Trend and Knowledge Taxonomy. Int. J. Environ. Res. Public Health 2019, 17, 261. [Google Scholar] [CrossRef] [Green Version]
  42. Zhang, Y.N.; Liu, Z.Q.; Ouyang, H.X.; Song, L.L. A comprehensive study on the efficiency of regional logistics industry under low carbon environment—An empirical analysis based on 19 provinces in the Yangtze River protection region. Mod. Manag. 2020, 40, 33–40. [Google Scholar]
  43. Jlassi, S.; Tamayo, S.; Gaudron, A.; de La Fortelle, A. Simulating impacts of regulatory policies on urban freight: Application to the catering setting. IEEE. Int. ICALT 2017, 106–112. [Google Scholar] [CrossRef]
  44. Tang, J.R.; Du, J.J.; Tang, Y.C. Research on the sustainable development of regional logistics efficiency under environmental regulation. Rev. Econ. Manag. 2018, 34, 138–149. [Google Scholar]
  45. He, Z.; Chen, P.; Liu, H.; Guo, Z. Performance measurement system and strategies for developing low-carbon logistics: A case study in China. J. Clean. Prod. 2017, 156, 395–405. [Google Scholar] [CrossRef]
  46. Guo, X.L.; Zong, Y.S. Countermeasures for the development of modern logistics of agricultural products in China under the low carbon economy. China Circ. Econ. 2012, 26, 41–44. [Google Scholar]
  47. Mariano, E.B.; Gobbo, J.A., Jr.; Camioto, F.D.C.; Rebelatto, D.A.N. CO2 emissions and logistics performance: A composite index proposal. J. Clean. Prod. 2017, 163, 166–178. [Google Scholar] [CrossRef]
  48. Dong, F.; Xu, X.H.; Han, Y. Research on the efficiency of China’s inter-provincial logistics industry under low carbon constraints. E. China Econ. Manag. 2016, 30, 86–91. [Google Scholar]
  49. Zhou, T. Research on the coordinated development of regional logistics and ecological environment from a low-carbon perspective. Stat. Inf. Forum 2021, 36, 62–72. [Google Scholar]
  50. Bao, J.; Li, H. Study on the Harmonious Development of Carbon Emission and Eco-environment in Logistics Industry—Taking Beijing-Tianjin a- Hebei as an example. IOP Conf. Ser. Earth Environ. Sci. 2020, 450, 012069. [Google Scholar] [CrossRef]
  51. Lu, M.; Xie, R.; Chen, P.; Zou, Y.; Tang, J. Green Transportation and Logistics Performance: An Improved Composite Index. Sustainability 2019, 11, 2976. [Google Scholar] [CrossRef] [Green Version]
  52. Xu, D.A. An examination of the mechanism of the role of environmental policies on eco-logistics performance in the context of carbon neutrality. J. Comm. Econ. 2022, 4, 122–125. [Google Scholar]
  53. Liang, W.; Fang, S.H. Study on the dynamic relationship between logistics industry growth, urbanization and carbon emissions. Jianghan Acad. 2019, 38, 73–81. [Google Scholar]
  54. Liu, B.Q.; Cheng, K.; Ma, Z.X. Research on the impact of urbanization on the change of carbon emissions in logistics industry. China Popul. Res. Environ. 2016, 26, 54–60. [Google Scholar]
  55. He, J.S.; Wang, S.F.; Xu, L. Research on green logistics efficiency and influencing factors of China’s three major bay area city clusters under carbon emission constraints. Railw. Transp. Econ. 2021, 43, 30–36. [Google Scholar]
  56. Gong, X.; Zhu, W.C. The impact of logistics industry network construction on urbanization development in a low carbon economy. Ecol. Econ. 2021, 37, 101–105. [Google Scholar]
  57. Guo, X.; Shi, J.; Ren, D.; Ren, J.; Liu, Q. Correlations between air pollutant emission, logistic services, GDP, and urban population growth from vector autoregressive modeling: A case study of Beijing. Nat. Hazards 2017, 87, 885–897. [Google Scholar] [CrossRef]
  58. Shee, H.K.; Miah, S.J.; De Vass, T. Impact of smart logistics on smart city sustainable performance: An empirical investigation. Int. J. Logist. Manag. 2021, 32, 821–845. [Google Scholar] [CrossRef]
  59. Cao, C. Measuring Sustainable Development Efficiency of Urban Logistics Industry. Math. Probl. Eng. 2018, 2018, 1–9. [Google Scholar] [CrossRef]
  60. Zhang, W.; Zhang, X.; Zhang, M.; Li, W. How to Coordinate Economic, Logistics and Ecological Environment? Evidences from 30 Provinces and Cities in China. Sustainability 2020, 12, 1058. [Google Scholar] [CrossRef] [Green Version]
  61. Liang, W.; Sun, H.; Liu, H.W. Study on the Synergistic Development of New Urbanization and Logistics in China—Taking the Yangtze River Economic Belt as an Example. Mod. Financ. Econ. 2018, 8, 69–80. [Google Scholar]
  62. Shi, H.M.; Zhang, Y.; Ye, Q.Q. Study on the spatial and temporal differentiation of coupled and coordinated urbanization and ecological environment in the Yellow River Basin. Soc. Sci. Ningxia 2021, 4, 55–63. [Google Scholar]
  63. Cai, W.J.; Xia, W.J.; Zhao, X.H. Coupled and coordinated development of "ecological environment-economic development-urbanization" in five northwestern provinces and regions and prediction analysis. China Agric. Res. Zon. 2020, 41, 219–227. [Google Scholar]
  64. Guo, X.Y.; Mu, X.Q.; Ming, Q.Z.; Ding, Z.; Hu, M. Spatial coupling between rapid traffic superiority degree and tourist flow intensity in tourist destinations. Geogr. Res. 2019, 38, 1119–1135. [Google Scholar]
  65. Xie, X.; Sun, H.; Gao, J.; Chen, F.; Zhou, C. Spatiotemporal Differentiation of Coupling and Coordination Relationship of Tourism–Urbanization–Ecological Environment System in China’s Major Tourist Cities. Sustainability 2021, 13, 5867. [Google Scholar] [CrossRef]
  66. Liu, J.; Li, C.; Tao, J.; Ma, Y.; Wen, X. Spatiotemporal Coupling Factors and Mode of Tourism Industry, Urbanization and Ecological Environment: A Case Study of Shaanxi, China. Sustainability 2019, 11, 4923. [Google Scholar] [CrossRef] [Green Version]
  67. Chai, J.; Wang, Z.; Zhang, H. Integrated Evaluation of Coupling Coordination for Land Use Change and Ecological Security: A Case Study in Wuhan City of Hubei Province, China. Int. J. Environ. Res. Public Health 2017, 14, 1435. [Google Scholar] [CrossRef] [Green Version]
  68. He, Q.J.; Yang, X.W. Analysis of coupling and coordination degree between comprehensive health industry and old-age service. Soft Sci. 2019, 33, 45–49. [Google Scholar]
  69. Gao, M.F.; Zheng, J. Total Factor Productivity in Chinese Agriculture and its Spatial and Temporal Variation Analysis—A Re-Examination Based on Carbon Sink Perspective. Ecol. Econ. 2021, 37, 98–104. [Google Scholar]
  70. Liu, N.; Liu, C.; Xia, Y.; Da, B. Examining the coordination between urbanization and eco-environment using coupling and spatial analyses: A case study in China. Ecol. Indic. 2018, 93, 1163–1175. [Google Scholar] [CrossRef]
  71. Weng, Y.j.; Wang, X.T.; Du, L.; Zhou, X.X. Study on the coordination degree of new urbanization and green economy efficiency in Zhejiang Province—Based on the perspective of “two mountains theory”. E. China Econ. Manag. 2021, 35, 100–108. [Google Scholar]
  72. Pan, J.H.; Feng, Z.D.; Dong, X.F. Spatial and Temporal Patterns of Regional Economic Differences in Gansu Province by ESDA-GIS. J. Lanzhou Univ. 2008, 44, 45–50. [Google Scholar]
  73. Zou, L.; Zhu, Y.-W. Research on Innovation Performance in Heterogeneous Region: Evidence from Yangtze Economic Belt in China. Complexity 2020, 2020, 8659134. [Google Scholar] [CrossRef]
Figure 1. 2009–2019 Logistics industry evaluation value.
Sustainability 14 05298 g001
Figure 2. 2009–2019 New urbanization evaluation value.
Sustainability 14 05298 g002
Figure 3. 2009–2019 Ecological environment evaluation value.
Sustainability 14 05298 g003
Figure 4. 2009–2019 Three-system comprehensive evaluation value.
Sustainability 14 05298 g004
Figure 5. Evolutionary trends in the level of coupling and coordination of the three systems in the Yangtze River Economic Belt from 2009 to 2019.
Sustainability 14 05298 g005aSustainability 14 05298 g005b
Figure 6. Local Moran scatterplot for the Yangtze River Economic Belt (2009, 2014, 2019).
Sustainability 14 05298 g006
Figure 7. LISA agglomeration maps for the Yangtze River Economic Belt (2009, 2014, 2019).
Sustainability 14 05298 g007aSustainability 14 05298 g007b
Table 1. Indicator system for coupling coordination evaluation of the three systems.
SystemPrimary
Indicators
Secondary IndicatorsIndex
Type
Weights
Logistics IndustryLogistics InfrastructureRailroad mileage (km)+0.045
Road mileage (km)+0.046
Postal outlets (pcs)+0.136
Ownership of civilian cargo
vehicles (million units)
+0.062
Logistics
development scale
Cargo volume (million tons)+0.064
Cargo turnover (billion tons/km)+0.156
Express delivery volume (million pieces)+0.339
Value added of the logistics
industry (billion yuan)
+0.088
Employment in logistics
(persons)
+0.063
New
urbanization
Population urbanizationUrban population as a proportion of total population (%)+0.068
Urban population density
(persons/km2)
+0.123
Economic urbanizationGDP per capita (yuan)+0.118
Share of secondary sector in GDP (%)+0.032
Share of tertiary sector in GDP (%)+0.100
Disposable income per urban resident (yuan)+0.115
Social urbanizationPublic transport vehicles per 10,000 people (standard units)+0.065
Public toilets per 10,000 people (seats)+0.084
Beds in health care facilities per 1000 population (pcs)+0.069
Number of students enrolled in higher education per 100,000 people (persons)+0.047
Spatial urbanizationUrban road area per capita (m2)+0.073
Proportion of urban built-up area to urban area (%)+0.105
Ecological environmentEcological statusForest cover (%)+0.229
Greening coverage of built-up
areas (%)
+0.044
Green space per capita
(m2/person)
+0.139
Ecological pressureIndustrial wastewater discharge (million tons)0.095
Industrial sulfur dioxide
emissions (million tons)
0.127
Industrial smoke emissions
(million tons)
0.066
Ecological ProtectionIntegrated utilization rate of
general industrial solid waste (%)
+0.207
Urban sewage treatment rate (%)+0.036
Harmless disposal rate of domestic waste (%)+0.058
Note: ”+”means positive-type indicators, “−“ means inverse-type indicators.
Table 2. Classification criteria of coupling coordination level.
No.Value (D)Degree
10 < D ≤ 0.1Extreme incoordination
20.1 < D ≤ 0.2Serious incoordination
30.2 < D ≤ 0.3Intermediate incoordination
40.3 < D ≤ 0.4Mild incoordination
50.4 < D ≤ 0.5Near incoordination
60.5 < D ≤ 0.6Basic coordination
70.6 < D ≤ 0.7Primary coordination
80.7 < D ≤ 0.8Intermediate coordination
90.8 < D ≤ 0.9Good coordination
100.9 < D ≤ 1.0Excellent coordination
Table 3. Coupling coordination degree and level of the logistics industry, new urbanization and ecological environment in the Yangtze River Economic Belt.
Province200920142019
ValueDegreeValueDegreeValueDegree
Shanghai0.572basic coordination0.641primary coordination0.726intermediate coordination
Jiangsu0.547basic coordination0.664primary coordination0.757intermediate coordination
Zhejiang0.566basic coordination0.680primary coordination0.828good coordination
Anhui0.476near incoordination0.605primary coordination0.704intermediate coordination
Jiangxi0.497near incoordination0.589basic coordination0.659primary coordination
Hubei0.479near incoordination0.598basic coordination0.690primary coordination
Hunan0.513basic coordination0.595basic coordination0.680primary coordination
Sichuan0.409near incoordination0.538basic coordination0.614primary coordination
Chongqing0.489near incoordination0.586basic coordination0.678primary coordination
Yunnan0.461near incoordination0.531basic coordination0.638primary coordination
Guizhou0.370mild incoordination0.470near incoordination0.587basic coordination
Table 4. Global Moran index of coupling and coordination of the logistics industry, new urbanization and ecological environment in the Yangtze River Economic Belt from 2009 to 2019.
YearMoran’s IZ-Valuep-Value
20090.4182.7460.014
20100.5053.1920.006
20110.5603.4750.002
20120.5333.3520.003
20130.5483.3130.002
20140.5433.3610.002
20150.6173.6580.002
20160.4672.9750.005
20170.5363.3170.004
20180.4212.8320.008
20190.4643.1180.004
Publisher’s Note: MDPI stays neutral with regard to jurisdictional claims in published maps and institutional affiliations.

