
Development of GGBS-Based Geopolymer Concrete Incorporated with Polypropylene Fibers as Sustainable Materials
 ,
,  ,
,  ,
,  ,
,  ,
,  and
and 
Abstract
:1. Introduction
Significance of the Present Study
- Use Taguchi’s method to achieve the optimal amounts of process parameters, viz., alkali ratio (NaOH:Na2SiO3), percentage of GGBS, and percentage of polypropylene fiber for workability, and compressive and flexural strengths of alkali-activated GGBS-based geopolymer concrete incorporated with polypropylene fibers.
- Study the contribution of the process parameters or to investigate the key factors influencing the responses, viz., workability, and compressive and flexural strengths.
- Validate the reliability of the results obtained by the Taguchi method through ANOVA.
- Confirm the predicted optimized responses by confirmation tests.
- Obtain an optimized GGBS-based concrete mix with comparable strength as that of a pure cement-based control mix.
- Provide a guide to identify the key factor and choose the best concrete mix based on the present study’s statistical analyses.
- Demonstrate that both fresh and hardened properties of concrete can be tuned for an optimal response for a given set of controlling process parameters or factors.
- Section 2 below discusses the materials and their characteristics used in the study to make geopolymer concrete along with the results of tests conducted on them.
2. Materials and Methods
2.1. Ground Granulated Blast-Furnace Slag (GGBS)
2.2. Cement
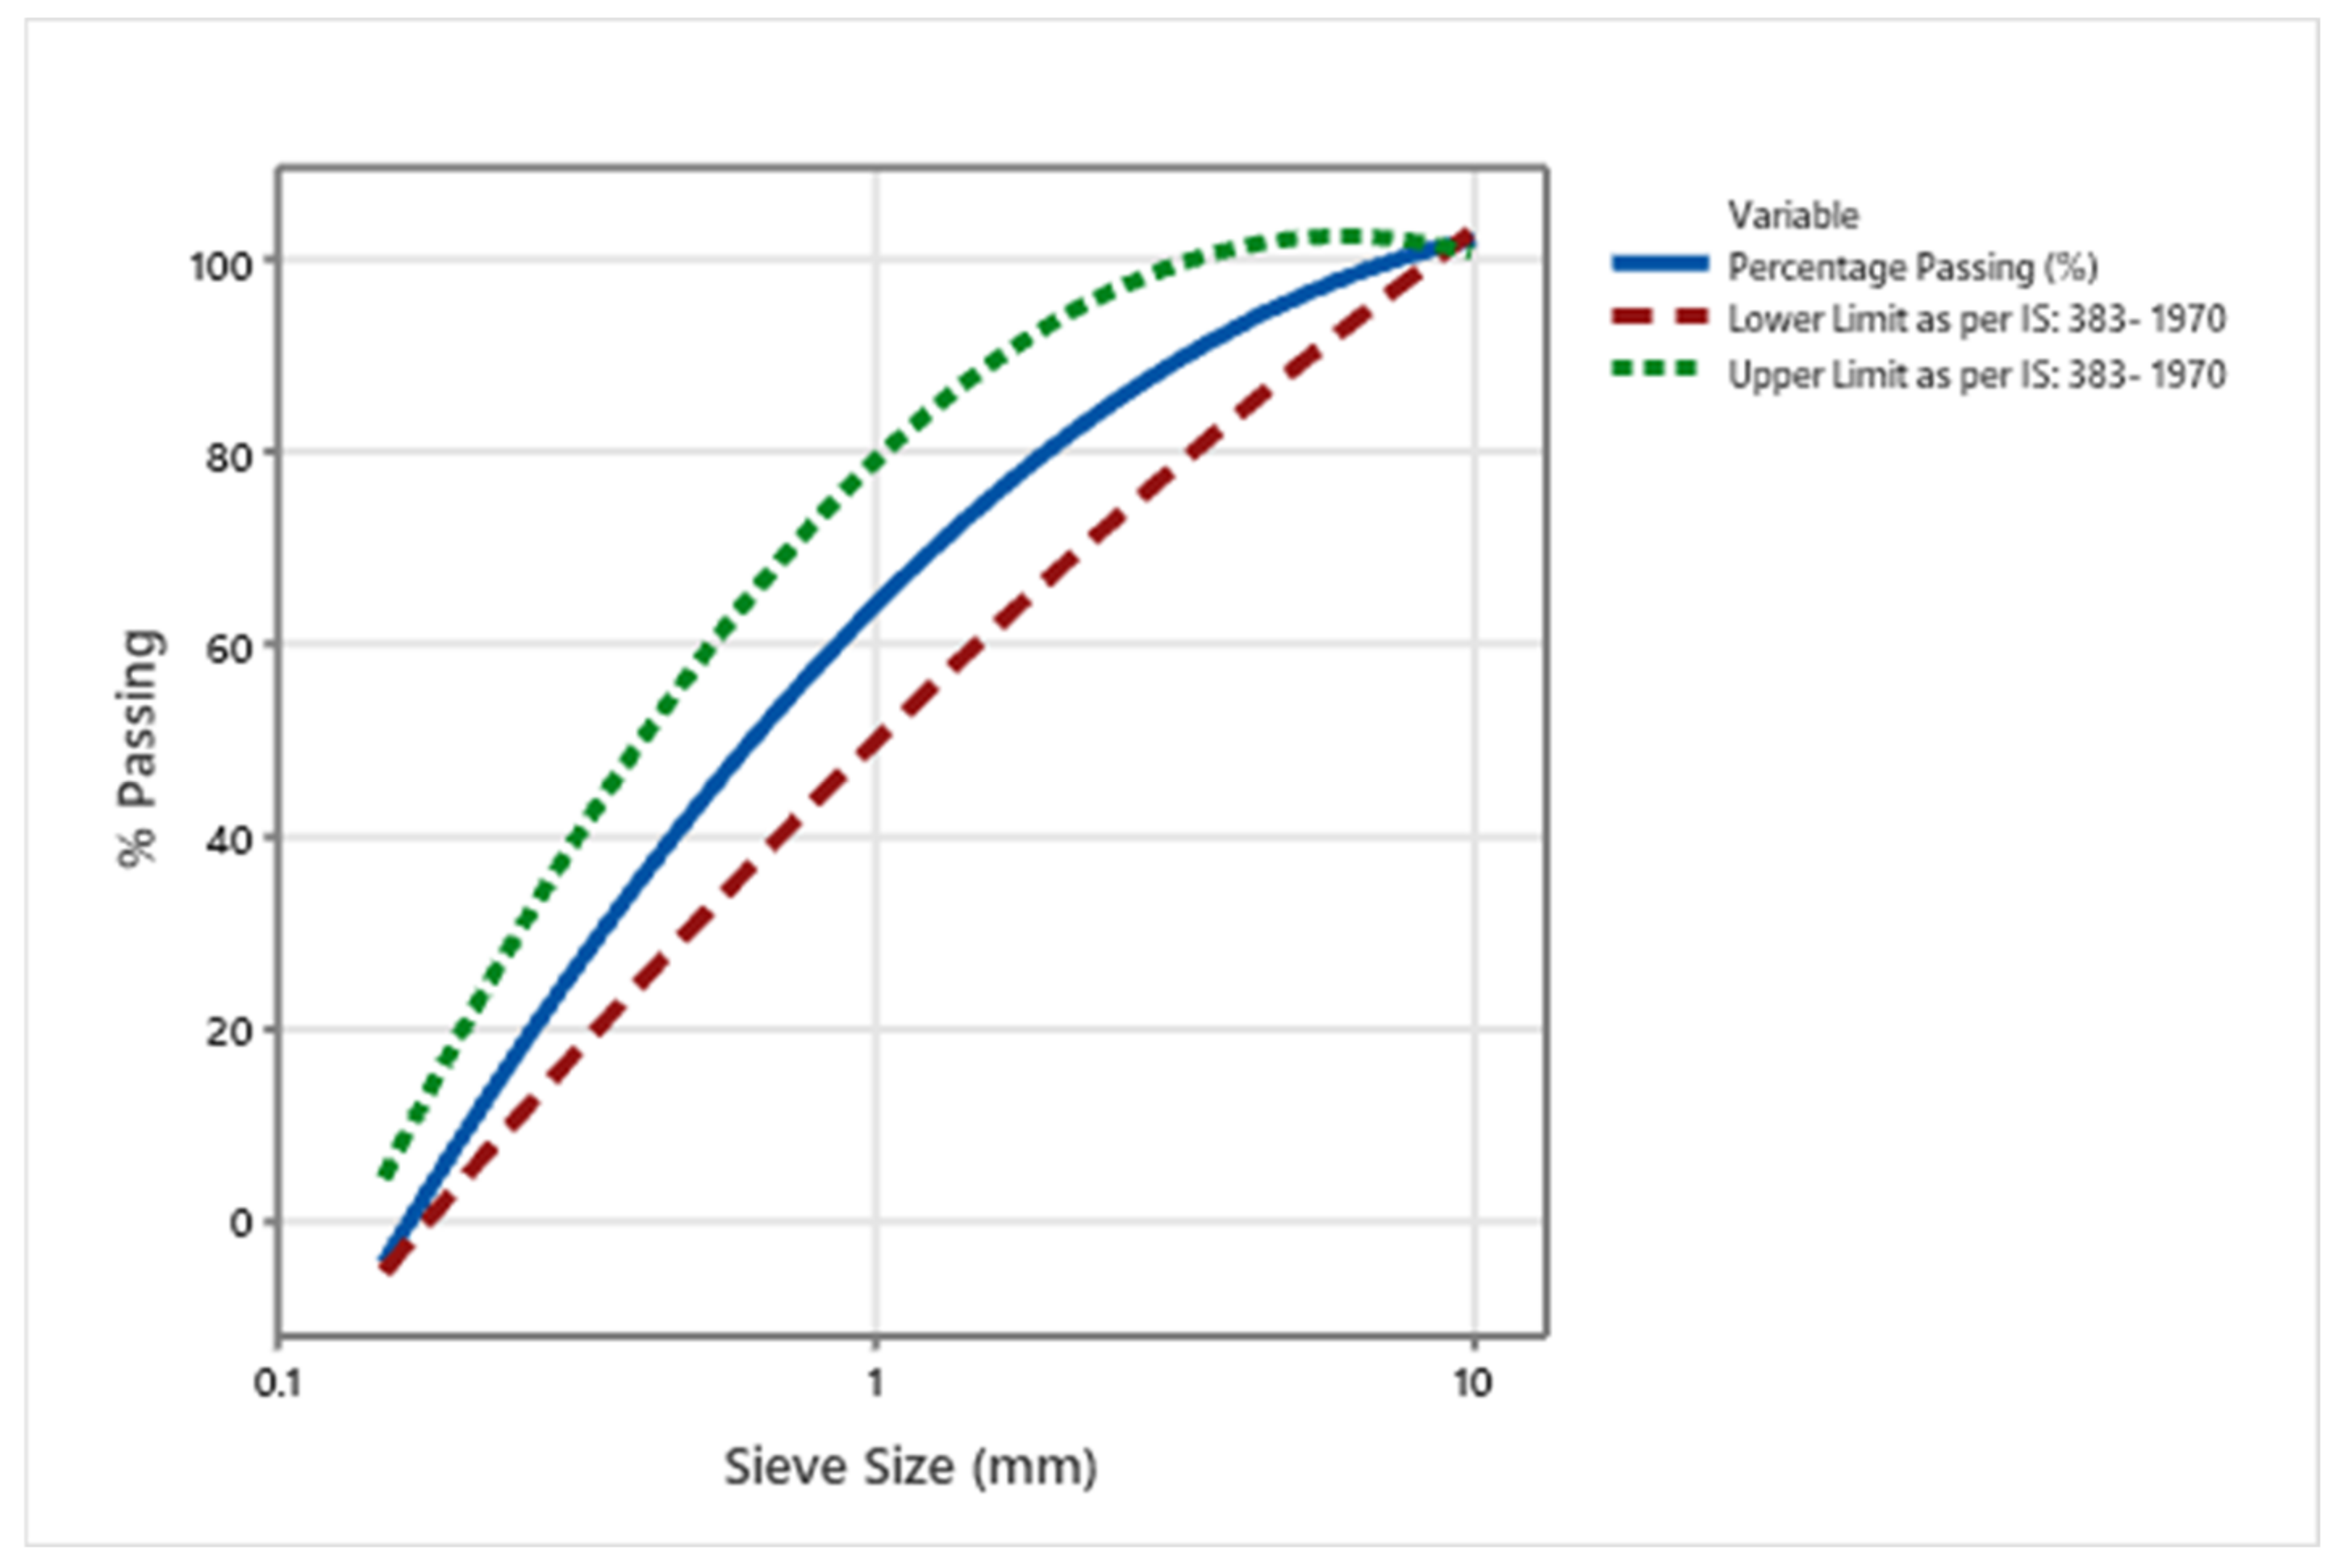
2.3. Fine Aggregate
2.4. Coarse Aggregate
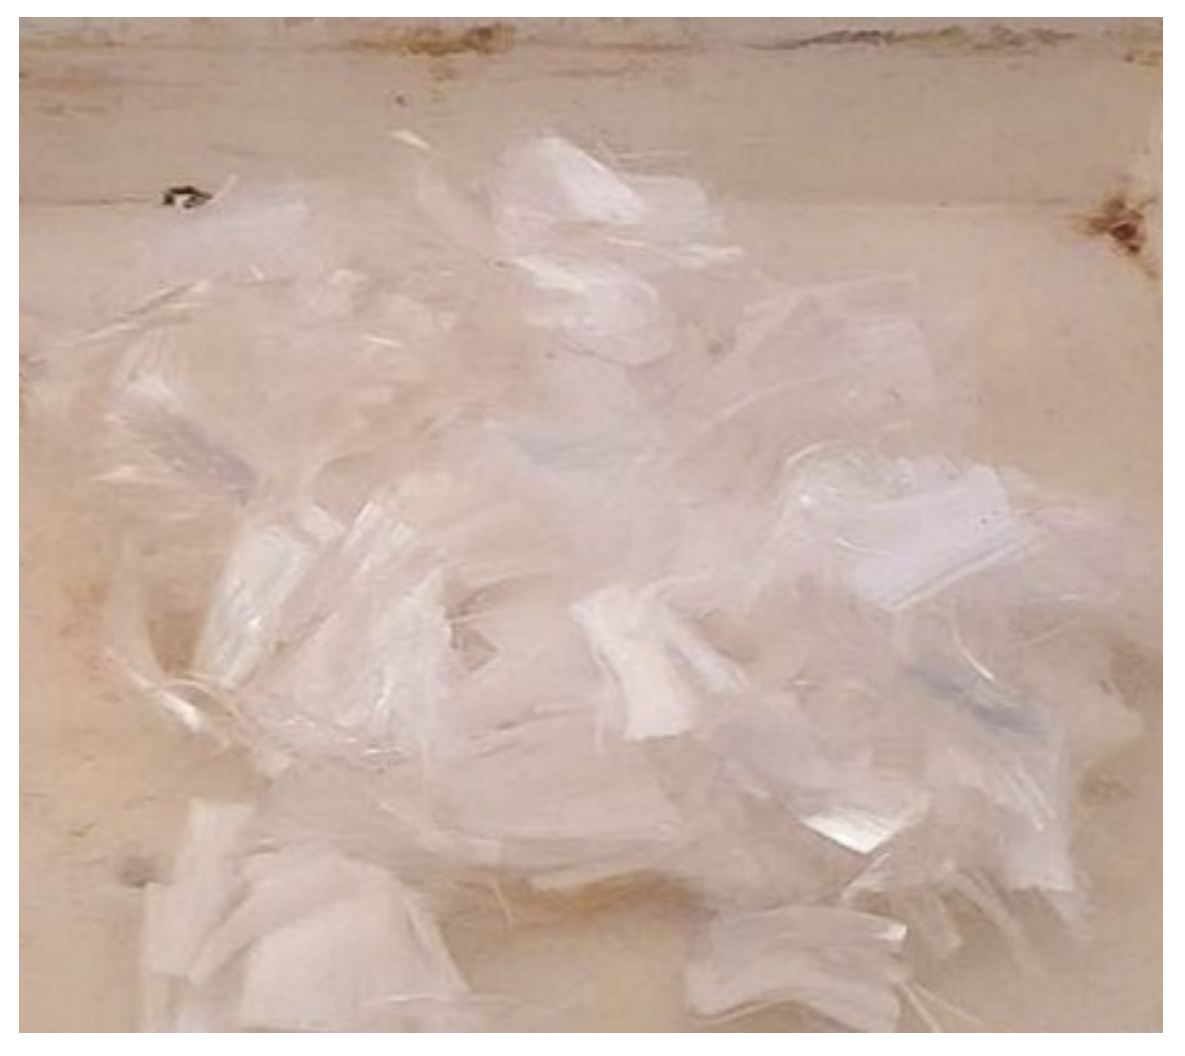
2.5. Polypropylene Fibers
2.6. Alkaline Activators Solution
2.7. Taguchi Method of Optimization
2.8. Analysis of Variance (ANOVA)
3. Experimental Program
3.1. Factors and Their Levels
3.2. Mixing
3.3. Preparation of Specimens and Testing
4. Results and Discussion
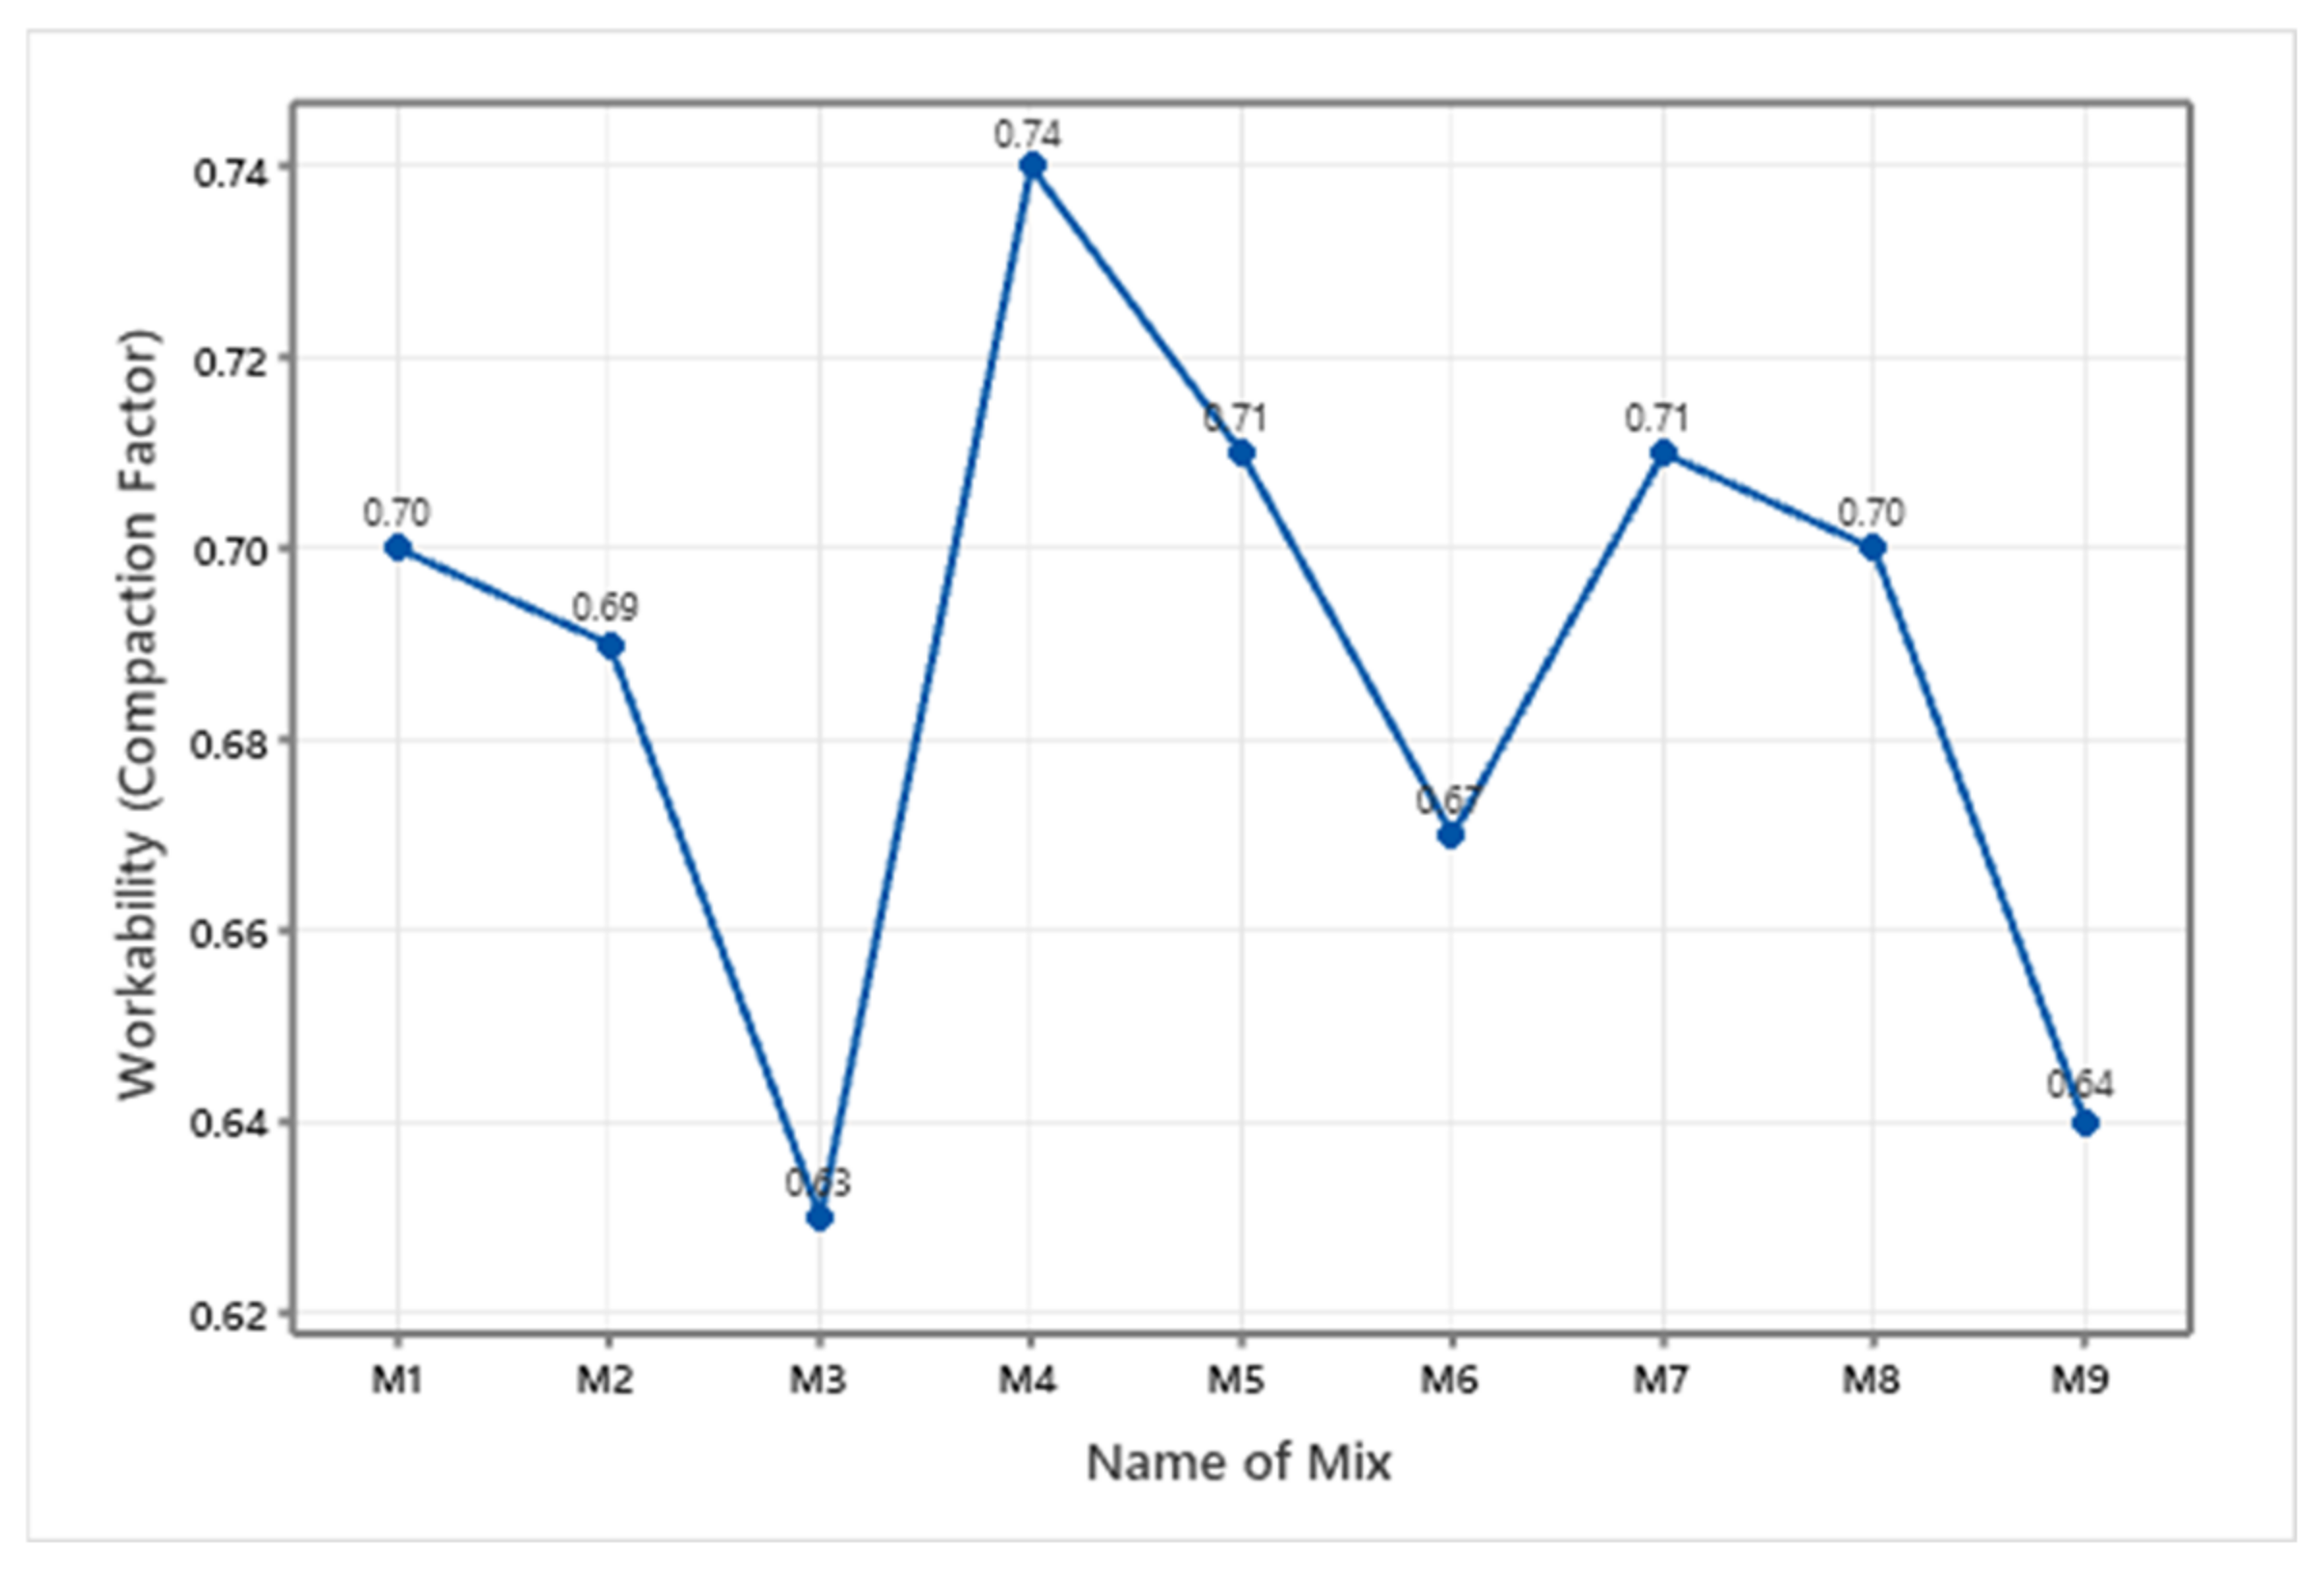
4.1. Workability
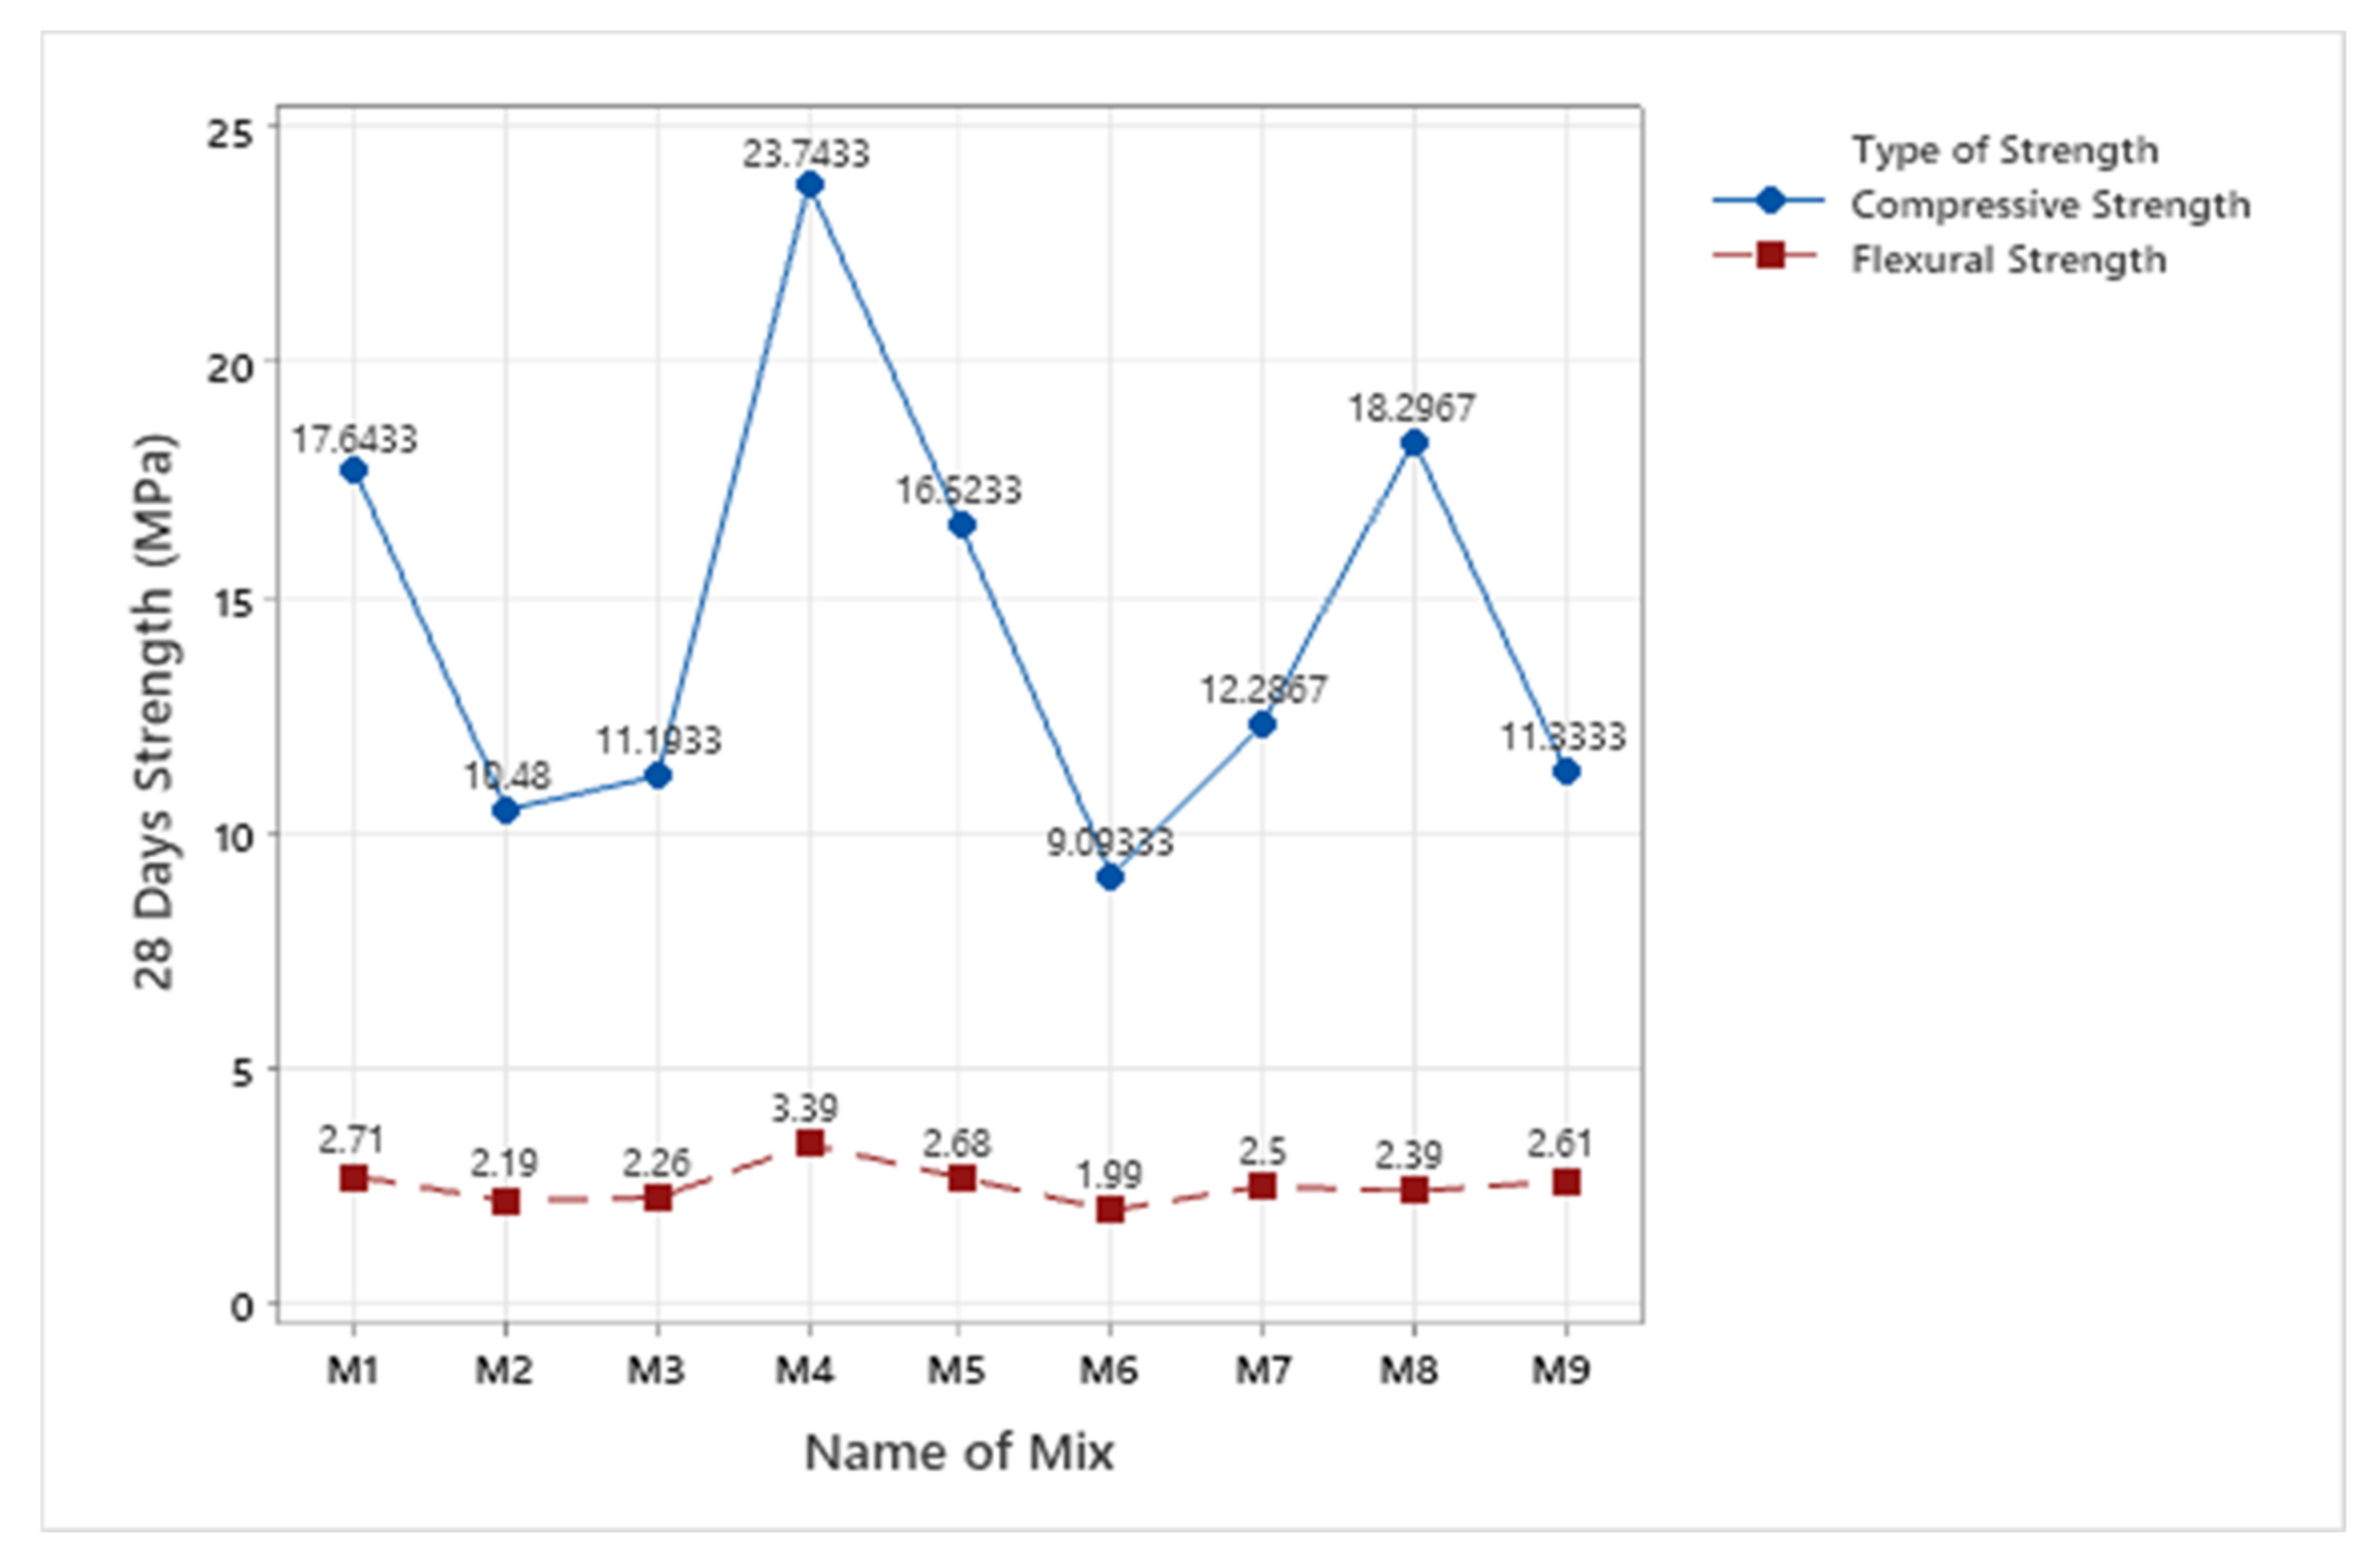
4.2. Compressive and Flexural Strengths
4.3. Taguchi Method Results
4.4. Analysis of Variance (ANOVA) Results
4.5. Confirmation Tests
5. Conclusions
- The workability of all the nine mixes decreased as compared to the workability of the control mix, which was found to be 0.92. M4 mix with a compaction factor of 0.74 and with an alkali activator ratio as 1:2 (10 molar), % of GGBS as 80%, and % of polypropylene as 2.5% exhibited the highest workability of all the mixes. While M3 mix with a compaction factor of 0.63 and with an alkali activator ratio as 1:1.5 (8 molar), % of GGBS as 100%, and % of polypropylene as 2.5% showed the lowest workability of all the mixes.
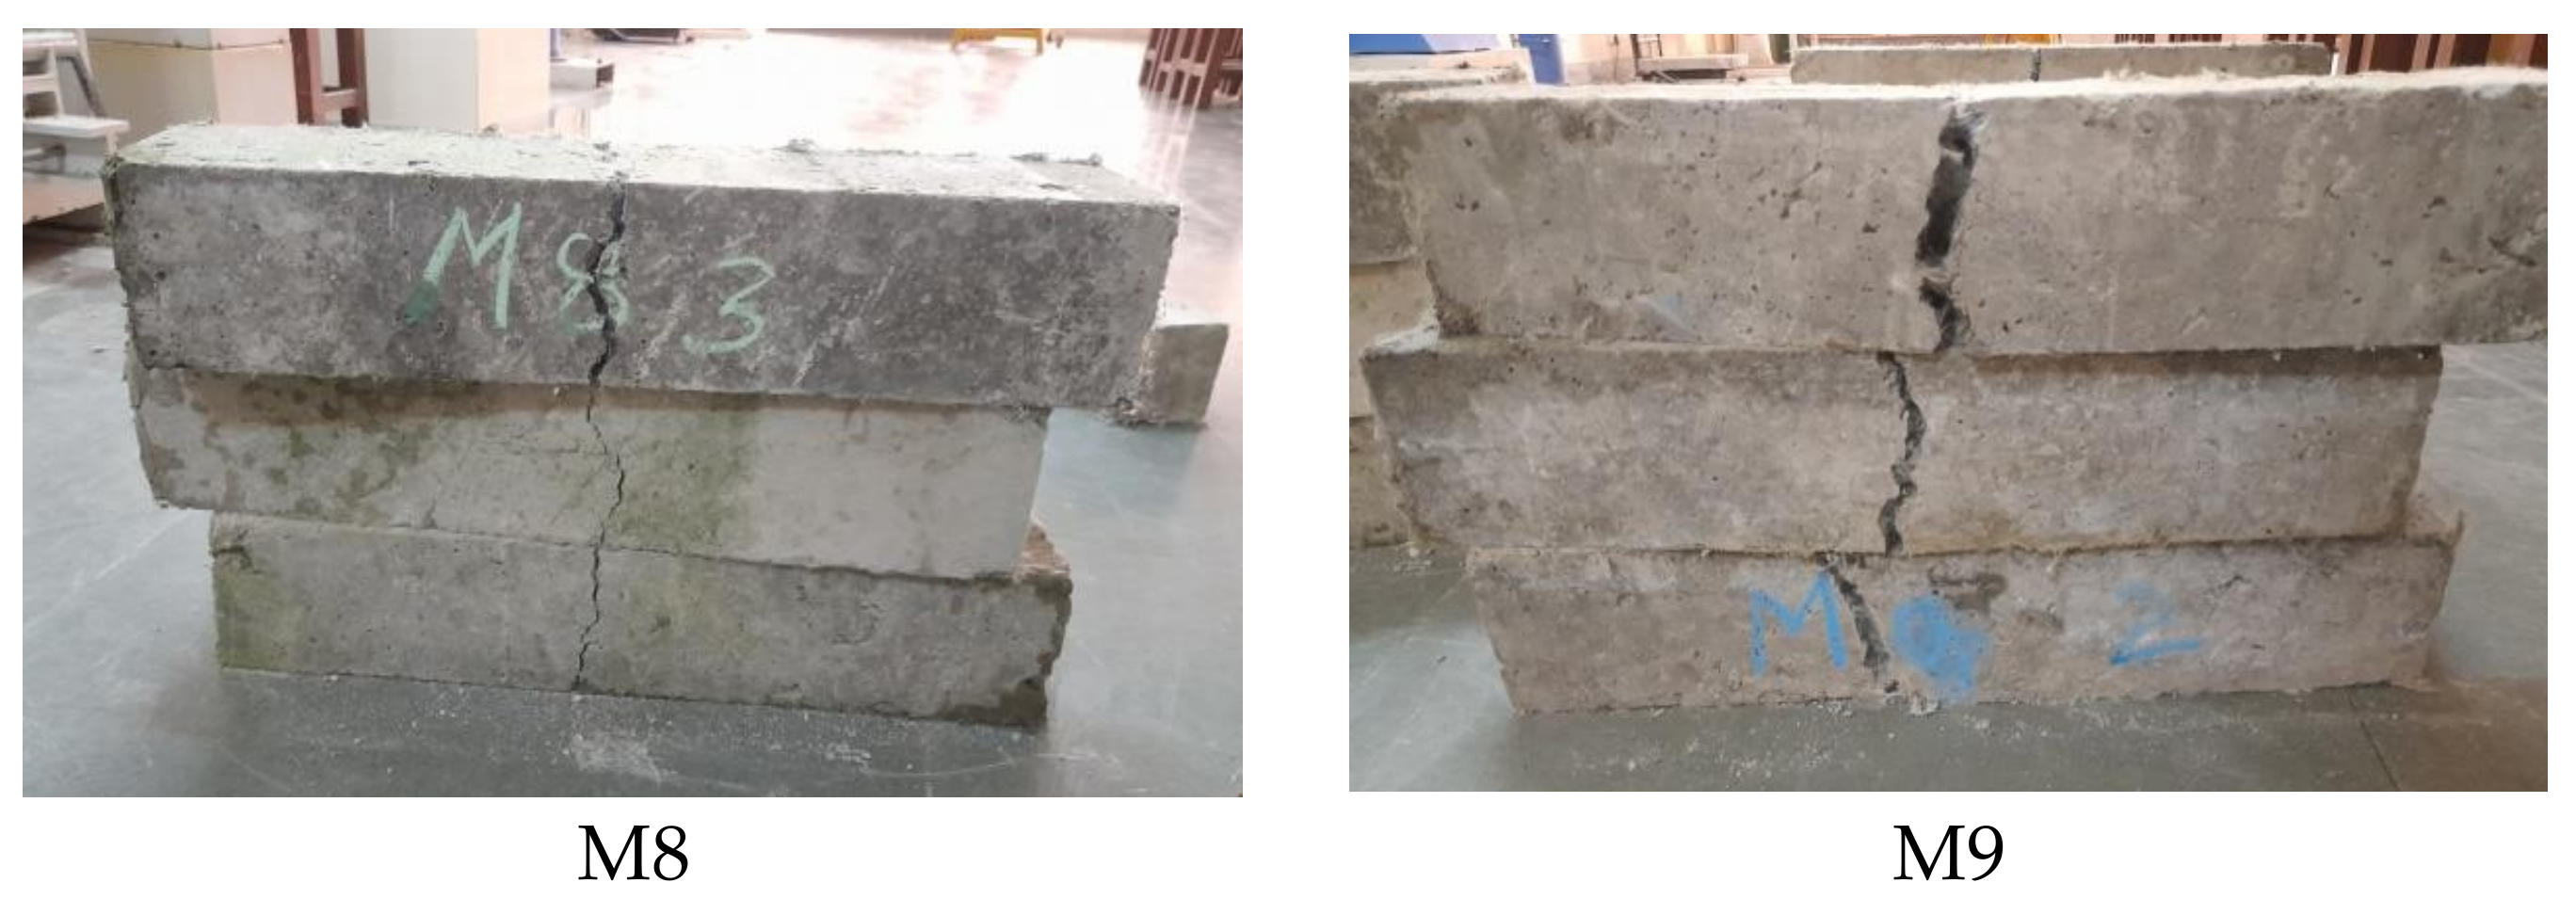
- The 28 days of compressive and flexural strength results show a decrease in the two strengths as compared to the compressive and flexural strengths of the control mix, which were found to be 25.48 MPa and 3.43 MPa, respectively. M4 mixed with a 1:2 (10 molar) alkali ratio, 80% of GGBS, and 2.5% of polypropylene fibers, and M6 with a 1:2 (10 molar) alkali ratio, 100% of GGBS, and 2% of polypropylene, showed a maximum and minimum 28 days of compressive and flexural strengths with compressive strengths of 23.74 MPa and 9.09 MPa and flexural strengths of 3.39 MPa and 1.99 MPa, respectively. The minimum and maximum decrease of 6.82% and 64.32% for 28 days compressive strength and 1.17% and 41.98% for 28 days of flexural strength was observed for M4 and M6 mixes, respectively.
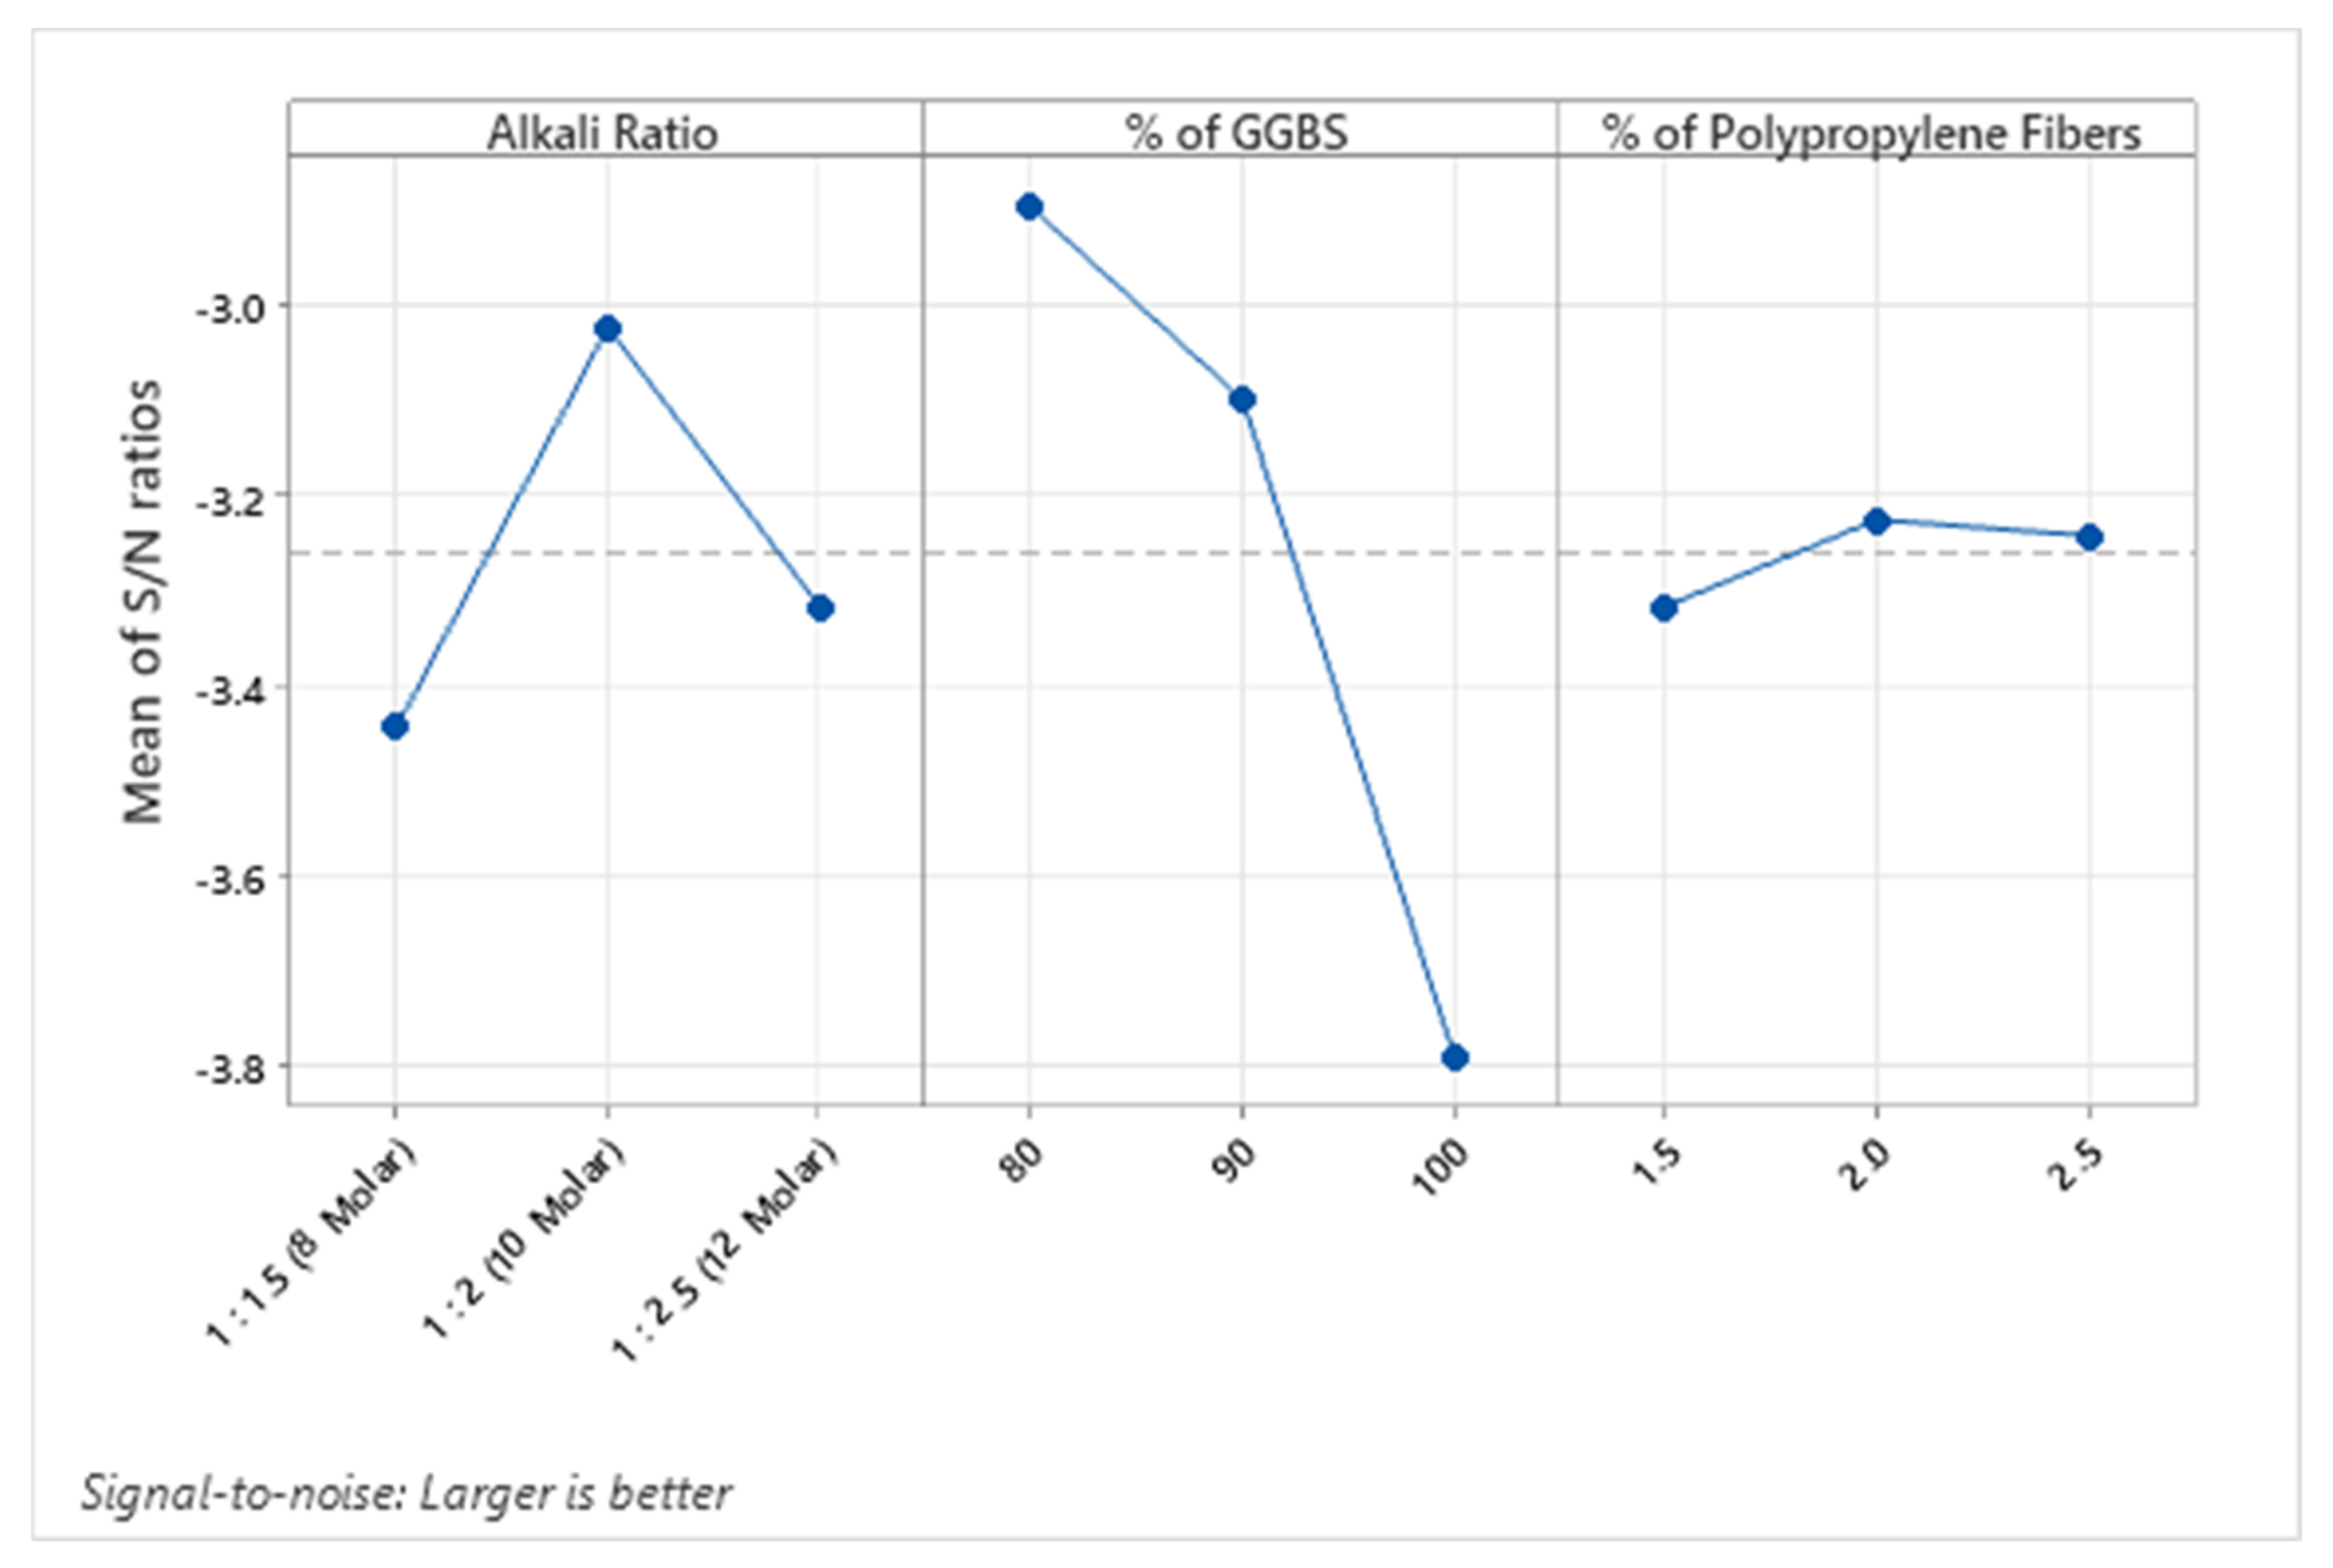
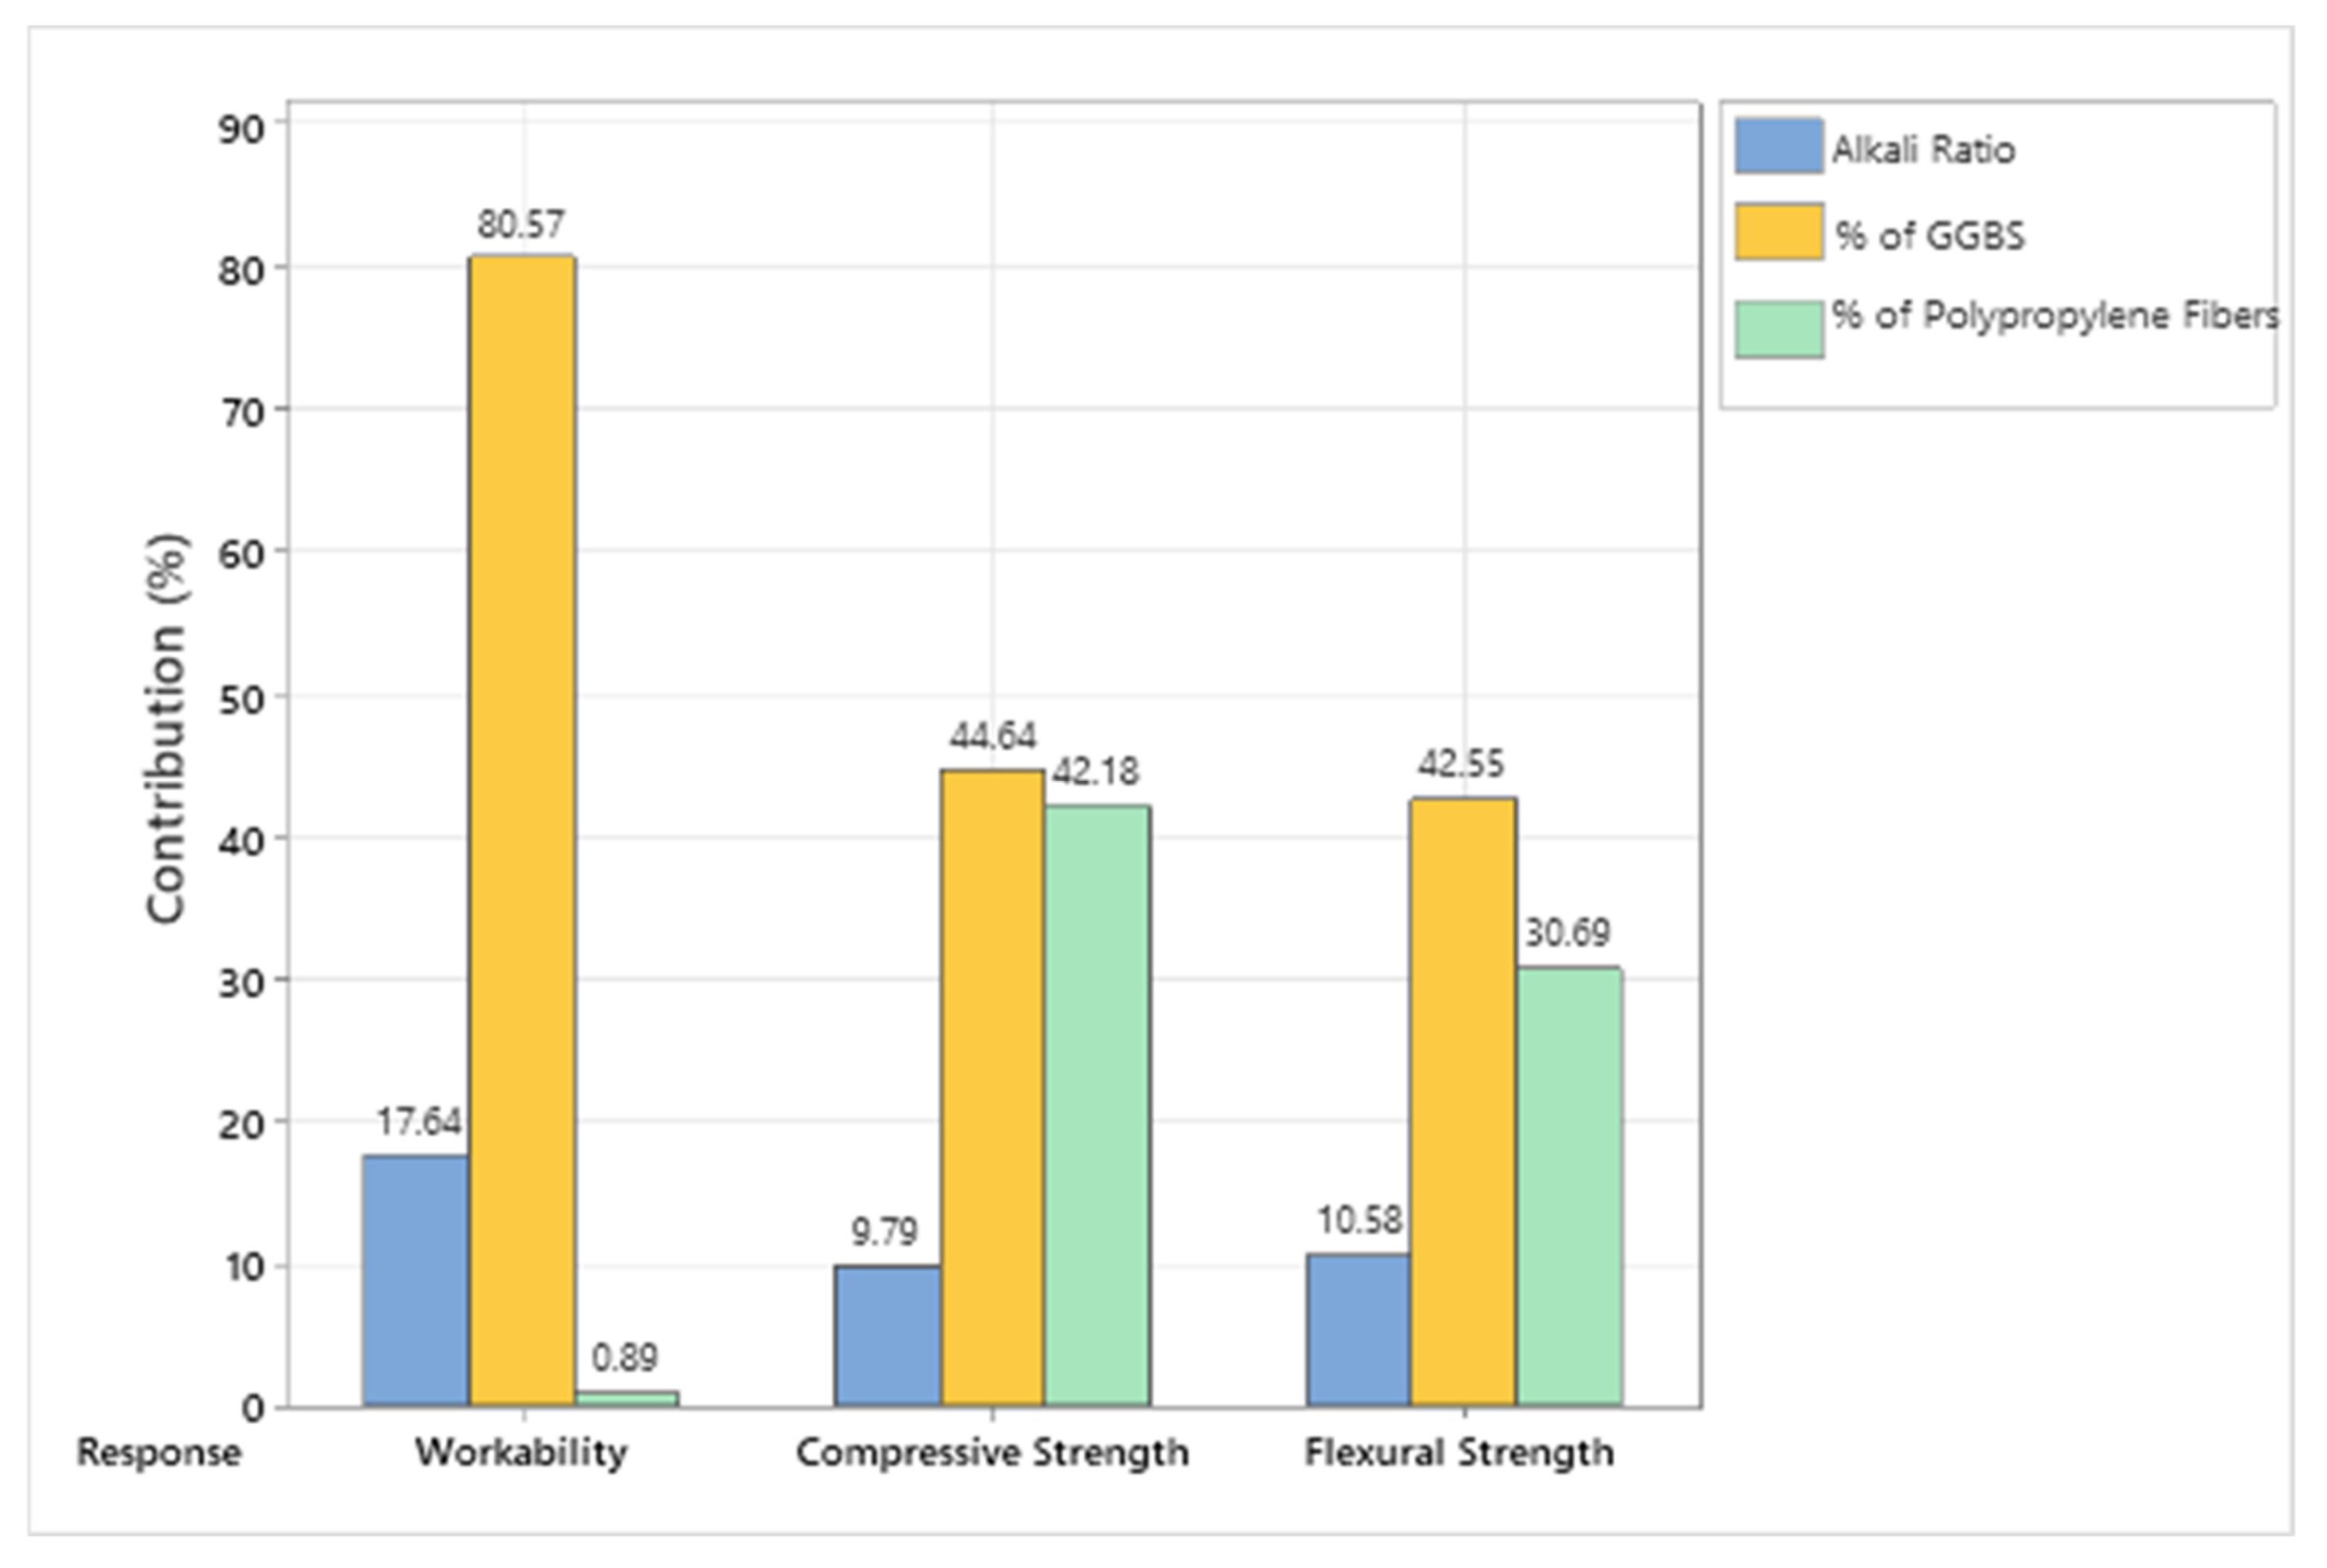
- The results obtained from Taguchi and ANOVA resonate with each other with the percentage contribution varying numerically but with the same rankings of the parameters. The rank of the factors for workability is % of GGBS > alkali ratio > % of polypropylene fibers, while for compressive and flexural strengths, it is % of GGBS > % of polypropylene fibers > alkali ratio. The most effective parameter for all three responses is revealed as the % of GGBS.
- Taguchi and ANOVA eliminate any significant impact of the percentage of polypropylene fibers on the workability and alkali ratio on the compressive and flexural strengths.
- The optimum level for different factors corresponds to a 1:2 (10 molar) alkali ratio, 80% GGBS, and 2% polypropylene fibers for workability; a 1:2 (10 molar) alkali ratio, 80% GGBS, and 2.5% polypropylene fibers for compressive strength; and 1:2 (10 molar) alkali ratio, 80% GGBS, and 1.5% polypropylene fibers for flexural strength.
- The confirmation test verified the experimental results to the predicted optimum quality characteristics at the optimum levels of the process parameters identified through analysis. The experimental values of the confirmation tests resonate with the values for the control mix with 100% cement content, thereby suggesting the pertinence of the study leading to a sustainable concrete, which has less embodied energy, as proposed by different researchers and mentioned in the introduction section, followed by achievement of the sustainable goals.
Author Contributions
Funding
Institutional Review Board Statement
Informed Consent Statement
Data Availability Statement
Conflicts of Interest
References
- Davidovits, J. Geopolymer cements to minimize carbon dioxide greenhouse warming. Ceram. Trans. 1993, 37, 165–182. [Google Scholar]
- Benhelal, E.; Zahedi, G.; Shamsaei, E.; Bahadori, A. Global strategies and potentials to curb CO2 emissions in cement industry. J. Clean. Prod. 2013, 51, 142–161. [Google Scholar] [CrossRef]
- Madheswaran, C.K.; Ambily, P.S.; Lakshmanan, N.; Dattatreya, J.K.; Sathik, S.J. Shear behavior of reinforced geopolymer concrete thin-webbed t-beams. ACI Mater. J. 2014, 111, 89. [Google Scholar]
- Duxson, P.; Fernández-Jiménez, A.; Provis, J.L.; Lukey, G.C.; Palomo, A.; van Deventer, J.S. Geopolymer technology: The current state of the art. J. Mater. Sci. 2007, 42, 2917–2933. [Google Scholar] [CrossRef]
- Al-Alwan, A.A.K.; Al-Bazoon, M.; Mussa, F.I.; Alalwan, H.A.; Shadhar, M.H.; Mohammed, M.M.; Mohammed, M.F. The impact of using rice husk ash as a replacement material in concrete: An experimental study. J. King Saud Univ.-Eng. Sci. 2022, in press. [Google Scholar] [CrossRef]
- Khan, M.I.; Usman, M.; Rizwan, S.A.; Hanif, A. Self-consolidating lightweight concrete incorporating limestone powder and fly ash as supplementary cementing material. Materials 2019, 12, 3050. [Google Scholar] [CrossRef]
- Ahmad, J.; Kontoleon, K.J.; Majdi, A.; Naqash, M.T.; Deifalla, A.F.; Ben Kahla, N.; Isleem, H.F.; Qaidi, S.M.A. A Comprehensive Review on the Ground Granulated Blast Furnace Slag (GGBS) in Concrete Production. Sustainability 2022, 14, 8783. [Google Scholar] [CrossRef]
- Malathy, R.; Shanmugam, R.; Chung, I.M.; Kim, S.H.; Prabakaran, M. Mechanical and Microstructural Properties of Composite Mortars with Lime, Silica Fume and Rice Husk Ash. Processes 2022, 10, 1424. [Google Scholar] [CrossRef]
- Khan, R.; Jabbar, A.; Ahmad, I.; Khan, W.; Khan, A.N.; Mirza, J. Reduction in environmental problems using rice-husk ash in concrete. Constr. Build. Mater. 2012, 30, 360–365. [Google Scholar] [CrossRef]
- Oner, A.; Akyuz, S.; Yildiz, R. An experimental study on strength development of concrete containing fly ash and optimum usage of fly ash in concrete. Cem. Concr. Res. 2005, 35, 1165–1171. [Google Scholar] [CrossRef]
- Wang, J.; Basheer, P.M.; Nanukuttan, S.V.; Long, A.E.; Bai, Y. Influence of service loading and the resulting micro-cracks on chloride resistance of concrete. Constr. Build. Mater. 2016, 108, 56–66. [Google Scholar] [CrossRef]
- Davidovits, J. Geopolymers and geopolymeric materials. J. Therm. Anal. 1989, 35, 429–441. [Google Scholar] [CrossRef]
- Görhan, G.; Aslaner, R.; Şinik, O. The effect of curing on the properties of metakaolin and fly ash-based geopolymer paste. Compos. Part B Eng. 2016, 97, 329–335. [Google Scholar] [CrossRef]
- Fernández-Jiménez, A.; Palomo, A. Composition and microstructure of alkali activated fly ash binder: Effect of the activator. Cem. Concr. Res. 2005, 35, 1984–1992. [Google Scholar] [CrossRef]
- Olivia, M.; Nikraz, H. Properties of fly ash geopolymer concrete designed by Taguchi method. Mater. Des. 2012, 36, 191–198. [Google Scholar] [CrossRef]
- Hardjito, D.; Wallah, S.E.; Sumajouw, D.M.; Rangan, B.V. On the development of fly ash-based geopolymer concrete. Mater. J. 2004, 101, 467–472. [Google Scholar]
- Chindaprasirt, P.; Chareerat, T.; Sirivivatnanon, V. Workability and strength of coarse high calcium fly ash geopolymer. Cem. Concr. Compos. 2007, 29, 224–229. [Google Scholar] [CrossRef]
- Yunsheng, Z.; Wei, S.; Zongjin, L.; Xiangming, Z.; Chungkong, C. Impact properties of geopolymer based extrudates incorporated with fly ash and PVA short fiber. Constr. Build. Mater. 2008, 22, 370–383. [Google Scholar] [CrossRef]
- Ng, T.S.; Voo, Y.L.; Foster, S.J. Sustainability with ultra-high performance and geopolymer concrete construction. In Innovative Materials and Techniques in Concrete Construction; Springer: Dordrecht, The Netherlands, 2012; pp. 81–100. [Google Scholar]
- Shilar, F.A.; Ganachari, S.V.; Patil, V.B. Investigation of the effect of granite waste powder as a binder for different molarity of geopolymer concrete on fresh and mechanical properties. Mater. Lett. 2022, 309, 131302. [Google Scholar] [CrossRef]
- Onyelowe, K.C.; Kontoni, D.P.N.; Ebid, A.M.; Dabbaghi, F.; Soleymani, A.; Jahangir, H.; Nehdi, M.L. Multi-Objective Optimization of Sustainable Concrete Containing Fly Ash Based on Environmental and Mechanical Considerations. Buildings 2022, 12, 948. [Google Scholar] [CrossRef]
- Jawahar, J.G.; Mounika, G. Strength Properties of Fly Ash and GGBS based Geo Polymer Concrete. Asian J. Civ. Eng. 2016, 17, 127–135. [Google Scholar]
- Xie, J.; Wang, J.; Rao, R.; Wang, C.; Fang, C. Effects of combined usage of GGBS and fly ash on workability and mechanical properties of alkali activated geopolymer concrete with recycled aggregate. Compos. Part B Eng. 2019, 164, 179–190. [Google Scholar] [CrossRef]
- Jayarajan, G.; Arivalagan, S. An experimental study of geopolymer concrete incorporated with fly-ash & GGBS. Mater. Today Proc. 2021, 45, 6915–6920. [Google Scholar]
- Mohamed, O. Durability and compressive strength of high cement replacement ratio self-consolidating concrete. Buildings 2018, 8, 153. [Google Scholar] [CrossRef]
- Jawahar, J.G.; Lavanya, D.; Sashidhar, C. Performance of fly ash and GGBS based geopolymer concrete in acid environment. Int. J. Res. Sci. Innov. 2016, 3, 101–104. [Google Scholar]
- Panagiotopoulou, C.; Kontori, E.; Perraki, T.; Kakali, G. Dissolution of aluminosilicate minerals and by-products in alkaline media. J. Mater. Sci. 2007, 42, 2967–2973. [Google Scholar] [CrossRef]
- Supraja, V.; Rao, M.K. Experimental study on Geo-Polymer concrete incorporating GGBS. Int. J. Electron. Commun. Soft Comput. Sci. Eng. 2012, 2, 11. [Google Scholar]
- Mathew, B.J.; Sudhakar, M.; Natarajan, C. Strength, economic and sustainability characteristics of coal ash-GGBS based geopolymer concrete. Int. J. Comput. Eng. Res. 2013, 3, 207–212. [Google Scholar]
- Ganesh, A.C.; Muthukannan, M. Development of high performance sustainable optimized fiber reinforced geopolymer concrete and prediction of compressive strength. J. Clean. Prod. 2021, 282, 124543. [Google Scholar] [CrossRef]
- Alyousef, R.; Mohammadhosseini, H.; Ebid, A.A.K.; Alabduljabbar, H.; Poi Ngian, S.; Huseien, G.F.; Mustafa Mohamed, A. Enhanced Acoustic Properties of a Novel Prepacked Aggregates Concrete Reinforced with Waste Polypropylene Fibers. Materials 2022, 15, 1173. [Google Scholar] [CrossRef] [PubMed]
- Alyousef, R.; Mohammadhosseini, H.; Ebid, A.A.K.; Alabduljabbar, H.; Ngian, S.P.; Mohamed, A.M. Durability Enhancement of Sustainable Concrete Composites Comprising Waste Metalized Film Food Packaging Fibers and Palm Oil Fuel Ash. Sustainability 2022, 14, 5253. [Google Scholar] [CrossRef]
- Deepa Raj, S.; Ramachandran, A. Performance of hybrid fibre reinforced geopolymer concrete beams. SN Appl. Sci. 2019, 1, 1725. [Google Scholar] [CrossRef]
- Kantarcı, F. Influence of fiber characteristics on sulfate resistance of ambient-cured geopolymer concrete. Struct. Concr. 2022, 23, 775–790. [Google Scholar] [CrossRef]
- Ganesh, A.C.; Muthukannan, M. Experimental study on the behaviour of hybrid fiber reinforced geopolymer concrete under ambient curing condition. In IOP Conference Series: Materials Science and Engineering; IOP Publishing: Bristol, UK, 2019; Volume 561, p. 012014. [Google Scholar]
- Mousavinejad, S.H.G.; Sammak, M. Strength and chloride ion penetration resistance of ultra-high-performance fiber reinforced geopolymer concrete. In Structures; Elsevier: Amsterdam, The Netherlands, 2021; Volume 32, pp. 1420–1427. [Google Scholar]
- Prasad, B.V.; Anand, N.; Kiran, T.; Jayakumar, G.; Sohliya, A.; Ebenezer, S. Influence of fibers on fresh properties and compressive strength of geo-polymer concrete. Mater. Today Proc. 2022, 57, 2355–2363. [Google Scholar] [CrossRef]
- Wang, Y.; Zheng, T.; Zheng, X.; Liu, Y.; Darkwa, J.; Zhou, G. Thermo-mechanical and moisture absorption properties of fly ash-based lightweight geopolymer concrete reinforced by polypropylene fibers. Constr. Build. Mater. 2020, 251, 118960. [Google Scholar] [CrossRef]
- Krishnan, T.; Purushothaman, R. Optimization and influence of parameter affecting the compressive strength of geopolymer concrete containing recycled concrete aggregate: Using full factorial design approach. In IOP Conference Series: Earth and Environmental Science; IOP Publishing: Bristol, UK, 2017; Volume 80, p. 012013. [Google Scholar]
- Bhogayata, A.; Kakadiya, S.; Makwana, R. Neural Network for Mixture Design Optimization of Geopolymer Concrete. ACI Mater. J. 2021, 118, 91–97. [Google Scholar]
- Onyelowe, K.C.; Ebid, A.M.; Nwobia, L.I.; Obianyo, I.I. Shrinkage limit multi-AI-based predictive models for sustainable utilization of activated rice husk ash for treating expansive pavement subgrade. Transp. Infrastruct. Geotechnol. 2021, 2021, 1–19. [Google Scholar] [CrossRef]
- Shahmansouri, A.A.; Nematzadeh, M.; Behnood, A. Mechanical properties of GGBFS-based geopolymer concrete incorporating natural zeolite and silica fume with an optimum design using response surface method. J. Build. Eng. 2021, 36, 102138. [Google Scholar] [CrossRef]
- Abd Elaty, M.A.A.; Ghazy, M.F.; Abd El Hameed, M.F. Optimization of geopolymer concrete by Principal Component Analysis. ACI Mater. J. 2017, 114, 253. [Google Scholar]
- Dave, S.V.; Bhogayata, A. The strength oriented mix design for geopolymer concrete using Taguchi method and Indian concrete mix design code. Constr. Build. Mater. 2020, 262, 120853. [Google Scholar] [CrossRef]
- Mehta, A.; Siddique, R.; Singh, B.P.; Aggoun, S.; Łagód, G.; Barnat-Hunek, D. Influence of various parameters on strength and absorption properties of fly ash based geopolymer concrete designed by Taguchi method. Constr. Build. Mater. 2017, 150, 817–824. [Google Scholar] [CrossRef]
- Hadi, M.N.; Farhan, N.A.; Sheikh, M.N. Design of geopolymer concrete with GGBFS at ambient curing condition using Taguchi method. Constr. Build. Mater. 2017, 140, 424–431. [Google Scholar] [CrossRef]
- Karthik, S.; Mohan, K.S.R. A taguchi approach for optimizing design mixture of geopolymer concrete incorporating fly ash, ground granulated blast furnace slag and silica fume. Crystals 2021, 11, 1279. [Google Scholar] [CrossRef]
- Prusty, J.K.; Pradhan, B. Multi-response optimization using Taguchi-Grey relational analysis for composition of fly ash-ground granulated blast furnace slag based geopolymer concrete. Constr. Build. Mater. 2020, 241, 118049. [Google Scholar] [CrossRef]
- Mijarsh, M.J.A.; Johari, M.M.; Ahmad, Z.A. Synthesis of geopolymer from large amounts of treated palm oil fuel ash: Application of the Taguchi method in investigating the main parameters affecting compressive strength. Constr. Build. Mater. 2014, 52, 473–481. [Google Scholar] [CrossRef]
- Khalaj, M.J.; Khoshakhlagh, A.; Bahri, S.; Khoeini, M.; Nazerfakhari, M. Split tensile strength of slag-based geopolymer composites reinforced with steel fibers: Application of Taguchi method in evaluating the effect of production parameters and their optimum condition. Ceram. Int. 2015, 41, 10697–10701. [Google Scholar] [CrossRef]
- IS 12089; Specification for Granulated Slag for the Manufacture of Portland Slag Cement. Bureau of Indian Standards: New Delhi, India, 1987.
- IS 1489; Portland-Pozzolana Cement-Specification—Part 1: Fly Ash Based. Bureau of Indian Standards: New Delhi, India, 1991.
- IS 5513; Vicat Appratus-Specification. Bureau of Indian Standards: New Delhi, India, 1996.
- IS 4031; Methods of Physical Tests for Hydraulic Cement—Part 4: Determination of Consistency of Standard Cement Paste. Bureau of Indian Standards: New Delhi, India, 1988.
- IS 4031; Method of Physical Tests for Hydraulic Cement—Part 1: Determination of Fineness by Dry Sieving. Bureau of Indian Standards: New Delhi, India, 1996.
- IS 5514; Apparatus Used in ‘Le-Chatelier’ Test-Specification. Bureau of Indian Standards: New Delhi, India, 1969.
- IS 4031; Methods of Physical Tests for Hydraulic Cement—Part 3: Determination of Soundness. Bureau of Indian Standards: New Delhi, India, 1988.
- IS 4031; Methods of Physical Tests for Hydraulic Cement—Part 5: Determination of Initial and Final Setting Times. Bureau of Indian Standards: New Delhi, India, 1988.
- IS 10080; Specification for Vibration Machine. Bureau of Indian Standards: New Delhi, India, 1982.
- IS 4031; Methods of Physical Tests for Hydraulic Cement—Part 6: Determination of Compressive Strength of Hydraulic Cement other than Masonry Cement. Bureau of Indian Standards: New Delhi, India, 1988.
- IS 383; Specification for Coarse and Fine Aggregates from Natural Sources for Concrete. Bureau of Indian Standards: New Delhi, India, 1970.
- IS 460; Specification for Test Sieves—Part 2: Perforated Plate Test Sieves. Bureau of Indian Standards: New Delhi, India, 1985.
- IS 2386; Methods of Test for Aggregates for Concrete—Part I: Particle Size and Shape. Bureau of Indian Standards: New Delhi, India, 1963.
- IS 2386; Methods of Test for Aggregates for Concrete—Part III: Specific Gravity, Density, Voids, Absorption and Bulking. Bureau of Indian Standards: New Delhi, India, 1963.
- Wattimena, O.K.; Antoni; Hardjito, D. A review on the effect of fly ash characteristics and their variations on the synthesis of fly ash based geopolymer. In AIP Conference Proceedings; AIP Publishing LLC.: New York, NY, USA, 2017; Volume 1887, p. 020041. [Google Scholar]
- De Weerdt, K. Geopolymers—State of the Art: FA 1 Environmentally Friendly Concrete: SP 1.1 Low Carbon-Footprint Binder Systems; SINTEF Building and Infrastructure: Trondheim, Norway, 2011. [Google Scholar]
- IS 10262; Concrete Mix Proportioning—Guidelines. Bureau of Indian Standards: New Delhi, India, 2009.
- IS 516; Method of Tests for Strength of Concrete. Bureau of Indian Standards: New Delhi, India, 1959.
- IS 1199; Methods of Sampling and Analysis of Concrete. Bureau of Indian Standards: New Delhi, India, 1959.
- Nath, P.; Sarker, P.K. Effect of GGBFS on setting, workability and early strength properties of fly ash geopolymer concrete cured in ambient condition. Constr. Build. Mater. 2014, 66, 163–171. [Google Scholar] [CrossRef]
- Hung, C.C.; Chang, J.J. The influence of mixture variables for the alkali-activated slag concrete on the properties of concrete. J. Mar. Sci. Technol. 2013, 21, 1. [Google Scholar]
- Hammad, N.; El-Nemr, A.; Hasan, H.E.D. The performance of fiber GGBS based alkali-activated concrete. J. Build. Eng. 2021, 42, 102464. [Google Scholar] [CrossRef]
- Kumar, S.; Kumar, R.; Mehrotra, S.P. Influence of granulated blast furnace slag on the reaction, structure and properties of fly ash based geopolymer. J. Mater. Sci. 2010, 45, 607–615. [Google Scholar] [CrossRef]
- Criado, M.; Fernández-Jiménez, A.; Palomo, A. Alkali activation of fly ash: Effect of the SiO2/Na2O ratio: Part I: FTIR study. Microporous Mesoporous Mater. 2007, 106, 180–191. [Google Scholar] [CrossRef]
- Yuksel, I. Blast-furnace slag. In Waste and Supplementary Cementitious Materials in Concrete; Woodhead Publishing: Cambridge, UK, 2018; pp. 361–415. [Google Scholar]
- Suresh, D.; Nagaraju, K. Ground granulated blast slag (GGBS) in concrete—A review. IOSR J. Mech. Civ. Eng. 2015, 12, 76–82. [Google Scholar]


| Parameter | GGBS | IS: 12089-1987 [51] |
|---|---|---|
| SiO2 | 37.73% | - |
| Al2O3 | 14.42% | - |
| CaO | 37.34% | - |
| Fe2O3 | 1.11% | - |
| MgO | 8.71% | Max. 17% |
| MnO | 0.02% | Max. 5.5% |
| Glass Content (%) | 92.00% | Min. 85% |
| Insoluble Residue | 1.59% | Max. 5% |
| Loss of Ignition | 1.41% | - |
| Sulfide Sulphur | 0.39% | Max. 2% |
| Tests | Apparatus Used | Testing Procedure as Per | Results |
|---|---|---|---|
| Standard Consistency | Vicat Apparatus (conforming to IS 5513:1996) [53] | IS 4031 (Part 4): 1988 [54] | 34% |
| Fineness | Blaine’s Permeability Test | IS 4031 (Part 1): 1996 [55] | 432.4 m2/kg |
| Soundness | Le-Chatelier’s Apparatus (conforming to IS 5514:1969) [56] | IS 4031 (Part 3): 1988 [57] | 8 mm |
| Initial Setting Time | Vicat Apparatus (conforming to IS 5513:1996) | IS 4031 (Part 5): 1988 [58] | 32 min |
| Final Setting Time | Vicat Apparatus (conforming to IS 5513:1996) | IS 4031 (Part 5): 1988 | 300 min |
| Compressive Strength | Cube mold of 70.6 mm (conforming to IS: 10080-1982) [59] | IS 4031 (Part 6): 1988 [60] | 7 Days—20.3 MPa |
| 28 Days—37.8 MPa |
| IS Sieve Size | Sieve Size (mm) | Weight of Empty Sieve (gm) | Weight of Sieve + Retained Sand (gm) | Weight of Retained Sand (gm) | Limits for Zone II as per IS: 383-1970 | Cumulative Weight Retained (gm) | Cumulative % Weight Retained | Cumulative % Passing | |
|---|---|---|---|---|---|---|---|---|---|
| Lower | Upper | ||||||||
| 10 mm | 10 | 435 | 435 | 0 | 100 | 100 | 0 | 0 | 100 |
| 4.75 mm | 4.75 | 425 | 485 | 26 | 90 | 100 | 26 | 5.2 | 95 |
| 2.36 mm | 2.36 | 385 | 420 | 29 | 75 | 100 | 55 | 11 | 89 |
| 1.18 mm | 1.18 | 410 | 465 | 80 | 55 | 90 | 135 | 27 | 73 |
| 600 microns | 0.6 | 380 | 500 | 141 | 35 | 59 | 276 | 55.2 | 45 |
| 300 microns | 0.3 | 345 | 555 | 144 | 8 | 30 | 420 | 84 | 16 |
| 150 microns | 0.15 | 355 | 365 | 70 | 0 | 10 | 490 | 98 | 2 |
| Lower Pan | 425 | 430 | 10 | 500 | |||||
| Tests | Apparatus Used | IS Code Used | Results |
|---|---|---|---|
| Fineness Modulus | Standard IS sieves and shaker (Conforming to IS: 460 (Part 2)-1985) [62] | IS 2386 (Part 1): 1963 [63] | 3.09 |
| Specific Gravity | Pycnometer of about 1-liter capacity | IS 2386 (Part 3): 1963 [64] | 2.51 |
| Apparent Specific Gravity | Pycnometer of about 1-liter capacity | IS 2386 (Part 3): 1963 | 2.60 |
| Water Absorption | Pycnometer of about 1-liter capacity | IS 2386 (Part 3): 1963 | 1.051% |
| Bulk Density | Pycnometer of about 1-liter capacity | IS 2386 (Part 3): 1963 | 1668 kg/m3 |
| Characteristics | Values |
|---|---|
| Type | Crushed |
| Bulk Density | 1765 kg/m3 |
| Specific Gravity | 2.71 |
| Nominal size | 20 mm |
| Fineness Modulus | 6.45 |
| Water Absorption | 1.5% |
| Flakiness Index | 12.90% |
| Elongation Index | 12.92% |
| Fibers | Melting Point (Degree Celsius) | Diameter (mm) | Density (gm/cm3) | Tensile Strength (kN/mm2) |
|---|---|---|---|---|
| Polypropylene | 164 | 0.29 | 0.91 | 0.67 |
| Chemical | CASR No. | Molecular Formula | Molecular Weight (g/mol) | Description | Solubility | Assay |
|---|---|---|---|---|---|---|
| Sodium Hydroxide | 1310-73-2 | NaOH | 40 | White deliquescent flakes | 10% solution in water is clear | 96% |
| Sodium Meta Silicate Nonahydrate (or Sodium Meta Silicate) | 13517-24-3 | Na2SiO3·9H2O | 284.2 | White crystals (moistened) | Soluble in mixture of water and hydrochloric acid | Abt. 95% |
| Factors | Levels | ||
|---|---|---|---|
| 1 | 2 | 3 | |
| Alkali-Activators Ratio (NaOH:Na2SiO3) | 1:1.5 (8 Molar NaOH) | 1:2 (10 Molar NaOH) | 1:2.5 (12 Molar NaOH) |
| % of GGBS | 80% | 90% | 100% |
| % of Polypropylene Fiber | 1.5% | 2% | 2.5% |
| Mix | Control Factors (CF) and Their Levels | |||
|---|---|---|---|---|
| CF1 | CF2 | CF3 | CF4 | |
| 1 | 1 | 1 | 1 | 1 |
| 2 | 1 | 2 | 2 | 2 |
| 3 | 1 | 3 | 3 | 3 |
| 4 | 2 | 1 | 2 | 3 |
| 5 | 2 | 2 | 3 | 1 |
| 6 | 2 | 3 | 1 | 2 |
| 7 | 3 | 1 | 3 | 2 |
| 8 | 3 | 2 | 1 | 3 |
| 9 | 3 | 3 | 2 | 1 |
| Mix No. | Factor A (Alkali Ratio) | Factor B (% of GGBS) | Factor C (% of PPFibers) | Alkali Ratio | % of GGBS | % of PPFibers | Cement (kg/m3) | GGBS (kg/m3) | PP Fibers (kg/m3) | Fine Aggregate (kg/m3) | Coarse Aggregate (kg/m3) |
|---|---|---|---|---|---|---|---|---|---|---|---|
| M1 | 1 | 1 | 1 | 1:1.5 (8 Molar) | 80 | 1.5 | 112.66 | 450.65 | 8.45 | 698.07 | 911.14 |
| M2 | 1 | 2 | 2 | 1:1.5 (8 Molar) | 90 | 2 | 56.33 | 506.98 | 11.27 | 698.07 | 911.14 |
| M3 | 1 | 3 | 3 | 1:1.5 (8 Molar) | 100 | 2.5 | 0.00 | 563.31 | 14.08 | 698.07 | 911.14 |
| M4 | 2 | 1 | 2 | 1:2 (10 Molar) | 80 | 2.5 | 112.66 | 450.65 | 14.08 | 698.07 | 911.14 |
| M5 | 2 | 2 | 3 | 1:2 (10 Molar) | 90 | 1.5 | 56.33 | 506.98 | 8.45 | 698.07 | 911.14 |
| M6 | 2 | 3 | 1 | 1:2 (10 Molar) | 100 | 2 | 0.00 | 563.31 | 11.27 | 698.07 | 911.14 |
| M7 | 3 | 1 | 3 | 1:2.5 (12 Molar) | 80 | 2 | 112.66 | 450.65 | 11.27 | 698.07 | 911.14 |
| M8 | 3 | 2 | 1 | 1:2.5 (12 Molar) | 90 | 2.5 | 56.33 | 506.98 | 14.08 | 698.07 | 911.14 |
| M9 | 3 | 3 | 2 | 1:2.5 (12 Molar) | 100 | 1.5 | 0.00 | 563.31 | 8.45 | 698.07 | 911.14 |
| Name of Mix | Alkali-Ratio (NaOH:Na2SiO3) | % of GGBS | % of PP Fibers | Workability (Compaction Factor) | Average Compressive Strength at 7 Days (MPa) | Average Compressive Strength at 28 Days (MPa) | Average Flexural Strength at 28 Days (MPa) |
|---|---|---|---|---|---|---|---|
| Control Mix (M25) | - | - | - | 0.92 | 18.28 | 25.48 | 3.43 |
| M1 | 1:1.5 (8 Molar) | 80 | 1.5 | 0.70 | 14.35 | 17.64 | 2.71 |
| M2 | 1:1.5 (8 Molar) | 90 | 2 | 0.69 | 8.67 | 10.48 | 2.19 |
| M3 | 1:1.5 (8 Molar) | 100 | 2.5 | 0.63 | 9.05 | 11.19 | 2.26 |
| M4 | 1:2 (10 Molar) | 80 | 2.5 | 0.74 | 15.87 | 23.74 | 3.39 |
| M5 | 1:2 (10 Molar) | 90 | 1.5 | 0.71 | 13.86 | 16.52 | 2.68 |
| M6 | 1:2 (10 Molar) | 100 | 2 | 0.67 | 5.28 | 9.09 | 1.99 |
| M7 | 1:2.5 (12 Molar) | 80 | 2 | 0.71 | 10.84 | 12.29 | 2.50 |
| M8 | 1:2.5 (12 Molar) | 90 | 2.5 | 0.70 | 14.38 | 18.30 | 2.39 |
| M9 | 1:2.5 (12 Molar) | 100 | 1.5 | 0.64 | 10.15 | 11.33 | 2.61 |
| Response | Level | Factors | ||
|---|---|---|---|---|
| Alkali Ratio | % of GGBS | % of Polypropylene Fibers | ||
| Workability | 1 | −3.445 | −2.896 | −3.316 |
| 2 | −3.023 | −3.099 | −3.225 | |
| 3 | −3.316 | −3.789 | −3.242 | |
| Delta | 0.422 | 0.893 | 0.091 | |
| Rank | 2 | 1 | 3 | |
| Contribution | 30.01% | 63.51% | 6.47% | |
| Compressive Strength | 1 | 22.11 | 24.74 | 23.46 |
| 2 | 23.68 | 23.34 | 20.46 | |
| 3 | 22.71 | 20.41 | 24.58 | |
| Delta | 1.58 | 4.33 | 4.12 | |
| Rank | 3 | 1 | 2 | |
| Contribution | 15.75% | 43.17% | 41.08% | |
| Flexural Strength | 1 | 7.517 | 9.074 | 8.518 |
| 2 | 8.381 | 7.647 | 6.915 | |
| 3 | 7.953 | 7.131 | 8.418 | |
| Delta | 0.864 | 1.943 | 1.603 | |
| Rank | 3 | 1 | 2 | |
| Contribution | 19.59% | 44.06% | 36.35% | |
| Response | Source | DF | Adj SS | Adj MS | F-Value | p-Value | Contribution (%) |
|---|---|---|---|---|---|---|---|
| Workability | Alkali Ratio | 2 | 0.001756 | 0.000878 | 19.75 | 0.048 | 17.64 |
| % of GGBS | 2 | 0.008022 | 0.004011 | 90.25 | 0.011 | 80.57 | |
| % of Polypropylene Fibers | 2 | 0.000089 | 0.000044 | 1.00 | 0.500 | 0.89 | |
| Error | 2 | 0.000089 | 0.000044 | ||||
| Total | 8 | 0.009956 | |||||
| Compressive Strength | Alkali Ratio | 2 | 18.115 | 9.057 | 2.89 | 0.257 | 9.79 |
| % of GGBS | 2 | 82.623 | 41.311 | 13.18 | 0.071 | 44.64 | |
| % of Polypropylene Fibers | 2 | 78.075 | 39.037 | 12.46 | 0.074 | 42.18 | |
| Error | 2 | 6.268 | 3.134 | ||||
| Total | 8 | 185.080 | |||||
| Flexural Strength | Alkali Ratio | 2 | 0.1377 | 0.06884 | 0.65 | 0.605 | 10.58 |
| % of GGBS | 2 | 0.5537 | 0.27684 | 2.63 | 0.276 | 42.55 | |
| % of Polypropylene Fibers | 2 | 0.3993 | 0.19964 | 1.90 | 0.345 | 30.69 | |
| Error | 2 | 0.2106 | 0.10528 | ||||
| Total | 8 | 1.3012 |
| Response | Prediction of Optimum Quality Characteristics | Experimental Value |
|---|---|---|
| Workability | 0.74 | 0.75 |
| Compressive Strength (MPa) | 23.07 | 24.12 |
| Flexural Strength (MPa) | 3.17 | 3.25 |
Publisher’s Note: MDPI stays neutral with regard to jurisdictional claims in published maps and institutional affiliations. |
© 2022 by the authors. Licensee MDPI, Basel, Switzerland. This article is an open access article distributed under the terms and conditions of the Creative Commons Attribution (CC BY) license (https://creativecommons.org/licenses/by/4.0/).
Share and Cite
Thakur, G.; Singh, Y.; Singh, R.; Prakash, C.; Saxena, K.K.; Pramanik, A.; Basak, A.; Subramaniam, S. Development of GGBS-Based Geopolymer Concrete Incorporated with Polypropylene Fibers as Sustainable Materials. Sustainability 2022, 14, 10639. https://doi.org/10.3390/su141710639
Thakur G, Singh Y, Singh R, Prakash C, Saxena KK, Pramanik A, Basak A, Subramaniam S. Development of GGBS-Based Geopolymer Concrete Incorporated with Polypropylene Fibers as Sustainable Materials. Sustainability. 2022; 14(17):10639. https://doi.org/10.3390/su141710639
Chicago/Turabian StyleThakur, Gaurav, Yatendra Singh, Rajesh Singh, Chander Prakash, Kuldeep K. Saxena, Alokesh Pramanik, Animesh Basak, and Shankar Subramaniam. 2022. "Development of GGBS-Based Geopolymer Concrete Incorporated with Polypropylene Fibers as Sustainable Materials" Sustainability 14, no. 17: 10639. https://doi.org/10.3390/su141710639
APA StyleThakur, G., Singh, Y., Singh, R., Prakash, C., Saxena, K. K., Pramanik, A., Basak, A., & Subramaniam, S. (2022). Development of GGBS-Based Geopolymer Concrete Incorporated with Polypropylene Fibers as Sustainable Materials. Sustainability, 14(17), 10639. https://doi.org/10.3390/su141710639