Article

Calculation and Assessment of CO2e Emissions in Road Freight Transportation: A Greek Case Study

by
Anastasios Gialos
1,
Vasileios Zeimpekis
1,*,
Michael Madas
2 and
Konstantinos Papageorgiou
3,4
1
Department of Financial & Management Engineering, School of Engineering, University of the Aegean, 82100 Chios, Greece
2
Department of Applied Informatics, School of Information Sciences Information Systems and e-Business Laboratory (ISeB), University of Macedonia, 54636 Thessaloniki, Greece
3
Department of Maritime Studies, School of Maritime and Industrial Studies, University of Piraeus, 18534 Piraeus, Greece
4
Papageorgiou Transport & Logistics (PTL), 47100 Arta, Greece
*
Author to whom correspondence should be addressed.
Sustainability 2022, 14(17), 10724; https://doi.org/10.3390/su141710724
Submission received: 24 July 2022 / Revised: 24 August 2022 / Accepted: 25 August 2022 / Published: 29 August 2022
(This article belongs to the Special Issue Sustainable Economy and Green Logistics)

Abstract

:
Road freight transportation is already contributing significantly to global warming, and its emissions are predicted to grow dramatically in the following years. Carbon footprint calculation can be used to assess CO2e emissions to understand how an organization’s activities impact global sustainability. To this end, the main objective of this paper is initially to assess the impact of Green House Gas (GHG) emissions stemming from road freight transportation. Subsequently, we adopt the EN 16258 standard to calculate the carbon footprint of a truck fleet of a freight transport operator in Greece. Based on the obtained results, we assess the performance of the company’s fleet by adopting relevant sustainability indicators. We also evaluate the use of CNG as an alternative fuel and its impact on CO2e emissions and operational costs. The paper concludes with a list of additional measures toward further reduction and offsetting of CO2e emissions.

1. Introduction

Logistics activities are influential contributors to global GHG emissions [1]. Indeed, the latter account for roughly 5.5% of the total global greenhouse gas (GHG) emissions, with almost 90% of these emissions stemming from freight transportation and two-thirds of these transport GHG emissions being generated by trucks and vans [2]. In Europe, road transport constitutes the highest proportion of overall transport emissions since, in 2019, it emitted 72% of all domestic and international transport GHG emissions [3].
On the other hand, COVID-19-related restrictions have triggered changes in passenger mobility patterns and freight transport demand in global supply chains. Transport demand has indisputably driven down CO2e emissions from the global transport sector by over 10% in 2020 [4]. However, global transport activity rebounded quickly in 2021, with road transport demand recovering to pre-COVID-19 levels at the end of 2021, hence bringing their associated CO2e emissions back on track at just 5% below the 2019 levels. The rapidly increasing transport demand along with anticipated growth rates in the years to come pose serious challenges towards the achievement of the Net Zero Emissions Scenario by 2050, which requires, as an intermediate milestone, the reduction of transport sector emissions by 20% to 5.7 Gt by 2030 [4].
The achievement of challenging Net Zero Emissions goals calls for coordinated policy actions, industry initiatives, and research efforts that will promote inter alia a modal shift to the least carbon-intensive transport options along with technological efforts aiming to reduce the carbon intensity of all transport modes, with particular emphasis placed on freight transport and the heavy truck industry. Key policy measures examined for the decarbonization of the transport industry involve the deployment of fiscal instruments (e.g., taxation, congestion charges, road tolls, restricted traffic zones) and incentives (e.g., electric vehicle purchase subsidies) to drive uptake of low or zero-carbon technologies and fuels. Road transport electrification is expected to reduce the well-to-wheel GHG emissions and act as a primary accelerator of the pathway towards zero emissions. However, it needs to be closely aided by the establishment of infrastructure (e.g., fast-charging infrastructure) supporting zero-emissions vehicles that are seriously lagging targets in many countries (e.g., Greece). Despite the rapid sales growth of electric and low-carbon vehicles worldwide, their emission reduction potential seems to be obstructed by the fact that vital freight transport options offering long-term decarbonization of heavy-duty freight vehicles/trucks remain in the demonstration and early prototyping stages [5]. As a matter of fact, the heavy freight vehicles segment, being a primary contributor to energy consumption and emissions (responsible for about a quarter of CO2e emissions from road transport in the EU and 6% of total EU emissions) [6], should be given high priority in terms of improvements in fuel economy and emissions, with the ultimate vision to the mass roll-out of zero-emission vehicles [5].
Recognizing the essential role of freight transport in GHG emissions, global supply chain stakeholders have reached an agreement on the imperative need to monitor, control, and reduce GHG emissions from freight transport operations. Policymakers pursue immediate interventions that set specific targets for fleet-wide average emissions of new trucks and provide incentive mechanisms for the uptake of zero and low-emission vehicles (e.g., EU Regulation 2019/1242) [7]. The research community has been actively engaged in cross-cutting research aiming to develop eco-friendly transportation systems (e.g., engines and fuels). Simultaneously, they have been deploying reliable methodologies, tools, and standards (e.g., EN 16258, 2012) to obtain consistent and reliable measurements of transport-related GHG emissions and the benefits derived from GHG-cutting opportunities brought forward in cooperation with industry actors (e.g., vehicle manufacturers, freight transport operators). Our research focuses on the evaluation and improvement of the environmental performance of vehicle fleet operations through the assessment of energy consumption and GHG emissions stemming from road freight transportation. In particular, we adopt the EN 16258 standard in order to: (i) calculate the carbon footprint of a truck fleet of a freight transport operator in Greece and (ii) the assessment of the potential use of CNG as an alternative fuel and its impacts on CO2e emissions and operational costs.
The remainder of the paper is split into six thematic sections. Section 2 discusses existing relevant research on GHG emissions from the freight transport sector. Section 3 presents the EN 16258-based methodology for carbon footprint calculation adopted in our analysis. Section 4 describes the case study under consideration, while Section 5 presents the results of the assessment of the environmental performance (i.e., energy consumption, GHG emissions) of the fleet of a freight transport operator in Greece. Section 6 examines an alternative scenario on the use of CNG as an alternative fuel and its impact on CO2e emissions and operational costs. Finally, the paper is complemented by a list of proposed measures and interventions toward further reducing and offsetting transport-related emissions.

2. GHG Emissions from the Road Freight Transport Sector

Relevant research on the decarbonization of the road freight transport sector and the assessment of its underlying GHG emissions lies in four parallel research streams, each dealing with the respective research topics: (i) review and development of modelling techniques and approaches for measuring road transport emissions, (ii) various applications and case studies measuring transport emissions in different geographical contexts and segments of road freight transport, (iii) challenges/barriers and drivers of the decarbonization of the road freight transport sector, and (iv) investigation of the relationship between development/growth, infrastructure and CO2e emissions from transport.
The first stream contains research dealing with the modelling tools and methods available for analyzing transport-related emissions. Linton et al. [8] propose a classification of available models involving a broad range of techniques from transport microsimulation and behavioral models to agent-based and systems dynamics modelling and global techno-economic models. Furthermore, they elaborate on the suitability of these models in different spatial (e.g., local, global/network) or temporal (e.g., near-term future, long-term forecasts) contexts [8]. Other researchers aim to contribute toward a harmonized and commonly agreed upon carbon footprint calculation process [9] or even pave the way to a new, global EN 16258-based standard for all modes of transport, including logistics operations [10].
On a similar front, the second research stream addresses research efforts demonstrating several applications and case studies measuring transport emissions in various geographical contexts, transportation systems, and vehicle or fuel types. McKinnon and Piecyk [11] measured CO2e emissions from road freight transport in the UK over a time period. In a subsequent research effort, they provided measurement of carbon emissions in European chemical transport in comparison with other industrial sectors such as cement, fertilizer, steel, food, paper and board/packaging, etc., adopting an activity-based approach to the measurement of carbon footprint in transport [12]. Duan [13] assessed the carbon footprint of the transport sector in megacities by using a life cycle assessment method demonstrated for Shenzhen in South China. Chang and Huang [14] investigated public transport carbon footprints in Taiwan using a life cycle assessment model with respect to different types of fuel (i.e., diesel, electric, liquefied natural gas, hydrogen) based on ISO 14040:2006 and ISO 14067:2018. Gustafsson et al. [15] focused particularly on heavy-duty transport and demonstrated an assessment of well-to-wheel (WTW) greenhouse gas (GHG) emissions of energy carriers for heavy-duty vehicles while simultaneously examining the effect of the carbon intensity of the electricity used in production.
The third research stream elaborates on the various challenges, barriers, and drivers of the decarbonization of the road freight transport sector. Existing research argues about obstacles preventing substantial reductions of GHG emissions in road transport [16] or driving factors of transport-related CO2e emissions such as road transport energy, economic growth, industrialization, urbanization, oil prices, and road infrastructure [17]. An interesting analysis of carbon emissions from international transport is also offered by Yoon et al. [18]. The authors deployed multi-region input-output analysis and examined the driving factors in transport emissions with a comparative analysis of their findings among China, the United States, and the European Union [18]. A closely relevant research orientation pertains to freight carbon offsetting, that is, compensating for transport emissions through engagement in activities/initiatives designed to make equivalent reductions of emissions in the atmosphere with the intention of a more sustainable global transport network [18]. Other researchers discuss alternative carbon offsetting options in the road transport industry and explore their impact on environmental performance, risks, and lifecycle costs [19].
Last but not least, an emerging field of research adopts mainly econometric models and decomposition analysis methods to investigate causal linkages and relationships between macroeconomic variables as determinants of CO2e emissions from transport. Among the main relationships explored are the development of the transport sector and the associated CO2e emissions from a spatial/regional perspective [19] or the effect of transport infrastructure on emissions, with economic growth and population being also treated as channels through which transport infrastructure influences emissions [19]. Another widely examined relationship in relevant literature is between economic development or growth and transport energy-related carbon emissions [19,20].
Our paper lies at the intersection of the first and second research streams. In particular, we adopt and tailor the EN 16258 Standard [21] to the truck fleet of a freight transport operator in Greece (i.e., PTL). Then, we calculate the environmental performance of the truck fleet with a view to well-to-wheels energy consumption, well-to-wheels GHG emissions, tank-to-wheels energy consumption, and tank-to-wheels GHG emissions. Finally, as part of the corporate sustainability plan of the company, we examine the potential benefits of retrofitting one truck to a dual-fuel mode system designed for the conversion of diesel engines on commercial transport vehicles into engines capable of running on a blend of diesel and Compressed Natural Gas (CNG). A more elaborated discussion of the methodology employed for the calculation of carbon footprint in our analysis is presented in the section that follows.

3. GHG Emissions from the Road Freight Transport Sector

This section describes the methodology adopted to calculate the carbon footprint emissions that come from a truck fleet of a freight transport operator in Greece. The environmental evaluation for the truck fleet is based on the EN 16258 standard.

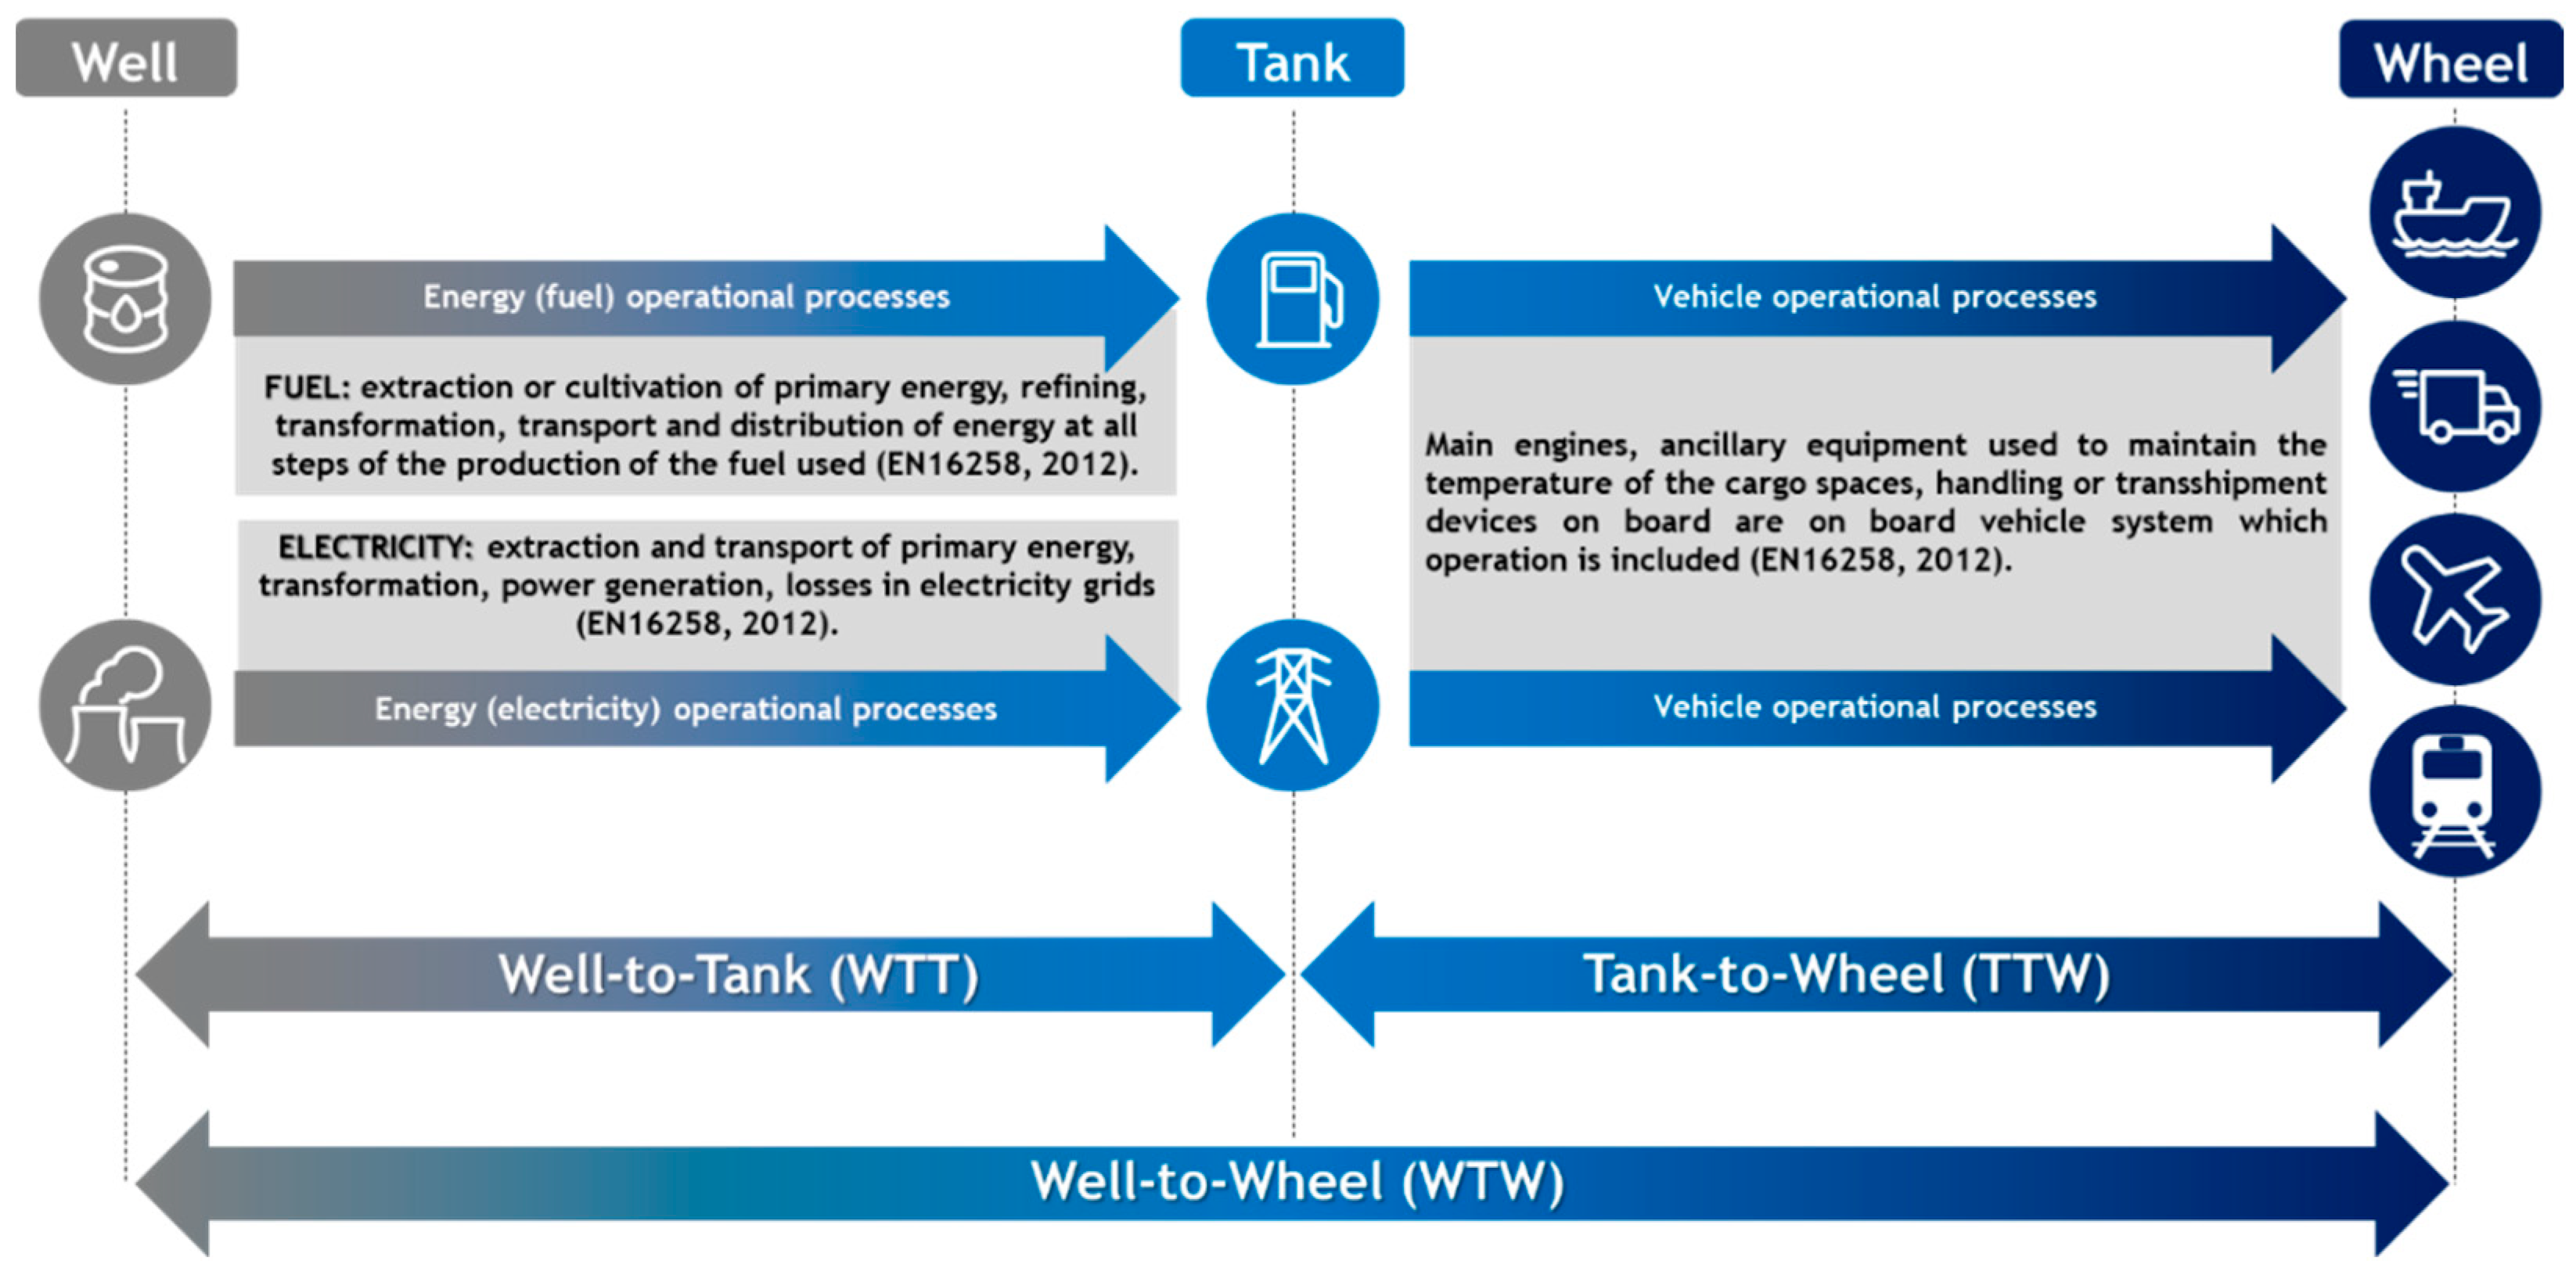
3.1. The EN 16258 Standard

The assessment of the environmental performance of vehicle fleet operations requires the deployment of advanced tools and methodologies, including standards governing the energy consumption and emission calculation process, scope/boundaries, and the definition of relevant sustainability indicators. Currently, the only official international standard for emission calculation of transport operations is EN 16258 [21]. The European Standard EN 16258 was published in 2012 by the European Committee for Standardization (CEN) and establishes a common methodology for the calculation and declaration of energy consumption and GHG emissions related to any transport service. This standard specifies a common approach and framework (e.g., general principles, definitions, system boundaries, calculation methods, allocation rules, data recommendations) in order to give prominence to accurate, credible, and verifiable calculations and declarations regarding energy consumption and GHG emissions for transport services, irrespective of the level of complexity [10]. The implementation of this standard provides a well-to-wheels (WTT) approach when undertaking calculations while at the same time ensuring that the energy and GHG emissions are fully allocated to a vehicle’s load [21]. More specifically, according to the basic principles of the proposed standard, the assessment of energy and GHG emissions of a transport service shall include both vehicle operational processes and energy operational processes that occur during the operational phase of the lifecycle.
As can be seen in Figure 1, the well-to-wheels (WTW) approach is a form of life cycle assessment designed for transport fuels and energy carriers, covering the pathway from resource extraction to use in the vehicle but excluding the life cycle of the vehicle itself [15]. A WTW analysis can be divided into the well-to-tank (WTT) stage and the tank-to-wheels (TTW) stage. The WTT stage includes the energy operational processes and deals with the production, transformation, transportation, and distribution of energy. In contrast, the TTW stage includes the vehicle operational processes and has to do with the energy used for vehicle propulsion during service provision.

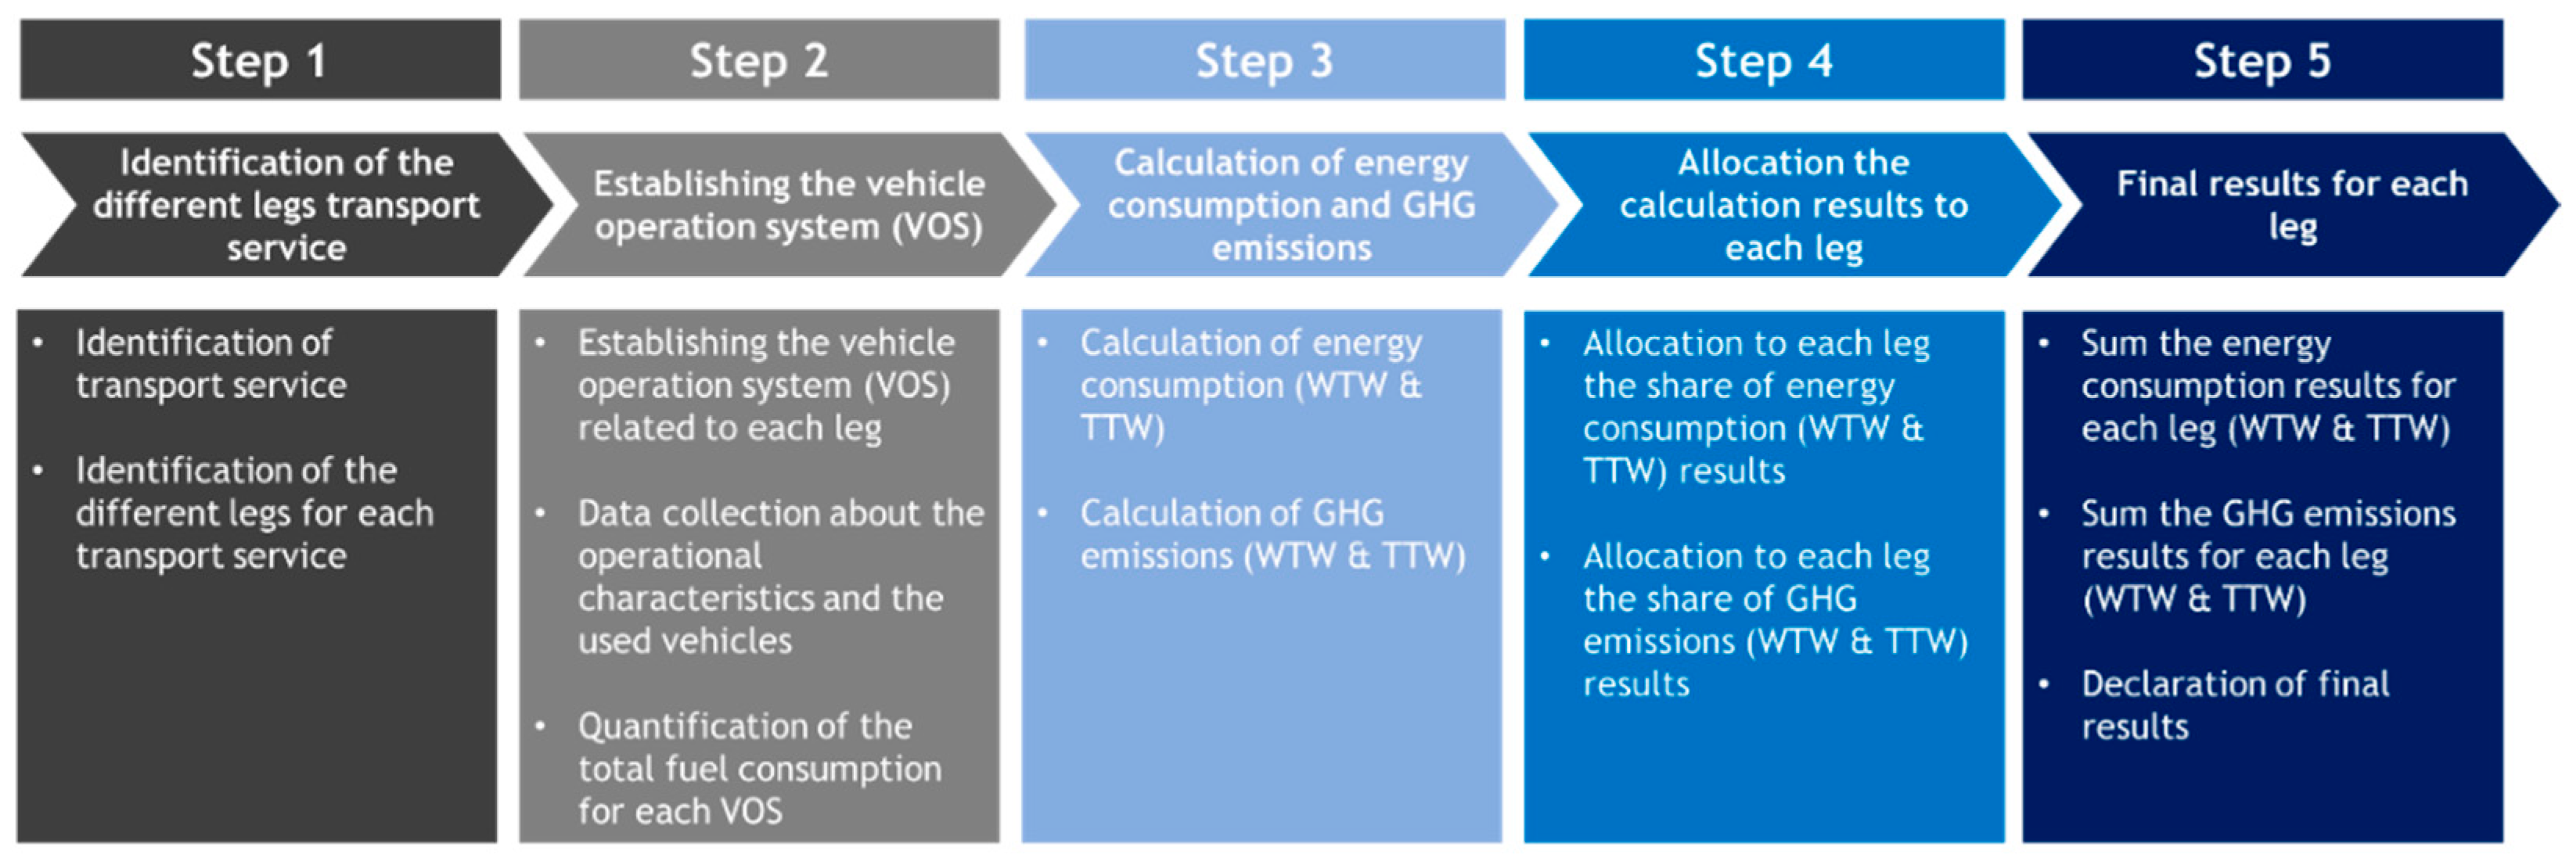
3.2. Carbon Footprint Calculation: Implementation Steps and Methodology

Taking into consideration the guidelines of the EN 16258 Standard [21], we implemented five basic steps (Figure 2) for the calculation of energy consumption and GHG emissions of a truck fleet of a freight transport operator in Greece. Below, we briefly describe the general implementation steps of the selected methodology, while in Section 4, we adapt the implementation steps to the transport operation of the company under consideration in our analysis (i.e., freight transport operator in Greece).
More specifically, the first step deals with the identification of the different legs of transport service (shipments in the case of road transportation). In this step, it is necessary to categorize the transport services which were used during the transportation and then to identify the different legs for each transport service. To this point, it is important to mention that apart from the loaded trips, all the empty trips related to the transport operation should also be considered during the implementation of this standard. The second step focuses on the establishment of the Vehicle Operation System (VOS) for each leg. Furthermore, it is important to mention that in this step, it is necessary to collect a series of operational data (e.g., fuel consumption, distance, load factor, vehicle capacity, empty distance) and vehicles characteristics (e.g., number and type of vehicles, period of activity of vehicles), to quantify the total fuel consumption per VOS.
During the third step, the calculation of energy consumption and GHG emissions can be conducted by using a series of specific equations. According to the EN 16258 standard, energy consumption is estimated by multiplication of the total fuel consumption of the considered transport operation with energy conversion factors (in MJ/kg or MJ/L), while the GHG emissions are calculated by multiplication of the corresponding total fuel consumption with emission factors (in KgCO2e/kg or KgCO2e/L). For each VOS which participates in the transport operation, the following indicators should be calculated: (a) well-to-wheels energy consumption (in MJ), (b) well-to-wheels GHG emissions (in KgCO2e), (c) tank-to-wheels energy consumption (in MJ) and (d) tank-to-wheels GHG emissions (in KgCO2e).
To this point, it is worth mentioning that we have calculated the GHG Emissions in terms of CO2e (CO2-equivalent). CO2-equivalent is an environmental index that evaluates the environmental impact (greenhouse gas emissions) by taking into consideration the following six gases: carbon dioxide (CO2), nitrous oxide (N2O), methane (CH4), Sulphur hexafluoride (SF6), hydrofluorocarbons (HFCs) and perfluorocarbons (PFCs). These six gases are argued to be the most important anthropogenic gases regarding the greenhouse effect.
The fourth step aims to allocate four results from the third step to the different legs for each transport service. By following the implementation principles of the EN 16258 standard, there are various proportional allocation approaches and allocation units [21], but the most widely known allocation unit in road transport is “Ton-kilometer” [22]. Focusing on this allocation unit, the transport activity should be quantified by multiplying the load/quantity of freight (in Tonnes) by the distance travelled (in Kilometer). Lastly, the values of total energy consumption and GHG emissions for the complete transport service should be estimated by summing the corresponding values for all legs of the transport service. Additionally, in this step, to be fully aligned with the basic principles of the selected standard, a short declaration of the results must be completed in two separate parts. The first part should contain the well-to-wheels GHG emissions, while the second part should contain the tank-to-wheels results as well as supporting information.

4. The Case of Papageorgiou Transport & Logistics (PTL) Company

This section presents the environmental evaluation of Papageorgiou Transport & Logistics (PTL) company (freight transport operator in Greece) in terms of energy consumption and GHG emissions. To conduct an integrated evaluation, we adapted the implementation steps of the EN 16258 Standard to the transport operation of the PTL company. Then, we calculated the environmental impact in the following levels: (i) well-to-wheels energy consumption, (ii) well-to-wheels GHG emissions, (iii) tank-to-wheels energy consumption and (iv) tank-to-wheels GHG emissions. The evaluation results are further discussed in the following subsections.

4.1. Description of Papageorgiou Transport & Logistics (PTL) Company

Papageorgiou Transports & Logistics (PTL) is a Greek transportation company that provides top-quality freight transportation services in Western Greece and abroad. The company has a fleet of 24 rigid and articulated trucks and runs dozens of routes daily to serve the needs of its customers. PTL was founded in 1954 and today holds a leading position in the freight transportation and distribution sector in Greece. PTL has started to measure its environmental impact from 2017 onward, while it has made significant strides in the reduction of CO2e by participating in programs that aim to convert existing diesel engines to dual-fuel gas engines (CNG-Diesel).

4.2. Calculation and Allocation of Energy Consumption and GHG Emissions for PTL Company

By considering the implementation steps of EN 16258 Standard, we calculate the energy consumption and GHG emissions for PTL company. More specifically, during the first step, we identify the total number of legs executed from PTL’s truck fleet in 2021. In this phase, we used the Fleet Management System (FMS) of the company, and we exported all the legs which took place during 2021. In our case, a leg corresponds to the distance travelled from a truck from drop point A to drop point B, while more than one legs compose a shipment or route. The total freight transport operation of PTL deals with shipments/routes executed through road transport. Also, it is worth noting that a shipment/route consists of both empty and loaded legs (Figure 3).
In the next step, we considered the truck fleet of the company, and we assigned the trucks with the shipments to connect the shipments/routes with the trucks that execute them. Furthermore, we collected a series of operational data related to the vehicles’ characteristics and legs (Table 1).
Focusing on the data collection methodology, it is important to mention that we extracted all the necessary primary data through the company’s Fleet Management System. The latter provides a series of a-posteriori reports for each truck and traveling leg per route. By elaborating on these reports, we determined the individual legs, and for each leg, we calculated the fuel consumption as well as the distance traveled and the loading factor of the truck. For the case of single-fuel diesel trucks, we took into consideration the fuel consumption only for diesel (Liters Diesel per Km), while in the case of dual fuel trucks, we recorded the fuel consumption for both diesel (Liters Diesel per Km) and CNG (Kg CNG per Km). All the required information about fuel consumption and fuel mix (for the case of retrofitting trucks) came from the Electronic Control Units (ECU) of trucks, which were connected to the company’s Fleet Management System. To this point, it is important to mention that the process of data collection and analysis was the most time-consuming task since it took a significant amount of time to be completed in a correct manner.
During the next step, we calculated the total energy consumption and GHG emissions for PTL company. To this point, it is important to mention that we calculated the energy consumption at the route level (since we had the available data from the FMS of the company) by taking into consideration the different levels per route. All equations that were used for the calculation of environmental impact in terms of well-to-wheel and tank-to-wheel GHG emissions are described in detail, while all equation element units of measurement are defined in Table 2.
The well-to-wheels (WTW) energy consumption can be calculated by exploiting Equation (1):
E wi = j = 1 n EC i , j   ×   EF w ,
where Ewi is the well-to-wheels (WTW) energy consumption for the route i (in MJ), ECi,j is the energy consumption for the leg j of route I (in liters of Diesel), and EFw is the energy factor for the well-to-wheels stage (42.7 MJ/L of Diesel). The well-to-wheels (WTW) GHG emissions can be calculated by using Equation (2):
G wi = j = 1 n EC i , j   ×   GHGF w
where Gwi is the well-to-wheels (WTW) GHG emissions for the route i (in KgCO2e), ECi,j is the energy consumption for the leg j of route I (in liters of Diesel), and GHGFw is the GHG emission factor for the well-to-wheels stage (3.24 KgCO2e/L of Diesel). The tank-to-wheels (TTW) energy consumption can be calculated by exploiting Equation (3):
E ti = j = 1 n EC i , j   ×   EF t
where Eti is the tank-to-wheels (TTW) energy consumption for the route i (in MJ), ECi,j is the energy consumption for the leg j of route I (in liters of Diesel), and EFt is the energy factor for the tank-to-wheels stage (35.9 MJ/L of Diesel). The tank-to-wheels (TTW) GHG emissions can be calculated by using Equation (4):
G ti = j = 1 n EC i , j   ×   GHGF t
where Gti is the tank-to-wheels (TTW) GHG emissions for the route i (in KgCO2e), ECi,j is the energy consumption for the leg j of route I (in liters of Diesel), and GHGFt is the GHG emission factor for the tank-to-wheels stage (2.67 KgCO2e/L of Diesel). Finally, to calculate the total results of Ew (total WTW energy consumption), Gw (total WTW GHG emissions), Et (total TTW energy consumption), and Gt (total TTW GHG emissions) for the complete transport service, we found the sum of all the corresponding values for all routes of the transport service.
During the last step, it is critical to allocate the results of energy consumption and GHG emissions in “Ton-kilometer” to assess the performance of transport operation. Initially, we present Equations (5) and (6) for the allocation of results in Ton-kilometer per route. Additionally, we present the corresponding Equations (7) and (8) for the allocation of results in Ton-kilometer for the total transport operation of the investigated freight transport operator in Greece (PTL). The following equations allocate only the WTW and TTW GHG emissions, but these equations can be used for the corresponding allocation of WTW and TTW energy consumption by replacing the GHG emissions values with the energy consumption values.

4.3. Allocation of GHG Emissions for Each Route of Transport Operation

The allocation of well-to-wheels (WTW) GHG emissions for the route i per Ton-kilometer can be done by using Equation (5):
AG wi = G wi   / j = 1 n LF i , j   ×   PL   ×   D i , j
where AGwi is the allocated well-to-wheels (WTW) GHG emissions for the route i (in KgCO2e/Tn-km), GWi is the well-to-wheels (WTW) GHG emissions for the route i (in KgCO2e), LFi,j is the loading factor for the leg j of route i (in %), PL is the payload of the truck which executes the route I, and Di,j is the travel distance of the leg j of route i (in km). The allocation of tank-to-wheels (TTW) GHG emissions for the route i per Ton-kilometer can be done by exploiting Equation (6):
AG ti = G ti   / j = 1 n LF i , j   ×   PL   ×   D i , j
where AGti is the allocated tank-to-wheels (TTW) GHG emissions for the route i (in KgCO2e/Tn-km), Gti is the tank -to-wheels (TTW) GHG emissions for the route i (in KgCO2e), LFi,j is the loading factor for the leg j of route i (in %), PL is the payload of the truck which executes the route I, and Di,j is the travel distance of the leg j of route i (in km).

4.4. Allocation of GHG Emissions for the Total Transport Operation

The allocation of well-to-wheels (WTW) GHG emissions for the total transport operation per Ton-kilometer can be done by using Equation (7):
TAG w = ( i = 1 k AG wi   ×   DR i ) / TD  
where TAGw is the allocated well-to-wheels (WTW) GHG emissions for the total transport operation (in KgCO2e/Tn-km), AGwi is the allocated well-to-wheels (WTW) GHG emissions for the route i (in KgCO2e/Tn-km), DRi is the total travel distance of route i (in km), and TD is the total distance of all routes executed from the truck fleet of the investigated company (in km). The allocation of tank-to-wheels (TTW) GHG emissions for the total transport operation per Ton-kilometer can be done by exploiting Equation (8):
TAG t = ( i = 1 k AG ti   ×   DR i ) / TD  
where TAGt is the allocated tank-to-wheels (TTW) GHG emissions for the total transport operation (in KgCO2e/Tn-km), AGti is the allocated tank-to-wheels (TTW) GHG emissions for the route i (in KgCO2e/Tn-km), DRi is the total travel distance of route i (in km), and TD is the total distance of all routes executed from the truck fleet of the investigated company (in km).

5. Results of GHG Emissions and Energy Consumption for PTL Company

The main goal of this work was to calculate environmental impact in terms of GHG emissions and energy consumption stemming from the truck fleet of a freight transport operator (PTL) in Greece. To this end, all calculated results are presented in detail below.

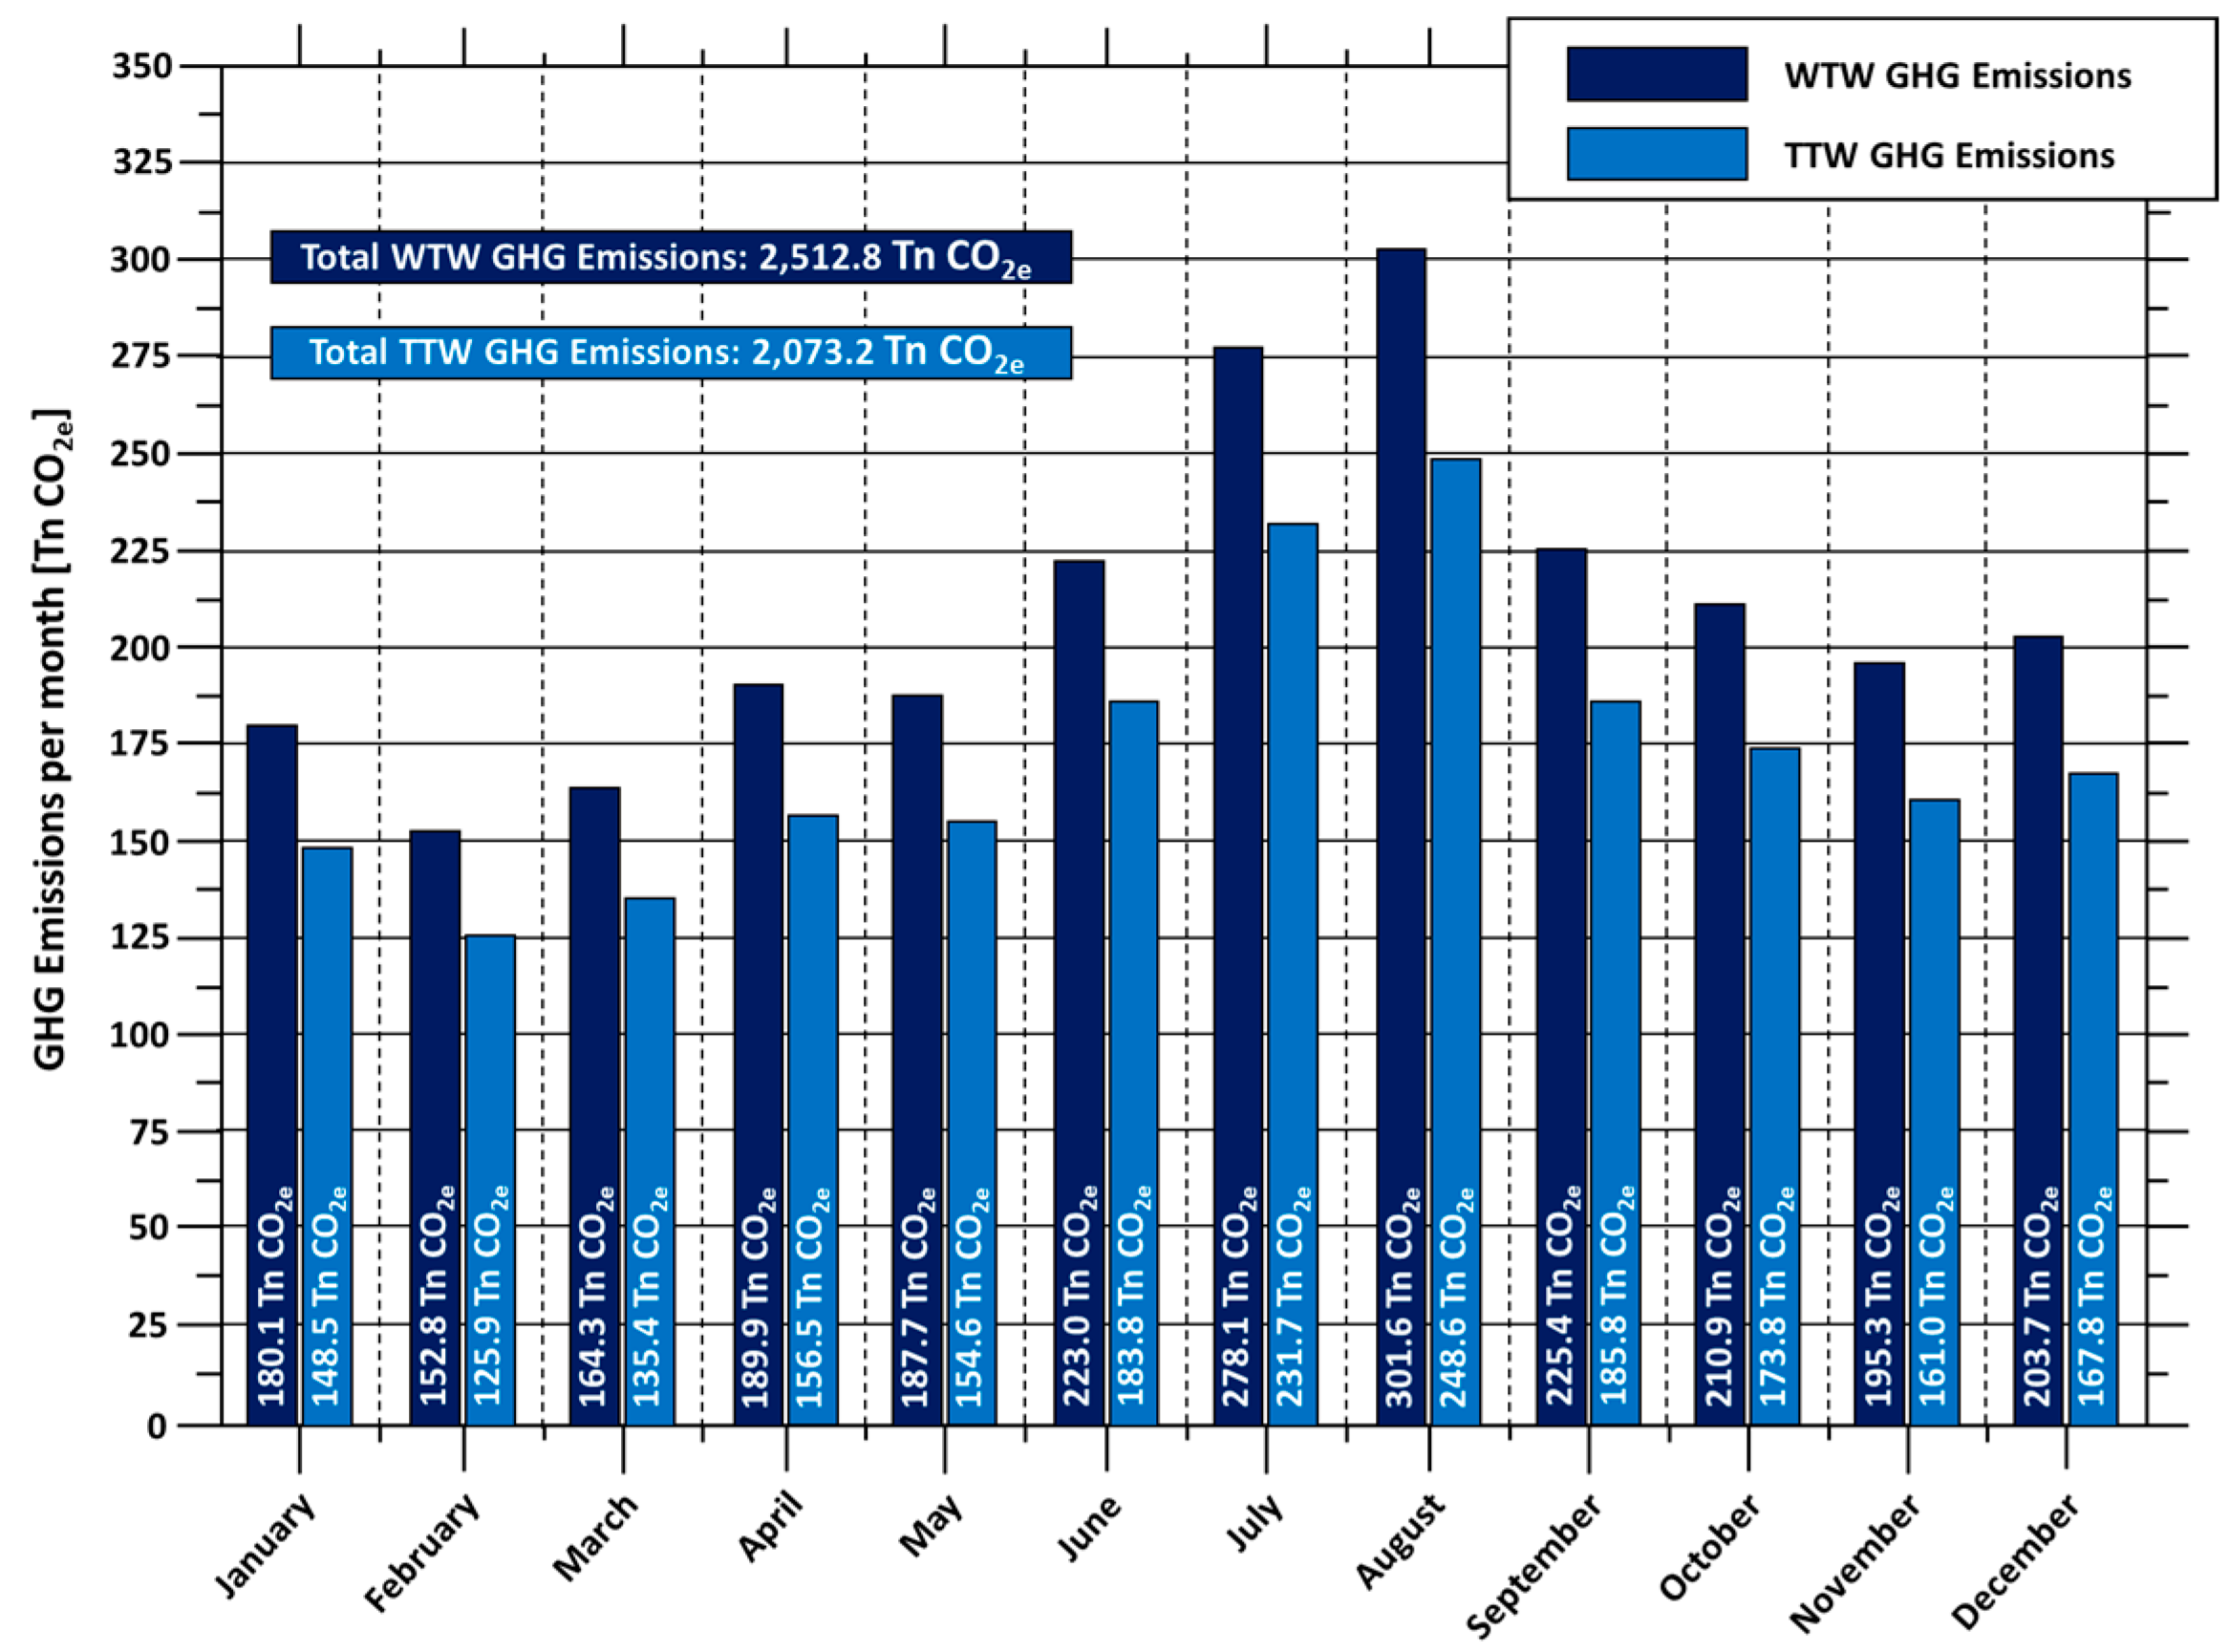
5.1. Total GHG Emissions and Energy Consumption

Figure 4 shows the total results of the WTW and TTW GHG emissions, which are emitted during the execution of the transport operation of the PTL company. As can be seen, during the transport operation, 2512.8 Tn CO2e are emitted for the stage of the well-to-wheels, while 2073.2 Tn CO2e is emitted for the stage of the tank-to-wheels. By taking into consideration the GHG emissions monthly, we can observe that August and July have the highest environmental impact when compared with the other months of the year under consideration because of the higher fuel consumption observed during these two summer months. The two basic reasons for this peak (July and August) in fuel consumption are the significant increase in mileage traveled from the truck fleet of the company, as well as the high use of air conditioning systems. More specifically, it is notable to mention that during July and August, 453,211 km (22.1% of the total kilometers) were completed, and 174,796.62 L (22.7% of the total Diesel consumption) of Diesel were consumed. On the other hand, we can observe that February and March are the most environmentally friendly months for the transport company. This makes sense since these two months have the lowest workload in terms of kilometers (12.6% of the total kilometers) and fuel consumption (12.7% of the total Diesel consumption).

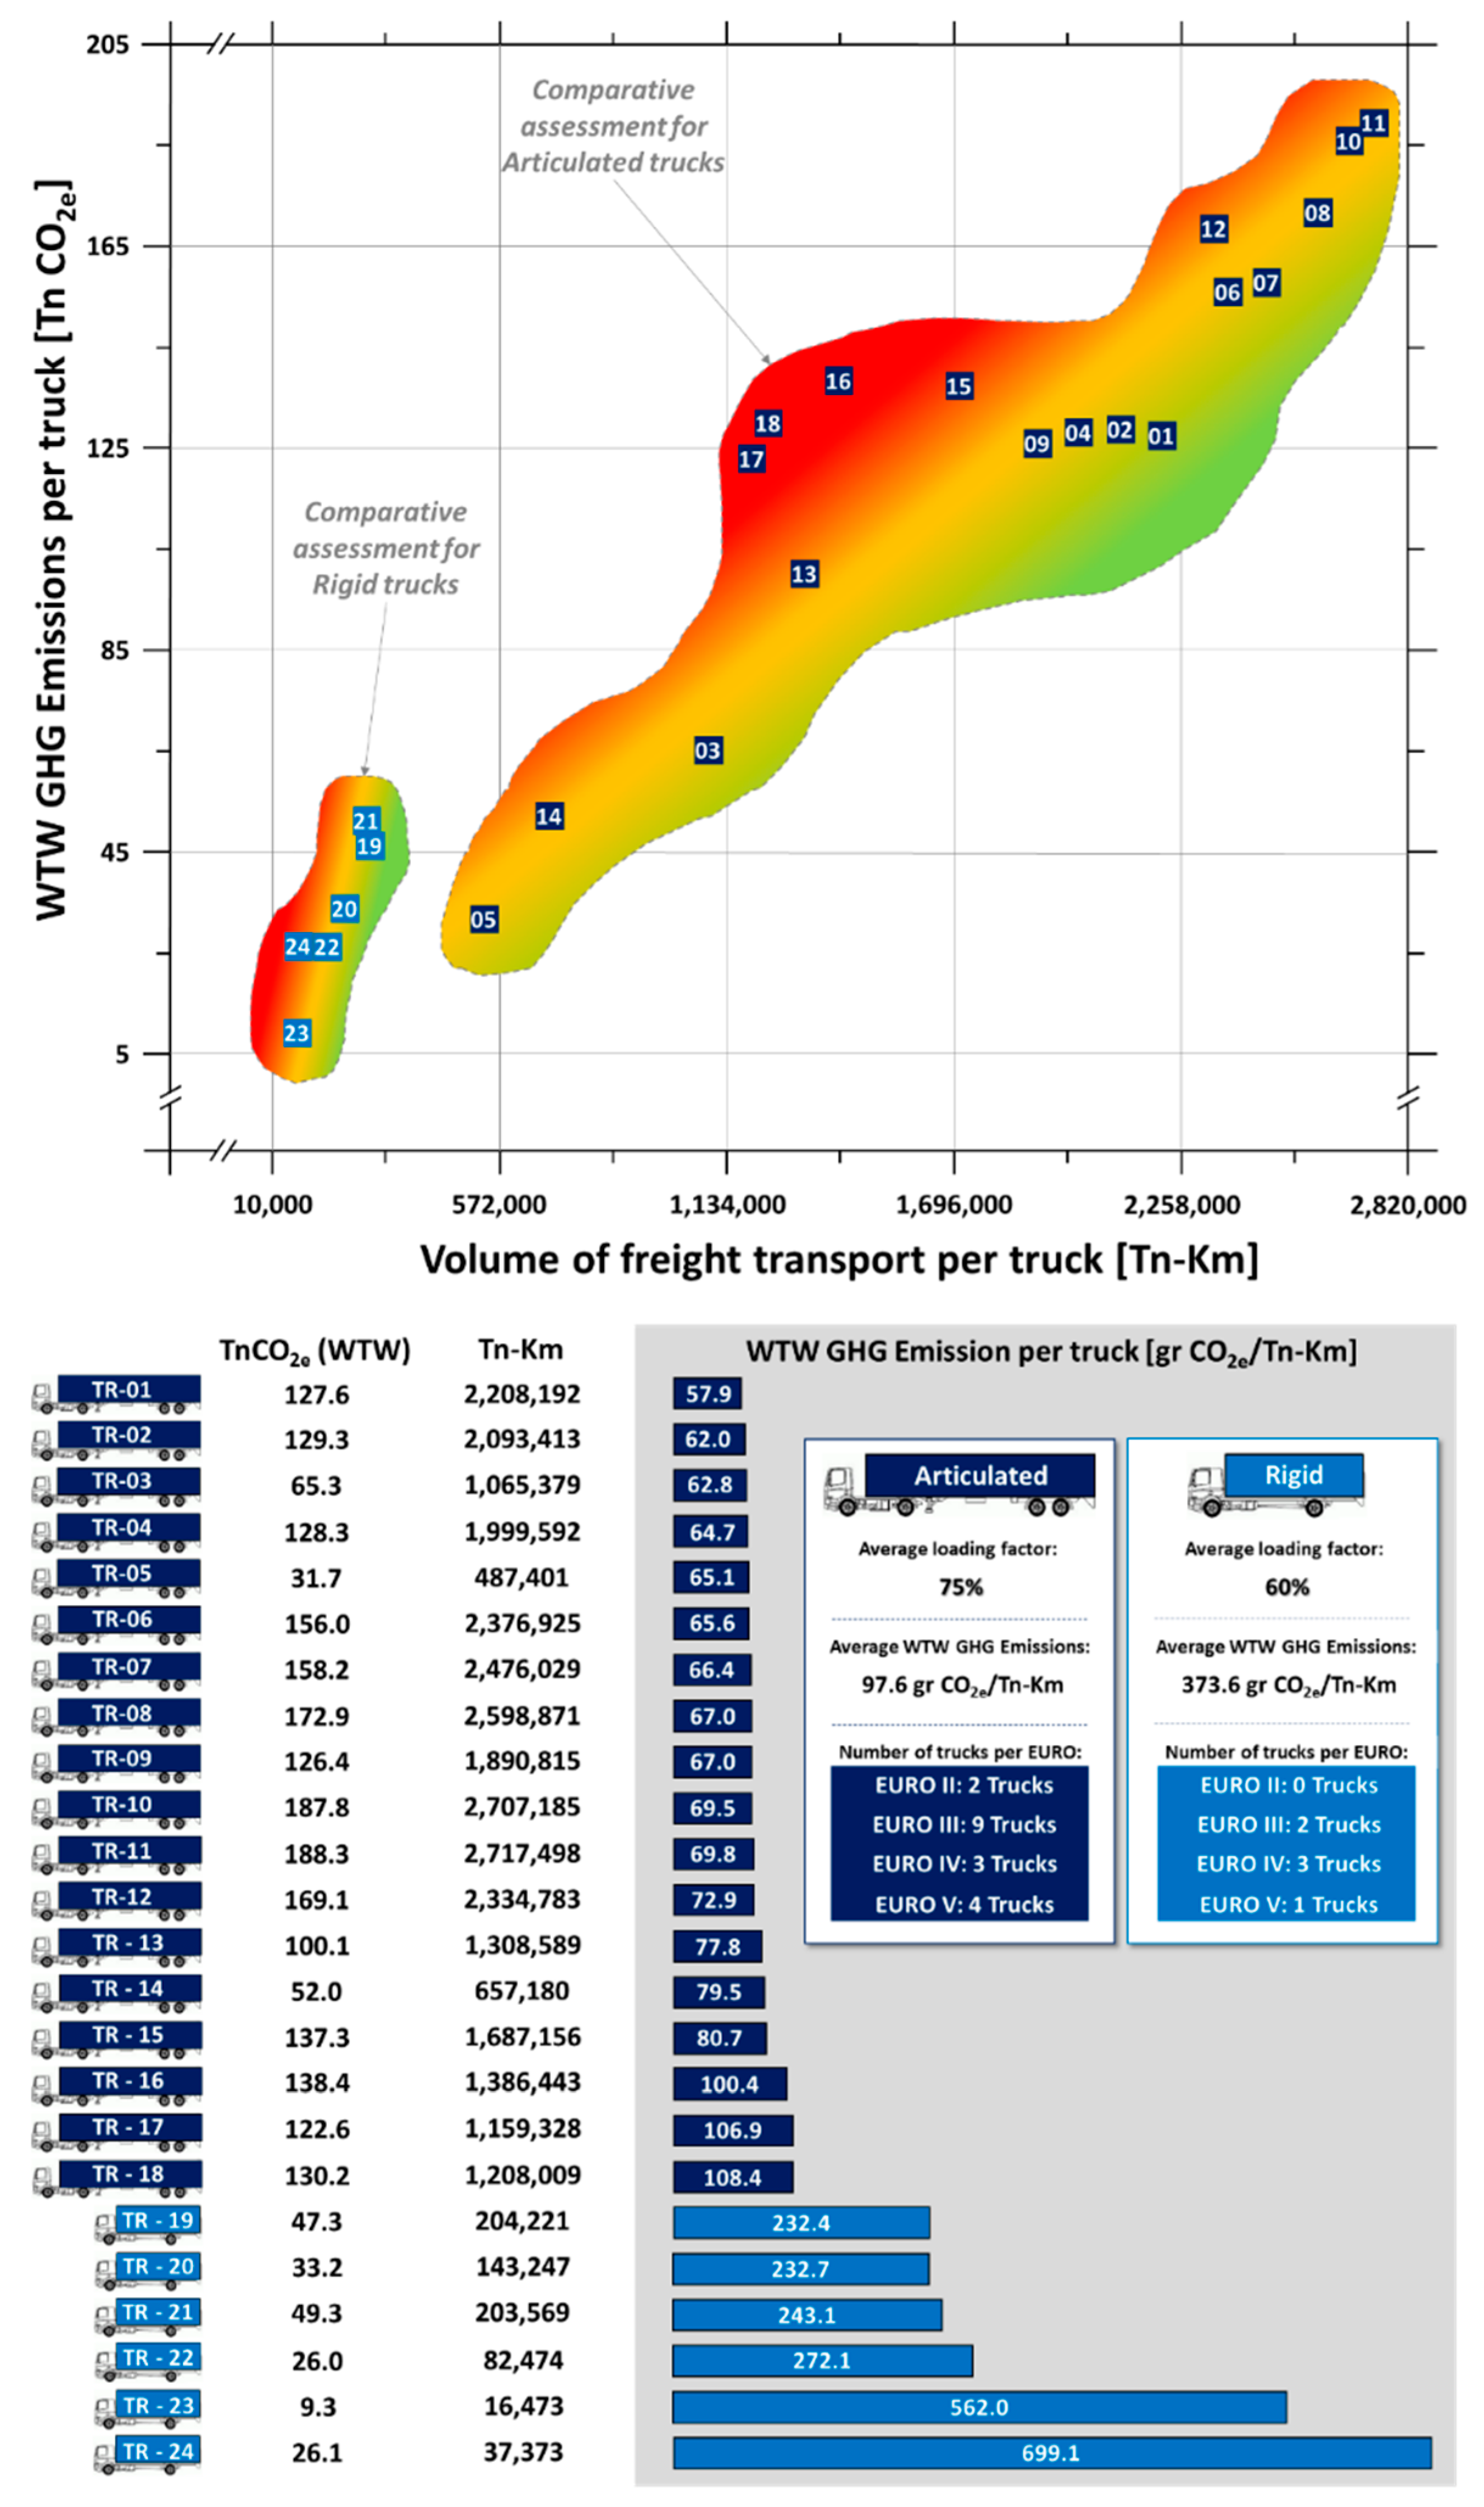
5.2. Allocated WTW GHG Emissions per Tn-Km

To realize which are the most efficient trucks in the fleet, we decided to examine the impact of each truck of the company in terms of WTW GHG emissions per Ton-kilometer (Tn-Km). This index is very important for the evaluation of the investigated fleet since, apart from the total GHG emission, this index takes into consideration both the load/quantity of freight (in Tonnes) as well as the distance travelled (in Kilometers). Figure 5 depicts the WTW GHG emission per Tn-Km for each truck of the company. As can be seen in the following figure, there are two different types of trucks: (i) Articulated and (ii) Rigid. Articulated trucks have a higher capacity (almost 24,000 kg per route) when compared with rigid trucks, whose capacity ranges from 3000 Kg per route to 7000 Kg per route. This significant difference in capacity is an important factor that affects the aforementioned index (WTW GHG emissions per Ton-kilometer) when compared trucks from these two different types of trucks. To this end, we have tried to separate these two categories in our analysis (with different colors) for comparability purposes in terms of their environmental impact.
Considering the category of articulated trucks (color blue dark), it seems that the average loading factor for this category is 75%, while the average WTW GHG emissions for the trucks of this category are 97.6 gr CO2e/Tn-Km. By focusing on the results of Figure 5, we can observe that the most environmentally friendly truck is the truck with code “TR-01”, while the truck with code “TR-18” is the least eco-friendly. To this point, it is notable to mention that although the total CO2e emissions of “TR-01” (127.6 TnCO2e) are very close to the total CO2e emissions of “TR-18” (130.2 TnCO2e), we can observe that there is a significant difference in terms of WTH GHG emissions per Tn-Km. This difference is substantiated when we focus on the Tn-Km of each truck. Indeed, considering the Tn-Km for both trucks, we can observe that the truck with code “TR-01” has accomplished 2,208,192 Tn-Km, while the truck with code “TR-18” has accomplished only 1,208,009 Tn-Km (difference: 46% less Tn-Km).
By considering the category of Rigid trucks (blue color light), we can see that the average loading factor for this category is 60%, while the average WTW GHG emissions for the trucks of this category are 373.6 gr CO2e/Tn-Km. To this point, it is worth mentioning that this truck category has a lower loading factor when compared to the corresponding loading factor of articulated trucks since rigid trucks usually execute the last mile stage of transportation, hence it is quite difficult for the distribution planner to achieve very high loading factors per truck in this stage. On the other hand, the articulated trucks usually served line-haul routes, hence achieving a higher loading factor compared to rigid trucks. With a focus on the results of Figure 5 (for the Rigid trucks), it seems that the most sustainable rigid truck is the truck with code “TR-19”, while the truck with code “TR-18” exhibits the worst performance in terms of sustainability.

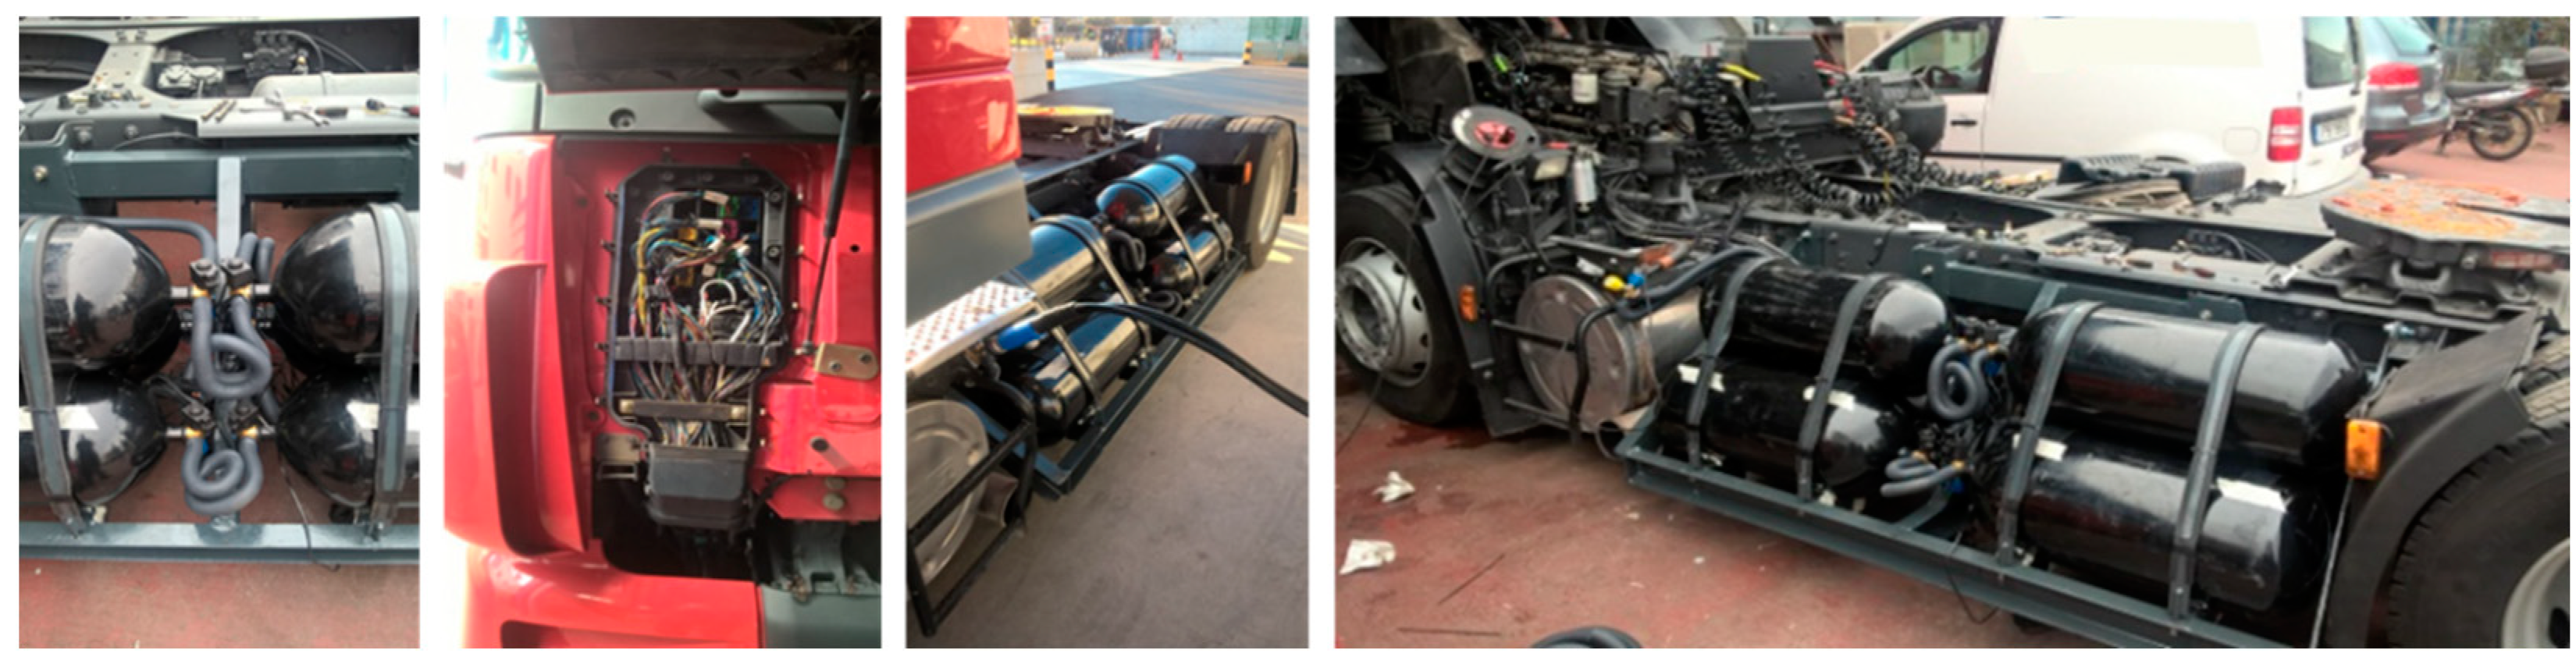
6. Using CNG as an Alternative Fuel for Reducing Emissions

Based on the results mentioned above, PTL decided to implement actions that could reduce the carbon footprint generated from its fleet of trucks. One action of the corporate sustainability plan that PTL implemented was to retrofit one truck of its fleet so as to use a dual-fuel mode system which is designed for conversion of diesel engines on commercial transport vehicles into engines capable of running on a blend of diesel and Compressed Natural Gas (CNG) [23]. Figure 6 depicts the equipment that was used for the retrofitting of the selected tractor. Indicative parts of the retrofitting included electro-valves, gas injectors, exhaust temperature sensors, and gas filters.
According to Speirs et al. [24], vehicles that use natural gas as fuel emit up to 95% fewer particulate matters (PM) and up to 70% fewer nitrogen oxides (NOx) than diesel and petrol counterparts, making vehicles running on natural gas much more competitive even in the framework of the strictest Euro VI fuel standard. Various studies show a clear reduction of greenhouse gas (GHG) emissions when using gas for mobility. Benefits amount to 15–30% compared to diesel and petrol engines, taking a “well-to-wheel” (WTW) approach. This reduction could be as high as 95% or even close to zero and negative emission balance if pure biomethane is used. Thus, blending natural gas with just a small amount of biomethane will increase environmental performance significantly. Furthermore, CNG engines decrease noise pollution by having a smoother and more silent performance than gasoline engines and especially diesel ones.
In order to assess the merit of using the dual-fuel mode system, PTL has proceeded to certain calculations that deal with carbon footprint emissions and fuel cost by comparing the performance of the same truck prior to and after the retrofitting process. The data that were taken into consideration are presented in Table 3. The calculations were made by taking into consideration data for a three-month period.
Figure 7a depicts the results obtained from the comparison made in terms of fuel costs. As can be seen, the consumption for the truck to travel 100 Km is €36.5 when diesel is used. However, when dual-fuel (diesel-CNG) is used the cost is €27.4, accomplishing a reduction of 24.9%. Figure 7b depicts the results obtained concerning the calculation of carbon footprint emissions prior to and after the retrofitting process of the truck. As it can be seen, when the truck was using diesel as fuel, the CO2e emissions for 100Km were equal to 88.6 Kg, whereas when dual fuel was used (diesel-CNG), the CO2e emissions for 100 Km were reduced to 69.2 Kg (thus a decrease of 21.9% was achieved).
From the results above, it was concluded that the retrofitting was worth both in terms of fuel cost reduction as well as in terms of carbon footprint emissions. It is also worth mentioning that the Return-on-Investment (ROI) concerning the cost of the retrofitting was made in 8 months.
Nevertheless, it is worth mentioning that the aforementioned economic and environmental benefits apply only in cases of retrofitting trucks that execute line-haul routes having a constant cruising speed. In cases of city logistics transportation where the trucks travel within urban areas with congested roads and low speed, the benefits are quite limited for the retrofitted vehicles. Indeed, the results during the pilot testing revealed that the retrofitted trucks, at cruising speed, the replacement of diesel fuel by CNG can reach up to 80–90% (depending on the engine operating conditions), while in a city logistics environment, the corresponding percentage cannot exceed 15–20%.
Furthermore, another factor that limits the use of retrofitted trucks in a city logistics environment is that the tanks which are installed on trucks are heavy (from 500 kg to 1200 kg) depending on the truck type and size, and as a result, the load that can be transported by trucks is significantly reduced. This additional weight of tanks leads to a rapid reduction of payload for the retrofitted trucks which execute city logistics routes since the capacity of these trucks usually does not exceed 3.5 tons. On the other hand, this additional weight of tanks affects less the payload of retrofitted trucks which execute line-haul routes since the corresponding loading capacity of these trucks can reach up to 24 tons.

7. Conclusions

The main objective of this paper was initially to assess the impact of Green House Gas (GHG) emissions stemming from road freight transportation. Subsequently, we adopted the EN 16258 standard in order to calculate the carbon footprint of a truck fleet of a freight transport operator in Greece. Based on the obtained results, we evaluated the performance of the company’s fleet by adopting relevant sustainability indicators. We also assessed the use of CNG as an alternative fuel and its impact on CO2e emissions and operational costs.
From the results obtained, we can conclude that the CO2e emissions are affected by the engine technology of a truck, the driver’s behavior, the loading factor of the truck as well as the type of road network. It can also be concluded that alternative fuels such as natural gas, even if used in combination with fossil fuels, can contribute to the reduction of GHG emissions and, subsequently, to the operational costs of a truck.
A number of countries have already strengthened their standards for CO2e emissions and fuel economy. To maintain momentum and accelerate road freight transport decarbonization in line with the Net Zero Emissions global plan, countries must continue to implement and tighten such regulatory measures. Since road freight transportation has a significant negative impact on the environment and society, it is crucial for countries to adopt additional measures towards further reduction and offsetting of CO2e emissions. Such measures and policies may include a fleet renewal mandate, governmental support to produce low-emission/zero-emission trucks, and state support of pilots for the electrification of heavy-duty transport. Furthermore, actions such as Climate Premium for environmental vehicles (i.e., state support for green vehicle purchase) as well as Zero-Emission standards are aiming toward the correct direction for sustainable freight transportation.

Author Contributions

Formal analysis, A.G., V.Z. and K.P.; Methodology, A.G., V.Z. and M.M.; Resources, K.P.; Supervision, M.M.; Writing—original draft, A.G. and V.Z.; Writing—review & editing, M.M. and K.P. All authors have read and agreed to the published version of the manuscript.

Funding

This research received no external funding.

Institutional Review Board Statement

Not applicable.

Informed Consent Statement

Not applicable.

Data Availability Statement

Not applicable.

Conflicts of Interest

The authors declare no conflict of interest.

References

  1. Kellner, F.; Schneiderbauer, M. Further Insights into the Allocation of Greenhouse Gas Emissions to Shipments in Road Freight Transportation: The Pollution Routing Game. Eur. J. Oper. Res. 2019, 278, 296–313. [Google Scholar] [CrossRef]
  2. McKinnon, A. Environmental Sustainability: A New Priority for Logistics Managers. In Green Logistics: Improving the Environmental Sustainability of Logistics; McKinnon, A., Browne, M., Whiteing, A., Piecyk, M., Eds.; Kogan Page: London, UK; Philadelphia, PA, USA; New Delhi, India, 2015; pp. 3–26. [Google Scholar]
  3. EEA Greenhouse Gas Emissions from Transport in Europe. Available online: https://www.eea.europa.eu/ims/greenhouse-gas-emissions-from-transport (accessed on 30 June 2022).
  4. IEA. Tracking Transport 2021; IEA: Paris, France, 2021.
  5. IEA. Global EV Outlook 2021; IEA: Paris, France, 2021.
  6. European Commission Reducing CO2 Emissions from Heavy-Duty Vehicles. Available online: https://ec.europa.eu/clima/eu-action/transport-emissions/road-transport-reducing-co2-emissions-vehicles/reducing-co2-emissions-heavy-duty-vehicles_en (accessed on 21 June 2022).
  7. No 595/2009; CO2 Emission Performance Standards for New Heavy-Duty Vehicles and Amending Regulations (EC). European Parliament and of the Council: Brussels, Belgium, 2019. Available online: https://eur-lex.europa.eu/eli/reg/2019/1242/oj (accessed on 28 June 2022).
  8. Linton, C.; Grant-Muller, S.; Gale, W.F. Approaches and Techniques for Modelling CO2 Emissions from Road Transport. Transp. Rev. 2015, 35, 533–553. [Google Scholar] [CrossRef]
  9. Pandey, D.; Agrawal, M.; Pandey, J.S. Carbon Footprint: Current Methods of Estimation. Environ. Monit. Assess. 2011, 178, 135–160. [Google Scholar] [CrossRef] [PubMed]
  10. Wild, P. Recommendations for a Future Global CO2-Calculation Standard for Transport and Logistics. Transp. Res. Part D Transp. Environ. 2021, 100, 103024. [Google Scholar] [CrossRef]
  11. McKinnon, A.C.; Piecyk, M.I. Measurement of CO2 Emissions from Road Freight Transport: A Review of UK Experience. Energy Policy 2009, 37, 3733–3742. [Google Scholar] [CrossRef]
  12. McKinnon, A.C.; Piecyk, M.I. Measuring and Managing CO2 Emissions in European Chemical Transport; Heriot-Watt University: Edinburgh, UK, 2010. [Google Scholar]
  13. Duan, H.; Hu, M.; Zuo, J.; Zhu, J.; Mao, R.; Huang, Q. Assessing the Carbon Footprint of the Transport Sector in Mega Cities via Streamlined Life Cycle Assessment: A Case Study of Shenzhen, South China. Int. J. Life Cycle Assess. 2017, 22, 683–693. [Google Scholar] [CrossRef]
  14. Chang, C.-C.; Huang, P.-C. Carbon Footprint of Different Fuels Used in Public Transportation in Taiwan: A Life Cycle Assessment. Environ. Dev. Sustain. 2022, 24, 5811–5825. [Google Scholar] [CrossRef]
  15. Gustafsson, M.; Svensson, N.; Eklund, M.; Öberg, J.D.; Vehabovic, A. Well-to-Wheel Greenhouse Gas Emissions of Heavy-Duty Transports: Influence of Electricity Carbon Intensity. Transp. Res. Part D Transp. Environ. 2021, 93, 102757. [Google Scholar] [CrossRef]
  16. Santos, G. Road Transport and CO2 Emissions: What Are the Challenges? Transp. Policy 2017, 59, 71–74. [Google Scholar] [CrossRef]
  17. Ahmed, Z.; Ali, S.; Saud, S.; Shahzad, S.J.H. Transport CO2 Emissions, Drivers, and Mitigation: An Empirical Investigation in India. Air Qual. Atmos. Health 2020, 13, 1367–1374. [Google Scholar] [CrossRef]
  18. Yoon, Y.; Yang, M.; Kim, J. An Analysis of CO2 Emissions from International Transport and the Driving Forces of Emissions Change. Sustainability 2018, 10, 1677. [Google Scholar] [CrossRef]
  19. Greene, S.; Façanha, C. Carbon Offsets for Freight Transport Decarbonization. Nat. Sustain. 2019, 2, 994–996. [Google Scholar] [CrossRef]
  20. Liu, Y.; Feng, C. Decouple Transport CO2 Emissions from China’s Economic Expansion: A Temporal-Spatial Analysis. Transp. Res. Part D Transp. Environ. 2020, 79, 102225. [Google Scholar] [CrossRef]
  21. EN 16258; Methodology for Calculation and Declaration of Energy Consumption and GHG Emissions of Transport Services (Freight and Passengers). European Committee for Standardization: Brussels, Belgium, 2012.
  22. Kellner, F. Allocating Greenhouse Gas Emissions to Shipments in Road Freight Transportation: Suggestions for a Global Carbon Accounting Standard. Energy Policy 2016, 98, 565–575. [Google Scholar] [CrossRef]
  23. Ashok, B.; Nanthagopal, K. Eco Friendly Biofuels for CI Engine Applications. In Advances in Eco-Fuels for a Sustainable Environment; Woodhead Publishing: Cambridge, UK, 2019. [Google Scholar]
  24. Speirs, J.; Balcombe, P.; Blomerus, P.; Stettler, M.; Brandon, N.; Hawkes, A. Can Natural Gas Reduce Emissions from Transport? Heavy Goods Vehicles and Shipping; Sustainable Gas Institute, Imperial College: London, UK, 2019. [Google Scholar]
Figure 1. Overview of processes/stages included during the implementation of EN 16258 Standard, Adapted from [21].
Sustainability 14 10724 g001
Figure 2. Implementation steps for the calculation of energy consumption and GHG emissions, Adapted from [21].
Sustainability 14 10724 g002
Figure 3. Implementation steps for the calculation of energy consumption and GHG emissions.
Sustainability 14 10724 g003
Figure 4. WTW and TTW GHG Emissions per month.
Sustainability 14 10724 g004
Figure 5. WTH GHG Emissions per Tn-Km for the truck fleet of PTL company.
Sustainability 14 10724 g005
Figure 6. Indicatives screenshots from the retrofitting equipment used for the dual-fuel system.
Sustainability 14 10724 g006
Figure 7. (a) Comparison of fuel cost (Single vs. dual fuel) for 100 Km; (b) Comparison of WTW GHG Emissions (Single vs. dual fuel) for 100 Km.
Sustainability 14 10724 g007
Table 1. Required data for the calculation of energy consumption and GHG emissions.
Data Collection for Each TruckData Collection for Each Leg
  • Truck ID
  • Truck type (Rigid-Articulated)
  • Fuel type
  • Gross weight of truck (in Kg)
  • Payload of truck (in Kg)
  • Euro Standard (I, II, III, IV, V, VI)
  • Fuel consumption (in Liters)
  • Distance of leg (in Km)
  • Load of leg (in Tons)
Table 2. Nomenclature.
SymbolDescription
AGtiAllocated tank-to-wheels (TTW) GHG emissions for the route i, i = 1, 2, 3, …, n
(in KgCO2e/Tn-km)
AGWiAllocated well-to-wheels (WTW) GHG emissions for the route i, i = 1, 2, 3, …, n
(in KgCO2e/Tn-km)
Di,j Travel distance of the leg j of route i, i = 1, 2, 3, …, n and j = 1, 2, 3, …, k
(in km)
DRi Total travel distance of route i, i = 1, 2, 3, …, n
(in km)
ECi,j Energy consumption for the leg j of route i, i = 1, 2, 3, …, n and j = 1, 2, 3, …, k
(in liters of Diesel)
EFtEnergy factor for the tank-to-wheels stage
(35.9 MJ/L of Diesel)
EfwEnergy factor for the well-to-wheels stage
(42.7 MJ/L of Diesel)
EtiTank-to-wheels (TTW) energy consumption for the route i, i = 1, 2, 3, …, n
(in MJ)
EWiWell-to-wheels (WTW) energy consumption for the route i, i = 1, 2, 3, …, n
(in MJ)
GHGFtGHG emission factor for the tank-to-wheels stage
(2.67 KgCO2e/L of Diesel)
GHGFwGHG emission factor for the well-to-wheels stage
(3.24 KgCO2e/L of Diesel)
GtiTank-to-wheels (TTW) GHG emissions for the route i, i = 1, 2, 3, …, n
(in KgCO2e)
GWiWell-to-wheels (WTW) GHG emissions for the route i, i = 1, 2, 3, …, n
(in KgCO2e)
LFi,j Loading factor for the leg j of route i, i = 1, 2, 3, …, n and j = 1, 2, 3, …, k
(in %)
PLPayload of the truck which executes the route i, i = 1, 2, 3, …, n
TAGtAllocated tank-to-wheels (TTW) GHG emissions for the total transport operation,
(in KgCO2e/Tn-km)
TAGWAllocated well-to-wheels (WTW) GHG emissions for the total transport operation,
(in KgCO2e/Tn-km)
TDTotal distance of all routes which executed from the truck fleet of the company
(in km)
Table 3. Data taken into consideration for the assessment of the retrofitting of the truck.
Assessment of Retrofitting (Information and Primary Data)
Type of truck:Articulated-Heavy duty (40 t gross weight)
Type of road network:90% highway–10% rural
Average speed of truck:65 Km/h
Truck average loading factor:72%
Period of data collection:3 months
Fuel price (during the assessment period):1 €/Lt (diesel) and 0.76 €/Kg (CNG)
Distance traveled (for the assessment):12.525 Km
Publisher’s Note: MDPI stays neutral with regard to jurisdictional claims in published maps and institutional affiliations.

