Abstract
Smart manufacturing is an important development mode in the transition of China’s industry from weak to strong, and the realization of comprehensive smart manufacturing demands the coordinated efforts of all regions in China. Based on the panel data of 30 provincial administrative regions in China from 2014 to 2019, this paper constructs an index system for the development environment, infrastructure facilities, and industrial development. This paper uses methods of entropy weight TOPSIS and the dynamic comprehensive evaluation based on the time ordered weighted averaging (TOWA) operator to evaluate the smart manufacturing capability in China and analyze its characteristics of spatial difference for exploring the appropriate paths for development. The result shows that there are only two provinces, Guangdong and Jiangsu, with the values of dynamic comprehensive evaluation greater than 0.5, seven provinces with values between 0.25 and 0.5, and 21 provinces with values less than 0.25. This reflects the fact that the gradient difference in provincial smart manufacturing capability in China is obvious and most provinces are not good. The decline in the Theil index from 0.17 to 0.15 indicates that the difference in capability between provinces is narrowing, which is a good phenomenon. The increase in the Global Moran’s index from 0.1156 to 0.1478 shows that the capability in each province has a significant positive spatial correlation, and the correlation is strengthening. Moreover, during the six years, the spatial aggregation models of most provinces have not changed. The smart manufacturing capability of the Yangtze River Delta constitutes a stable high-high aggregation region. Guangdong and Chongqing have been in high-low aggregation regions for a long time, while most of the low-low aggregation regions are in the west.
1. Introduction
Since the 2008 financial crisis, developed countries have realized the threat of de-industrialization and begun to carry out a series of measures around the manufacturing industry, introducing the concepts of Internet of Things (IOT) and servitization into the manufacturing industry [1]. For example, the United States regarded revitalizing advanced manufacturing as a strategy to enhance national development, developed cutting-edge manufacturing technology, and cultivated advanced smart manufacturing systems [2,3]. Germany focused on supporting key manufacturing areas to maintain global competitiveness [4]. Britain saw high-value manufacturing as the direction of future development [5]. France emphasized the development of leading industrial areas [6]. Japan emphasized creating new value through industrial interconnection and realizing a “human-centered” industrial society [7]. China aimed to accelerate the integration of manufacturing and new generation information technology to achieve a strong manufacturing nation [8]. The current era present the superposition of the industrial revolution and the information revolution. The wave of smart manufacturing is sweeping the global manufacturing industry, and the effective integration of the real economy and the digital economy has become the current development theme. In May 2015, the State Council of China issued the “Made in China 2025” to comprehensively promote China’s manufacturing industry from weak to strong, focusing on promoting smart manufacturing [9].
Affected by COVID-19, the supply chain of the global manufacturing industry has been impacted to varying degrees and it is likely to become regionalized and digitalized [10]. China’s manufacturing industry should pay more attention to digital transformation and give full play to the growth potential of regional smart manufacturing. However, China has a vast territory and the development of the manufacturing industry in each province is unbalanced, showing a development trend of “strong in the east and weak in the west”. In terms of types, technology-intensive manufacturing industries are mostly distributed in the southeast coastal areas, resource-intensive manufacturing industries are mostly distributed in the central and western regions, and labor-intensive manufacturing industries gradually transferred from east to west. From the perspective of industrial efficiency, in 2020, the total profits of industrial enterprises above the state-designated scale in Guangdong and Jiangsu are more than 700 billion yuan, while those in Qinghai and Tibet are less than 10 billion yuan. Such inefficiency has become a huge obstacle for China to restructure the manufacturing industry. Then, the question arises concerning how to promote the coordinated development of smart manufacturing in provinces. It is necessary to clarify the connotation of smart manufacturing, evaluate the smart manufacturing capability (SMC), and then analyze the spatial distribution differences of SMC in various provinces in China to explore the possible development path.
In terms of the connotation of smart manufacturing, it involves the integration of the new generation information technology [11] and the real economy as the goal, forming a variety of different competitive paradigms such as industrial internet and smart manufacturing. Among them, the smart manufacturing paradigm is the most inclusive [12], and its essence is the deep integration of all aspects of the value chain and advanced digital technology [13]. However, smart manufacturing is evolving with the times and there is no uniform definition. Wright et al. [14] first proposed the concept of intelligent manufacturing, which is defined as the application of robot vision recognition and control system, manufacturing software engineering and an integrated system to model the experience, knowledge, and skills of production, so that the robot can realize the process of small batch production independently without human intervention. The Smart Manufacturing Leadership Coalition (SMLC) [15] proposed that smart manufacturing can enhance applications, rapid manufacturing of new products, respond to product demand and optimize industrial production and supply chain networks in real time. Smart manufacturing was considered as the main manifestation of Industry 4.0, which was the optimization and transformation of traditional manufacturing methods, improving the design, production, and management of typical products through the introduction of Information and Communications Technology (ICT) and integration with existing manufacturing technologies [16,17,18,19]. Abubakr [20] thought the concept of smart manufacturing takes advantage of the recent technological leap in artificial intelligence (AI), cloud computing (CC), and IOT. There are various technologies that have been used to define smart manufacturing. Similarly, some characteristics are used to define it. According to statistics, the most frequent characteristics are sustainability [21,22,23,24,25], networkability [25,26], and agility [21,27].
In some countries where smart manufacturing research has been relatively mature, they focus on the impact of emerging technologies, such as AI and CC, on the reconfiguration of manufacturing systems and program implementation [28], targeting high-end and advanced manufacturing areas. However, Zhen [29] emphasized that the development of smart manufacturing in China should start from the transformation and upgrading of traditional industries to improve industrial competitiveness. Smart manufacturing could be implemented in not only high-end manufacturing but also in various industries [30]. Meng et al. [31] investigated the factors influencing the development of traditional manufacturing to smart manufacturing and concluded that factors, such as technological innovation, policy development, and integrated interconnection, have a positive impact on the development level of smart manufacturing. When quantifying the impact of smart manufacturing, it is inevitable to measure its development level.
The standpoints of quantitative research on the development level of smart manufacturing in China can be roughly divided into two categories. The first standpoint is based on the development level of the manufacturing industry. For example, Chen et al. [32] took industrial enterprises above the state-designated scale as the research object, selected manufacturing scale and benefit, innovation capability, product circulation capability, and information development capability, the constructed the comprehensive evaluation index system of SMC. The 21st Century Industry Research Institute [33] compiled a smart manufacturing index from the perspectives of provinces and cities, with indicators including the local policy environment, green manufacturing, industrial environment and development. Meanwhile, the provincial research added one more indicator, namely technical support. Based on China’s provincial panel data from 2008 to 2019, Zhou et al. [34] used an entropy method to research the manufacturing industry and found that the overall level of the intellectualized transformation and upgrading of the manufacturing industry has gradually improved, but the spatial distribution is uneven. The second standpoint is based on the structure of the smart manufacturing system itself. For example, Wu et al. [35] considered all aspects of enterprise operation and selected indicators from five aspects, namely product, production, service, equipment, and management intelligence, to measure the SMC in China’s provinces. Yi et al. [36] measured the SMC of enterprises by establishing a three-dimensional evaluation index system of SMC, which considered the cross performance of a smart factory in three subspaces, i.e., life cycle, system level, and smart function.
Based on the above analysis, measuring the development level of smart manufacturing in China can not only be based on the high-end manufacturing industry, but should start from the development of the whole manufacturing industry. In addition, there are still some deficiencies in the existing literature. Firstly, the development evaluation of smart manufacturing is mostly based on static evaluation methods and there is little literature that uses the dynamic evaluation method considering the time factor to compare the development horizontally and vertically. Second, the research on regions lacks consideration of spatial correlation. Therefore, this paper will consider the deficiencies of existing research, fully take advantage of the research results on smart manufacturing, use dynamic evaluation methods to measure the difference of SMC in China’s provinces, and analyze the factors that cause the difference.
The contributions of this paper are summarized as follows. Firstly, the paper analyses the SMC in China by using entropy weight TOPSIS (technique for order preference by similarity to an ideal solution) and dynamic comprehensive evaluation method based on TOWA operator and spatial correlation analysis methods, which enriches the research methods in the field of smart manufacturing. Secondly, the paper focuses on the chronological evolution and spatial correlation of China’s SMC to provide policy recommendations for narrowing the gap in the provinces and promoting the coordinated development of smart manufacturing, which provides references for other developing countries.
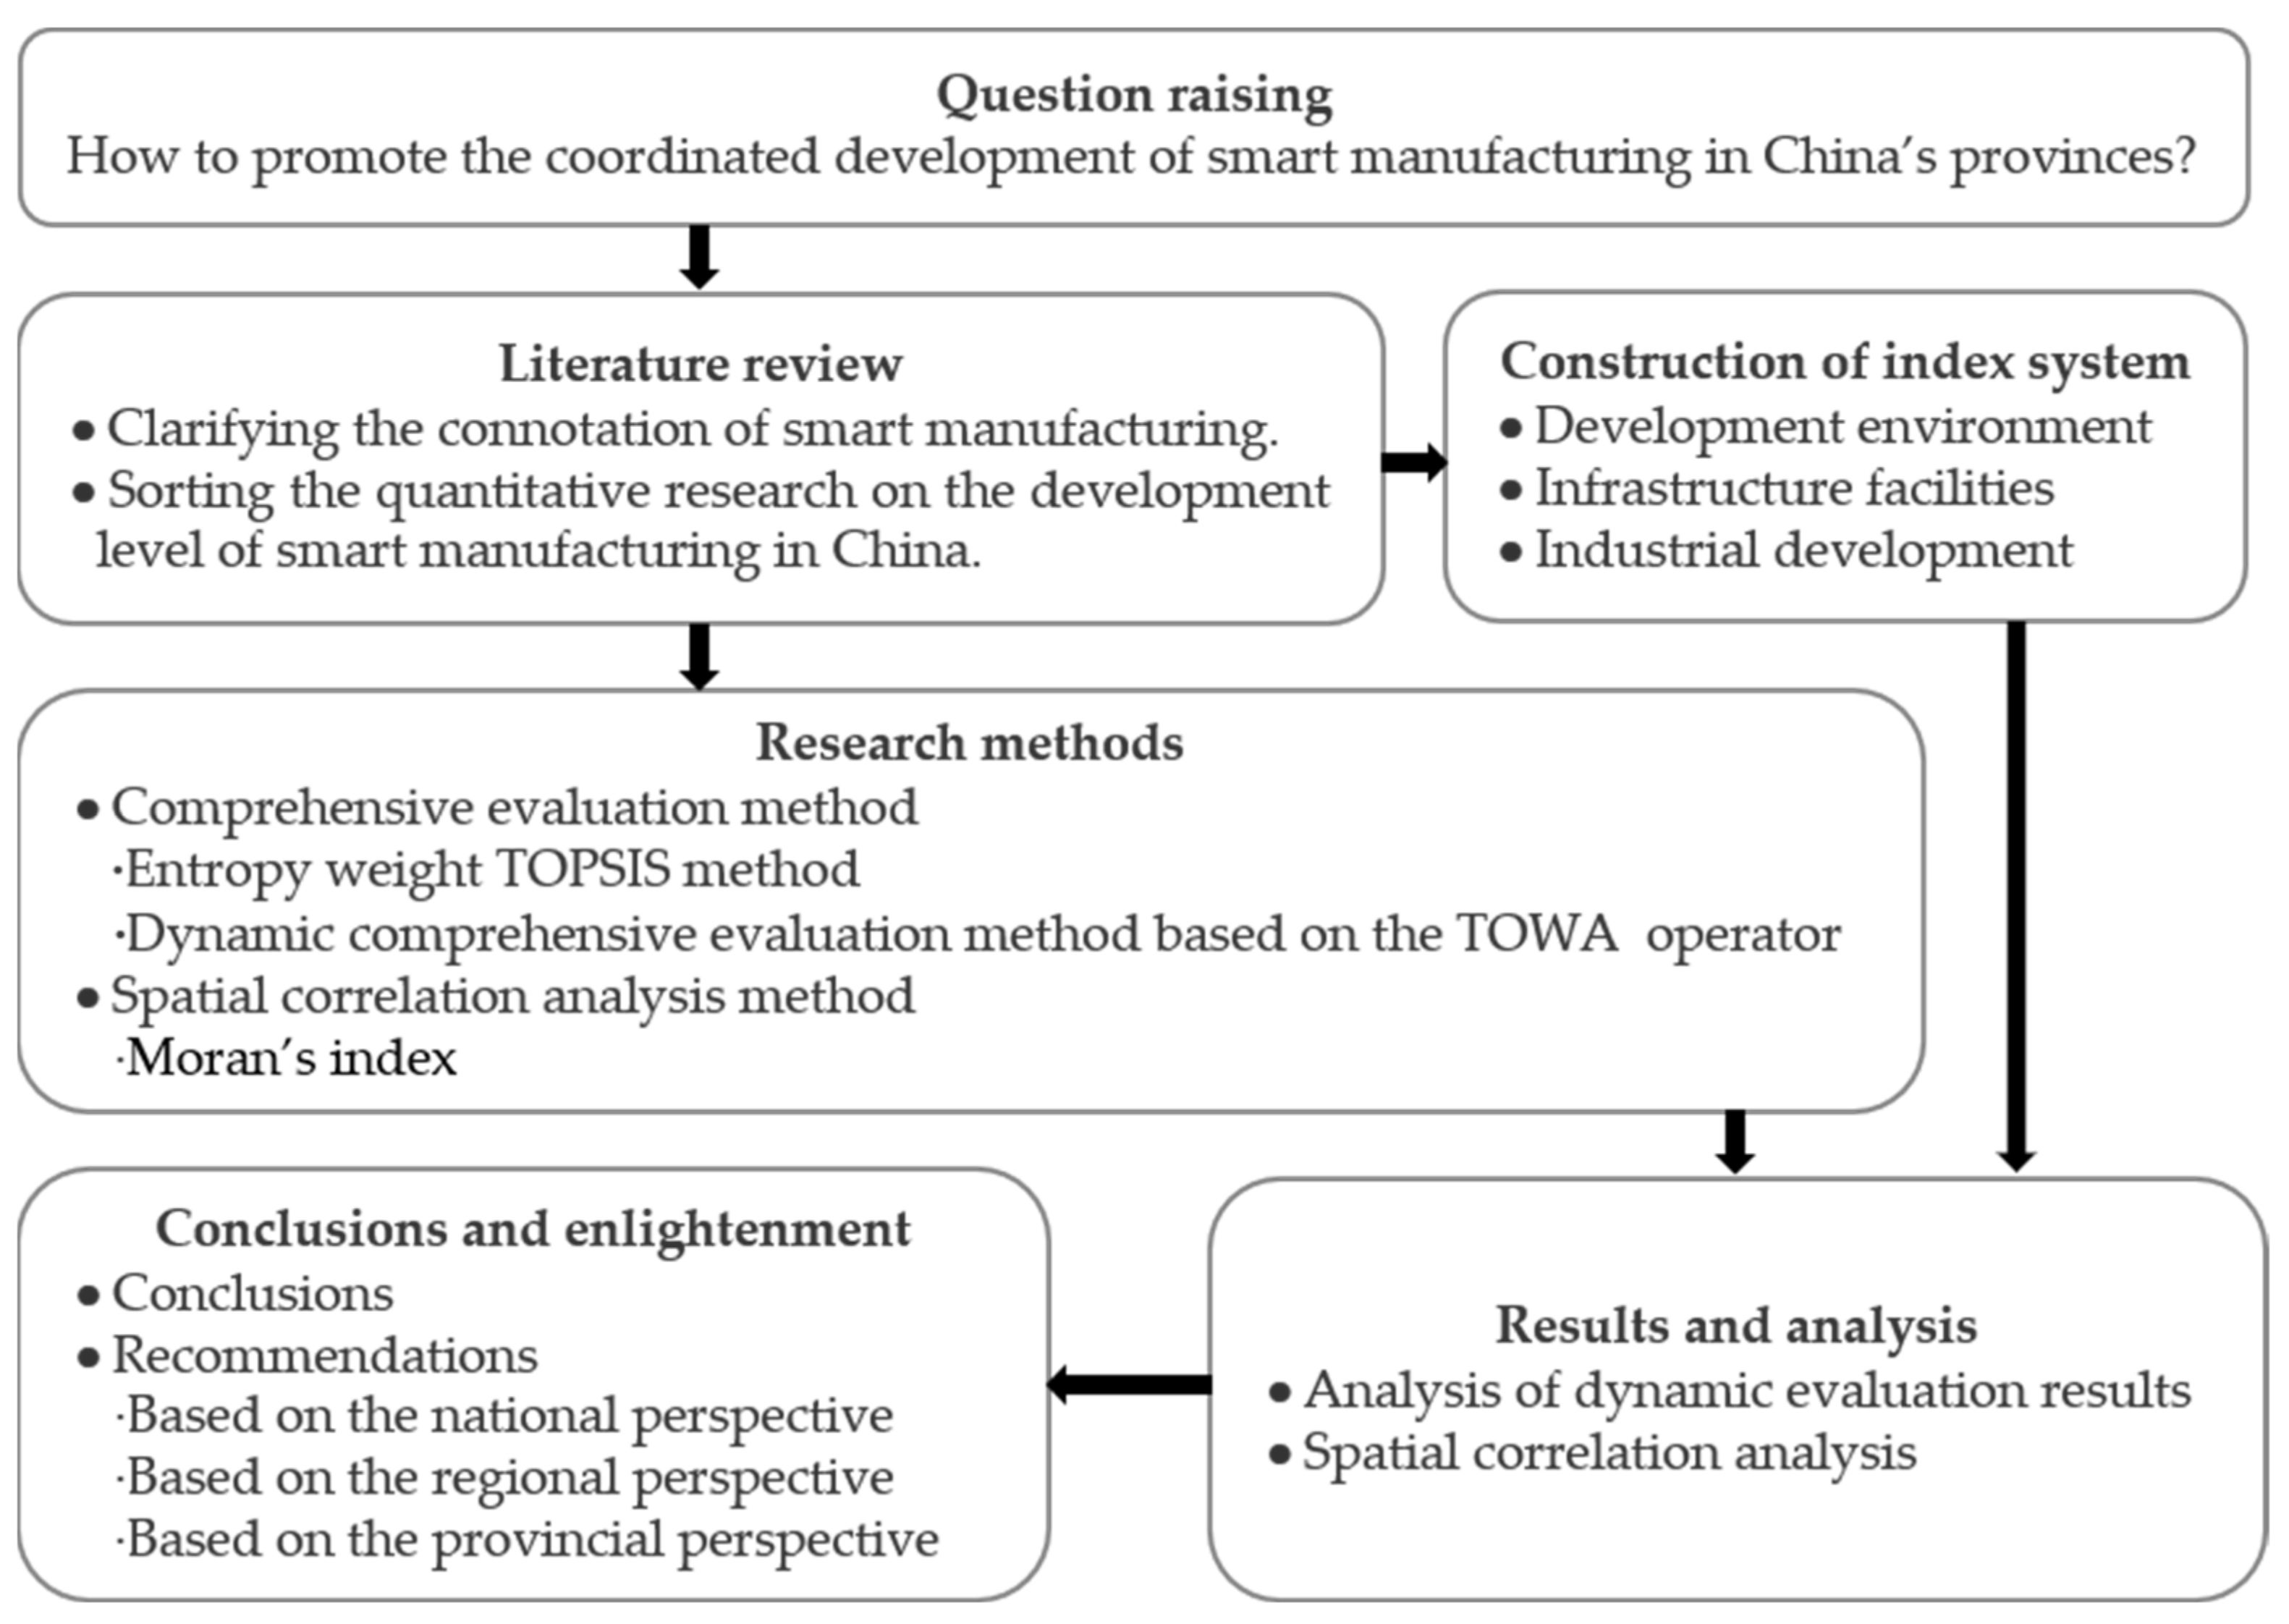
The remainder of the paper is structured as follows. Section 2 analyzes the index system establishment and data sources. Section 3 provides research methods. Section 4 presents the empirical results and analysis. Section 5 concludes the research and gives policy recommendations. The research framework of this paper is shown in Figure 1.
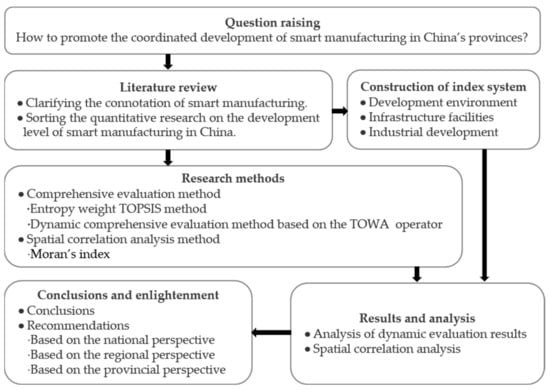
Figure 1.
Research framework diagram.
2. Construction of Index System, Data Sources and Processing
2.1. Construction of Index System
According to the above connotation of smart manufacturing, it has the characteristics of relying on the existing resources of the manufacturing industry, supported by network interconnection and reducing energy consumption in production. Based on the principles of scientificity, comprehensiveness, and hierarchy of index selection, this paper fully considers the characteristics of smart manufacturing, refers to the relevant evaluation index system [32,33,37,38], and considers the availability of data. This paper selects a total of 21 three-level indicators to construct the evaluation index system of provincial SMC in China, which is based on eight secondary indicators such as government support, circulation capability of product, and innovation capability from the three dimensions, i.e., development environment, infrastructure facilities, and industrial development. The relationship between indicators is listed in Table 1. On the nature of indicators, positive indicators are expressed as “P” and negative indicators as “N”.

Table 1.
Index system of provincial SMC.
2.1.1. Interpretation of the Indicator of Development Environment
The development environment includes government support and informatization level. As an emerging industry, the guidance and support of the government play an important role in the development of smart manufacturing [31]. At the same time, smart manufacturing relies on a new generation of information technology and the influence of the existing local information foundation cannot be ignored. The proportion of the internet integration demonstration projects, the proportion of pilot enterprises in the implementation of the two-in-one integration management system, and the proportion of local financial investment in science and technology are selected to reflect the support of central and local governments for smart manufacturing. The total amount of the telecommunication service and fixed assets investment in the information service industry are selected to measure the informatization level of provinces.
2.1.2. Interpretation of the Indicator of Infrastructure Facilities
The infrastructure facilities include the circulation capability of product and the digital foundation. Smart manufacturing can be considered as the integration of the manufacturing and information technology industries. To ensure the infrastructure conditions for the development of smart manufacturing, it is necessary to consider industrial attributes and information attributes at the same time. On the one hand, smart manufacturing needs a strong supply chain as a guarantee to ensure the flow of raw materials and products. On the other hand, the digital foundation is necessary for the development of smart manufacturing. The length of the transportation route and highway operation truck ownership are selected to reflect the circulation capability of product. The coverage ratio of the cable and number of websites per 100 enterprises are selected to reflect existing levels of digital foundation in provinces.
2.1.3. Interpretation of the Indicator of Industrial Development
The industrial development includes innovation capability, production capability, smart production and green manufacturing. The development of smart manufacturing takes the integration of innovation as the premise, smart production as the manifestation, relies on the existing capital and production efficiency of enterprises, and helps to solve the problems of energy consumption and pollution. The full-time equivalent of research and development personnel, number of valid invention patents, and sales revenue of new products of industrial enterprises above the state-designated scale are selected to measure the innovation capability of enterprises. Total profit, total assets of industrial enterprises above the state-designated scale, and industrial labor productivity are selected to reflect the production capability. Installation number of industrial robots and income of software business are selected to reflect the smart production. Electricity consumption, emissions of exhaust gas, completed investment in pollution control per unit of industrial added value and comprehensive utilization rate of general industrial solid waste are selected to reflect environmental protection of industrial development.
2.1.4. Correlation Analysis of Indicators
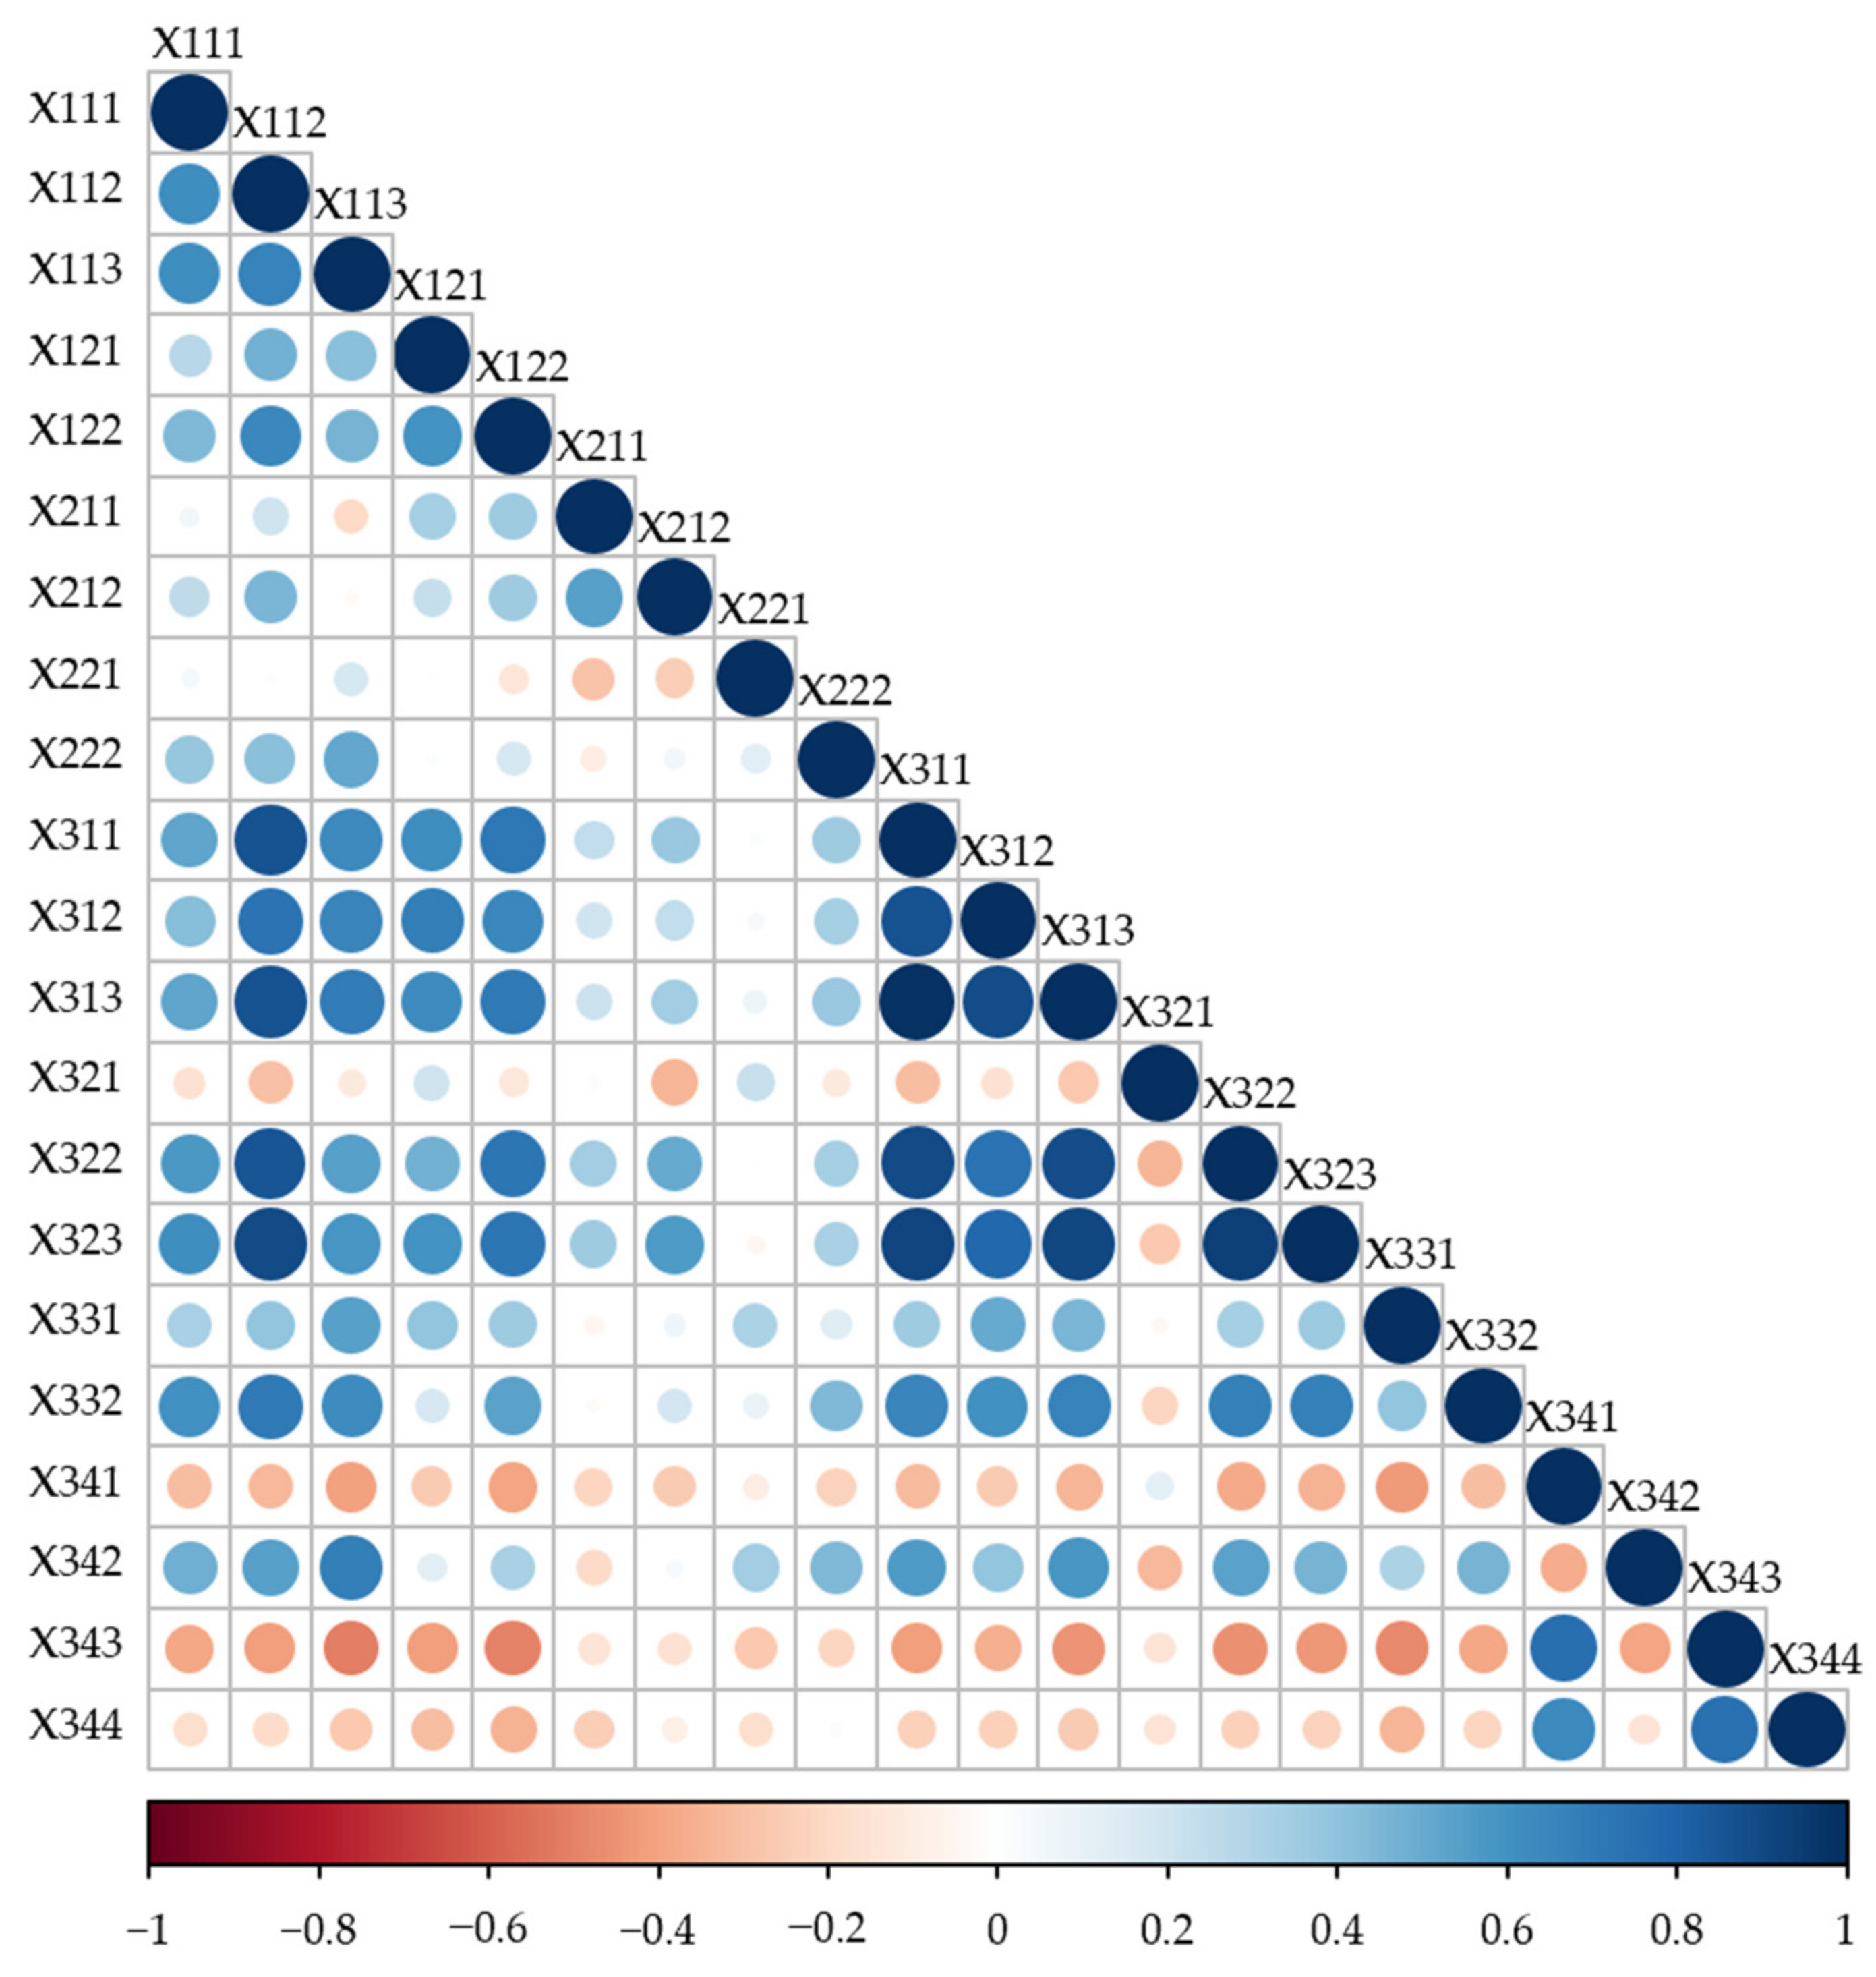
In order to ensure the rationality and scientificity of the index system, the correlation between the 21 three-level indicators is analyzed. Based on the correlation coefficient matrix, the correlation matrix diagram is plotted, as shown in Figure 2.
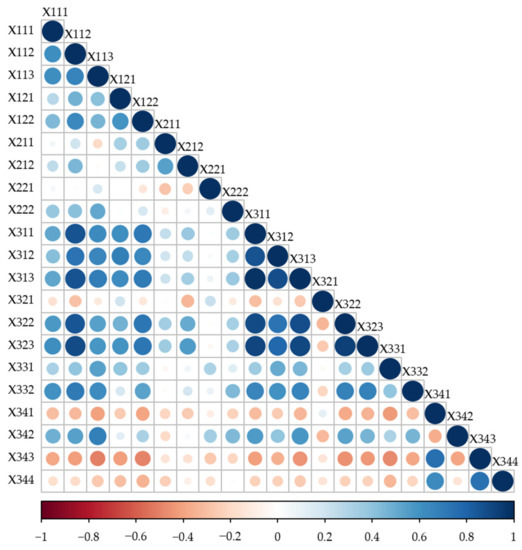
Figure 2.
Correlations between the three-level indicators.
As can be seen from Figure 2, the correlations between the indicators are not high. Only X313 with X311 and X323, and X323 with X311 and X322, where the correlations exceed 0.9. However, X313 reflects innovation output, while X311 reflects innovation input, and these two indicators reflect innovation capability from different perspectives [32]. X323 reflects production scale, while X322 reflects production performance, and these two indicators reflect production capability from different perspectives [37]. Based on the above considerations and the existing research literatures, X313 and X323 should be retained in the index system.
2.2. Data Sources and Processing
2.2.1. Data Sources
In view of the serious lack of some indicators in Tibet, this paper takes 30 provinces in China as the research object and selects data from 2014 to 2019 to dynamically evaluate the SMC. The original data of the indicators were mostly from the China Statistical Yearbook. Among them, the data on the internet integration demonstration projects and pilot enterprises in the implementation of the two-in-one integration management systems were from the Ministry of Industry and Information Technology of China. The data on industrial robots were from the China Industrial Information Network. The data on industrial electricity consumption were from the China Energy Statistical Yearbook. The data on industrial pollution were from the China Environmental Statistical Yearbook.
2.2.2. Data Processing
The original data collected can be used as some of the indicators from the Table 1, while other indicators need to be sorted and calculated. The processing methods are as follows. X113 was the ratio of expenditure of science and technology in provinces to total expenditure in the general public budget. X211 was the sum of railway, inland waterway and highway mileage. X221 was the ratio of cable length to the provincial area. X321 was the ratio of the industrial added value of provinces to the average number of employees in industrial enterprises above the state-designated scale. Based on the data processing method of Han et al. [39], the proportion of automobile production in provinces is taken as the weight, and then the installation of the total amount of industrial robots in China is distributed to get X331. X341 was the ratio of industrial electricity consumption to industrial added value. X342 and X344 could be obtained in the same method. X343 was the ratio of total comprehensive utilization to the production of general industrial solid waste in provinces.
In addition, for the indicators with missing values, this paper adopted a reasonable way to fill them. The operation is as follows. Firstly, based on the internet and industrial integration innovation pilot enterprises from 2014 to 2015, and manufacturing and the internet integration development pilot demonstration projects from 2017 to 2019, X111 was the ratio of the number of projects above in each province to the total amount of projects in China (except the projects of Tibet). The missing data in 2016 were filled by median according to the existing data of five years. The internet and industrial integration innovation pilot enterprises are basically manufacturing enterprises, so the method above is reasonable. Secondly, X112 was the ratio of the number of pilot enterprises in the implementation of the two-in-one integration management system in each province to the total amount of enterprises in China (except the enterprises of Tibet) from 2014 to 2018. The missing data for 2019 were filled in medians from 2014 to 2018.
3. Research Methods
3.1. Comprehensive Evaluation Method
In dealing with dynamic comprehensive evaluation problems, most scholars chose to use the information aggregation operator to accomplish the information aggregation [40,41,42,43,44,45]. This paper adopts the entropy weight TOPSIS and dynamic comprehensive evaluation method based on the TOWA operator, taking into account both time preference and distribution of time-series data. The advantage of the method is that it can comprehensively compare the SMC of provinces in China in the same year as well as compare the SMC of specific provinces in different years.
3.1.1. First Weighted Synthesis
The first weighted synthesis focuses on the role of each index at different moments. The method of entropy weight TOPSIS is used to calculate the value of static comprehensive evaluation at each moment. The optimal entropy weight coefficient is calculated by entropy, and it is used to obtain the closest ideal solution by TOPSIS [46]. The specific steps are as follows.
Step 1: Assuming that there are n evaluated objects and m evaluation indicators, and the judgment matrix is:
where , and .
Step 2: Standardizing the judgment matrix. The standardized formula for positive indicators is:
and the standardized formula for negative indicators is:
Step 3: Determining the entropy weight of each indicator:
where and .
Step 4: Calculating the weighted matrix for each indicator:
Step 5: Calculating the distance of each evaluated object to the positive or negative ideal solution:
where and .
Step 6: Calculating the ideal solution, namely the value of static comprehensive evaluation:
3.1.2. Second Weighted Synthesis
The second weighted synthesis is based on the first weighted synthesis, highlighting the role of time. It aims to obtain the time weight and get the value of dynamic comprehensive evaluation. The time weight determined by the dynamic comprehensive evaluation method based on the optimized TOWA operator is not only related to the sequence position of the time inducing but also related to the drive-optimized status of time sequence in the whole data, that is, the time weight considers both the “time degree” and the “optimal degree” [47]. The “time degree” is a measure of the evaluator’s degree of time preference and is given in advance by the evaluator. The “optimal degree” is objectively calculated based on the observed values of each index in the evaluation information and does not depend on the subjective judgment of the evaluator. The specific steps are as follows.
Step 1: Setting the static comprehensive evaluation matrix as:
where and the “time degree” as . The time weight vector considering only the “time degree” is:
The time weight vector considering only the “optimal degree” is:
Step 2: Determining the time weight vector considering the “time degree”:
Step 3: Determining the time weight vector considering the “optimal degree”.
First, getting the optimal time sequence of data:
where and .
Second, calculating the difference of the optimal time sequence of the data:
Third, using the difference sequence of the optimal time sequence of data as the reference sequence. The standard deviation of difference sequences is:
where .
Fourth, the standard deviation of is:
where , and .
Fifth, getting the correlation tendency degree between development level of the system and the optimal development level at moment:
where .
Sixth, sorting sequence in ascending and getting the vector of the “optimal degree”:
That is, given a value , there is a correlation tendency degree value about the moment corresponding to it.
Finally, setting the weight at the minimum moment of “optimal degree” as . In order to make the weight of the least important data of forward moment equal to the weight of the data at the minimum moment of “optimal degree”, take [47]. Then, the time weight vector corresponding to the vector of “optimal degree” is:
and the time weight vector considering the “optimal degree” is obtained from the correspondence between and .
Step 4: Getting the value of dynamic comprehensive evaluation of each evaluated object:
where and are determined by the model:
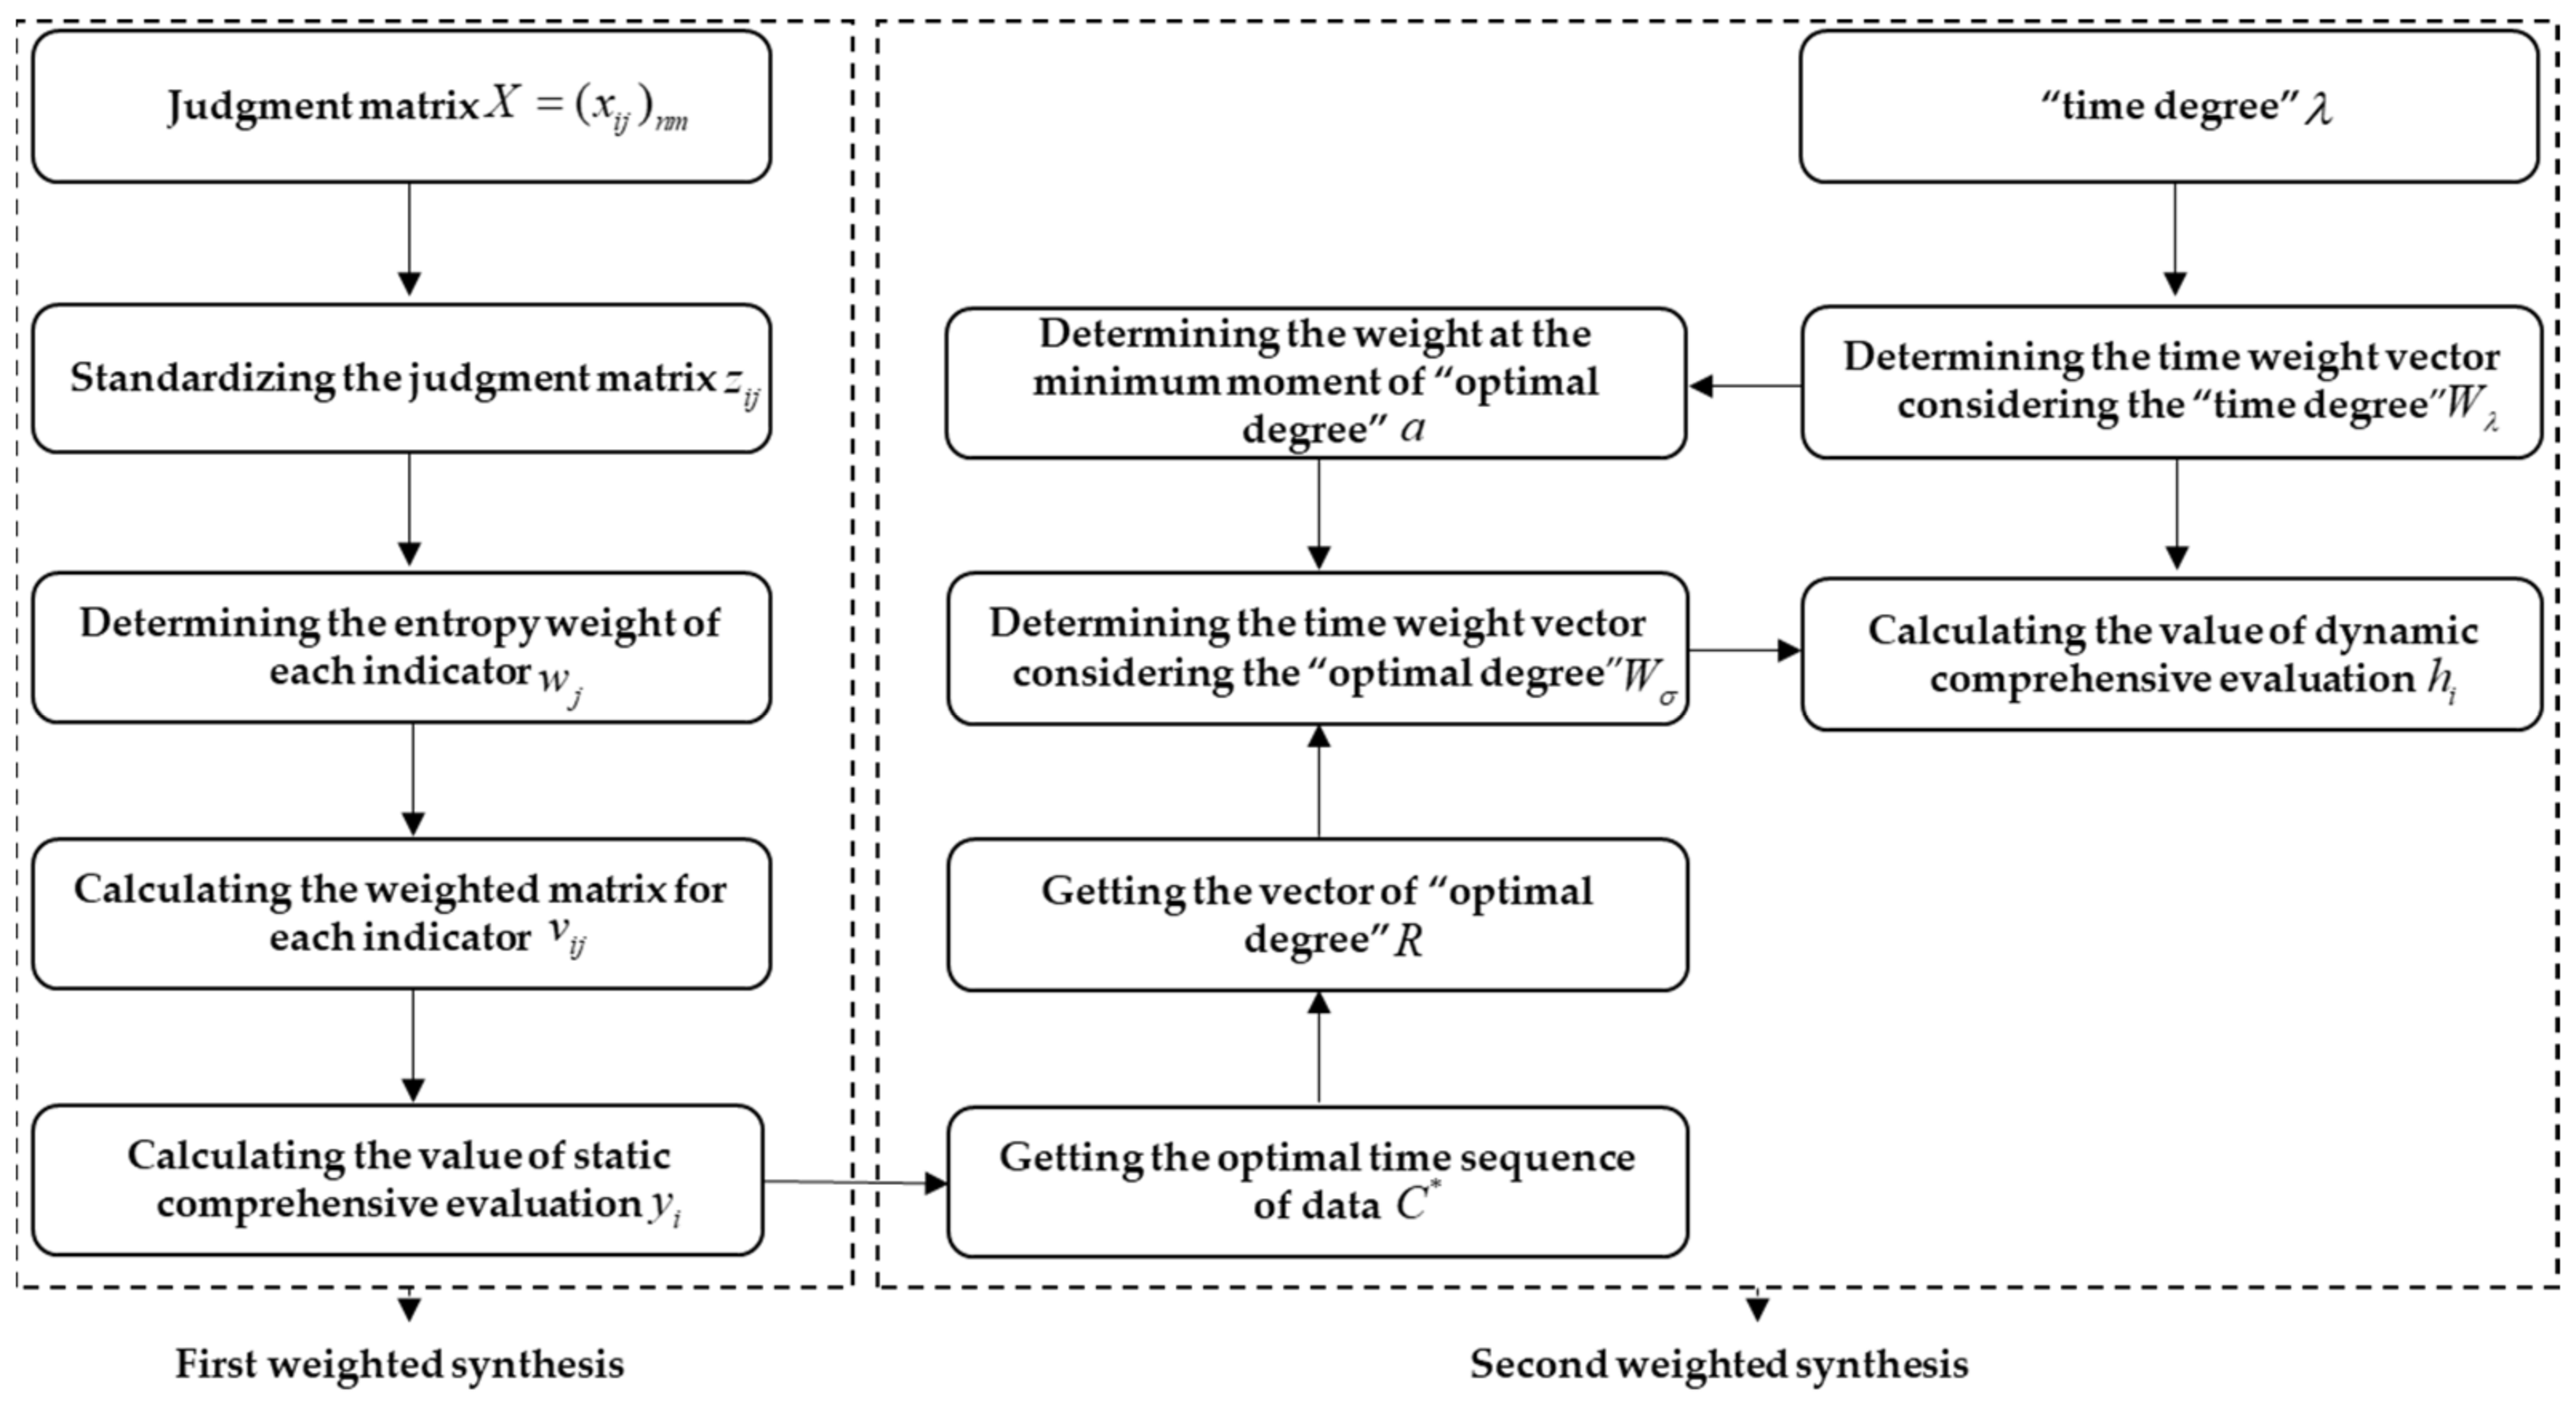
A concise flowchart of the comprehensive evaluation method is shown in Figure 3.

Figure 3.
Flowchart of the comprehensive evaluation method.
3.2. Spatial Correlation Analysis Method
Spatial correlation analysis is used to study whether the relevant attributes of each region are independent in space, that is, whether there is a spatial correlation. The Moran’s index (Moran’s I) is commonly used to measure spatial correlation. Spatial correlation includes global correlation and local correlation.
The global spatial correlation is used to describe the spatial characteristics of spatial elements in the whole region and is mainly judged by the global Moran’s I. The formula is as follows:
where and . is the total number of regions, is the sample variance, is the sample mean, is the spatial weight, and represent the attribute values of region and region . Moran’s I takes values in the range of [–1, 1], when Moran’s I > 0, it means that the attribute values of all regions have positive correlation in space, when Moran’s I = 0, it means that the attribute values are randomly distributed in the region and have no spatial correlation.
Local spatial correlation reveals the heterogeneous characteristics of spatial differences to fully reflect the changing trends of regional spatial differences. The Moran scatter plot drawn from the global Moran’s I can be used to analyze local spatial correlation.
4. Results and Analysis
4.1. Analysis of Dynamic Evaluation Results
Referring to the thought of “lay more stress on the present than on the past”, take the value “time degree” is 0.1, then get weight at the minimum moment of “optimal degree” is 0.0029. This paper uses methods of entropy weight TOPSIS and the dynamic comprehensive evaluation based on the TOWA operator, R language, LINGO to obtain the value of comprehensive evaluation and ranking of SMC in China’s provinces from 2014 to 2019. The results are listed in Table 2 and Table 3.
Table 2.
Value of comprehensive evaluation in provincial SMC from 2014 to 2019.
Table 3.
Comprehensive ranking in provincial SMC from 2014 to 2019.
First, as can be seen from Table 2 and Table 3, the ranking of SMC of each province in each year is basically stable, and the value of dynamic comprehensive evaluation could better reflect the SMC in six years. From the vertical perspective, the provinces with relatively improving SMC from 2014 to 2019 are mainly Zhejiang, Sichuan, Hunan, Jiangxi, Shanxi, and Guizhou, and those with declining capability are mainly Shandong, Liaoning, and Heilongjiang. From the horizontal perspective, only Guangdong and Jiangsu present with values of comprehensive evaluation greater than 0.5. There are seven provinces including Zhejiang, Beijing and Shanghai with values ranging from 0.25 to 0.5, and the value of most provinces is less than 0.25. This shows a large gap in SMC of some provinces, with an obvious pyramidal stratification phenomenon.
Subsequently, a concrete analysis of the reasons why some provinces rank ahead and behind was performed. The reasons for the high ranking of some provinces are as follows. (1) Guangdong ranked first in every year, and its advantages might lie in its superior geographical location, flourishing private economy and private enterprises are mainly concentrated in the manufacturing industry [48]. On the one hand, Guangdong relies on the construction of Guangdong–Hong Kong–Macao Greater Bay Area to promote development through opening up. On the other hand, the smart products and related applications of enterprises represented by Huawei and Tencent bring great convenience to the development of smart manufacturing in the region. In addition, Guangdong’s strategies of smart manufacturing development have advanced from “machine replacement” to “data replacement” [49]. (2) Jiangsu, Zhejiang, Beijing, Shandong, and Shanghai remained in the top six every year. Among them, Beijing and Shandong have obvious advantages in talent training. Besides, Beijing is the political center, and Shandong has a complete industrial system [50], which has become a great advantage in the development of smart manufacturing in the Bohai Economic Circle. Jiangsu, Zhejiang, and Shanghai are located in the Yangtze River Delta, where scientific research institutions and manufacturers are concentrated, and they also represent one of the most concentrated areas of Chinese capital. Meanwhile, their advantage of digital economy has become a favorable condition to promote the development of smart manufacturing [51]. The reasons for the low ranking of some provinces are as follows. (3) Heilongjiang and Gansu were basically at the bottom of the ranking every year. Heilongjiang has a long winter and a poor natural environment, and although it is adjacent to Russia, it is still inland and it’s opening up is restricted. Moreover, the manufacturing of Heilongjiang is dominated by low-end products, with low value-added products and a single structure [52]. Gansu is located in the northwest region. In general, the human capital in the northwest region is insufficient, which is reflected in the low quantity of high-quality labor, resulting in its weak knowledge and technical capability. The infrastructure of Gansu is not advanced, which is reflected in the sparse transportation lines and poor communication facilities, which leads to its difficult environment for investment. The geography and climate of Gansu are not good, and the ecological and environmental problems are serious, which makes it difficult to adjust its industrial structure. These objective reasons above cause the weak development of industrial infrastructure and information technology in Northwest China, which hinder a major obstacle to the development of regional smart manufacturing.
Then, the Theil index of SMC in China from 2014 to 2019 was calculated. The Theil index is used to study the dynamics of inequality, with lower values indicating greater equality [53]. Therefore, the Theil index can measure the provincial difference in the SMC. The results are shown in Figure 4. As can be seen from Figure 4, in general, the value of the Theil index declines while fluctuating from 2014 to 2019, indicating that the difference of SMC between provinces in China is narrowing, and the provincial smart manufacturing shows a gradual coordinated development trend.
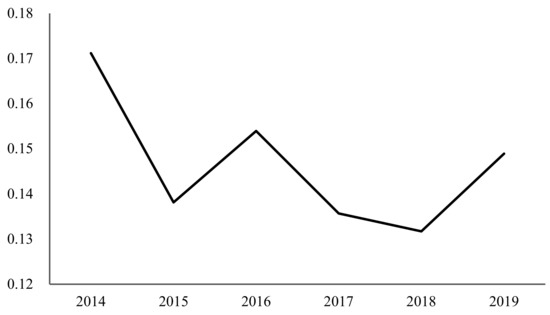
Figure 4.
Theil index of China’s provincial SMC from 2014 to 2019.
Further, visualizing the SMC and spatial distribution pattern in each province by ArcGIS, which can intuitively reflect the dynamic change of SMC. The results are shown in Figure 5. According to the dynamic comprehensive ranking, 30 provinces are divided into high, medium, and low smart manufacturing provinces, with 10 in each category. According to China’s Seventh Five Year Plan, 30 provinces are divided into eastern (BJ, TJ, HE, LN, SH, JS, ZJ, FJ, SD, GD, HI and GX), central (SX, NM, JL, HL, AH, JX, HA, HB and HN) and western regions (CQ, SC, GZ, YN, SN, GS, QH, NX, and XJ) for further discussion. The results are shown in Table 4.
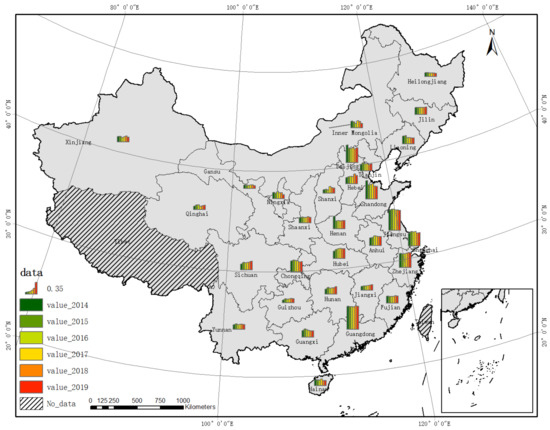
Figure 5.
Spatial distribution of SMC from 2014 to 2019.
Table 4.
Correlation between provincial SMC and geographical blocks in China.
As can be seen from Figure 5 and Table 4, the spatial distribution of SMC in China’s provinces is not balanced with an obvious gap among eastern, central and western regions. The SMC from strong to weak is eastern, central, and western regions, showing the spatial characteristics of “strong in the east and weak in the west”. Specifically, among provinces with the strong SMC, the advantages of the eastern region are reflected in the outstanding digital foundation and innovation capability. For the central region, due to its central location and the development of transportation infrastructure, its capability of product circulation is strong. Among provinces with the low SMC, the relative disadvantage of eastern and central regions is low labor productivity. For the western region, the government policies, industrial development, and talent attraction are not as good as other regions.
4.2. Spatial Correlation Analysis
From the above analysis, there are spatial differences in SMC among China’s provinces, however, it needs to be verified whether there is correlation among SMC in each province, so analysis should be performed for spatial correlation. Global Moran’s I is used to analyze the spatial characteristics of SMC in China’s provinces from 2014 to 2019. The results are shown in Table 5.
Table 5.
Global Moran’s I of SMC from 2014 to 2019.
As can be seen from Table 5, the global Moran’s I values of SMC are positive and the corresponding p-values are significant, indicating the existence of positive spatial correlation among provinces. The Moran’s I increases gradually from 2014 to 2017, indicating that the spatial aggregation effect of SMC in China’s provinces are strengthening.
In order to accurately measure the local spatial correlation between each province and its adjacent provinces, Moran scatter plots are drawn for all years, and the relevant information is organized. There are four types of aggregation, namely High-High aggregation (H-H), Low-High aggregation (L-H), Low-Low aggregation (L-L), and High-Low aggregation (H-L). The left side of the link indicates the level of the province itself and the right side indicates the level of the adjacent provinces. The results are listed in Table 6.
Table 6.
Moran‘s I scatter distribution of provincial SMC.
As can be seen from Table 6. the local spatial aggregation types of China’s provincial SMC changed slightly from 2014 to 2019. The following is a detailed analysis about four aggregation types. First, Jiangsu, Zhejiang, Shanghai, and Shandong have been in H-H regions for a long time, indicating that the SMC of these provinces is at a high level, and there is a strong correlation between provinces. Second, Fujian, Tianjin, Hunan, Liaoning, Jiangxi, Shanxi and Hainan have been in L-H regions for a long time, indicating that the SMC of these provinces is at a lower level compared with their adjacent provinces, and the regional heterogeneity is obvious. Third, most of the provinces that had long been in L-L regions are western regions, whose smart manufacturing has developed slowly and there is no positive interaction with their adjacent provinces. Last, Guangdong and Chongqing had long been in H-L regions. Guangdong is the core province of economic development in the Pearl River Delta, and its SMC is significantly at a higher level than the adjacent province. Chongqing belongs to the western region and develops faster than other western regions, and its SMC is also significantly at a higher level than the adjacent provinces.
The following analysis is from the perspective of aggregation type changes. Beijing changed from H-L to H-H and then to H-L, indicating the SMC of Beijing has been at a high level while the SMC of adjacent provinces have changed slightly. Hubei and Anhui have changed from L-H to H-H, indicating that their SMC have improved by the positive impact of adjacent provinces. Hebei has changed from L-H to H-H and then to L-H, indicating the SMC of Hebei has a relative upward trend, but the promotion is insufficient. Henan has changed from H-H to L-H, indicating a decrease in its SMC, probably due to a lower rate of smart manufacturing development than the adjacent provinces. Jilin and Inner Mongolia have changed in L-H and L-L types, indicating that the SMC of them and adjacent provinces has improved slowly.
5. Conclusions and Enlightenment
5.1. Conclusions
This paper constructs the evaluation index system of the SMC in provinces of China and uses methods of entropy weight TOPSIS and the dynamic comprehensive evaluation based on the TOWA operator to obtain the SMC of 30 provinces from 2014 to 2019. Using the Theil index and spatial correlation methods to explore the provincial difference and spatial distribution characteristics. The main conclusions are as follows. First, from the values of dynamic comprehensive evaluation, China has fewer provinces with strong SMC and more provinces with weak SMC, and it has the characteristics of “strong in the east and weak in the west”, but the degree of provincial difference is becoming smaller. Second, from the change of SMC, the provinces with relatively improving SMC from 2014 to 2019 are mainly Zhejiang, Sichuan, Hunan, Jiangxi, Shanxi, and Guizhou, and those with declining capability are mainly Shandong, Liaoning, and Heilongjiang. Third, the SMC of provinces has a significant positive spatial correlation and spatial aggregation effect. Most provinces in the east are in H-H regions and H-L regions, most provinces in the center are in L-H regions, and most provinces in the west are in L-L regions.
5.2. Recommendations
There are certain differences in industrialization and informatization among provinces in China, as well as the degree of integration between the two, leading to different SMC. Based on the conclusions, the following suggestions are put forward to narrow the differences in the SMC of provinces and promote the transformation and development of the manufacturing industry.
First, based on the national perspective, the gradient difference in the SMC should be considered to make the following measures. The state should formulate relevant policies to create a good environment for the development of smart manufacturing. For example, implement tax preference policies, guide social capital investment in smart manufacturing in the central and western regions, talent introduction policies should be developed to introduce information and digital technology talents related to smart manufacturing. In addition, the national major science and technology projects should be strengthened to support the field of smart manufacturing. For example, ensure the implementation of the “East Digital West Computing” project [54] to promote the digital, smart, and green transformation of manufacturing industry of the western regions.
Second, based on the regional perspective, the eastern and central regions should strive to improve the allocation efficiency of production factors to solve the problem of low labor productivity. On the one hand, improve the business environment, break administrative barriers, and promote the free circulation of production factors. On the other hand, the property rights system should be improved and full play given to the incentive role of intellectual property in the industrialization of innovation achievements. The western regions should speed up the construction of digital infrastructure to solve the widespread problem of weak digital foundation, promote cross-regional development of key technological innovations in smart manufacturing, and adjust the layout of industrial synergy production.
Third, based on the provincial perspective, comparative advantages should be considered. The invisible provincial barriers should be broken, respective roles clarified, and the development of smart manufacturing promoted. For instance, Guangdong has the advantages of talents, technology, capital, and good industrial foundation, while Guangxi, its adjacent region, has only the relative advantages of resources and labor. So, Guangdong and Guangxi can use their respective advantages to promote the development of smart manufacturing.
This paper has established the provincial smart manufacturing evaluation system and analyzed the internal influence mechanism and spatial relationship of SMC, which is helpful to understand the development potential and transformation and upgrading capability of the manufacturing industry in each province, and to find the direction of innovation. At the same time, these views and conclusions also have great reference value for some countries to explore the transformation path of smart manufacturing. However, there are still shortcomings. First, due to the availability of data, this paper only selected six years of data, a shorter time span. Second, the selection of the evaluation index is limited to national and provincial macro data, which needs to be improved. These two deficiencies should be considered in future research.
Author Contributions
Conceptualization, J.X. and Z.L.; formal analysis, Z.L.; methodology, X.W.; writing—original draft preparation, J.X. and X.W.; writing—review and editing, Z.L. and Y.J. All authors have read and agreed to the published version of the manuscript.
Funding
This research is funded by the National Statistical Science Research Project of China (grant number 2020LY083).
Institutional Review Board Statement
Not applicable.
Informed Consent Statement
Not applicable.
Data Availability Statement
The data presented in this study are available on request from China Statistical Yearbook, Ministry of Industry and Information Technology of China, China Industrial Information Network, China Energy Statistical Yearbook and China Environmental Statistics Yearbook from 2015 to 2020.
Conflicts of Interest
The authors declare no conflict of interest.
References
- Thoben, K.D.; Wiesner, S.; Wuest, T. “Industrie 4.0” and Smart Manufacturing—A Review of Research Issues and Application Examples. Int. J. Automot. Technol. 2017, 11, 4–19. [Google Scholar] [CrossRef]
- White House Office of the Press Secretary. President Obama Launches Advanced Manufacturing Partnership. Available online: https://obamawhitehouse.archives.gov/the-press-office/2011/06/24/president-obama-launches-advanced-manufacturing-partnership (accessed on 20 February 2022).
- Advanced Manufacturing National Program Office. Strategy for American Leadership in Advanced Manufacturing. Available online: https://www.manufacturing.gov/news/announcements/2018/10/strategy-american-leadership-advanced-manufacturing (accessed on 20 February 2022).
- China Academy of Industrie 4.0. National Industrial Strategy 2030: Strategic Guidelines for a German and European Industrial Policy. Available online: http://www.innobase.cn/?p=1949 (accessed on 22 February 2022).
- The Government Office for Science, London. The Future of Manufacturing: A New Era of Opportunity and Challenge for the UK Project Report. Available online: https://assets.publishing.service.gov.uk/government/uploads/system/uploads/attachment_data/file/255922/13-809-future-manufacturing-project-report.pdf (accessed on 22 February 2022).
- Government of the French Republic. The New Face of Industry in France. Available online: https://www.economie.gouv.fr/files/nouvelle_france_industrielle_english.pdf (accessed on 22 February 2022).
- Zhang, Y.X.; Li, G.C. A Summary of Japan’s Industrial and Technological Strategic System in the New Era. Contemp. Econ. Jpn. 2021, 40, 16. [Google Scholar]
- State Council of the People’s Republic of China. Made in China 2025. Available online: http://www.gov.cn/zhengce/content/2015-05/19/content_9784.htm (accessed on 24 February 2022).
- Zhou, J. Intelligent Manufacturing—Main Direction of “Made in China 2025”. China Mech. Eng. 2015, 26, 2273–2284. [Google Scholar]
- Cai, M.; Luo, J.W. Influence of COVID-19 on Manufacturing Industry and Corresponding Countermeasures from Supply Chain Perspective. Shanghai Jiaotong Univ. 2020, 25, 409–416. [Google Scholar] [CrossRef] [PubMed]
- The State Council of the PRC. On Accelerating the Cultivation and Development of Strategic Emerging Industries. Available online: http://www.gov.cn/zhengce/content/2010-10/18/content_1274.htm (accessed on 8 August 2022).
- Wu, W.Y.; Liu, J.Y. Mechanism and Optimization Path of Smart Manufacturing to Promote Industrial Transformation and Upgrading in China. J. Xi’an Univ. Financ. Econ. 2020, 33, 19–26. [Google Scholar]
- Chen, C. Smart Manufacturing Helps to Build a Community of Shared Future for Mankind. Forum Sci. Technol. China 2020, 4, 4–5. [Google Scholar]
- Wright, P.K.; Bourne, D.A. Manufacturing Intelligence; Addison Wesley: Boston, MA, USA, 1988; pp. 23–40. [Google Scholar]
- Smart Manufacturing Leadership Coalition (SMLC). Implementing 21st Century Smart Manufacturing Workshop Summary Report; SMLC: Washington, DC, USA, 2010. [Google Scholar]
- Davis, J.; Edgar, T.; Porter, J.; Bernaden, J.; Sarli, M. Smart manufacturing, manufacturing intelligence and demand-dynamic performance. Comput. Chem. Eng. 2012, 47, 145–156. [Google Scholar] [CrossRef]
- Kang, H.S.; Lee, J.Y.; Choi, S.S.; Kim, H.; Park, J.H.; Son, J.Y.; Kim, B.H.; Noh, S.D. Smart manufacturing: Past research, present findings, and future directions. Int. J. Pr. Eng. Man-GT. 2016, 3, 111–128. [Google Scholar] [CrossRef]
- Li, B.H.; Hou, B.C.; Yu, W.T.; Lu, X.B.; Yang, C.W. Applications of artificial intelligence in smart manufacturing: A review. Front. Inform. Tech. El. 2017, 18, 86–96. [Google Scholar] [CrossRef]
- Lu, Y. Industry 4.0: A Survey on Technologies, Applications and Open Research Issues. J. Ind. Inf. Integr. 2017, 6, 1–10. [Google Scholar] [CrossRef]
- Abubakr, M.; Abbas, A.T.; Tomaz, I.; Soliman, M.S.; Luqman, M.; Hegab, H. Sustainable and Smart Manufacturing: An Integrated Approach. Sustainability 2020, 12, 2280. [Google Scholar] [CrossRef]
- Lee, Y.T.; Kumaraguru, S.; Jain, S.; Robinson, S.; Helu, M.; Hatim, Q.Y.; Rachuri, S.; Dornfeld, D.; Saldana, C.J.; Kumara, S. A Classification Scheme for Smart Manufacturing Systems’ Performance Metrics. Smart Sustain. Manuf. 2017, 1, 52–74. [Google Scholar] [CrossRef] [PubMed]
- European Commission. Energy-Efficient Buildings: Multi-Annual Roadmap for the Contractual PPP under Horizon 2020. Available online: https://op.europa.eu/en/publication-detail/-/publication/dc665bc5-f05b-4f13-b29c-ec1fdfb4cf87/language-en/format-PDF/source-search (accessed on 6 August 2022).
- Smart Process Manufacturing Engineering Virtual Organization Steering Committee. Smart Process Manufacturing: An Operations and Technology Roadmap. Available online: http://www.cameta.org.cn/uploadfile/2016/0109/20160109103304288.pdf (accessed on 6 August 2022).
- Kusiak, A. Smart Manufacturing. Int. J. Prod. Res. 2018, 56, 508–517. [Google Scholar] [CrossRef]
- Kusiak, A. Fundamentals of Smart Manufacturing: A Multi-Thread Perspective. Annu. Rev. Control 2019, 47, 214–220. [Google Scholar] [CrossRef]
- Qu, S.; Jian, R.; Chu, T.; Wang, J.; Tan, T. Computational Reasoning and Learning for Smart Manufacturing under Realistic Conditions. In Proceedings of the International Conference on Behavioral, Economic, and Socio-Cultural Computing, Shanghai, China, 30 October–1 November 2014. [Google Scholar]
- Jung, K.; Cho, H.; Leong, S.; Morris, K.; Lyons, K.W. Performance Challenges Identification Method for Smart Manufacturing Systems. Available online: https://nvlpubs.nist.gov/nistpubs/ir/2016/NIST.IR.8108.pdf (accessed on 3 August 2022).
- Marco, B.; Francesco, G.G.; Cristina, M. Reconfigurable Manufacturing Systems: Literature Review and Research Trend. J. Manuf. Syst. 2018, 49, 93–106. [Google Scholar]
- Zhen, B.X. Smart Manufacturing and National Innovation System—America’s Experiences in Developing the Advanced Manufacturing Industry. Frontiers 2015, 11, 27–39. [Google Scholar]
- Wu, C. Intelligent Manufacturing: A New Grasp of the Real Economy Innovation and Development. In Proceedings of the China’s Smart Manufacturing Forum, Shanghai, China, 25 September 2018. [Google Scholar]
- Meng, F.S.; Zhao, G. Research on the Factors Influencing the Development of Traditional Manufacturing to Smart Manufacturing. Sci. Tech. Prog. Policy 2018, 35, 66–72. [Google Scholar]
- Chen, G.; Xue, L.; Zhang, B. Evaluation of Smart Manufacturing Capability Based on Projection Pursuit Model of Genetic Algorithm—Data from 31 Provinces and Cities in China. Soc. Sci. Shenzhen 2020, 3, 41–49. [Google Scholar]
- China Industrial Research Institute of the 21st Century. China Intelligent Manufacturing Index (CIMI) Report 2019. Available online: https://www.sohu.com/a/373063703_120056153 (accessed on 15 May 2022).
- Zhou, J.M.; Cui, F.F.; Wang, W.L. The Spatial Effect of Financial Innovation on Intellectualized Transformational Upgrading of Manufacturing Industry: An Empirical Evidence from China. Sustainability 2022, 14, 7665. [Google Scholar] [CrossRef]
- Wu, M.J.; Xu, C.P.; Tang, L. The Research on Evaluation of Regional Smart Manufacturing Development Level in China. Reform Econ. Syst. 2020, 2, 60–65. [Google Scholar]
- Yi, W.M.; Dong, P.W.; Wang, J. Research on Evaluation Model of Enterprise Smart Manufacturing Capability Based on High Order Tensor Analysis. J. Ind. Technol. Econ. 2018, 37, 11–16. [Google Scholar]
- Wang, Y.M.; Zhang, X.W. Research on Smart Manufacturing Capability Maturity Index System of China’s Manufacturing Industry under Smart Economy. Sci. Decis. Mak. 2021, 28, 118–132. [Google Scholar]
- Wan, X.Y.; Zhao, H.; Zhang, Y. Construction and Measurement of Smart Development Evaluation Index System in China. Res. Econ. Manag. 2020, 17, 15. [Google Scholar]
- Han, M.C.; Feng, L.L. Research on the Impact of Industrial Robot Application on Labor Employment in China. J. Ind. Technol. Econ. 2020, 39, 117–122. [Google Scholar]
- Yager, R.R.; Filev, D.P. Induced Ordered Weighted Averaging Operators. IEEE T. Syst. Man. Cybern. 1999, 29, 141–150. [Google Scholar] [CrossRef]
- Xu, Z.S.; Da, Q.L. The Ordered Weighted Geometric Averaging Operators. Int. J. Intell. Syst. 2002, 17, 709–716. [Google Scholar] [CrossRef]
- Torra, V. OWA Operators in Data Modeling and Reidentification. IEEE T. Fuzzy Syst. 2004, 12, 652–660. [Google Scholar] [CrossRef]
- Xu, Z. Intuitionistic Fuzzy Aggregation Operators. IEEE T. Fuzzy Syst. 2007, 15, 1179–1187. [Google Scholar]
- Yi, P.T. Theory and Application of Multi-source Information Density Aggregation Operators; Science Press: Beijing, China, 2012. [Google Scholar]
- Zhang, F.M. Group Evaluation Methods and Applications under Model Expansion; Science Press: Beijing, China, 2015. [Google Scholar]
- Chen, L.; Wang, T.Z. Research on the TOPSIS Integrated Evaluation and Decision Method Based on Entropy Coefficient. Control Decis. 2003, 18, 4. [Google Scholar]
- Zhang, F.M. Dynamic Comprehensive Evaluation Method and Application; Science Press: Beijing, China, 2018; pp. 40–50. [Google Scholar]
- Guangdong’s Top 100 Private Enterprises Announced the List of Enterprises are Concentrated in Manufacturing. Available online: https://news.southcn.com/node_17a07e5926/0f1994eeed.shtml (accessed on 8 August 2022).
- Guangdong’s Progression of Smart Manufacturing: From “Machine Replacement” to “Data Replacement “. Available online: https://www.sohu.com/a/147629094_119689 (accessed on 8 August 2022).
- The Status of the Industrial Province Continues to Consolidate. Available online: http://www.sd.chinanews.com.cn/2/2020/1216/76571.html (accessed on 8 August 2022).
- Shan, Z.D. Smart Manufacturing and the Construction of a Strong Manufacturing Country. In Proceedings of the 2022 Yangtze River Delta Digital Economy Development Conference, Nanjing, China, 6 January 2022. [Google Scholar]
- Huang, Y.Q.; Xiao, H.W.; Zeng, W.X. Problems and Measures of Manufacturing Industry Development in Heilongjiang. Bus. Econ. 2020, 39, 24–25. [Google Scholar]
- Conceição, P.; Galbraith, J.K. Constructing Long and Dense Time-Series of Inequality Using the Theil Index. East. Econ. J. 2000, 26, 61–74. [Google Scholar]
- National Development and Reform Commission of the PRC. National Integrated Big Data Center Collaborative Innovation System Arithmetic Hub Implementation Plan. Available online: https://zfxxgk.ndrc.gov.cn/web/iteminfo.jsp?id=18126 (accessed on 9 August 2022).


Publisher’s Note: MDPI stays neutral with regard to jurisdictional claims in published maps and institutional affiliations. |
© 2022 by the authors. Licensee MDPI, Basel, Switzerland. This article is an open access article distributed under the terms and conditions of the Creative Commons Attribution (CC BY) license (https://creativecommons.org/licenses/by/4.0/).