Review

Autonomous Vehicles in Mixed Traffic Conditions—A Bibliometric Analysis

1
Faculty of Engineering, School of Civil Engineering, Universiti Teknologi Malaysia, Skudai 81310, Johor, Malaysia
2
Faculty of Civil Engineering Technology, Universiti Malaysia Pahang, Gambang, Kuantan 26300, Pahang, Malaysia
*
Author to whom correspondence should be addressed.
Sustainability 2022, 14(17), 10743; https://doi.org/10.3390/su141710743
Submission received: 24 May 2022 / Revised: 16 August 2022 / Accepted: 19 August 2022 / Published: 29 August 2022
(This article belongs to the Special Issue Sustainable Smart Urban Transport System)

Abstract

:
Autonomous Vehicles (AVs) with their immaculate sensing and navigating capabilities are expected to revolutionize urban mobility. Despite the expected benefits, this emerging technology has certain implications pertaining to their deployment in mixed traffic streams, owing to different driving logics than Human-driven Vehicles (HVs). Many researchers have been working to devise a sustainable urban transport system by considering the operational and safety aspects of mixed traffic during the transition phase. However, limited scholarly attention has been devoted to mapping an overview of this research area. This paper attempts to map the state of the art of scientific production about autonomous vehicles in mixed traffic conditions, using a bibliometric analysis of 374 documents extracted from the Scopus database from 1999 to 2021. The VOSviewer 1.1.18 and Biblioshiny 3.1 software were used to demonstrate the progress status of the publications concerned. The analysis revealed that the number of publications has continuously increased during the last five years. The text analysis showed that the author keywords “autonomous vehicles” and “mixed traffic” dominated the other author keywords because of their frequent occurrence. From thematic analysis, three research stages associated with AVs were identified; pre-development (1999–2017), development (2017–2020) and deployment (2021). The study highlighted the potential research areas, such as involvement of autonomous vehicles in transportation planning, interaction between autonomous vehicles and human driven vehicles, traffic and energy efficiencies associated with automated driving, penetration rates for autonomous vehicles in mixed traffic scenarios, and safe and efficient operation of autonomous vehicles in mixed traffic environment. Additionally, discussion on the three key aspects was conducted, including the impacts of AVs, their driving characteristics and strategies for their successful deployment in context of mixed traffic. This paper provides ample future directions to the people willing to work in this area of autonomous vehicles in mixed traffic conditions. The study also revealed current trends as well as potential future hotspots in the area of autonomous vehicles in mixed traffic.

1. Introduction

The Autonomous Vehicles (AVs), being one of the key developments of this era, are considered as a potential solution to future urban mobility, with several promised benefits regarding safety, operation and costs [1]. According to the National Highway Traffic Safety Administration (NHTSA), AVs are the vehicles which perform their operations without direct involvement of human drivers to control the steering, acceleration and braking. The concept of AVs started back in the 1920s and gained significant importance in the 1980s with the establishment of an automated highway [2], followed by the testing opportunity provided by the US Defense Advanced Research Projects Agency (DAPRA) challenge [3,4]. After the success of this challenge, many manufacturers started working on different aspects of AV technology. Many states in USA are currently working on AV concepts and trying to make this innovative technology available to general public in coming years [5]. Various sectors associated with industries and academics are conducting testing and simulation-based research on algorithms, sensors and in-vehicle technology [6,7].
The AVs with their sensing and navigating technologies are proving their potential in reducing the current externalities, especially the accidents and congestion. The findings from real-world testing and simulation studies have endorsed the potential of AVs in improving traffic conditions by reducing the overall road traffic [5,8], eliminating the need for parking spaces [9], improving throughput and stability [10], reducing the environmental impacts [11] and reducing delays [12]. In addition to the operational benefits, AVs are expected to improve the safety conditions as the introduction of AVs will limit the involvement of humans in the driving task [13,14]. The discrete nature of AVs will be able to eliminate human errors. The reported findings have shown great potential of AVs in solving mobility and safety-related issues, however, the actual impacts of this technology are still unknown and researchers, enterprises and policy makers are keen to know the future of these advanced vehicles [15,16]. Multiple studies involving every possible future scenario are working to provide a factual basis to the decision makers.
Various researchers have predicted the Market Penetration Rates (MPRs) for AVs [17,18]. The MPRs of AVs are estimated to be between 24% and 87% by 2045 [13]. Before the market penetration of AVs reaches 100%, AVs will share the road space with the Human-driven Vehicles (HVs). Most of the estimated benefits of Connected and Autonomous Vehicles (CAVs) are associated with the full market penetration, but there is a long way to reach 100% market penetration [19]. The anticipated benefits of AVs regarding reduced parking and traffic congestion, independent mobility, enhanced safety, energy efficiency and emissions’ reductions will only be realized in 2040 to 2060 when AVs become common and affordable [20]. During the transition period, the AVs will interact with the HVs. The complicated environment created by these vehicles of different degrees of autonomy is expected to affect the driving behavior patterns in traffic streams and fleets [21]. Keeping in view the MPR predictions and the expected behavior of AVs when simulated with HVs, various researchers are working on the mixed traffic conditions and are publishing the useful literature on this key topic of this era. Despite sufficient available literature on this topic, a comprehensive analysis of the various published papers from a global perception remains deficient. On that note, this study conducts a bibliometric analysis and provides a landscape of the published literature in the area of autonomous vehicles and mixed traffic conditions. This study extracted 374 documents from the Scopus database published during the time period 1999–2021.
The paper is organized in five sections. Section 1 discusses the background and objectives of this study. Section 2 discusses three key aspects pertaining to the deployment of AVs in mixed traffic. Section 3 presents the method adopted to screen, extract and analyze the publications on the concerned topic. In Section 4, the basic bibliometric results and citation metrics pertaining to most productive and dominant articles, authors, sources, countries and organizations are presented. Section 5 provides the insights into the thematic areas and research hotspots associated with the autonomous vehicles in mixed traffic conditions. In Section 6, the conclusions are presented based on reviewed studies.

2. Key Aspects of AVs and Mixed Traffic

The discussion on the review was made by considering three key aspects of the topic. Firstly, the possible impacts of AVs on mixed traffic are highlighted. Secondly, the driving behavior characteristics of AVs are presented. Thirdly, the efforts that the researchers have made to address various aspects of AVs in mixed traffic are presented.

2.1. Impacts of AVs on Mixed Traffic

Autonomous Vehicles (AVs) are growing and are considered as one of the potential solutions to current transportation problems. Various studies have endorsed their potential in improving traffic conditions by reducing the overall road traffic [5,8], eliminating the need of parking spaces [9], improving throughput and stability [10], reducing the environmental impacts [11], increasing travel speed and reducing delays [12] and reducing the number of conflicts [13]. However, the actual impacts of this technology are still unknown and researchers, enterprises and policy makers are keen to know the future of these advanced vehicles [15,16]. Multiple studies involving every possible scenario of the future are working to provide a factual basis for decision makers.
Almobayedh [22] employed a VISSIM model and showed that Connected and Autonomous Vehicles (CAVs) can significantly improve the performance of a signalized intersection by reducing queue delays by 12%, vehicle travel time by 17% and queue length by 22%. The study considered three scenarios involving conventional vehicles only, CAVs only and a mix of both. Tibljaš [12] considered four roundabouts in Croatia and employed a microsimulation model, VISSIM, with modified driving behavior parameters for conventional vehicles and AVs. The study explored the benefits in terms of traffic performance by introducing AVs and Connected Vehicles (CVs) in different proportion with the conventional vehicles. An increase in travel speed and decrease in average stop delay was observed with the increase in AVs. Zhang [23] proposed a control optimization technique for signalized intersection by considering a simple four-leg intersection setting. VISSIM was employed and the results for the control optimization technique and proposed technique were compared based on delays for each approach to the intersection. The findings showed that the delays were minimized with the proposed control technique. Working with control problems for Connected and Autonomous Vehicles (CAVs) at intersections, Sun [24] proposed a new intersection operation scheme to replace the conventional signal scheme. The proposed scheme utilizes tall of the lanes simultaneously along with dynamically optimizing the lane assignment and green durations. The numerical examples showed that the capacity of an intersection nearly doubles when proposed control scheme is implemented as compared to conventional schemes. However, the system assumed to reach these findings is a simple intersection setting. One short coming of this scheme is that it is only practical in the real world when a sufficient amount of CAVs are already in the traffic stream. It needs connectivity of vehicles and is not effective when only AVs are employed.
Extending the scope from an individual facility towards a network level, Talebpour and Mahmassani [10] investigated the effect of AVs on traffic stability and throughput. The study considered a simulation environment to evaluate different scenarios and employed available driver models at varying percentages of regular, connected and autonomous vehicles. The findings showed an increase in throughput with the increased penetration of connected and autonomous vehicles. To assess the network level impacts of AVs, a study conducted by Patella [11] reported the impacts on the environmental aspects as well as the traffic performance of the entire network of Rome, Italy through a simulation environment. The findings showed that a 100% AVs’ penetration rate reduces the environmental impacts at a mobility level by 60%. The network performances improved by 100%, AV penetration in terms of reduction in travel time by 33% and improved average network speed network by 51%, whereas the total distance travelled for highways increased by 8% and decreased for intra-urban roads by 5%. The study compared only two scenarios, having a current scenario or incorporating 100% AV penetration. However, the lower penetration rates of AVs were not considered and the interaction of AVs with human-driven vehicles was not considered in this study. To incorporate the lower level of penetration, Alfaseeh [25] conducted a study by considering the network in Toronto, Canada. The study found that incorporating higher percentages of CAVs improves the throughput, travel time, density and speed even with the highly congested conditions.
A lot of work has been conducted to investigate the impacts of AVs on highway sections. Rios-Torres and Malikopoulos [26] studied the operational impacts by considering the merging on-ramp section for the simulation settings. The results showed that the maximum benefits of CAVs’ introduction in terms of fuel consumption and travel time were obtained at a 100% penetration rate when a reduction of 16–60% and 40–67% were observed, respectively. The study considered only one on-ramp section and the interaction between the different vehicle types was explored for the merging case only. To study the interaction of AVs with conventional vehicles thoroughly, Papadoulis [14] employed VISSIM by using Application Programming Interface (API) to a motorway section of 44.27 km in England. The results showed that the proposed algorithm improved the traffic flow and reduced the estimated traffic conflicts by 90–94% at 100% MPR of CAVs. Maarafi [27] considered a real-world segment in USA along with a hypothetical section having entrances and exits. The study simulated AVs by employing a VISSIM model. The study found an increase in throughput by above 17% for the freeways with an MPR of 60% and higher. Another study by Aria [28] considered a segment of highway including a network of secondary urban roads in Germany and simulated CAVs by employing VISSIM. The study found that the average density improved by 8.09%, average travel speed enhanced relatively by 8.48% and average travel time improved by 9.00% in the 100% AV scenario. Motamedidehkordi [29] simulated a stretch of freeway and showed that with an increase in MPR of CAVs, congestion length and congestion area became smaller. In addition, the speed of the shockwave reduced.
In parallel to the operational benefits, AVs are equally beneficial in improving safety situations. Morando [13] studied the safety impacts of AVs and employed VISSIM to simulate a signalized intersection and roundabout. The findings showed that for a signalized intersection, the number of conflicts reduced from 20% to 65% with MPR between 50–100%. For the roundabout conditions, the number of conflicts reduced by 29% to 64% with the 100% AV. Khashayarfard and Nassiri [30] investigated the impacts of AVs on unsignalized intersections in Iran. The study showed a significant decrease in potential for accidents by up to 93% with the presence of 100% AVs. El-Hansali [31] showed a 12% reduction in the annual crash rate with the introduction of AVs. They also showed a reduction in conflict points and rear-end collisions. Considering hypothetical conditions, Mousavi [32] investigated the operational and safety impacts of AVs on an urban arterial with unsignalized driveway. The findings of this study showed that an increase in MPR of AVs affected an increase in density and speed, whereas lane changing and rear-end conflicts reduced. Postigo [33] simulated a motorway stretch in Germany and showed higher vehicle throughput and lower travel delays as the AVs evolved from cautious to more advanced (all-knowing) driving logics. A summary of the studies covering the impacts of AVs on traffic operation, safety and environment are shown in Table 1.

2.2. Driving Characteristics of AVs

The AVs are capable of sensing their environment and navigating by employing different sensors and technology without human input [43]. These advanced vehicles are expected to revolutionize the traffic environment by reducing the current externalities, especially accidents and congestion. Although AVs have the potential to improve the traffic conditions their full deployment will still take decades. Before the market penetration of AVs reaches 100%, these advanced vehicles will co-exist with the HVs. This transition phase of introducing a smaller proportion of AVs into the traffic stream of HVs will create a mixed traffic stream. Due to different driving logic for HVs and AVs, the driving behavior is expected to change with the introduction of AVs [10]. AVs obey certain programmed rules to monitor the traffic rules and roadway environment, based on sensing, planning and action phases, whereas the performance of HVs is highly dependent on the driver’s characteristics, specifically the perception and reaction time. Based on some simulation studies, certain aspects of AVs driving which can affect the performance of system are as follows:
  • During free-flow conditions, AVs keep their desired speed constant since they have a small speed range as compared to CVs. From a standstill position, AVs accelerate more smoothly than CVs [30];
  • AVs show shorter values and lower deviation in time headway, distance headway and reaction time as compared to CVs. In addition, AVs show lesser deviation in speed, a greater look-ahead distance and smaller path deviation [44];
  • Smaller standstill distance, smaller headway, strict desired speed and lesser variation in acceleration and deceleration are associated with the driving characteristics of AVs [45];
  • AVs follow the speed limits strictly which can result in less fuel consumption as compared to CVs [40];
  • AVs minimize the headway and required gap during lane changing maneuvers due to a smaller reaction time but it encourages fewer dangerous lane changes along with failure in recognizing the other vehicle’s intention to change a lane [46];
  • AVs follow a leading vehicle with a shorter headway than conventional vehicles. This shorter headway leads to increased vehicle throughput per lane [47];
  • AVs are expected to behave deterministically and will show smaller oscillations during following conditions [48];
  • AVs can dampen the shockwave propagation caused by the intensive behavior of leading vehicles, however, this will result in longer gaps between vehicles and consequently, decreases the capacity [49];
  • AVs can be fuel efficient as compared to CVs due to various driving mechanisms, such as reduced distance between two vehicles, acceleration and deceleration characteristics, longitudinal and lateral behavior and gap acceptance thresholds [50];
  • In a conservative environment, AVs do not effectively utilize the amber time which in turn results in lower traffic flow than conventional vehicles. AVs prefer to maintain acceleration/deceleration and speed limits, remain away from the dilemma zone and keep a clear distance from other vehicles [36];
  • AVs show less speed deviances than conventional vehicles, which results in stability and better system performance [10];
  • Cautious AVs improve the safety aspect by keeping longer time headways and distances, however, it affects the capacity and traffic performance [51];
  • AVs affect the drivers of conventional vehicles to keep shorter headways when following platoons of equipped vehicles maintaining shorter headways [28];
  • AVs equipped with higher automation levels tend to perform less lane changes to overtake slow moving vehicles which may increase the travel time [52].
Due to smaller values of time headways and standstill distances coupled with the smooth acceleration and deceleration characteristics of AVs, the simulation studies have proved the operational benefits. Although AVs have the potential to improve traffic safety and efficiency, there are still some challenges regarding uncertain human driving behavior which may significantly affect the stated benefits. The behavior of AVs in mixed traffic is still uncertain and people are working to provide data on the driving characteristics of AVs.

2.3. Efforts to Incorporate AVs in Mixed Traffic
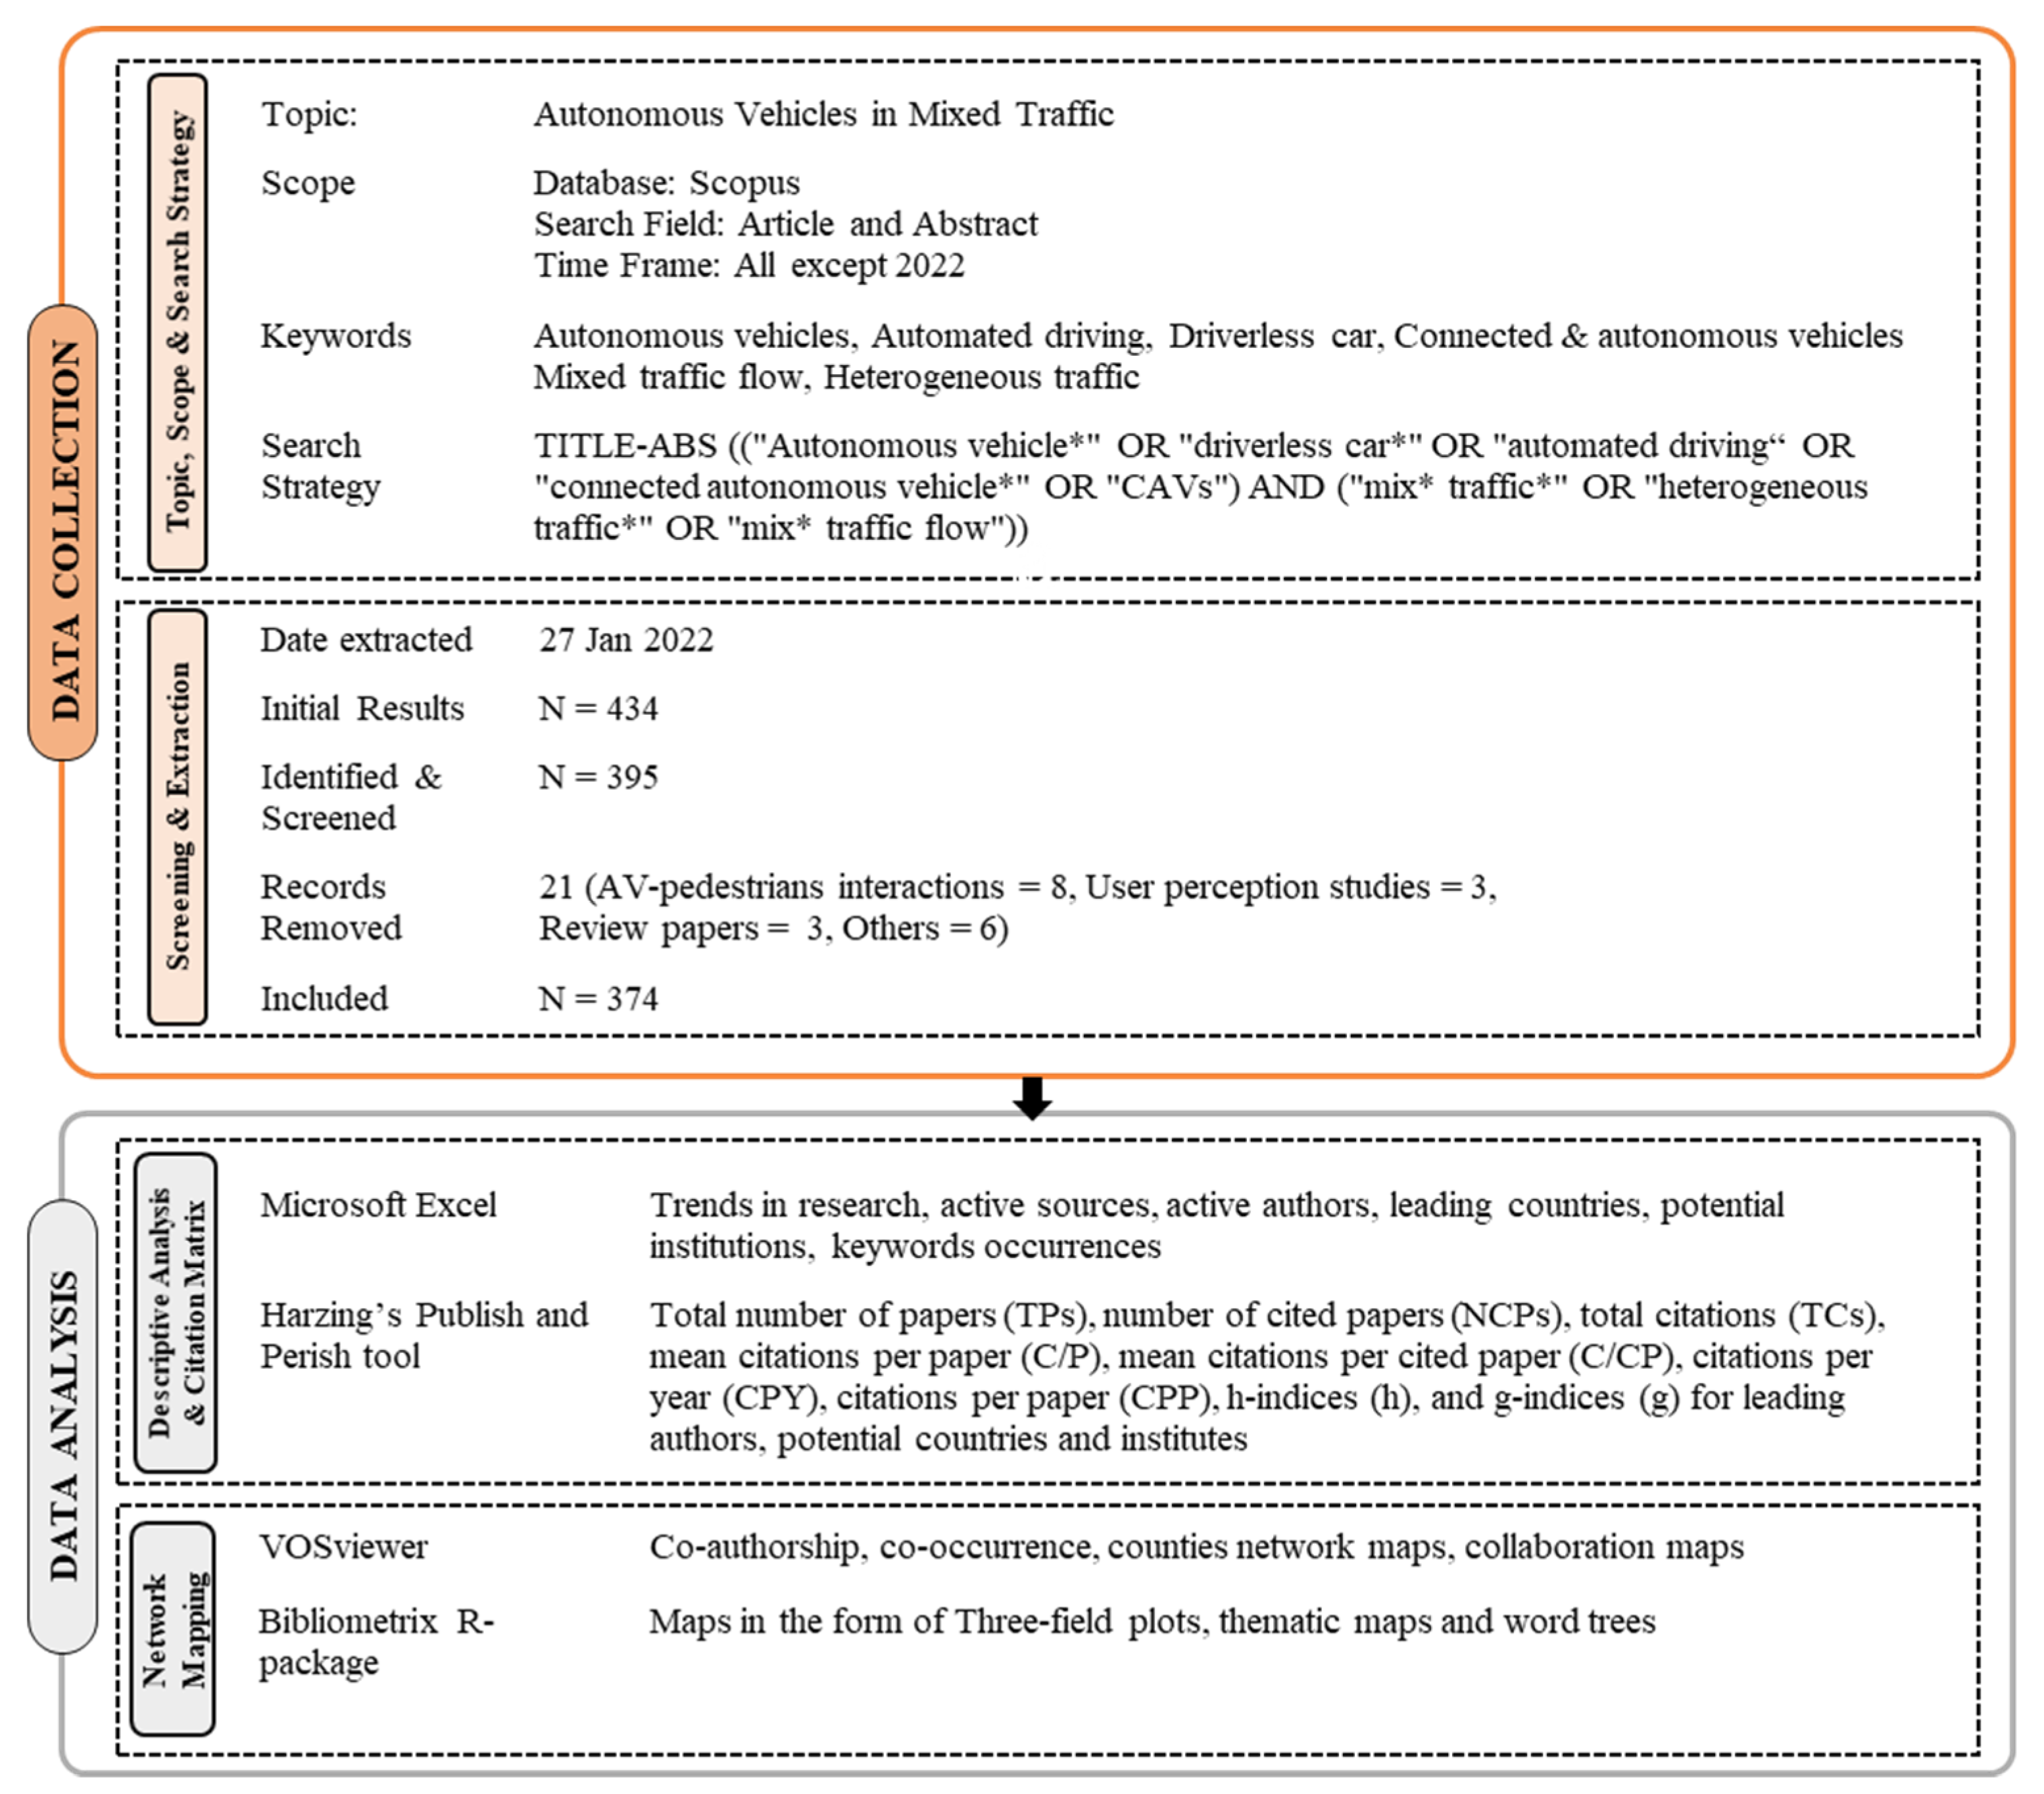
The transition period will take decades to reach 100% penetration of AVs. The researchers have been working on various aspects related to the penetration of AVs into a mixed traffic environment. Mahmassani [53] proposed a microsimulation framework to study the mixed traffic environment. The proposed framework highlighted that autonomous vehicles are more advantageous than the same share of connected vehicles in improving throughput and stability. The involvement of the human factor in the transition of the control process was incorporated in the extended simulation framework [54]. Various other studies employed simulation platforms to study different aspects of mixed traffic [32,55,56]. The simulation frameworks provided the basis to test various real-world scenarios in a virtual environment.
Several studies developed certain strategies and analytical models to cover different aspects of AVs in mixed traffic. A study proposed an analytical capacity model for mixed traffic, while considering the platooning features of CAVs [57]. Seraj [56] also incorporated the platooning features of CAVs while developing a car-following strategy for a mixed traffic environment. Qin and Wang [58] showed that the proposed optimal control method for CAVs can improve the rear-end collision risk. Another strategy minimized the energy consumption of mixed traffic at a junction while maximizing the throughput [55]. Lee [59] focused on a traffic management strategy for mixed traffic while considering different aggressiveness levels for AVs. In another study, the impacts of CAVs on traffic flow were examined by developing a two-state safe-speed model, and the numerical investigations and simulations showed an increase in capacity with increase in CAV penetration rate [60]. By considering the information flow from surrounding vehicles and the subsequent driver reaction, Jin [61] proposed a mixed traffic model from the perspective of cyber physical fusion. The study found that the stability of mixed traffic system depends on driver’s reaction delay, the penetration rate of CAVs and the information from multiple vehicles ahead that the CAVs can obtain. Mohajerpoor and Ramezani [62] developed an analytical model based on headway variability and studied the impacts of AVs on saturation flow rates. In car-following conditions, Fu [63] developed a human-like car-following model and studied the effect of cut-in vehicles on mixed traffic conditions along a real freeway. The study found that the developed model has a shorter response time and lower deceleration in cut-in situations. Another study incorporated trials from a real highway and developed a lane-change decision model for AVs. The proposed model improved the safety of AVs and the rear vehicle.
There have been several attempts to predict the trajectory of AVs in mixed traffic conditions. Ma [64] proposed a real time traffic prediction algorithm to predict the movement pattern and future trajectories of AVs in mixed traffic. Ghiasi [65] proposed a CAV-based trajectory-smoothing strategy. The proposed algorithm improved the fuel efficiency and reduced the environmental impacts. Another study used high resolution trajectory data to study the impacts of CAV-clustering strategy on mixed traffic flow [66]. Wang [67] used mobile sensing data acquired from CAVs to collect the trajectories of mixed traffic flow. In the same year, Sharath and Velaga [68] extended the classical Intelligent Driver Model (IDM) to enhance the longitudinal and lateral motion planning for a mixed-traffic environment. The study introduced eight new parameters to reflect the human-like responses. Using a roundabout as a case study, Debada [69] used the concepts of surrounding space and exploitation for the motion planning of CAVs in mixed traffic.
In addition to the mixed vehicle concept, some studies focused on providing exclusive lanes for AVs. Chen [70] developed a mathematical approach for the optimal deployment of AV lanes in a mixed traffic environment. The study employed a multi-class network equilibrium model and diffusion model to describe the flow distribution and to forecast the evolution of AVs market penetration, respectively. Both of these models helped to develop a time-dependent deployment model. The concept of dedicated CAV lanes was employed by [71]. The study employed simulations and investigated the impacts of dedicated CAV lanes on throughput by varying the demand levels and the CAV penetration rates. Another study used an improved cellular automata model to assess the influence of exclusive CAV lanes on freeway traffic flow [72]. The study found that setting up exclusive lanes improved the freeway traffic operations.

3. Data and Methods

This paper employed bibliometric analysis to fulfil the intended objective. Bibliometric analysis is a rigorous method which is conducted to visualize the current state of the art for a particular field. This statistical method collects, analyzes and extracts various metrics related to research productivity, institutional and individual authorship, publication journals, publications, keywords and more from published literature [73]. This method is not new, as the first use of this concept started in the 1950s [74]. In recent years, many researchers have employed this method to visualize the landscape of their research area [75,76,77]. The methodology adopted in this study consists of two major steps: (i) data collection, which involved selection of topic, formulation of search strategy, data screening and extraction and (ii) data analysis by using various tools. The key steps and associated sub-steps are shown in Figure 1.
In the first step, the keywords were identified based on the objective of this paper. For autonomous vehicles, various possible alternative keywords, such as “Autonomous vehicle*” OR “driverless car*” OR “automated driving” OR “connected autonomous vehicle*” OR “CAVs” were used. For mixed traffic conditions, the terms used were “mix* traffic*” OR “heterogeneous traffic*” OR “mix* traffic flow”. These keywords in the form of an appropriate search string were used in the Scopus database to extract data on the topic for the period of 1999 to 2021. The search was conducted on 27 January 2022 by using a validated search string. The Scopus database was chosen because of its comprehensive coverage of articles, publishing materials in more diverse research areas than the Web of Science could achieve [79]. The search was conducted by considering the title and abstract to provide extensive coverage on the topic.
In the second step, the validated string was used in the selected database and records were produced. The employed search string from the first stage to the final data extraction is shown in Table 2. The produced records in the first stage were refined, based on the identified document type and time frame. In the last step, the records were screened by reading the title and abstract of each document and some of the records were removed to produce the most relevant data. A total of 21 documents were excluded because of their focus on AV–pedestrian interaction (eight documents), user-perception studies (three documents), review studies (three documents) and others (six documents). The details of the excluded documents are given in Table 3. A careful scrutiny of all of these articles enabled the present researchers to focus on the autonomous vehicles in mixed traffic conditions, thus 374 papers were selected.
The third step involved application of analyzing and visualizing tools to produce citation metric records and network maps of bibliographic data exported from database. Various tools were deployed to obtain the desired outputs:
  • Microsoft Excel was used to create appropriate graphs showing the frequency and percentage of each publication;
  • Harzing’s Publish and Perish tool was used to compute the citations metrics;
  • VOSviewer was used to create and visualize the bibliometric networks;
  • The Bibliometrix R-package was used to create three field plots, thematic maps and word trees.
Furthermore, the information on total publications (TPs), number of cited papers (NCPs), total citations (TCs), mean citations per paper (C/P), mean citations per cited paper (C/CP), citations per year (CPY), h-indices (h) and g-indices (g) were extracted to extend the proposed bibliometric analyses

4. Current Publication Status on Autonomous Vehicles in Mixed Traffic Conditions

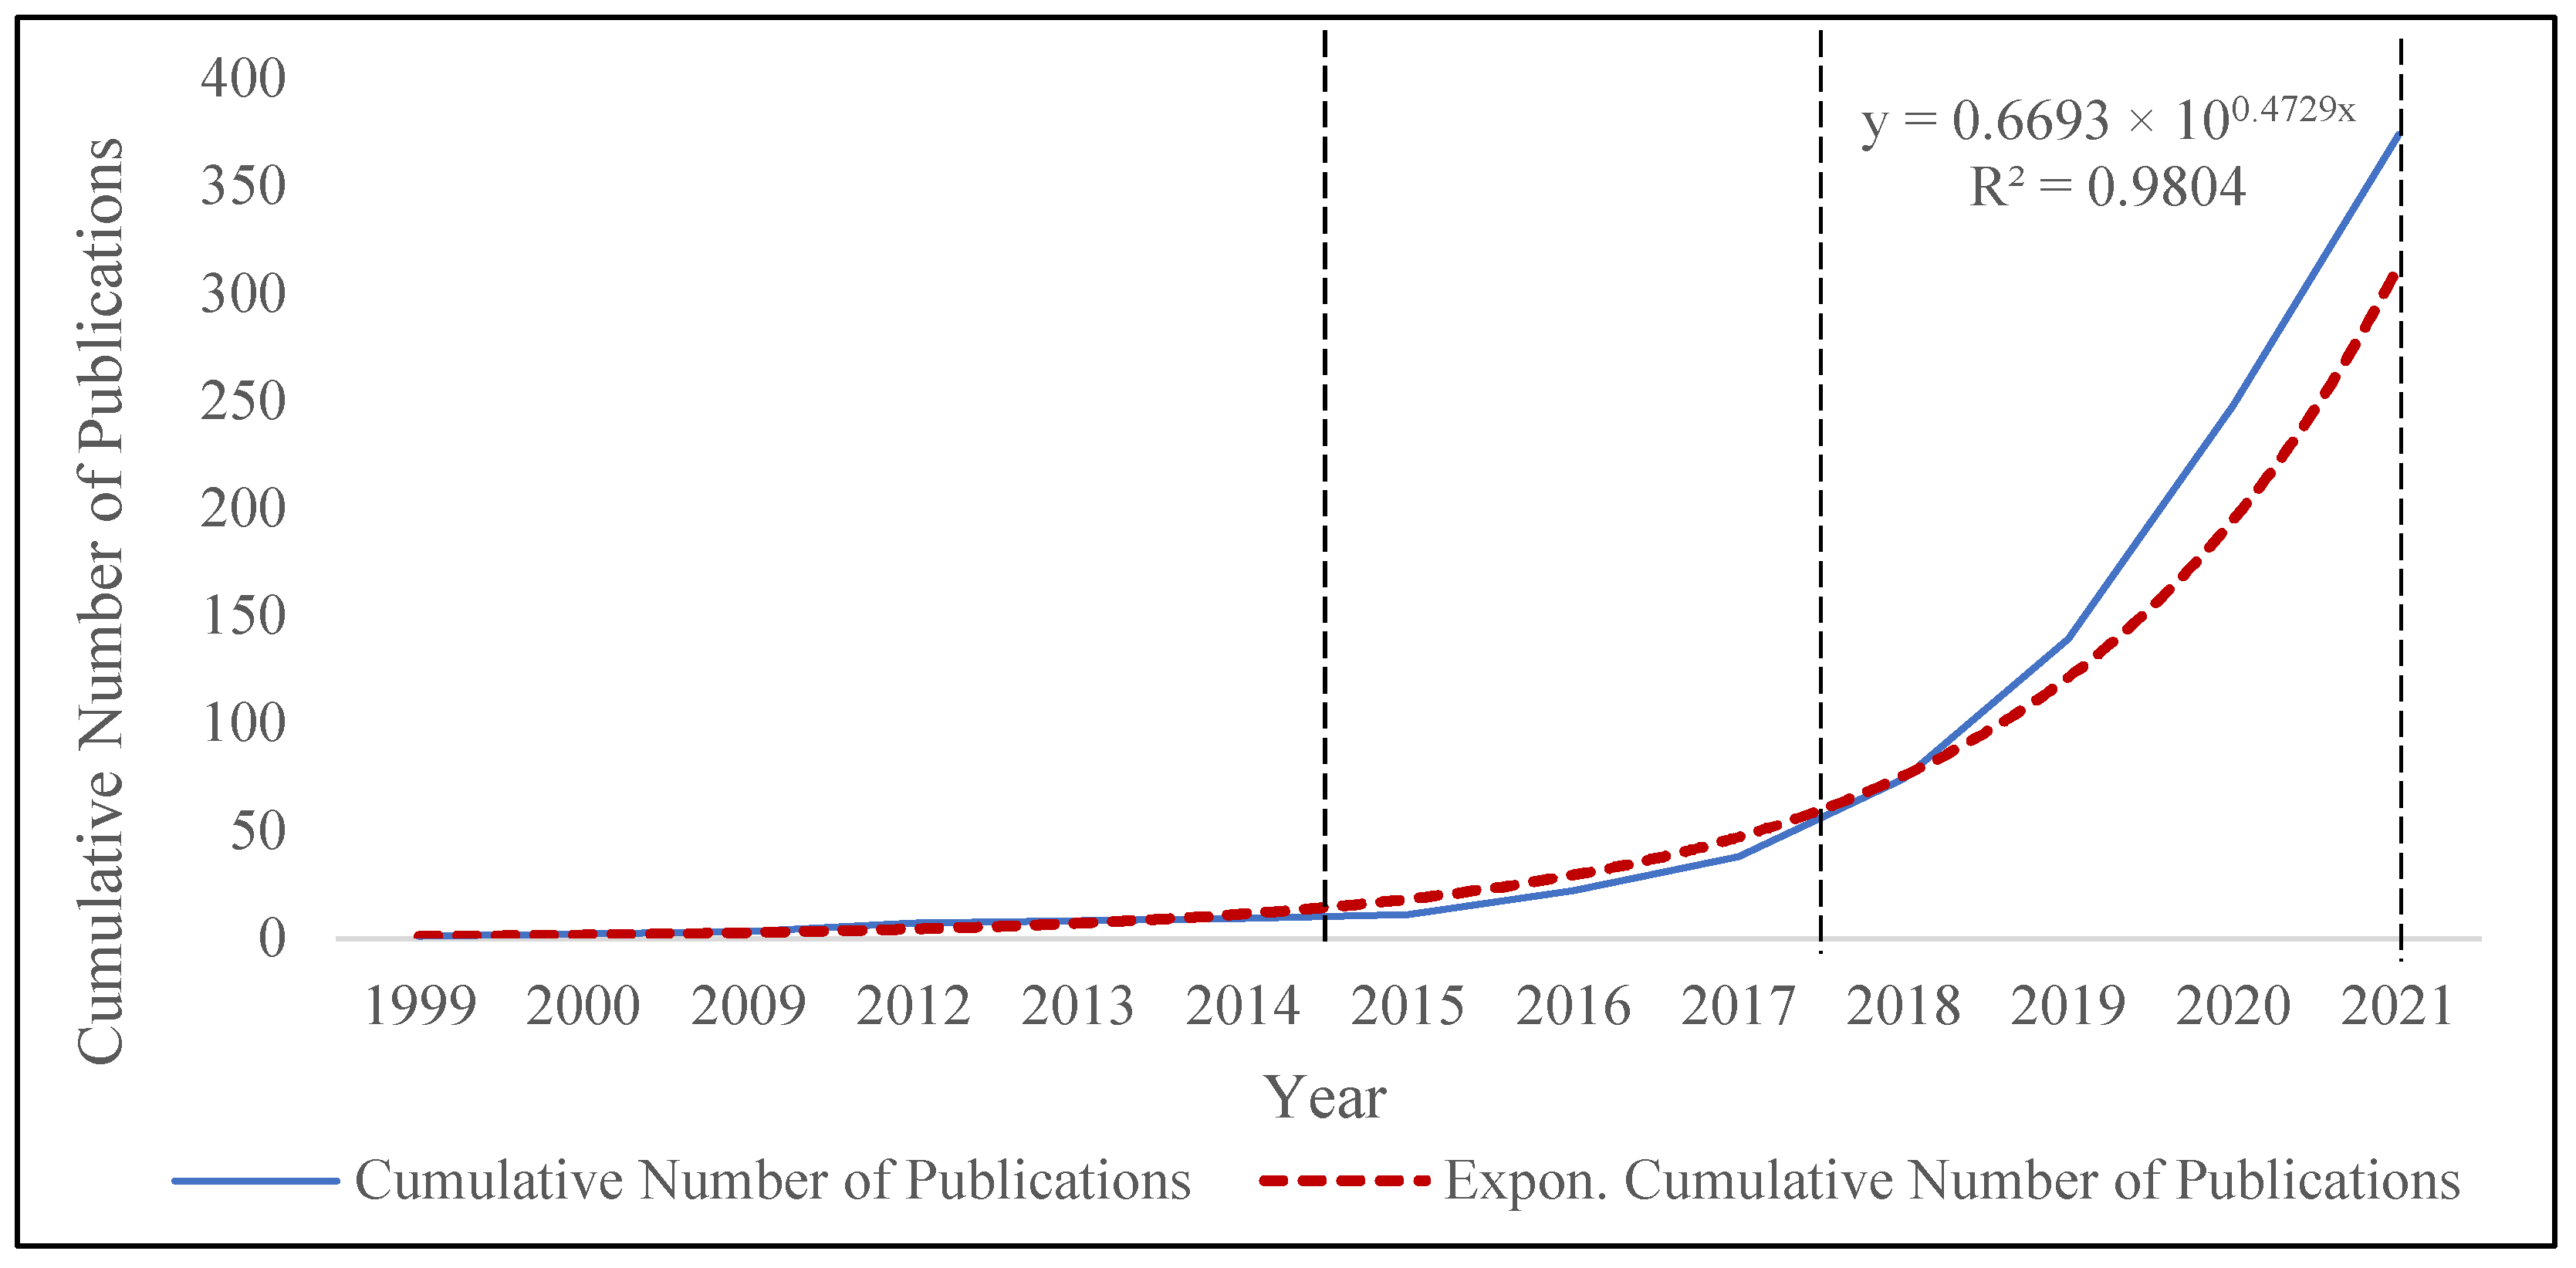
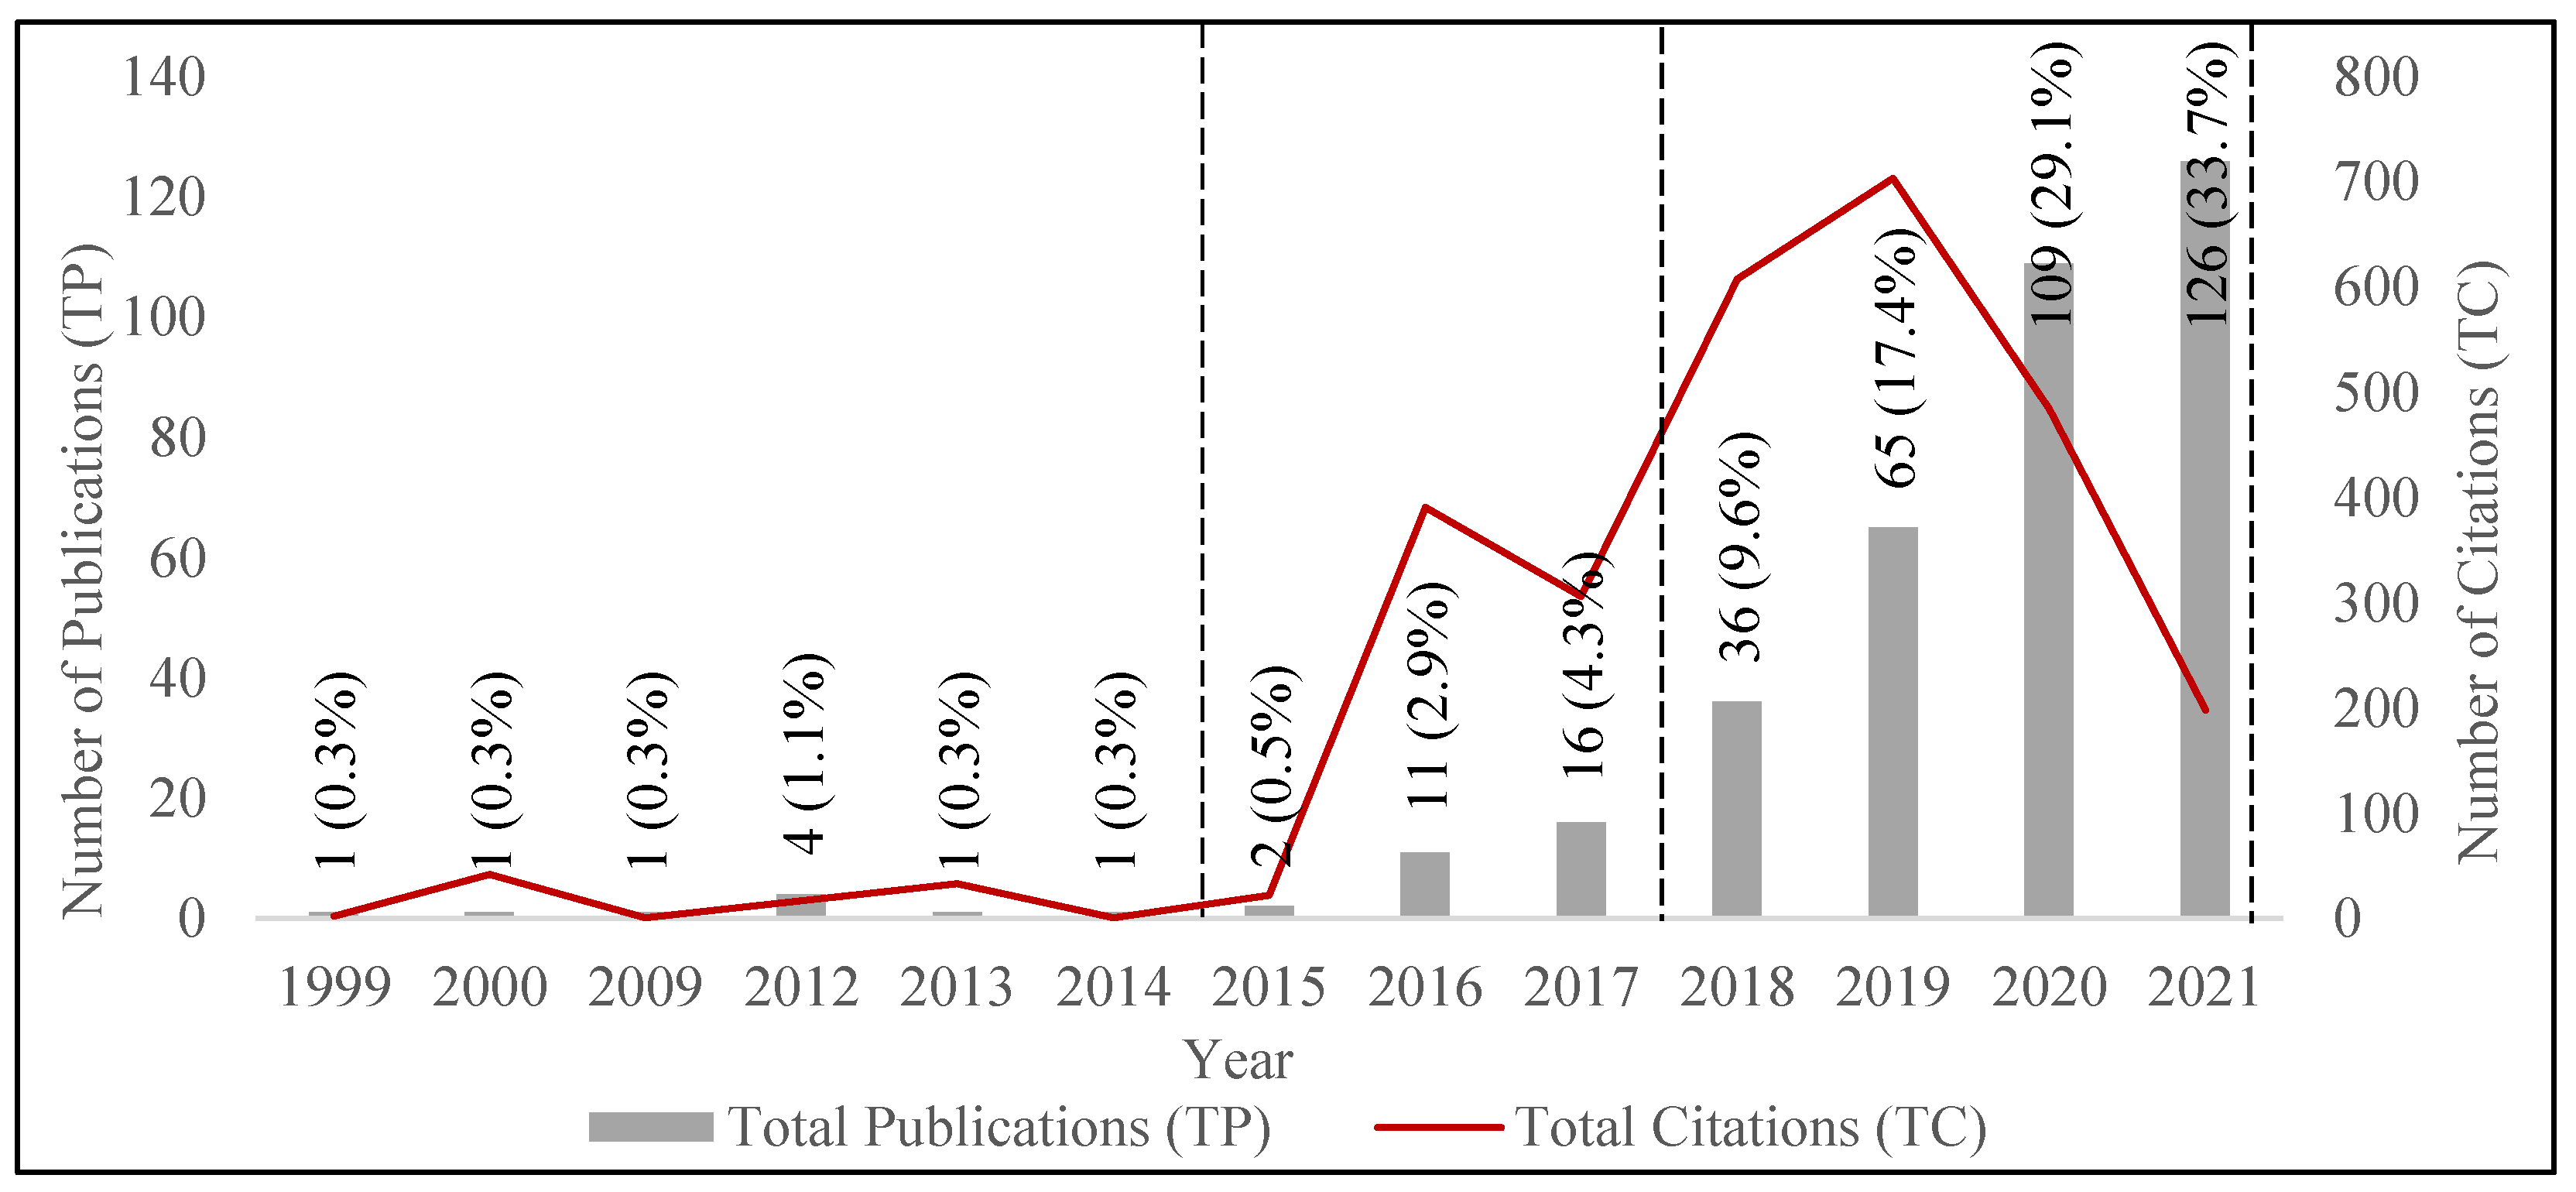
4.1. Annual Publications Trends

The publication trends assessed on the annual basis are helpful for researchers to understand the growth evolution on the cited topic [101,102]. Figure 2 shows the three different sections during the evolution of the research on the autonomous vehicles in mixed traffic. Until 2014, the pace of research was not significant even after the introduction of the automated highway system [103] and the DAPRA challenge [3,104]. Later, there was an increase in research on autonomous vehicles due to the start of real-world testing by using test beds [51]. The projects, UK Autodrive and CoEXist, started in 2014 and 2017, respectively, and initiated a new topic of research in this field of autonomous vehicles. The research in the area of mixed traffic started with a considerable pace after the availability of empirical data and evidence from field testing. However, the annual growth was not exponential. The evolution trajectory of the chart clearly revealed the rapid increase in the publications from 2018 until 2021. Such exponential rise can be attributed to the renewed research interests that were generated in this area of mixed traffic streams having both AVs and HVs. In addition, the publications’ development during 1999 to 2021 were clubbed into three domains, such as slow growth with only two average number of annual publications (1999–2014), steady growth with 10 average number of annual publications (2015–2017) and rapid growth with 84 average number of annual publications (2018–2021). The value of the regression coefficient is 0.9945 which indicates a best fit of the exponent function and predicts a positive growth trend in the proposed research area.
The distribution of annual published documents and the total citations received against the annual publications are illustrated in Figure 3 below. The tendency shown below is based on the 374 records extracted from the Scopus database during 1999–2021.
The discussion on autonomous vehicles is not new, the idea started back in the 1920s and gained significant importance in the 1980s with the establishment of the automated highway [2]. Although a lot of research has been conducted on autonomous vehicles in the last decade, a significant pace was only observed after 2017. Around 90% of the documents discussing autonomous vehicles in mixed traffic were published during the period 2018–2021. The first paper on this topic was published in 1999 which discussed the speed control techniques of automated heavy vehicles in a mixed traffic environment [105]. The highest number of articles were published in 2021, with a total of 126 which was around 16% higher than the total published documents in 2020.
A noticeable increase in the number of publications was observed after 2017. However, the total citations graph line showed a decline after 2019. It is certain that this decline is not due to lack of interest as endorsed by the significant increase in total publications, rather the decline is associated with the documents that are in a queue for publication. It is expected that the total citations for the documents published in 2020 and 2021 will also witness an increase in the coming year.
Table 4 enlists the citation matrix per year based on the retrieved documents. The highest citations to date were observed for the documents published in 2019, with 704 total citations. However, the total citations for recent years are expected to increase in the coming years since most of the documents citing them are not yet published.

4.2. Citation Analysis of Most Dominant Articles

This section explains the most cited documents in the research area of autonomous vehicles in mixed traffic conditions. A total of 374 documents were retrieved from the Scopus database having both journal articles (59.1%) and conference papers (40.9%). The network visualization map based on the highest number of total citations is illustrated in Figure 4 below. The size of the node denotes the impact of a document based on the total citations. The co-occurrence between the documents is presented by the line between two nodes. The strength of co-occurrence between documents is specified by the thickness of the lines.
Out of 374 documents, the 10 most cited documents are presented in Table 5. All of these highly cited documents were published during 2016–2019. This shows that the most productive work on this research area has been executed in the recent years. The impact of a published paper is assessed based on the Total Citations (TC) and Citations per Year (CPY). In terms of total citations, the highest total citations of 162 were received by Mahmassani [10], with 27 citations per year. Another document by Y. Ma et al. [64] received the highest citations per year of 32.33 among these most cited documents, with 97 total citations.

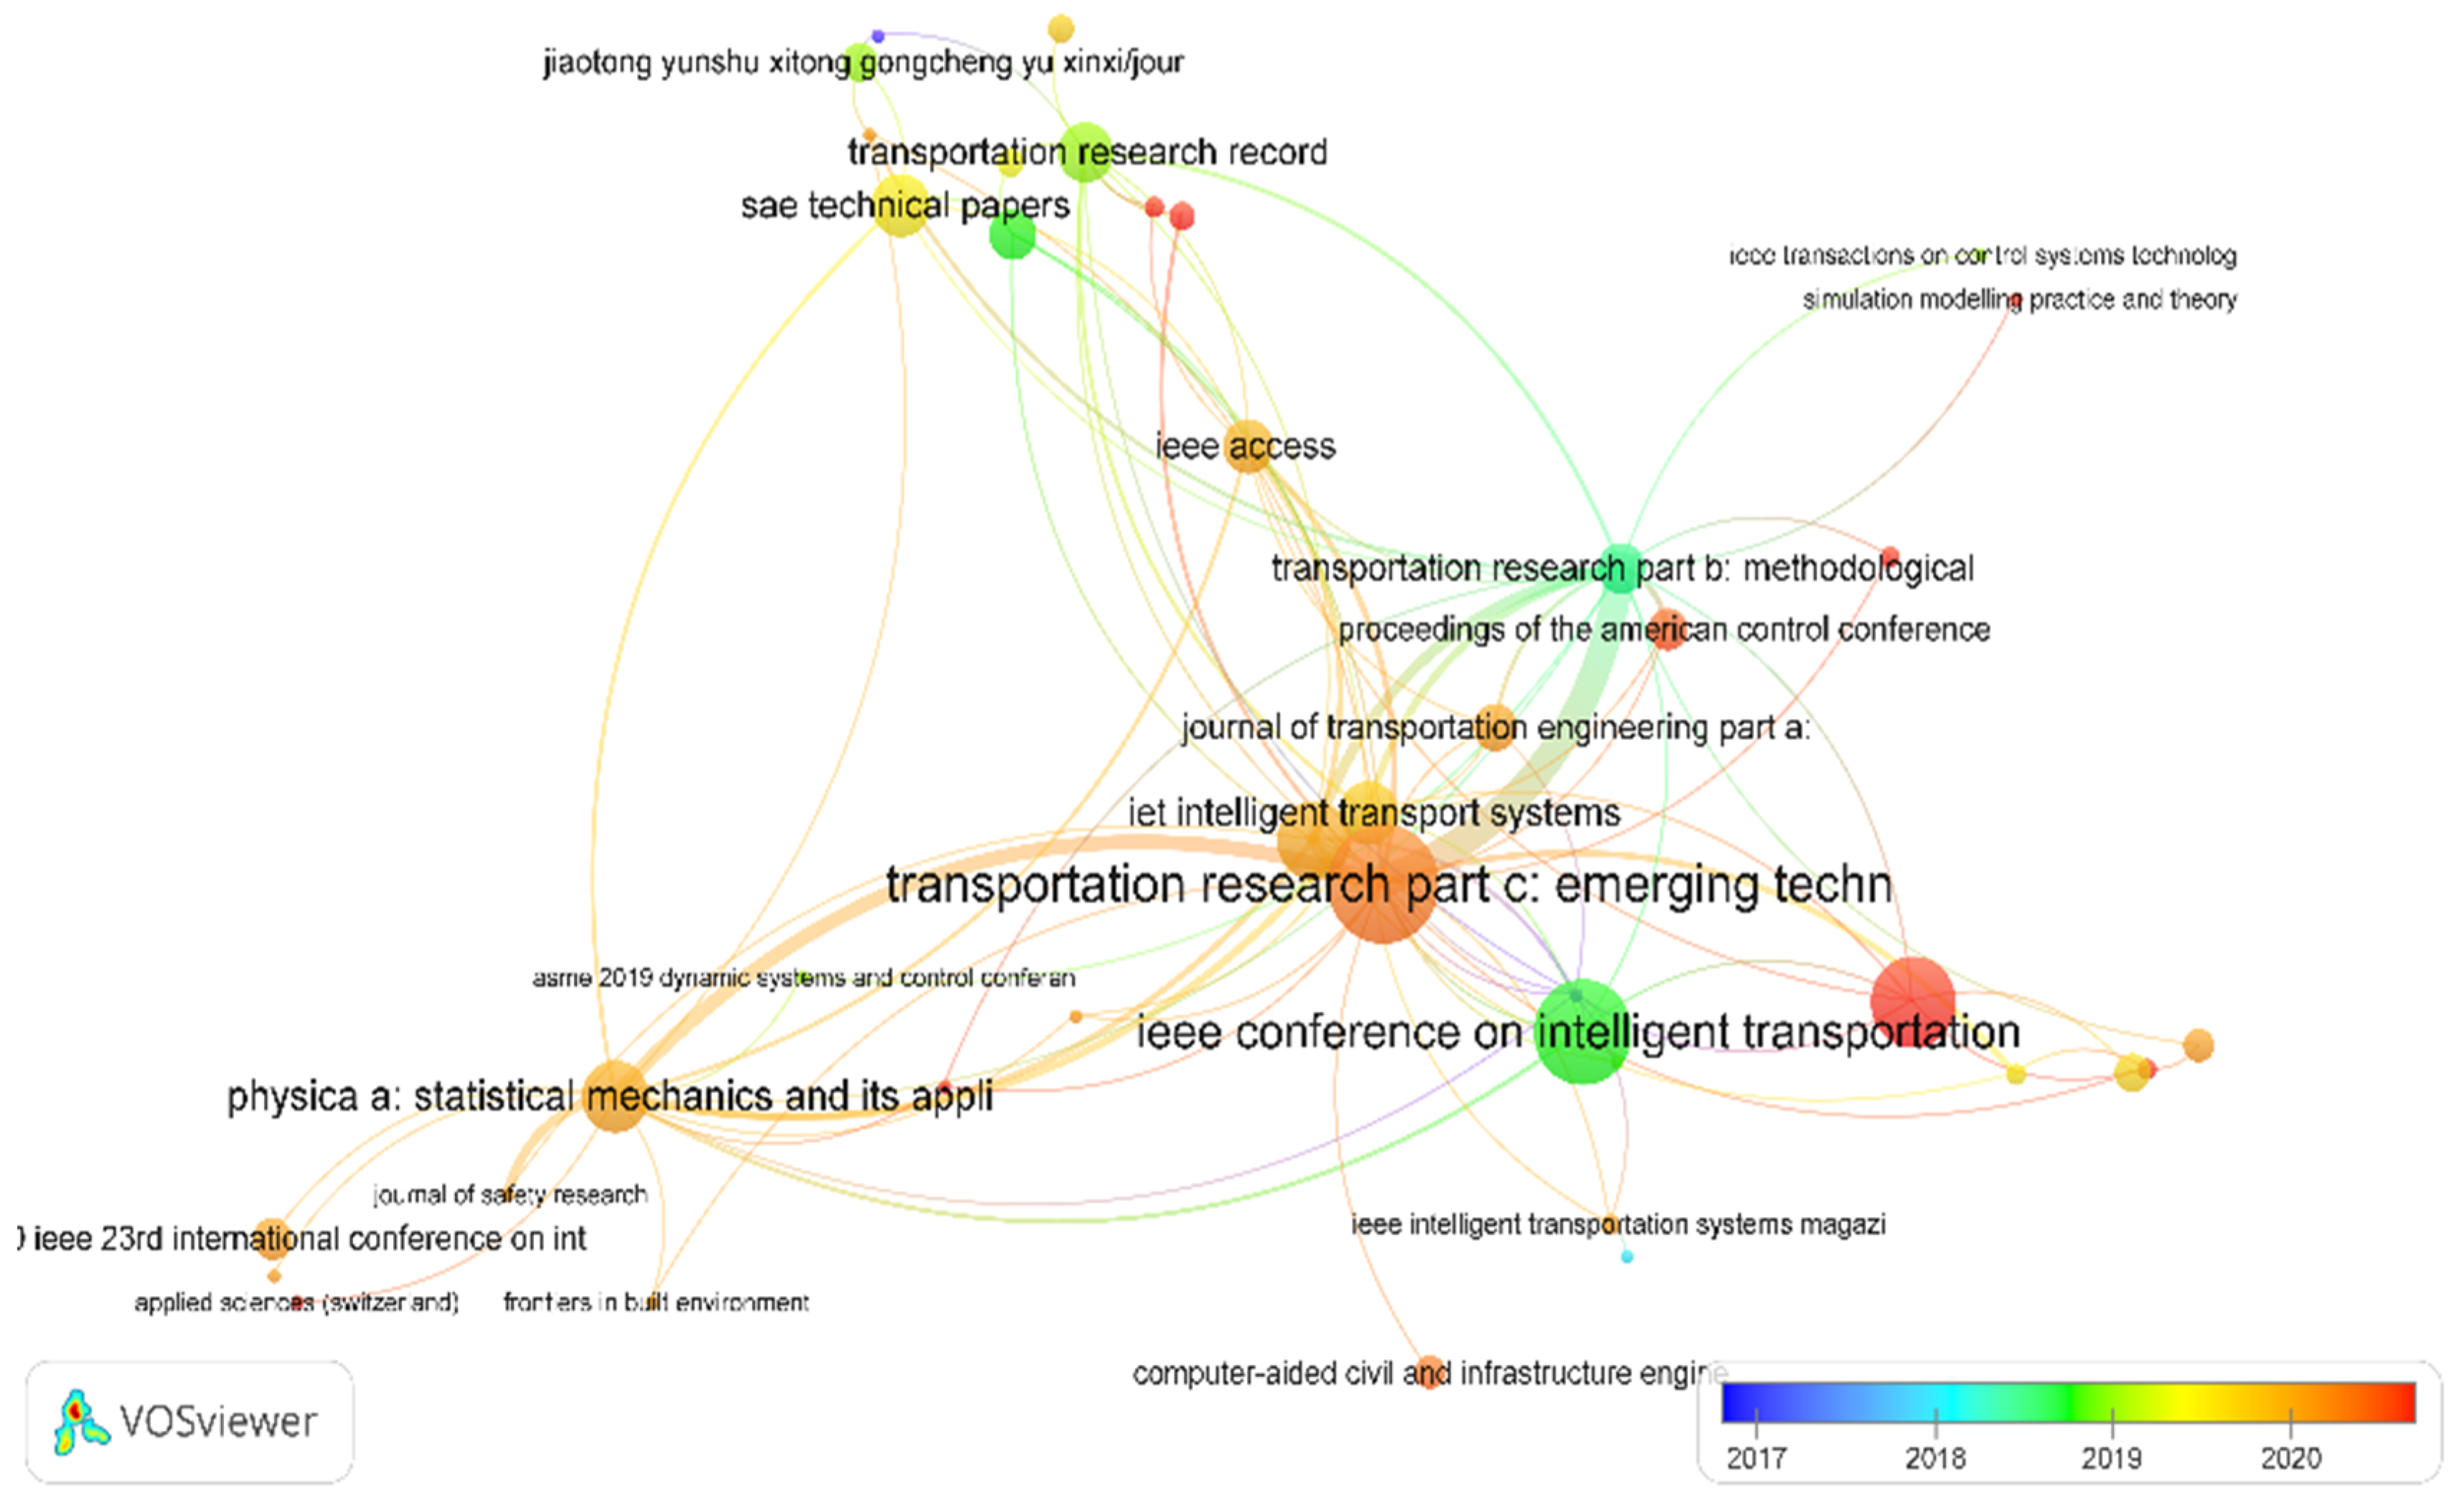
4.3. Citation Analysis of Most Productive Sources

This section highlights the potential journals which are publishing considerable documents on autonomous vehicles in mixed traffic conditions. Table 6 provides the names of the leading sources with a minimum of eight publications in the research area of concern along with other useful information including total publications (TP), total citations (TC) and the name of the publisher. In the context of TC, Transportation Research Part C Emerging Technologies was the most productive source with 31 publications followed by IEEE Conference on Intelligent Transportation Systems Proceedings (ITSC) with 25 published documents. The other notable aspect is total citations received by each of the sources based on their published documents. Although the aforementioned sources produced higher number of documents, the sources Transportation Research Part B: Methodological and Physica A: Statistical Mechanics and its Applications are also notable with total citations of 331 and 306, respectively.
The citation analysis of the potential sources was conducted by using VOSviewer. For visualization, minimum number of documents was set at one and the total citations were set at two. Only 80 sources out of 150 met the criteria. Out of 80 sources, 40 showed a citation relationship with other sources in terms of the link strength as specified by the thickness of connecting lines. The clustering technique in VOSviewer gathers the potential sources having a citation relationship with other sources into one cluster [110]. Only 40 sources having some citation relationship with other sources were included in the network, which were further grouped into 11 clusters as shown in Figure 5 below. All of the sources within one cluster have a citation relationship with other sources within that cluster. Cluster-1 and 2 consist of six sources, cluster-3, 4 and 5 consist of five sources, cluster-6 consists of four sources, cluster-7 and 8 consists of three and two sources, respectively, and cluster-9, 10 and 11 consist of one source each. It is shown that the potential source Transportation Research Part C: Emerging Technologies contributed the highest share, followed by IEEE Conference on Intelligent Transportation Systems Proceedings (ITSC) during the recent years.

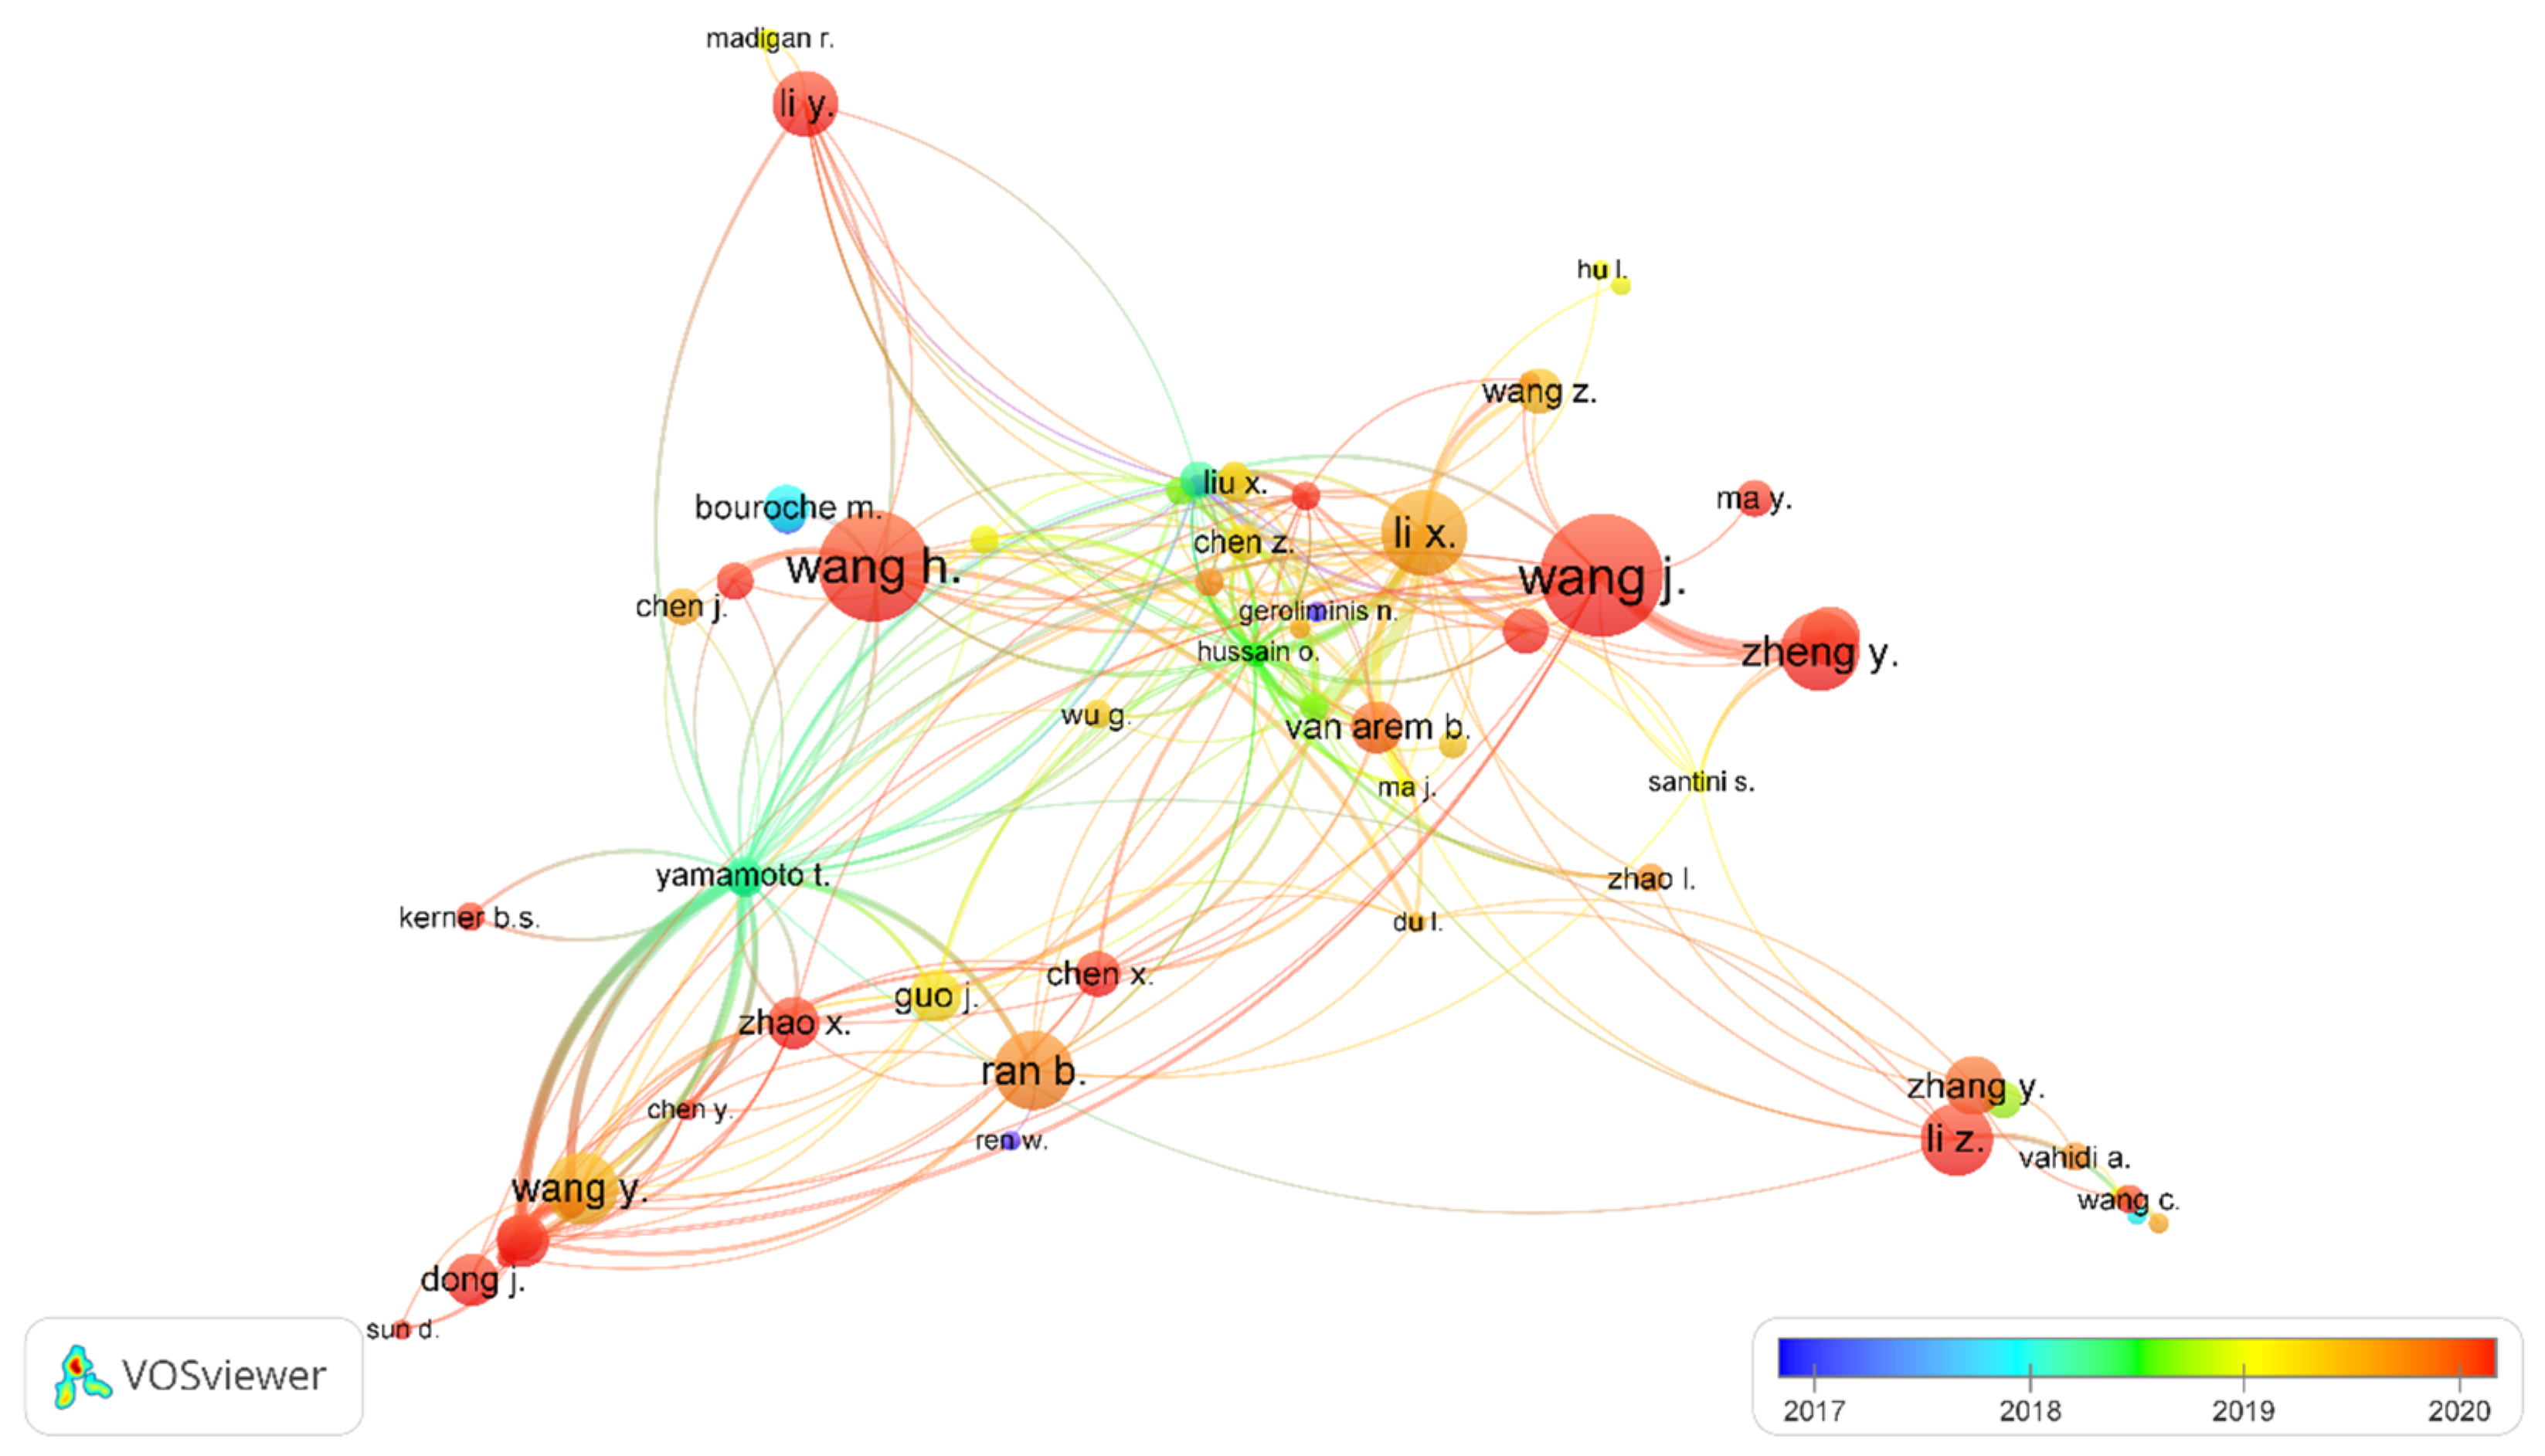
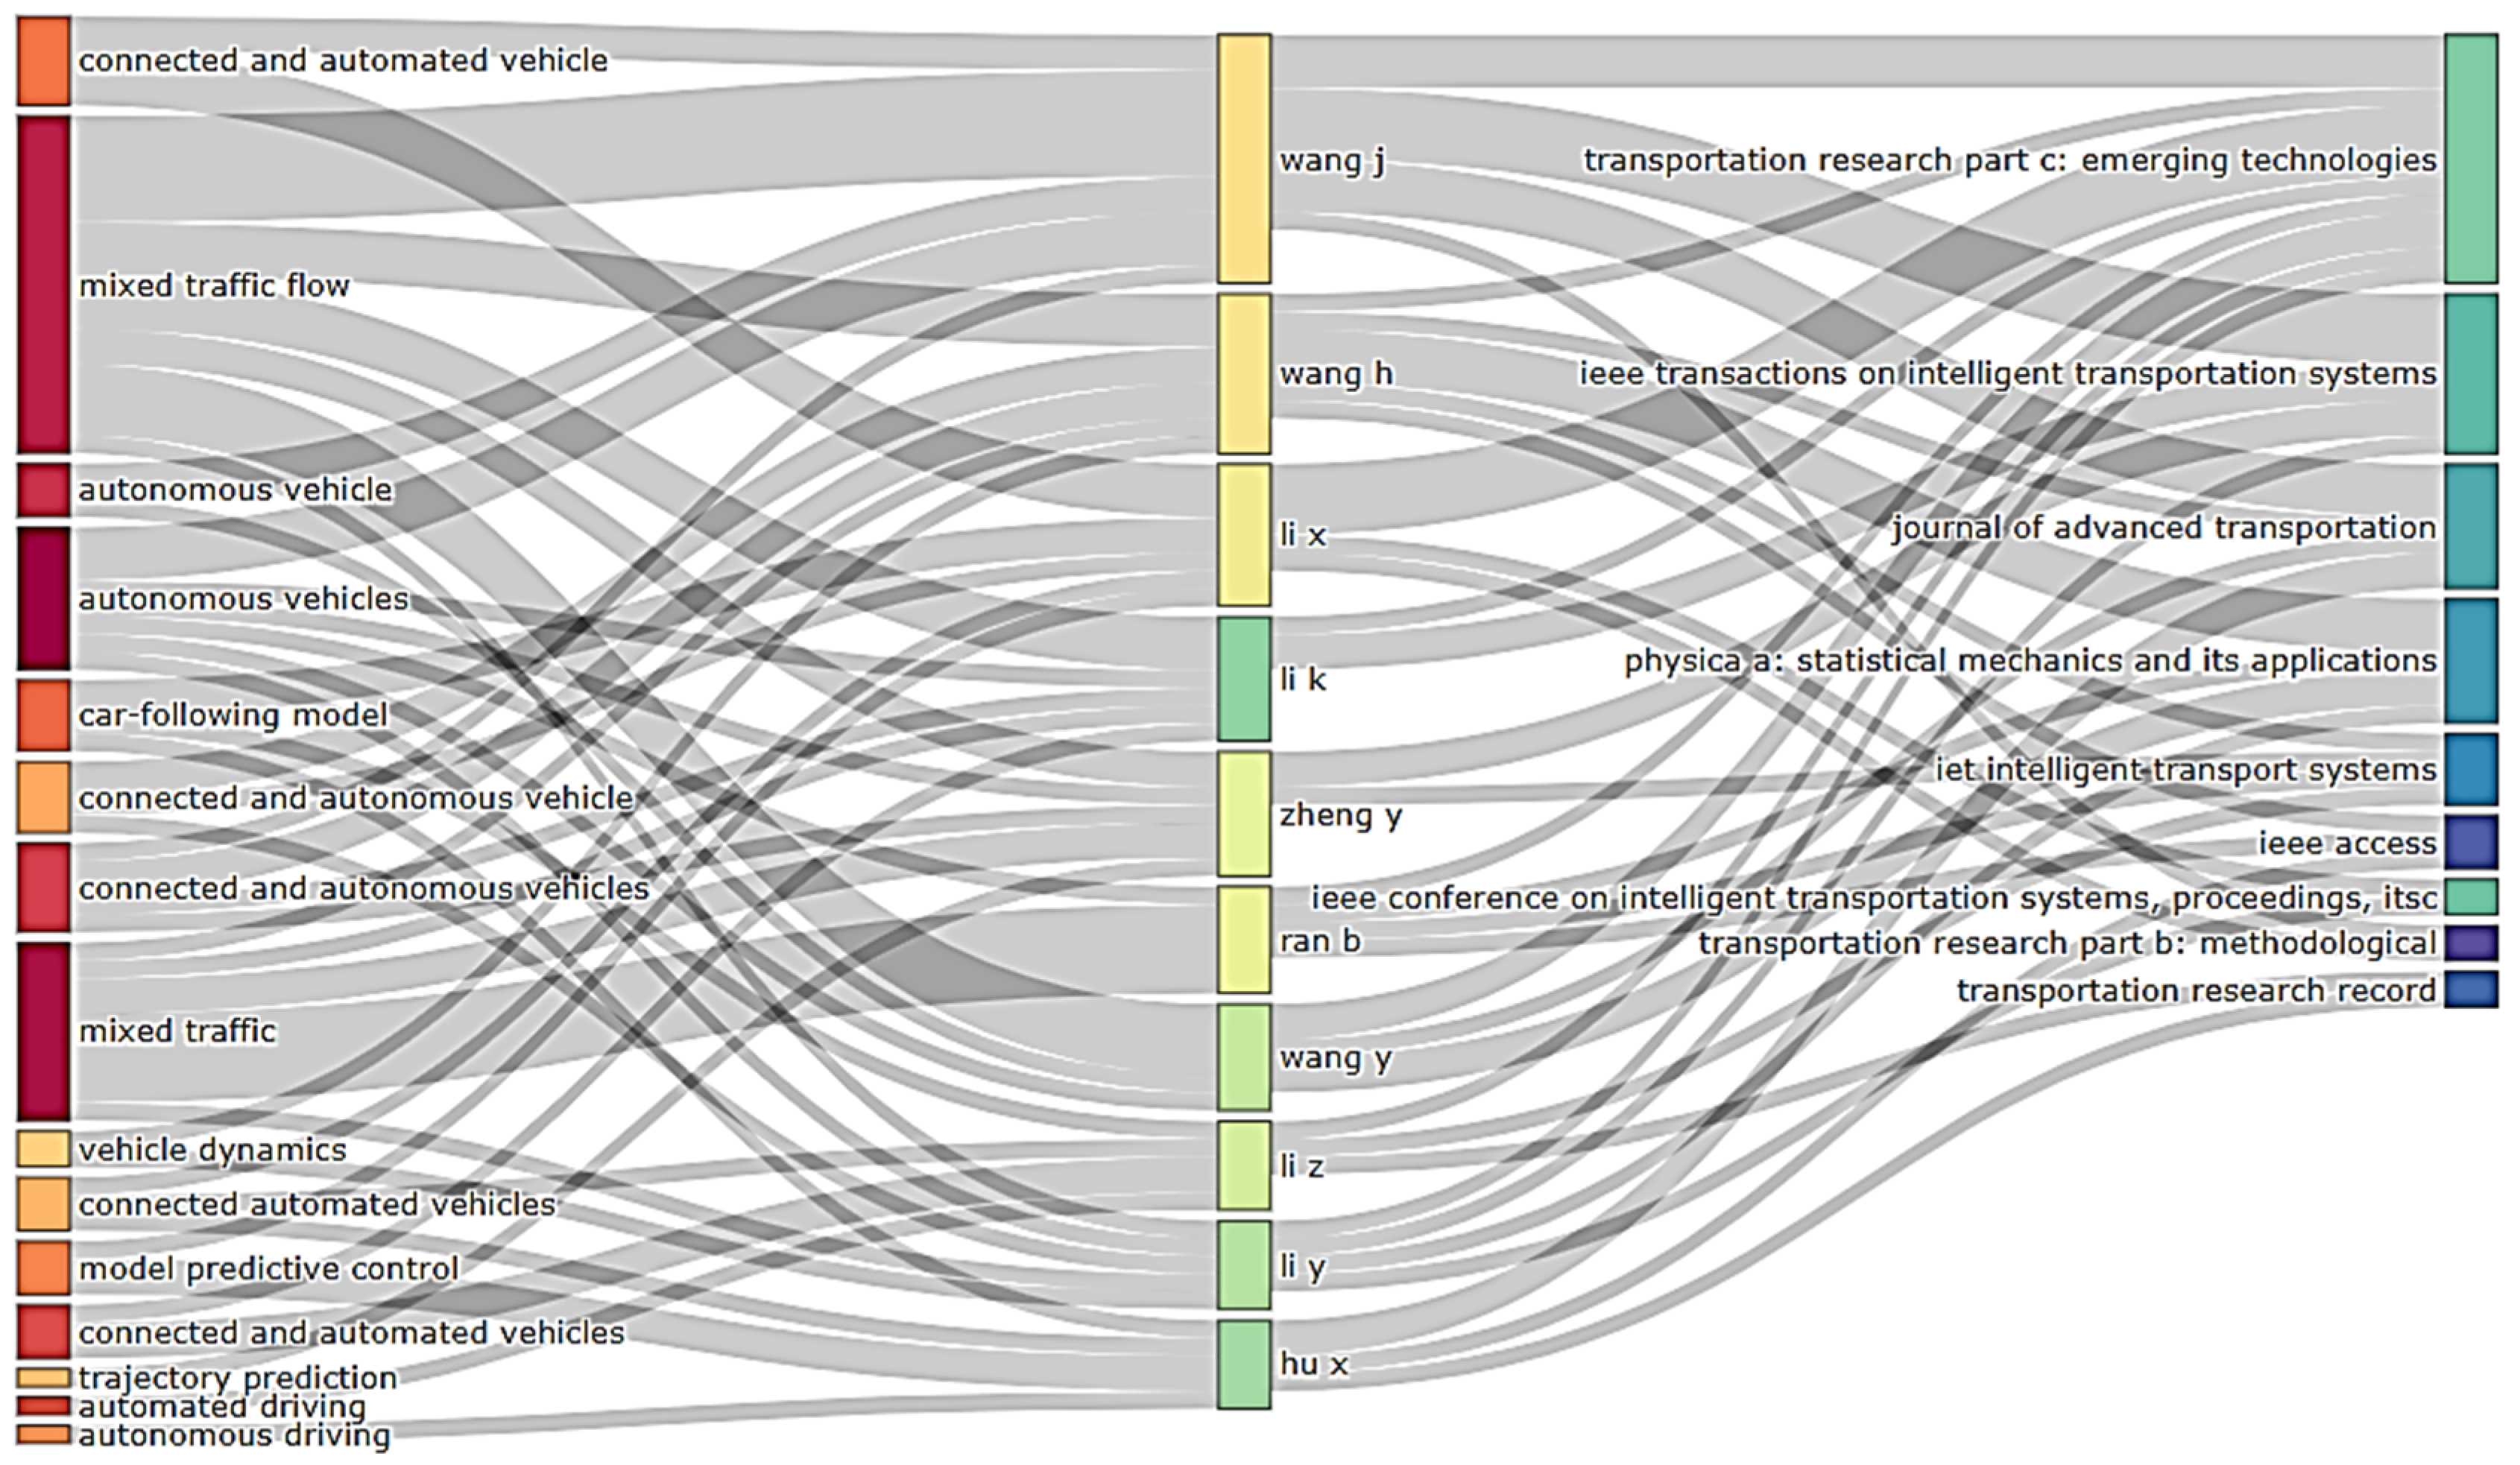
4.4. Citation Analysis of Most Prolific Authors

The productivity of authors in terms of their total publications over time and their impact on the research area of concern was analyzed by using the visual network maps constructed in VOSviewer. In VOSviewer, the network map was produced by defining criteria. The authors with two publications and 20 citations were analyzed through visual network maps. The criteria were chosen to obtain the most productive authors working on the concerned research area. Out of a total of 966 total authors, only 69 met the threshold. The most extensive set of related authors consisted of 63 items which were further grouped into nine clusters. The authors having a citation relationship between them were placed in one cluster. The network visualization of nine clusters with different colors is shown in Figure 6.
The names, affiliations, citation matrix and the most cited paper of the potential authors in the research area of autonomous vehicles in mixed traffic are shown in Table 7 below. Based on the minimum of five publications’ criteria, the 12 most productive authors were selected. Out of the 12 authors, seven have their affiliations with institutions in China. Three authors were affiliated to the United States, and Ireland and Netherlands were affiliated with one author each. Ran, B. and Wang, H. were the most productive authors each, with a total of nine publications and both are affiliated to the Southeast University, China. Li, X. received the highest total citations of 252 for 5 published documents with a highest value of 50.40 for citations per cited document among the selected authors. The author is affiliated to the University of South Florida and received a maximum of 115 citations for a single document.

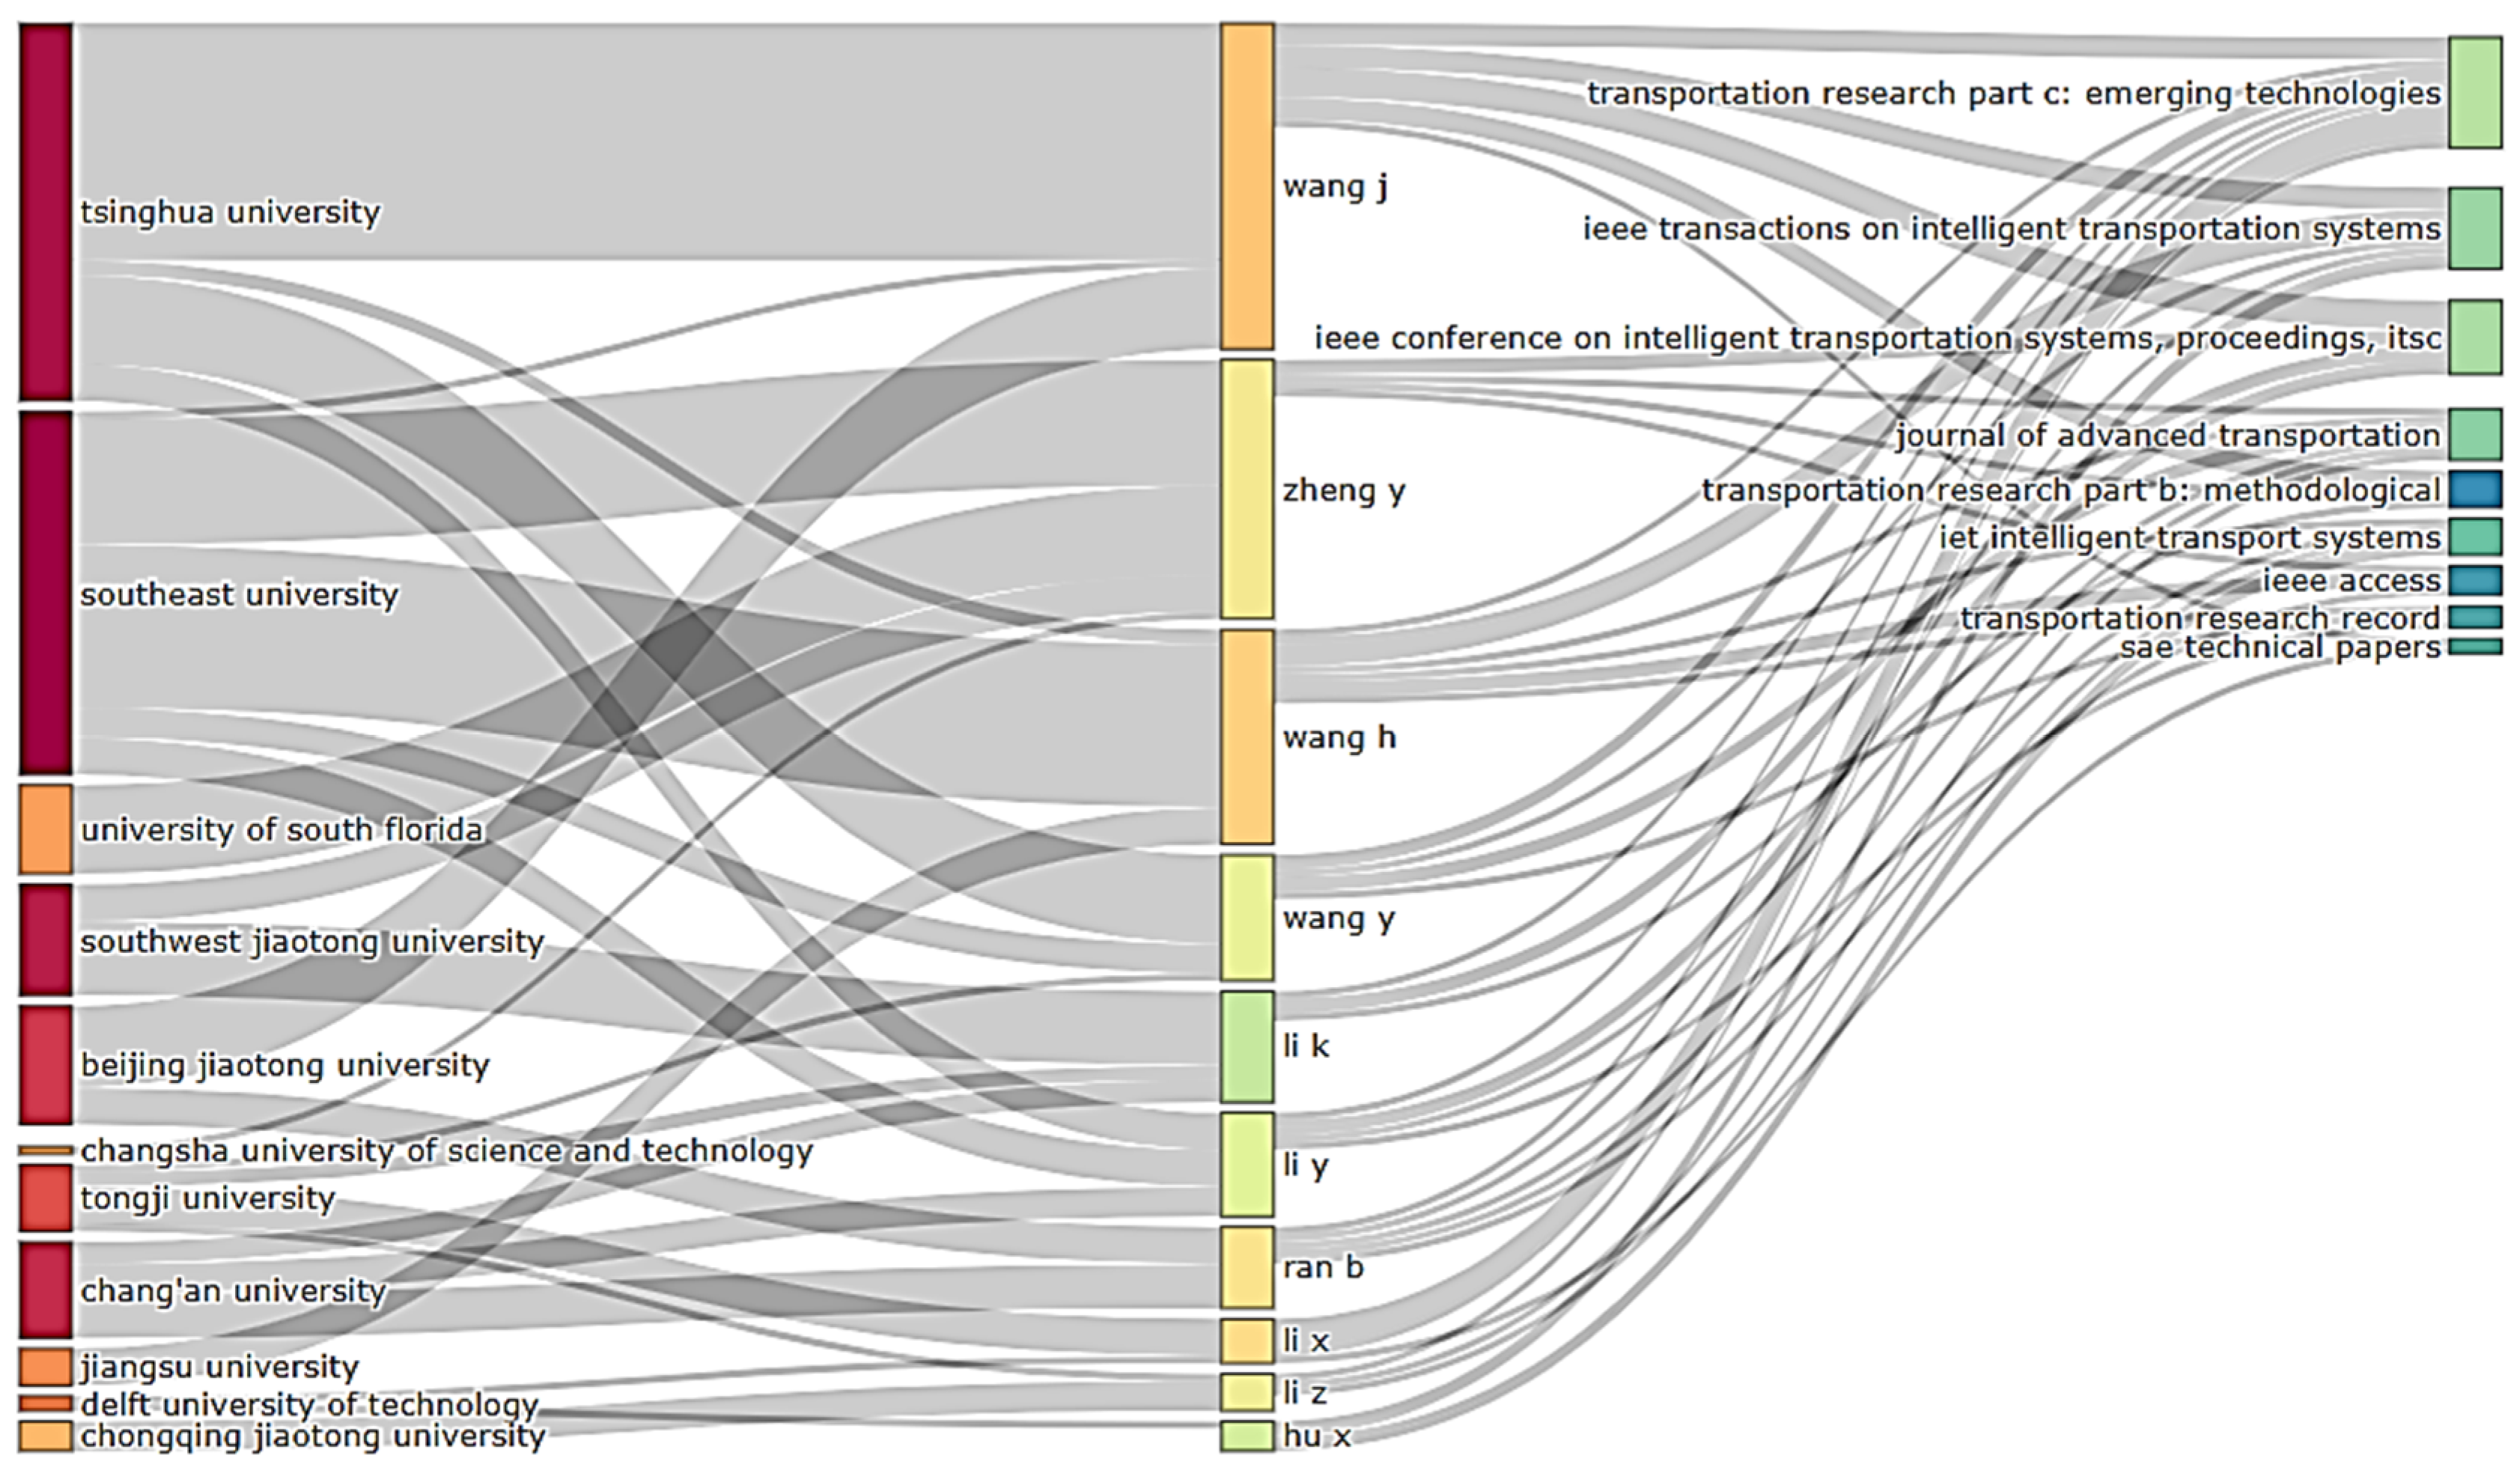
4.5. Citation Analysis of the Leading Organizations

Table 8 below shows the top 10 most prominent organizations in the world organized based on the total publications. Out of the ranked organizations, 70% belong to China and the remaining three are affiliated with the United States. The top three organizations which are working actively on autonomous vehicles are from China and hold a total of 64 publications in the area of autonomous vehicles in mixed traffic. The University of Wisconsin–Madison from the United States is ranked fourth with a total of 17 publications. Another aspect to be considered was total citations. Although the organizations at the top positions hold higher numbers of total publications, the organizations ranked at 9 and 10 hold the most notable total citations of 149 and 137, respectively. The most cited papers (MCP) and the total citations of the most cited papers from each of the leading organizations are also shown in the Table 8. The most cited paper received 85 citations and the authors of this paper are affiliated with Tsinghua University, China [70]. Another document with the same number of total citations was written by authors from Zhejiang University, China

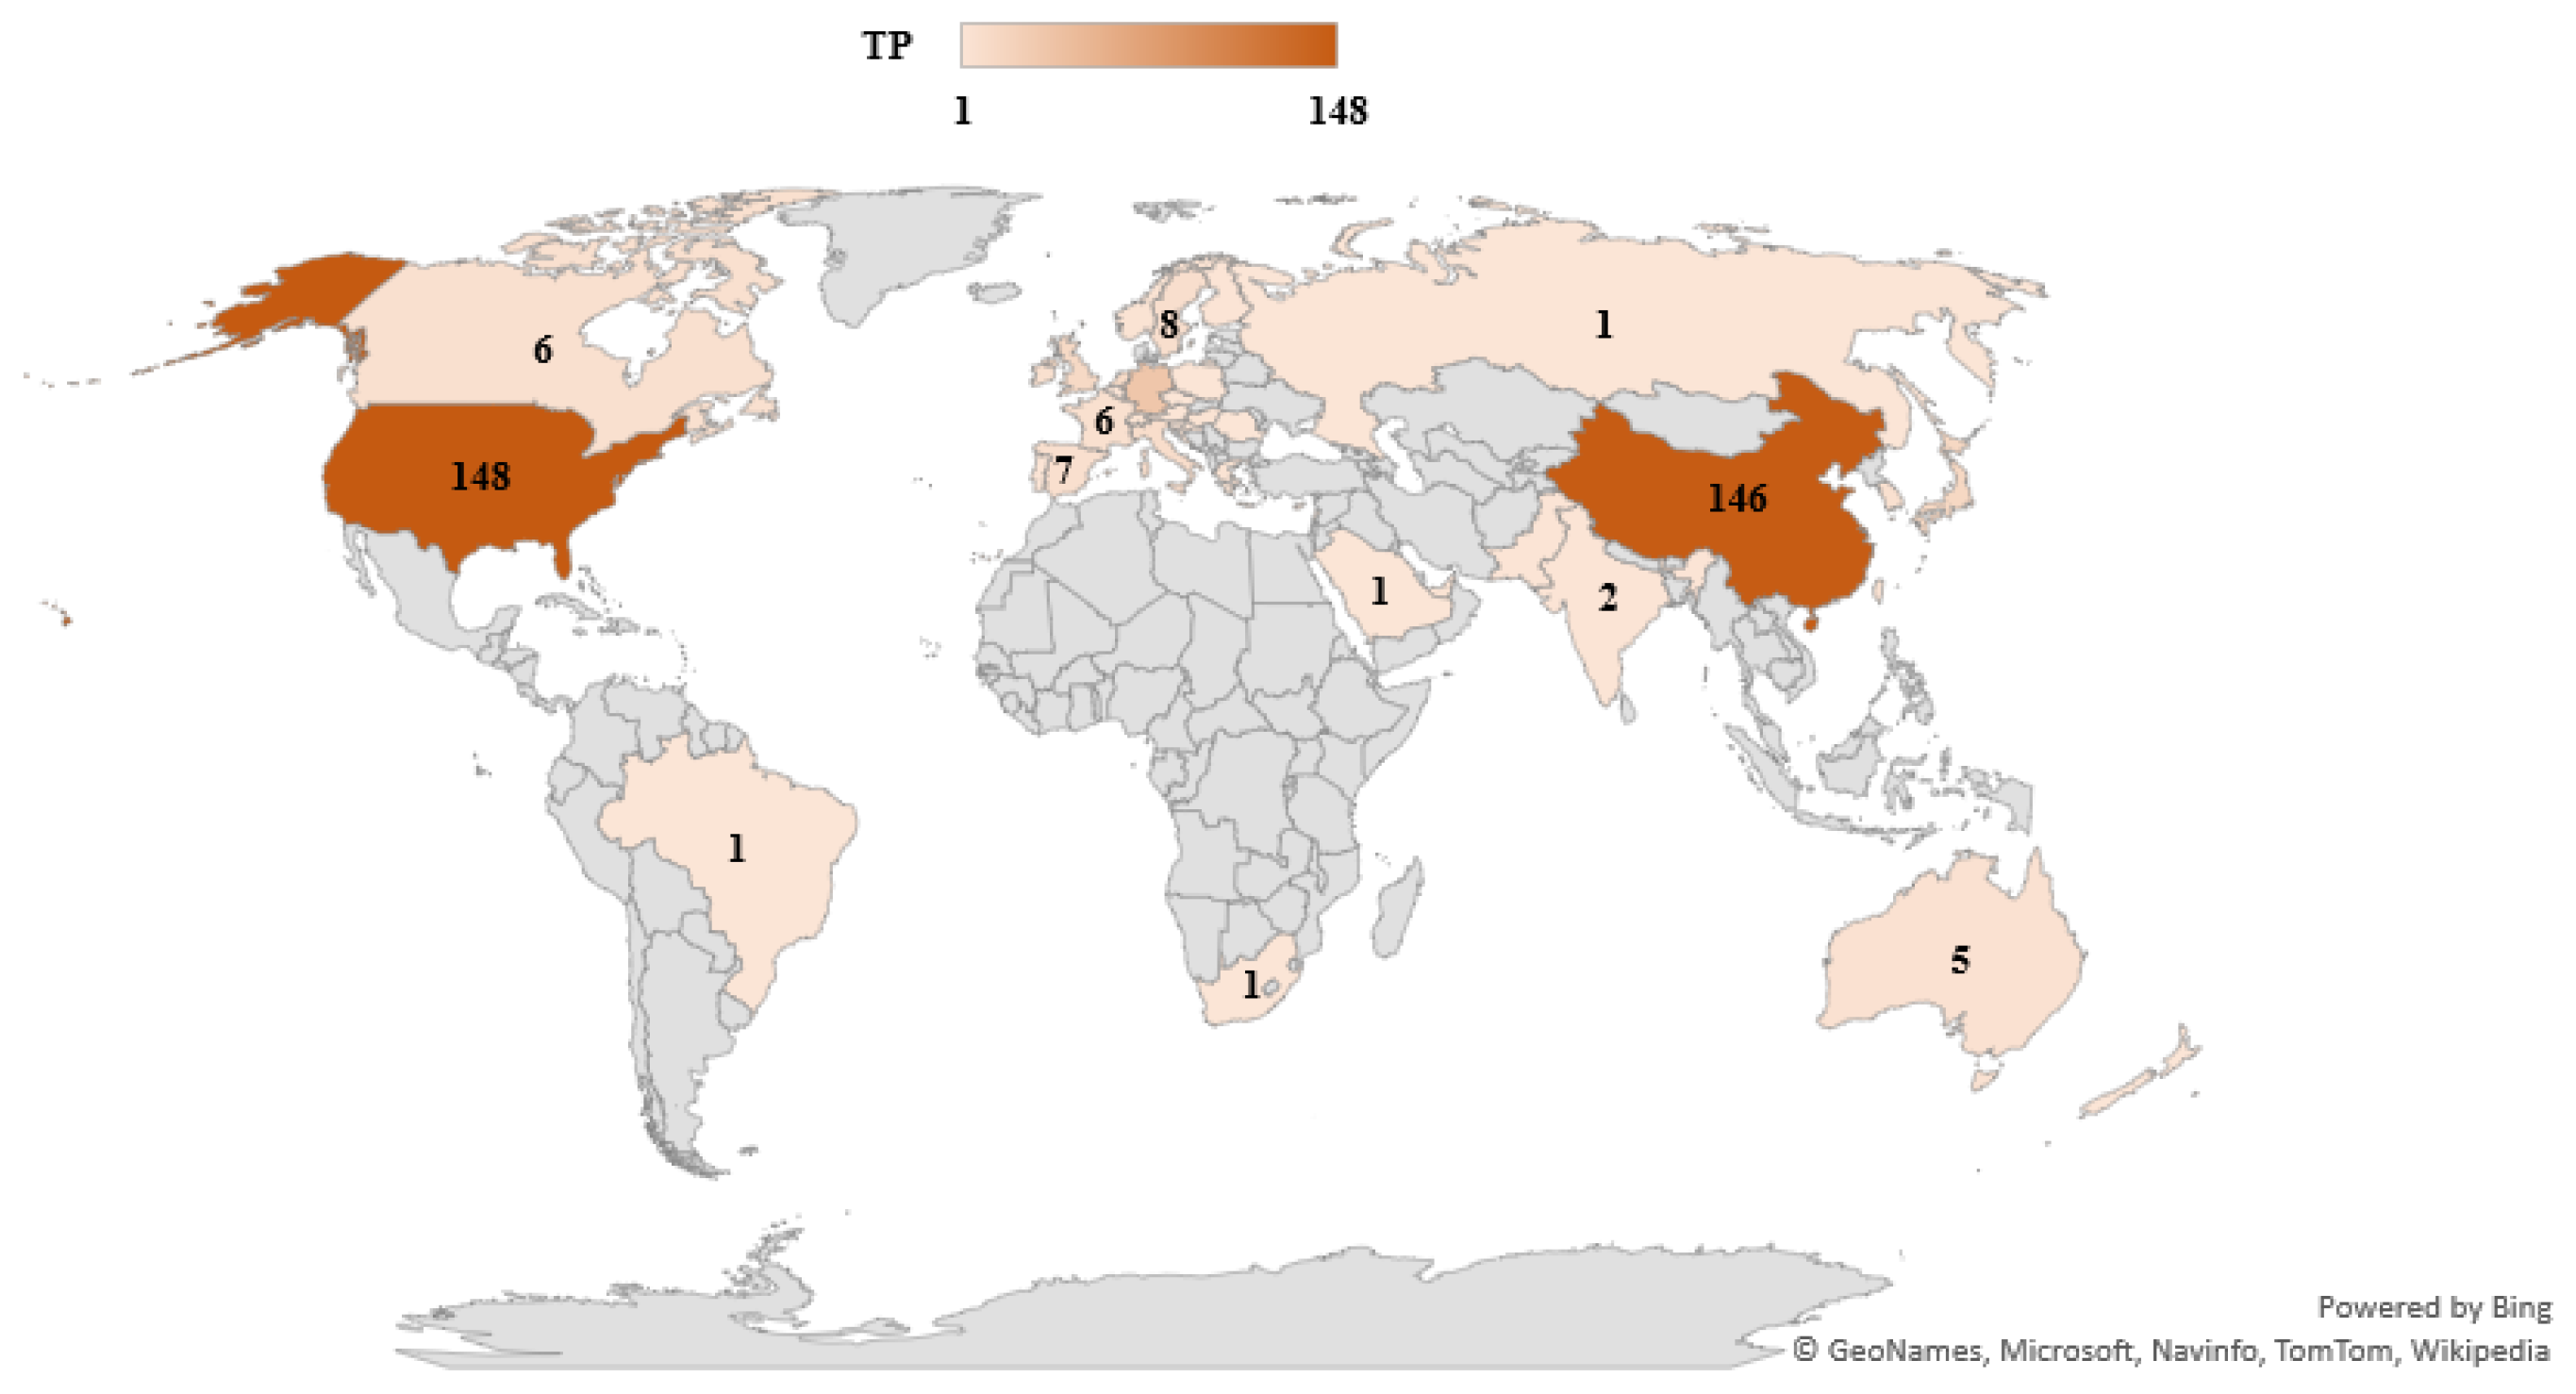
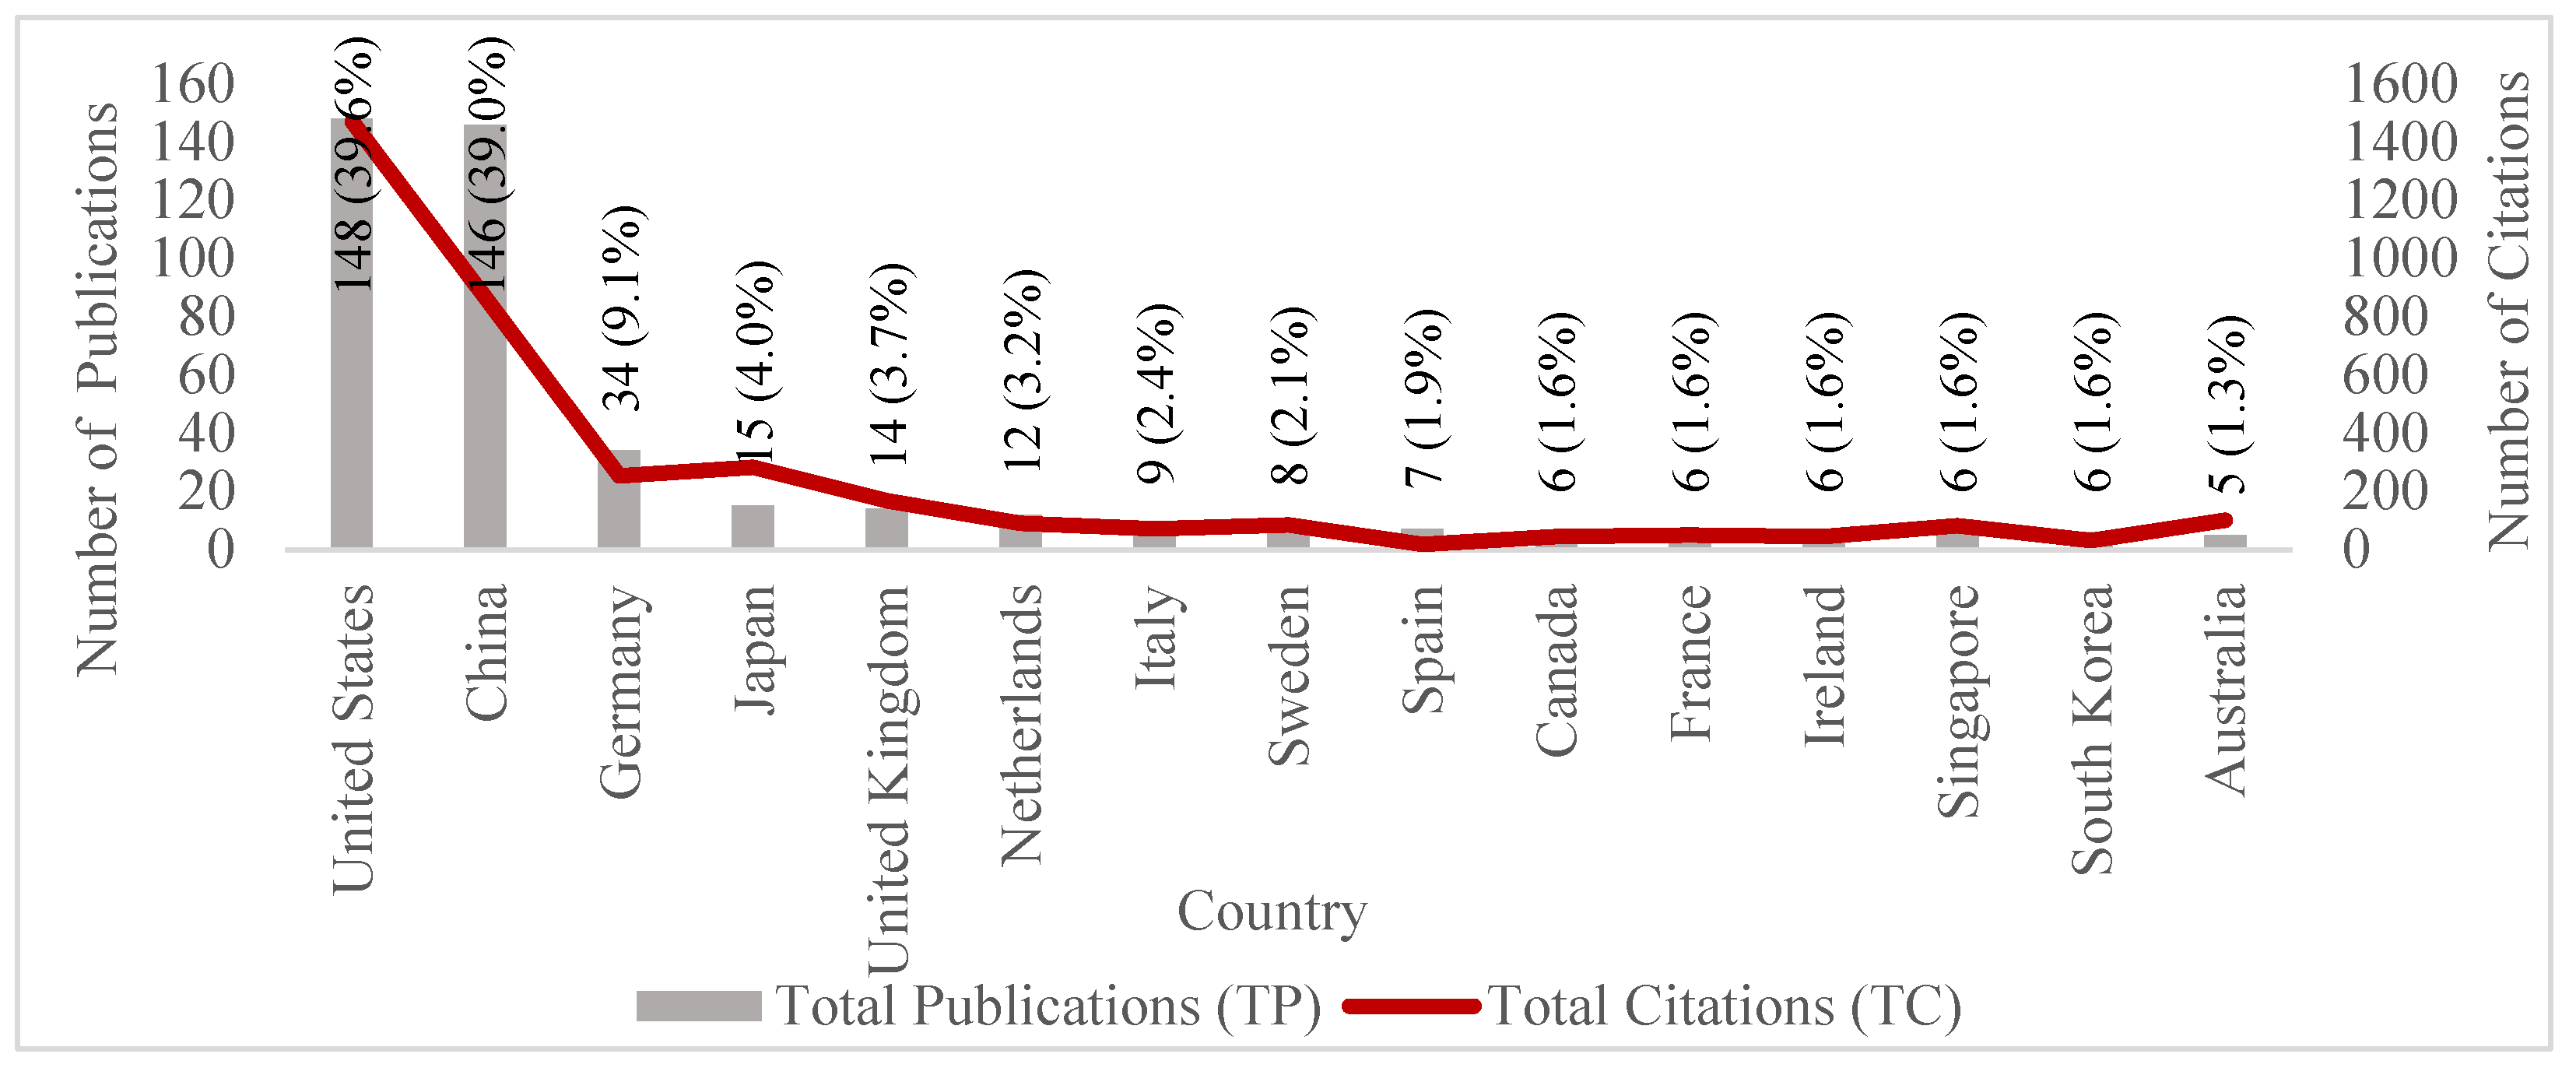
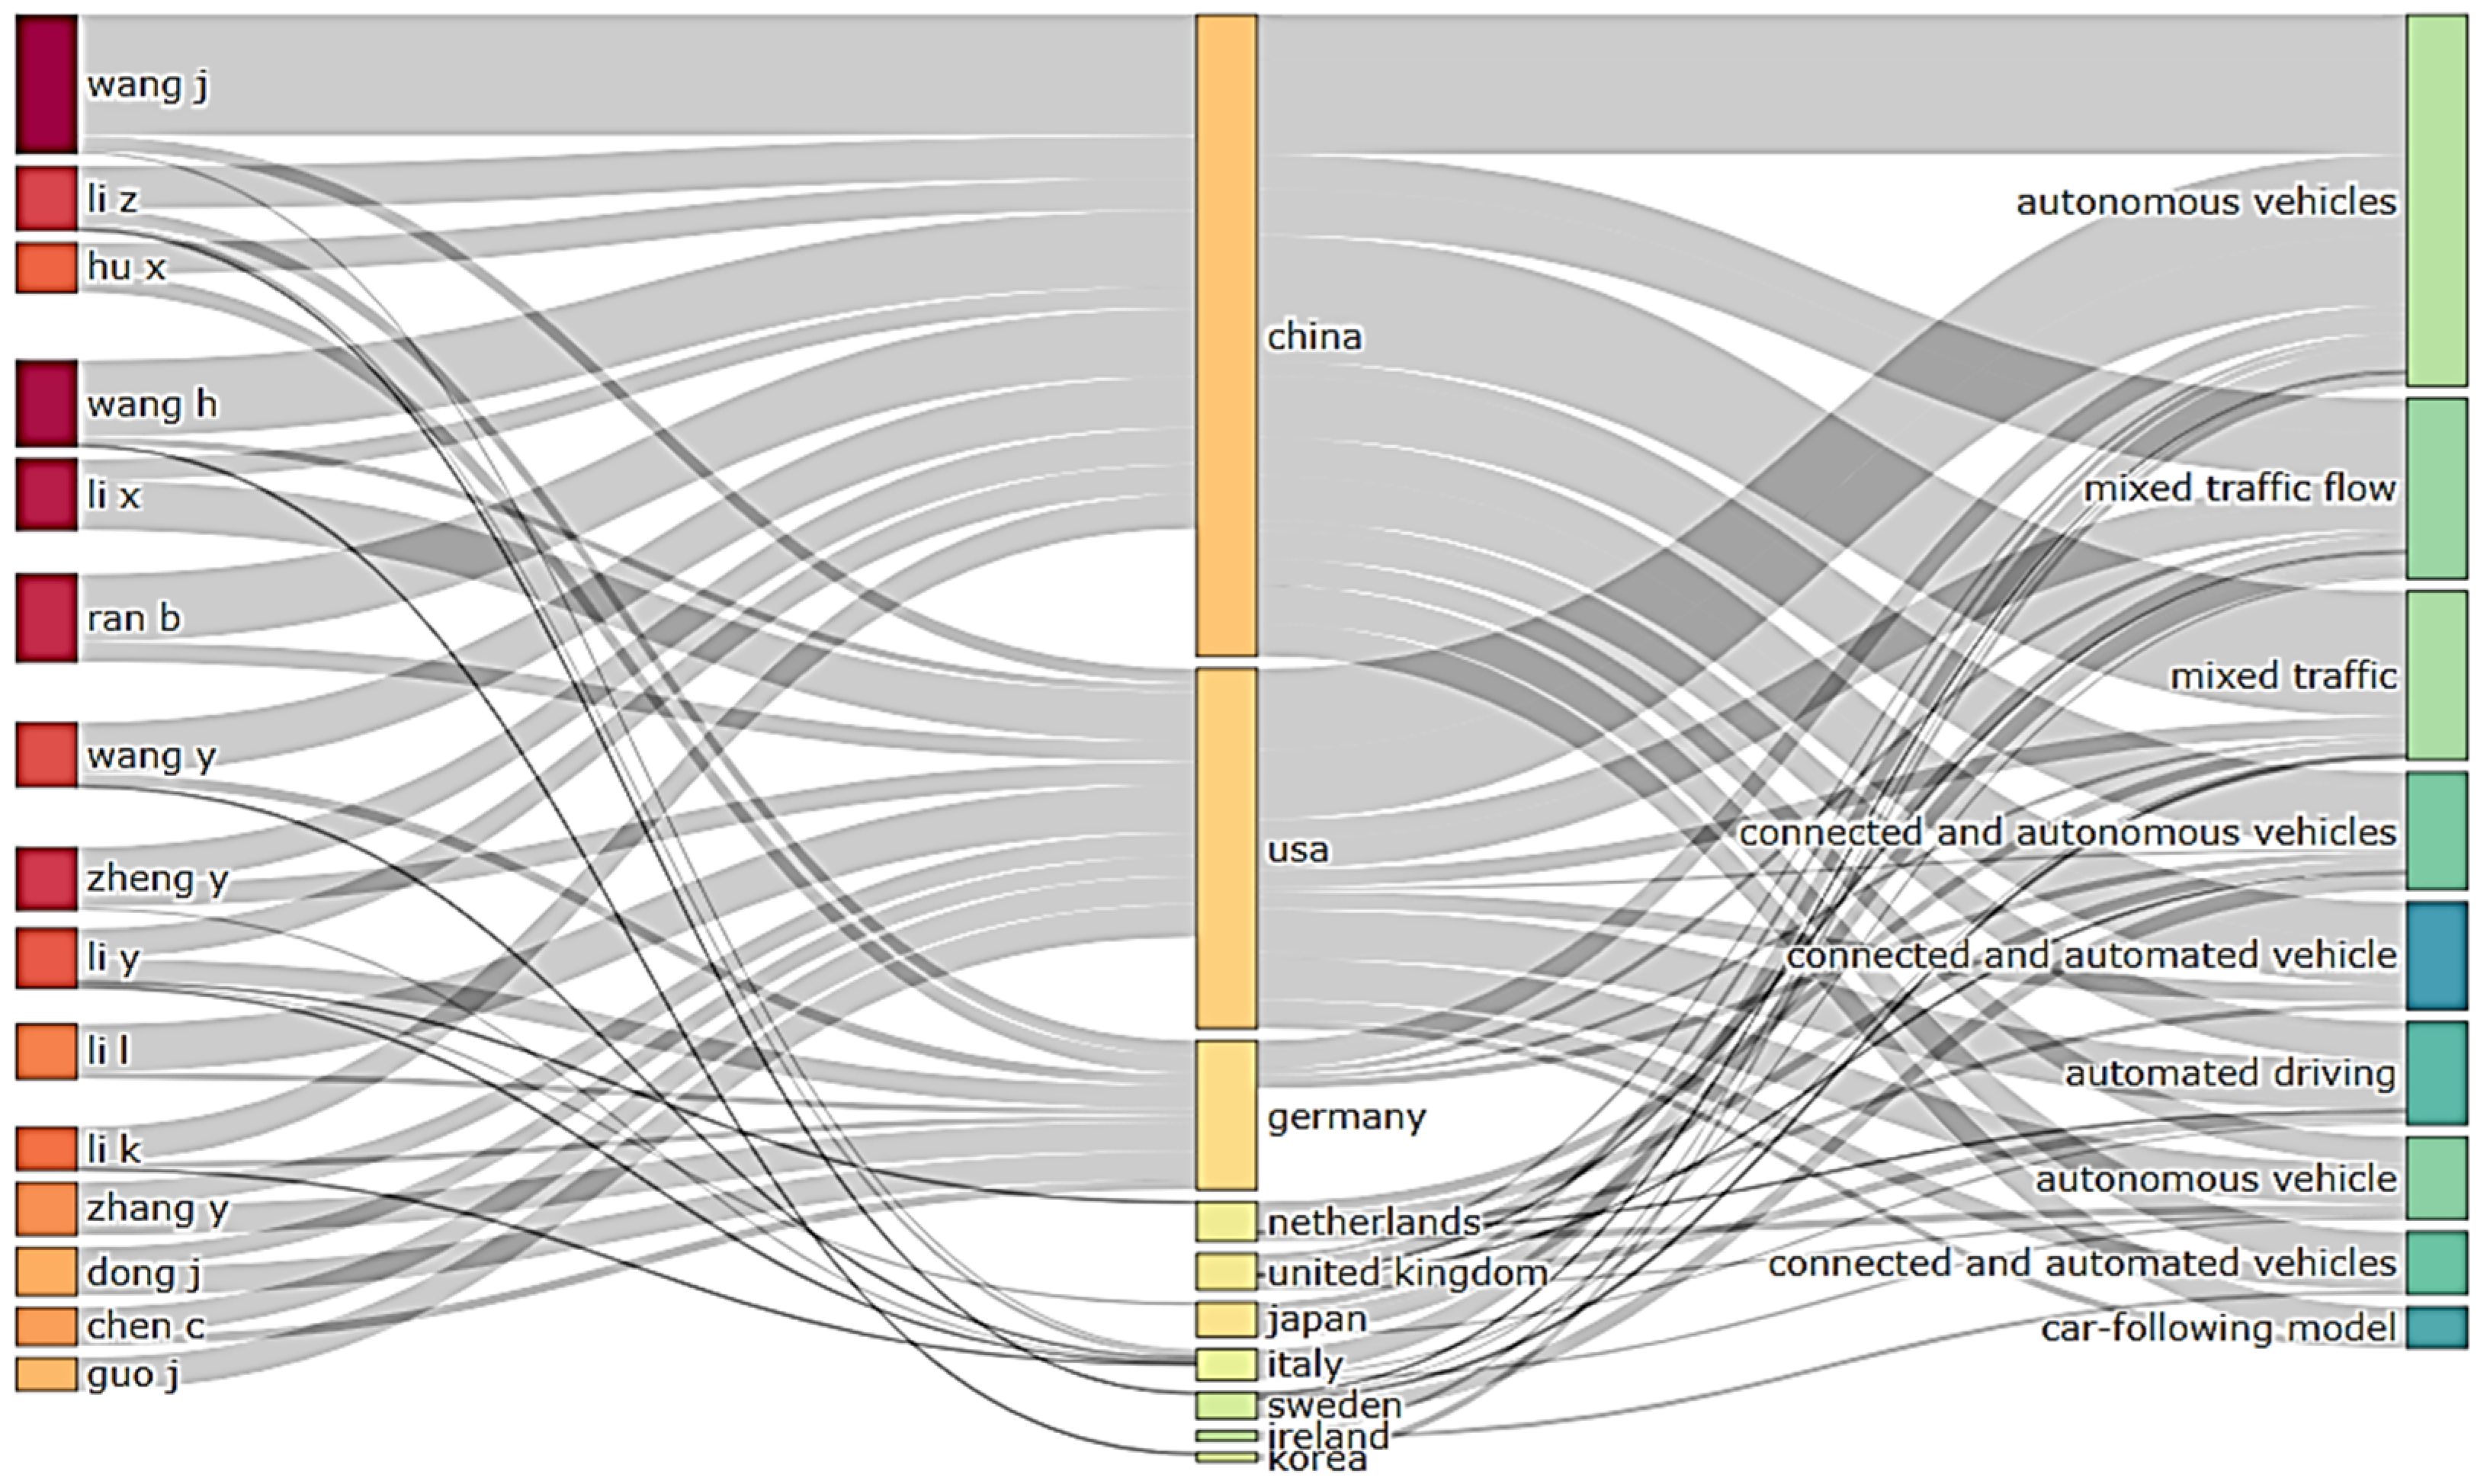
4.6. Citation Analysis of the Potential Countries

The geographical distribution of the publications is shown in Figure 7 below. The number of publications are presented, based on the countries around the globe. This analysis is helpful in understanding which part of the world is leading in terms of research on autonomous vehicles in mixed traffic conditions. The countries with publications were grouped according to the seven continents, which were Europe, Asia, North America, South America, Africa and Oceania. It was found that Asia holds the highest position, having 189 total publications from 11 different countries. China, Japan and Singapore were the leading countries from Asia with total publications of 146, 15 and 6, respectively. The second most productive continent was North America, with the United States and Canada as the leading countries with total publications of 148 and 6, respectively.
Figure 7 above shows the collective number of publications by all of the countries within a continent. Asia was the leading continent, having total publications of 189 from 11 different countries. Figure 8 shows the most productive countries with minimum total publications of five. In terms of total publications and total citations from a single country, the United States is the leading country, holding around 40% of the total publications in the area of autonomous vehicles in mixed traffic. In terms of total publications and total citations, the United States published 148 documents with total citations of 1470. The second leading country is China with total publications of 146 (39.0% of TPs) and total citations of 866. Table 9 shows further information about the most productive countries with minimum total publications of five.
Figure 9 below shows the network visualization of the co-authorship and collaboration between countries. A strong correlation is represented by the countries that are close together and have thicker connecting lines between them [102]. In terms of co-authorship between countries, the United States and China holds the strongest correlations as these two are located near to each other and are connected with a thicker line. The United States exhibited the highest international collaborations of 12 between the USA and other nations with a total link strength of 67, followed by China (10 associations with other countries and 67 total link strength), Germany (9 associations with other countries and 12 total link strength) and the United Kingdom (5 associations with other countries and 12 total link strength). From the cluster colors, it can be observed that South Korea, China, Germany and Canada are recently active countries in the research on autonomous vehicles.
Figure 10 illustrates a density visualization map reflecting the density for a country’s total citations received, which was built with VOSviewer. It can be seen that the maximum concentration of citations is around the United States and China followed by Germany, Japan and the United Kingdom. The two counties, the United States and China, produced comparable citations on the topic of autonomous vehicles in mixed traffic conditions.

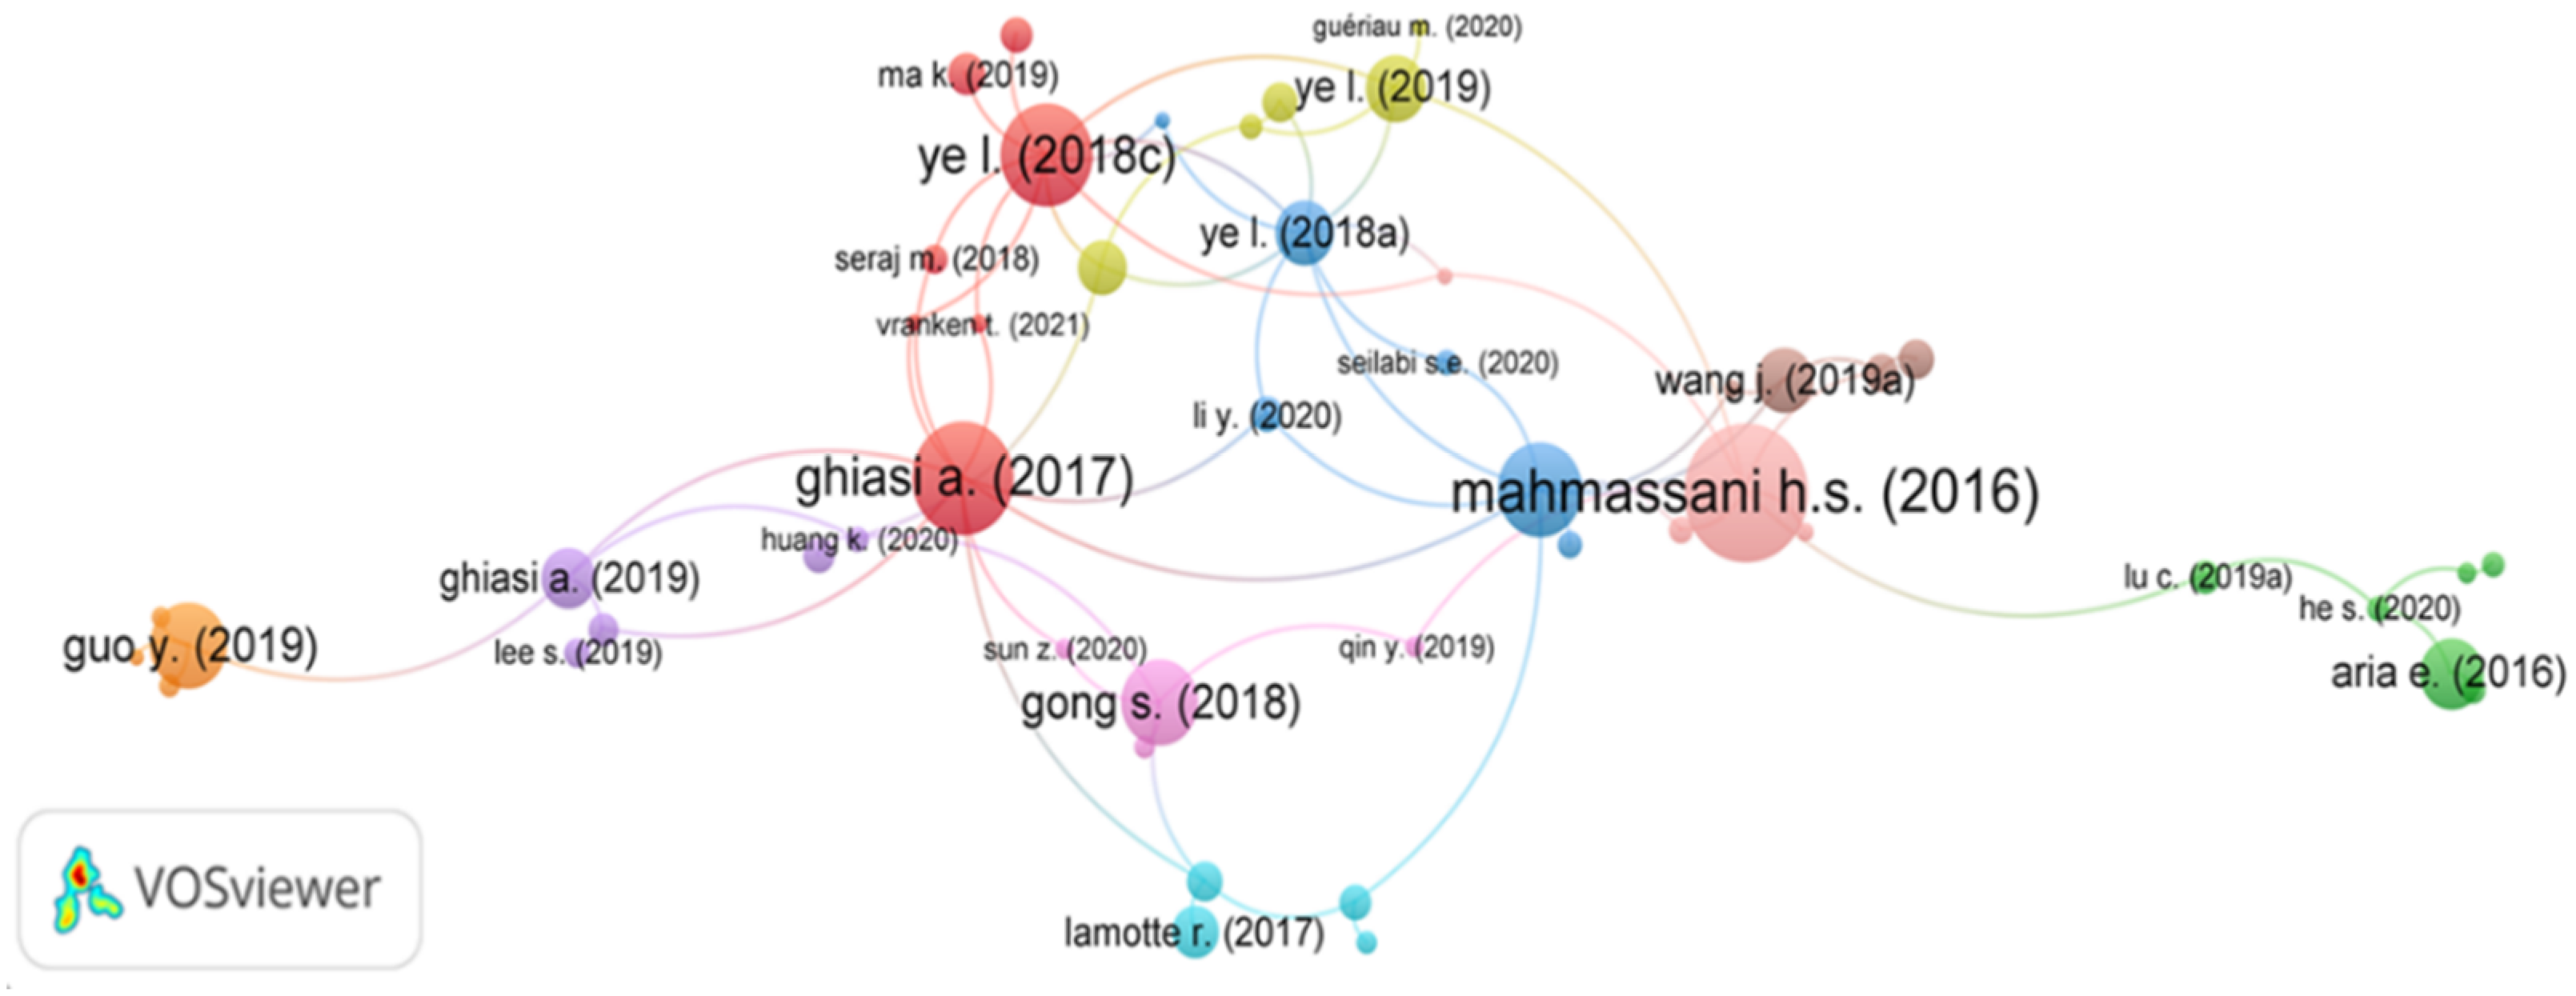
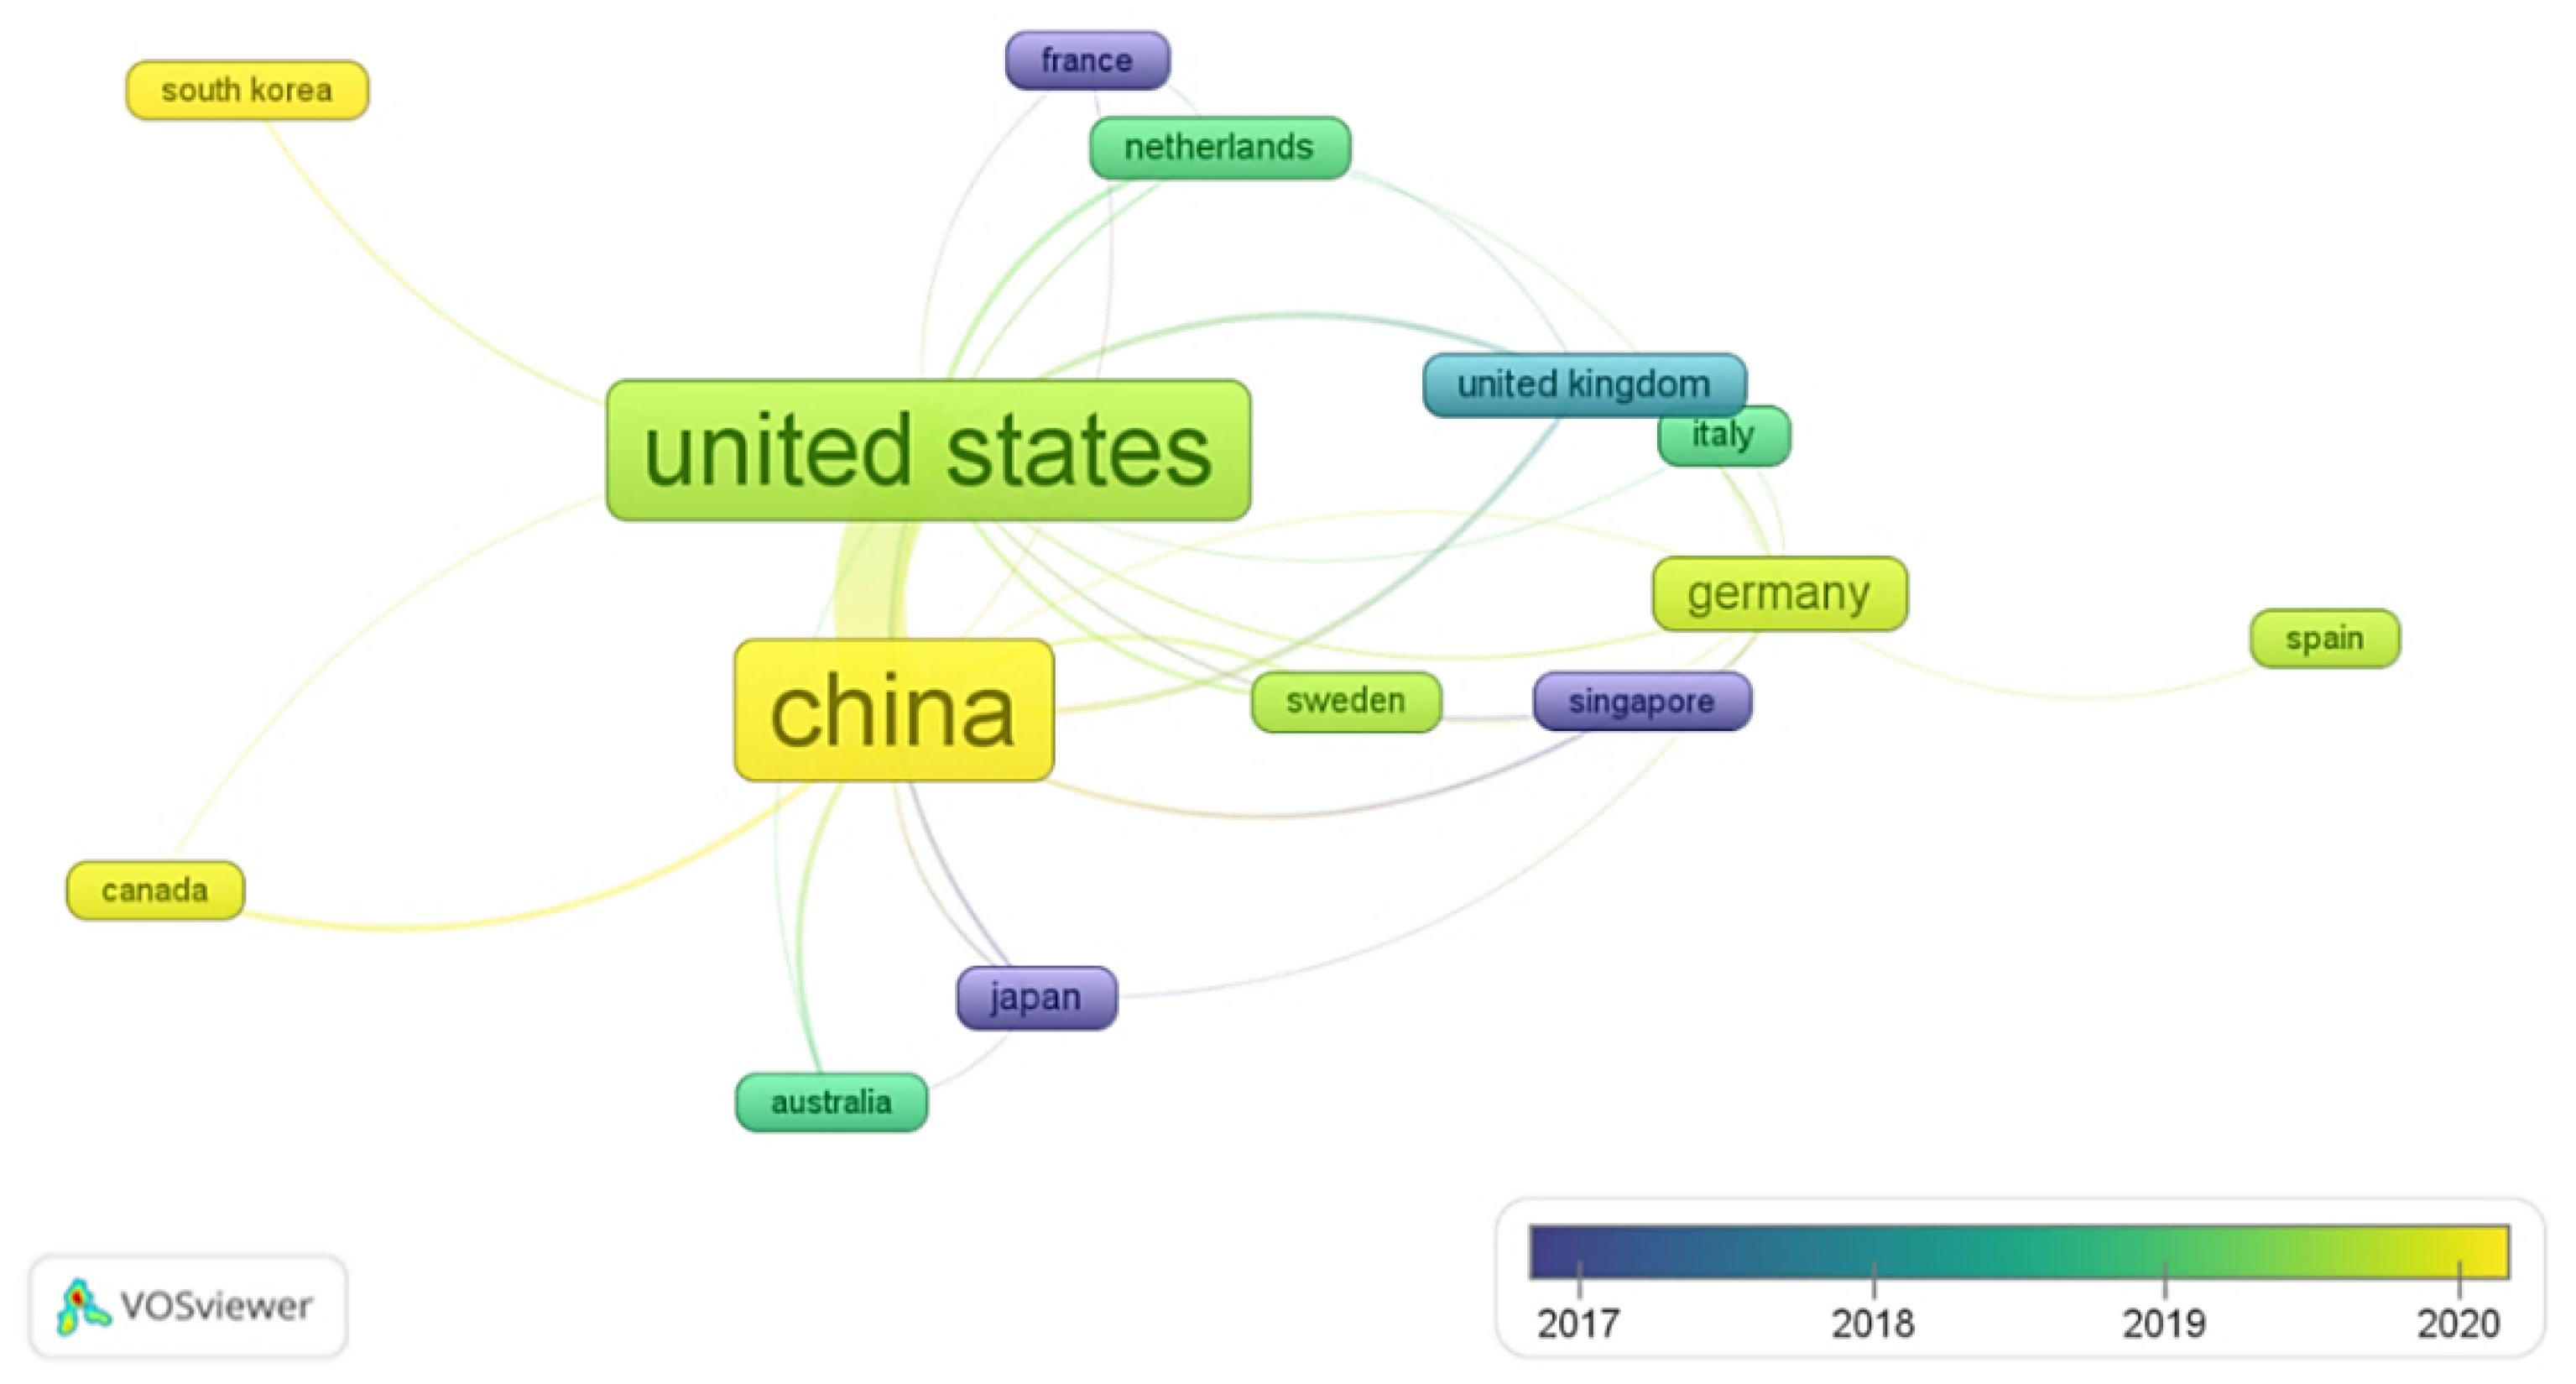
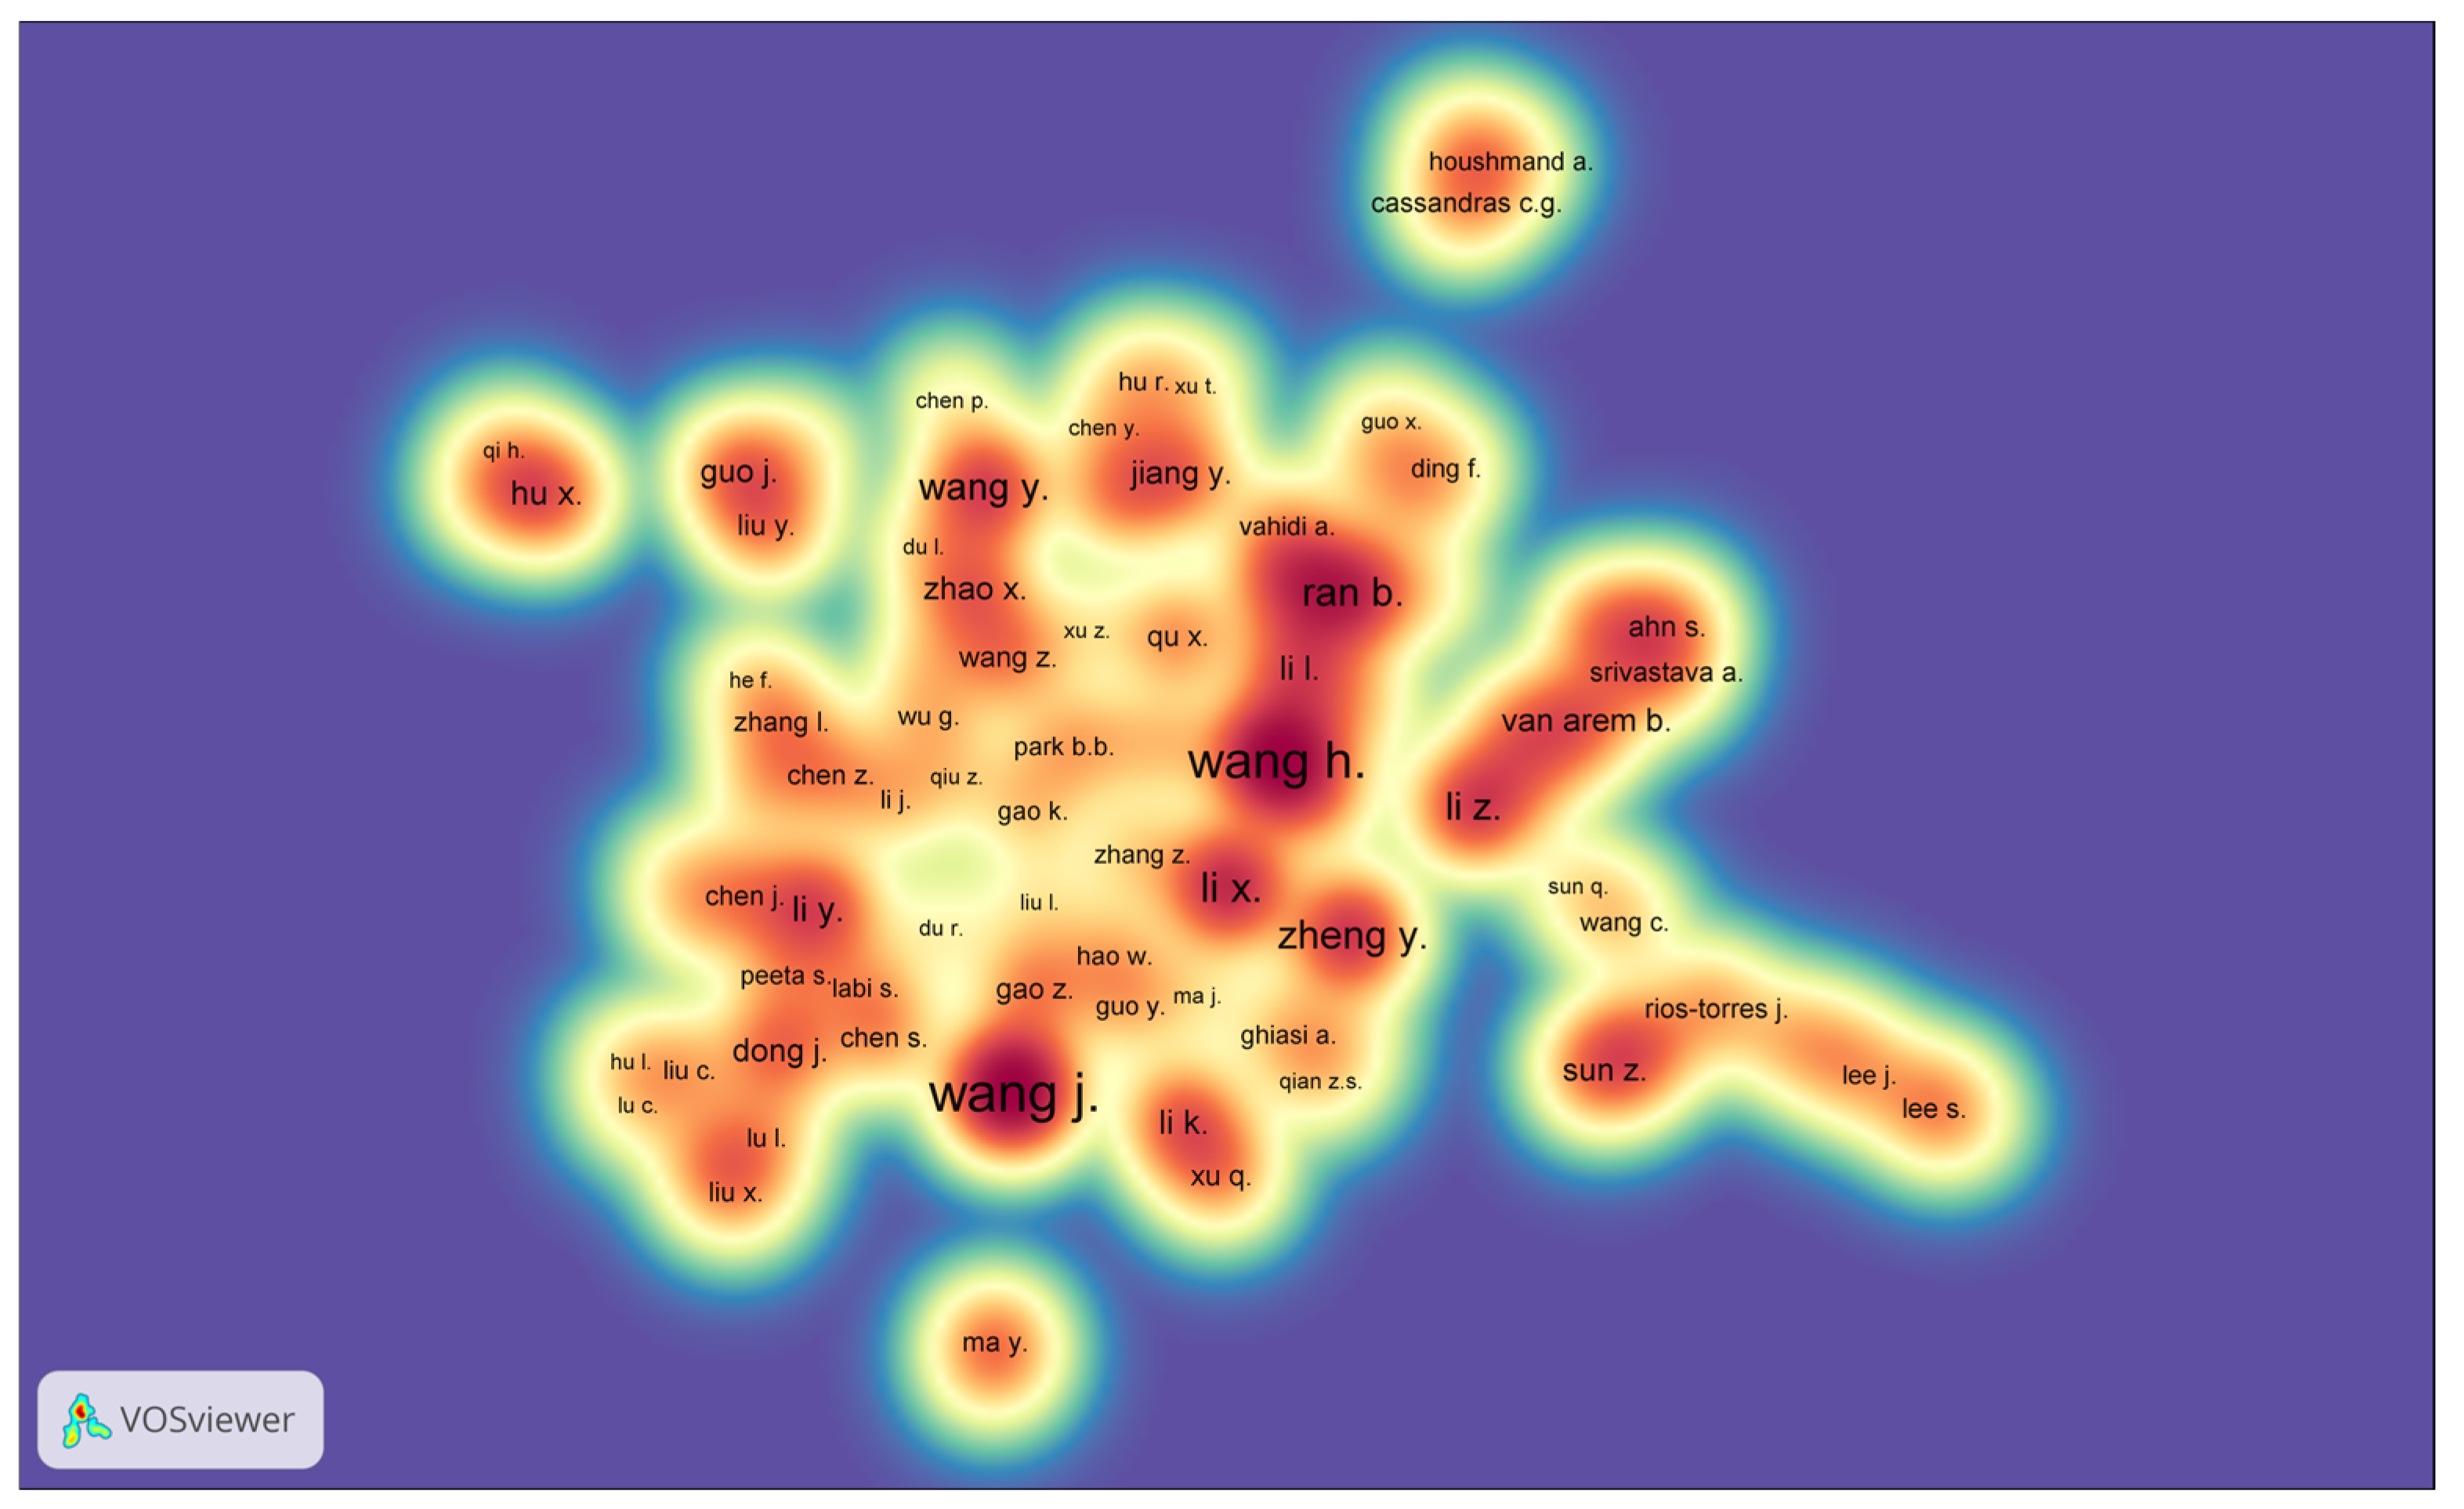
4.7. Co-Authorship Analysis

A total of 966 authors are involved in the research area of autonomous vehicles in mixed traffic. The network map was created by setting the minimum documents to two and citations to 10 (Figure 11). Out of 966 authors, 119 authors met the threshold. There were 93 authors with higher link strengths, and these were further grouped into 13 clusters. The authors having co-authorship relationships were grouped into one cluster. Cluster-1 represented a network of 12 authors, cluster-2, 3 consisted of 11 authors, cluster-4 of 10 authors, cluster-5 and 6 of nine authors, cluster-7 and 8 represented a network of six authors, cluster-9 and 10 of five authors and cluster11, 12 and 13 consisted of three authors each.

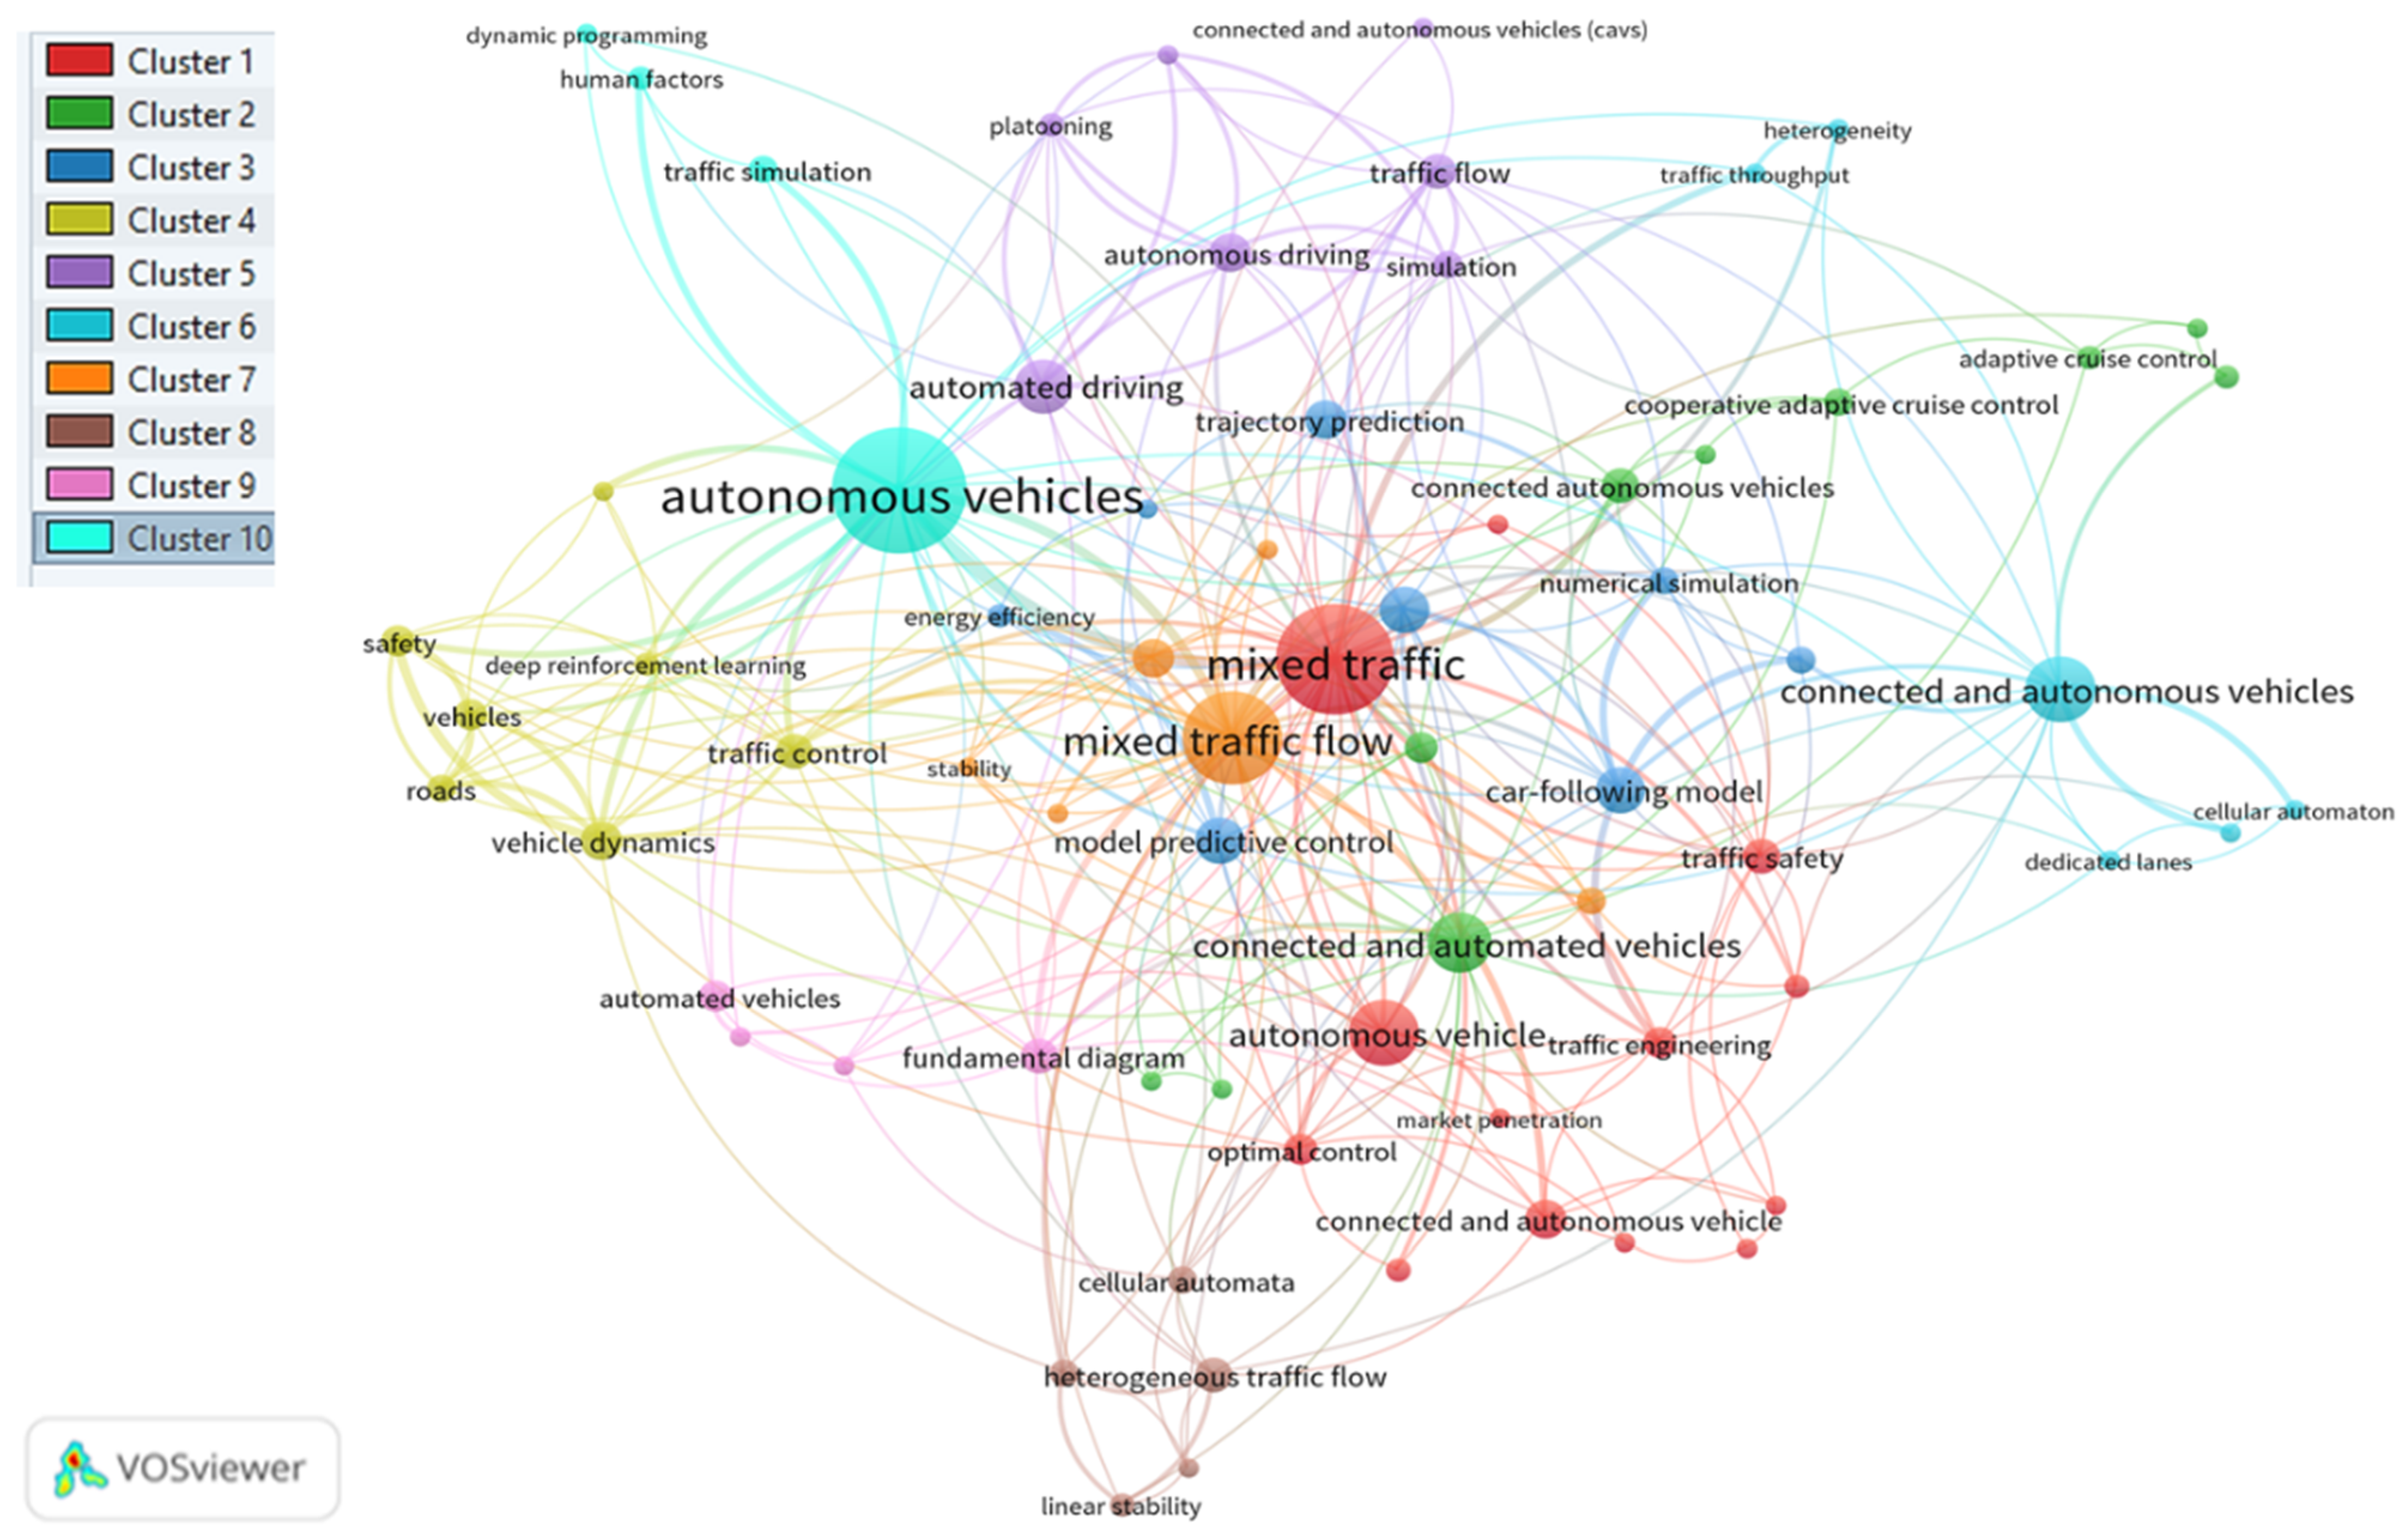
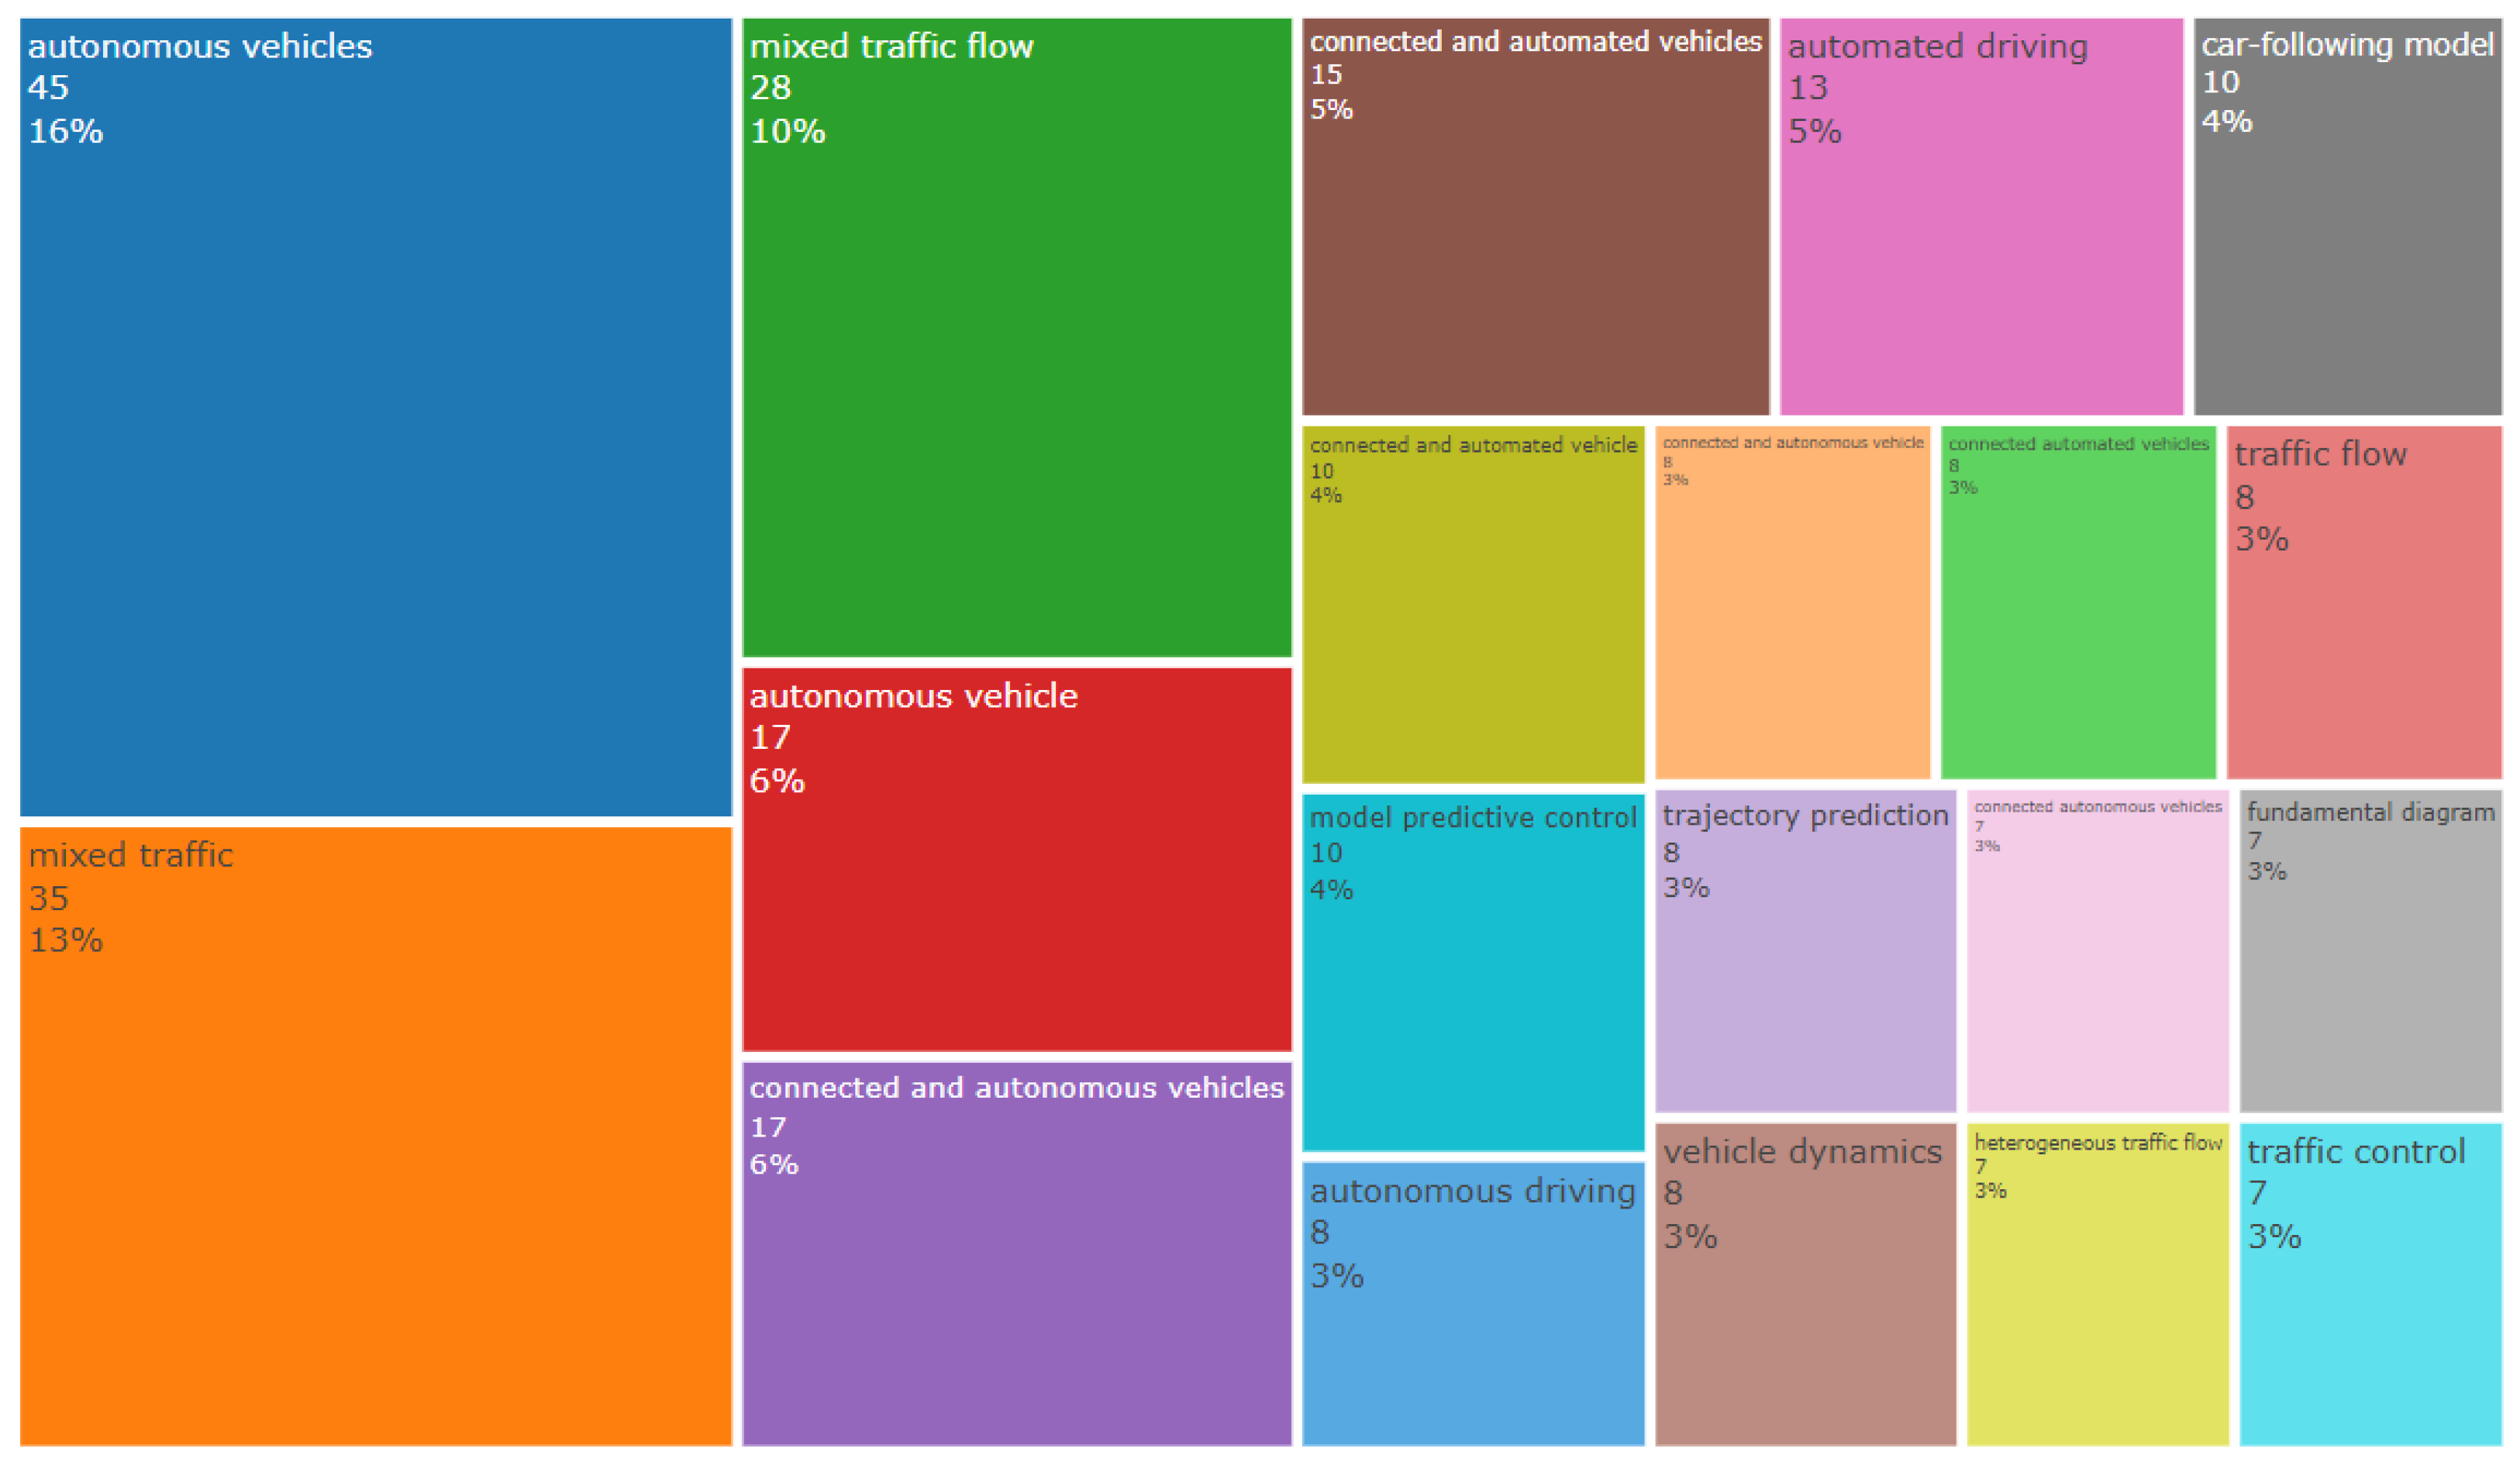
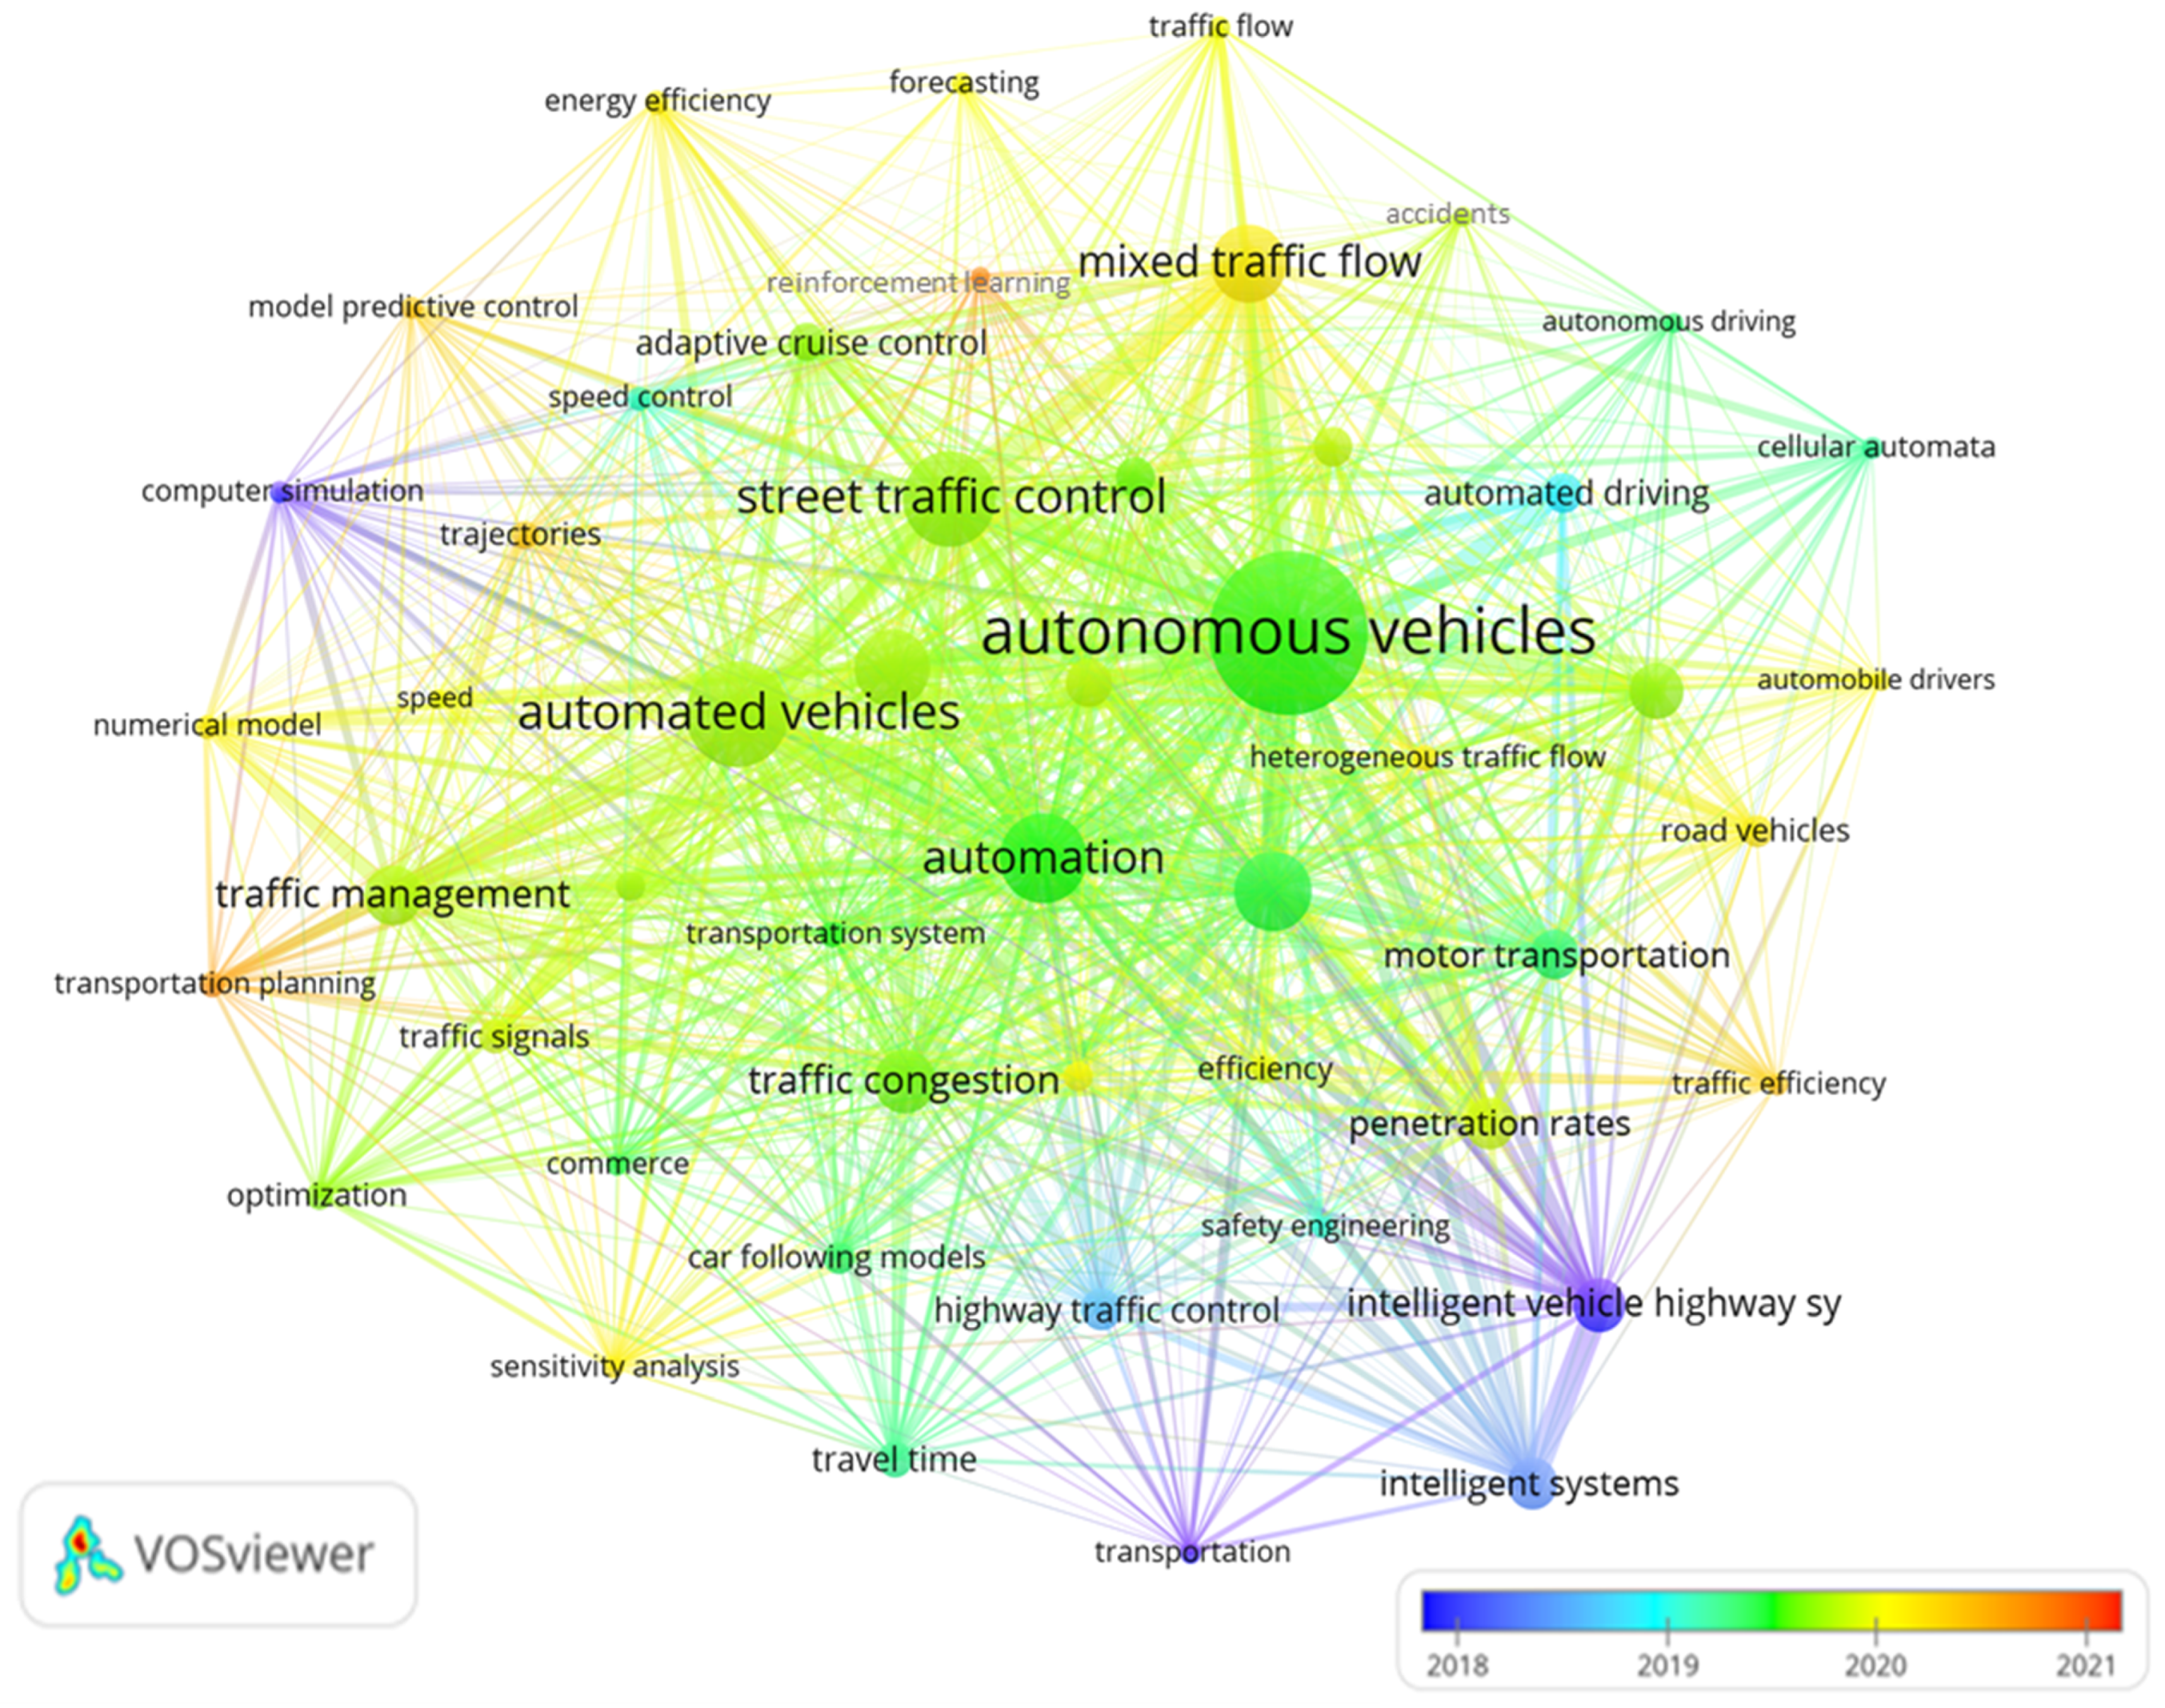
4.8. Co-Occurrence Analysis of Authors Keywords

The co-occurrence of author keywords was determined by using the extracted Scopus data into VOSviewer. Initially, 781 words appeared on the concerned topic when analyzing the Scopus file into VOSviewer. The keyword clusters were obtained on the basis of three author keyword occurrences to obtain the most relevant information. A total of 70 author keywords met the threshold. The potential 70 author keywords grouped into 10 clusters are shown in Figure 12 below.
Autonomous vehicles, mixed traffic and mixed traffic flow are the most co-occurred author keywords as denoted by the large size circles. Each of the clusters contains various author keywords, as discussed below:
  • The cluster-1 is denoted by a red color and contains 13 author keywords, including “automated vehicles”, “autonomous vehicles”, connected and autonomous vehicle”, “connected vehicle”, “cooperative driving”, “market penetration”, “microscopic simulation”, “mixed traffic”, mixed traffic stream”, “optimal control”, “string stability”, “traffic engineering” and “traffic safety”;
  • The cluster-2 is denoted by a green color and consists of 10 author keywords, such as “adaptive cruise control”, “connected and automated vehicle (cav)”, “connected and automated vehicles”, “connected autonomous vehicles”, “cooperative adaptive cruise control”, “intelligent transportation”, “intersection control”, “motion planning”, “smart city” and “trajectory planning”;
  • The cluster-3 is denoted by a blue color and contains eight author keywords, including “car-following model”, “connected and automated vehicle”, “energy efficiency”, “machine learning”, “model predictive control”, “numerical simulation”, “stability analysis” and “trajectory prediction”;
  • The cluster-4 is denoted by a yellow color and contains seven author keywords, including “connected vehicles”, “deep reinforcement learning”, “roads”, “safety”, “traffic control”, “vehicle dynamics” and “vehicles”;
  • The cluster-5 is denoted by a purple color and contains seven author keywords, including “automated driving”, “autonomous driving”, “connected and automated vehicles (CAVs)”, “platooning”, “plex”, “simulation” and “traffic flow”;
  • The cluster-6 is denoted by a sky blue color and contains six author keywords, such as “cellular automation”, “connected and autonomous vehicles”, “dedicated lanes”, heterogeneity”, heterogeneous flow” and “traffic throughput”;
  • The cluster-7 is denoted by an orange color and consists of six author keywords, such as “car-following”, “cellular automata model”, “connected automated vehicle”, “connected automated vehicles”, “mixed traffic flow” and “stability”;
  • The cluster-8 is denoted by a brown color and contains five author keywords, including “cellular automata”, “connected and automated vehicles (CAVs)”, “heterogeneous traffic flow”, “linear stability” and “reaction time”;
  • The cluster-9 is denoted by a pink color and includes four author keywords, such as “automated vehicles”, “capacity”, “fundamental diagram” and “microscopic traffic simulation”;
  • The cluster-10 is denoted by a cyan color and consists of four author keywords, including “autonomous vehicles”, “dynamic programming”, “human factors” and “traffic simulation”.
Then, the top 20 author keywords used in the research area of autonomous vehicles in mixed traffic conditions were illustrated in a tree-map, as shown in Figure 13. The documents retrieved from Scopus database used the author keyword “autonomous vehicles” for 45 times contributing to 16% of the top 20 author keywords. The word “mixed traffic” was the second most frequently adopted author keyword among the top 20, with a total occurrence of 35 and contribution of 13%. The third leading author keyword was “mixed traffic flow” with an occurrence of 35 and contribution of 10%.

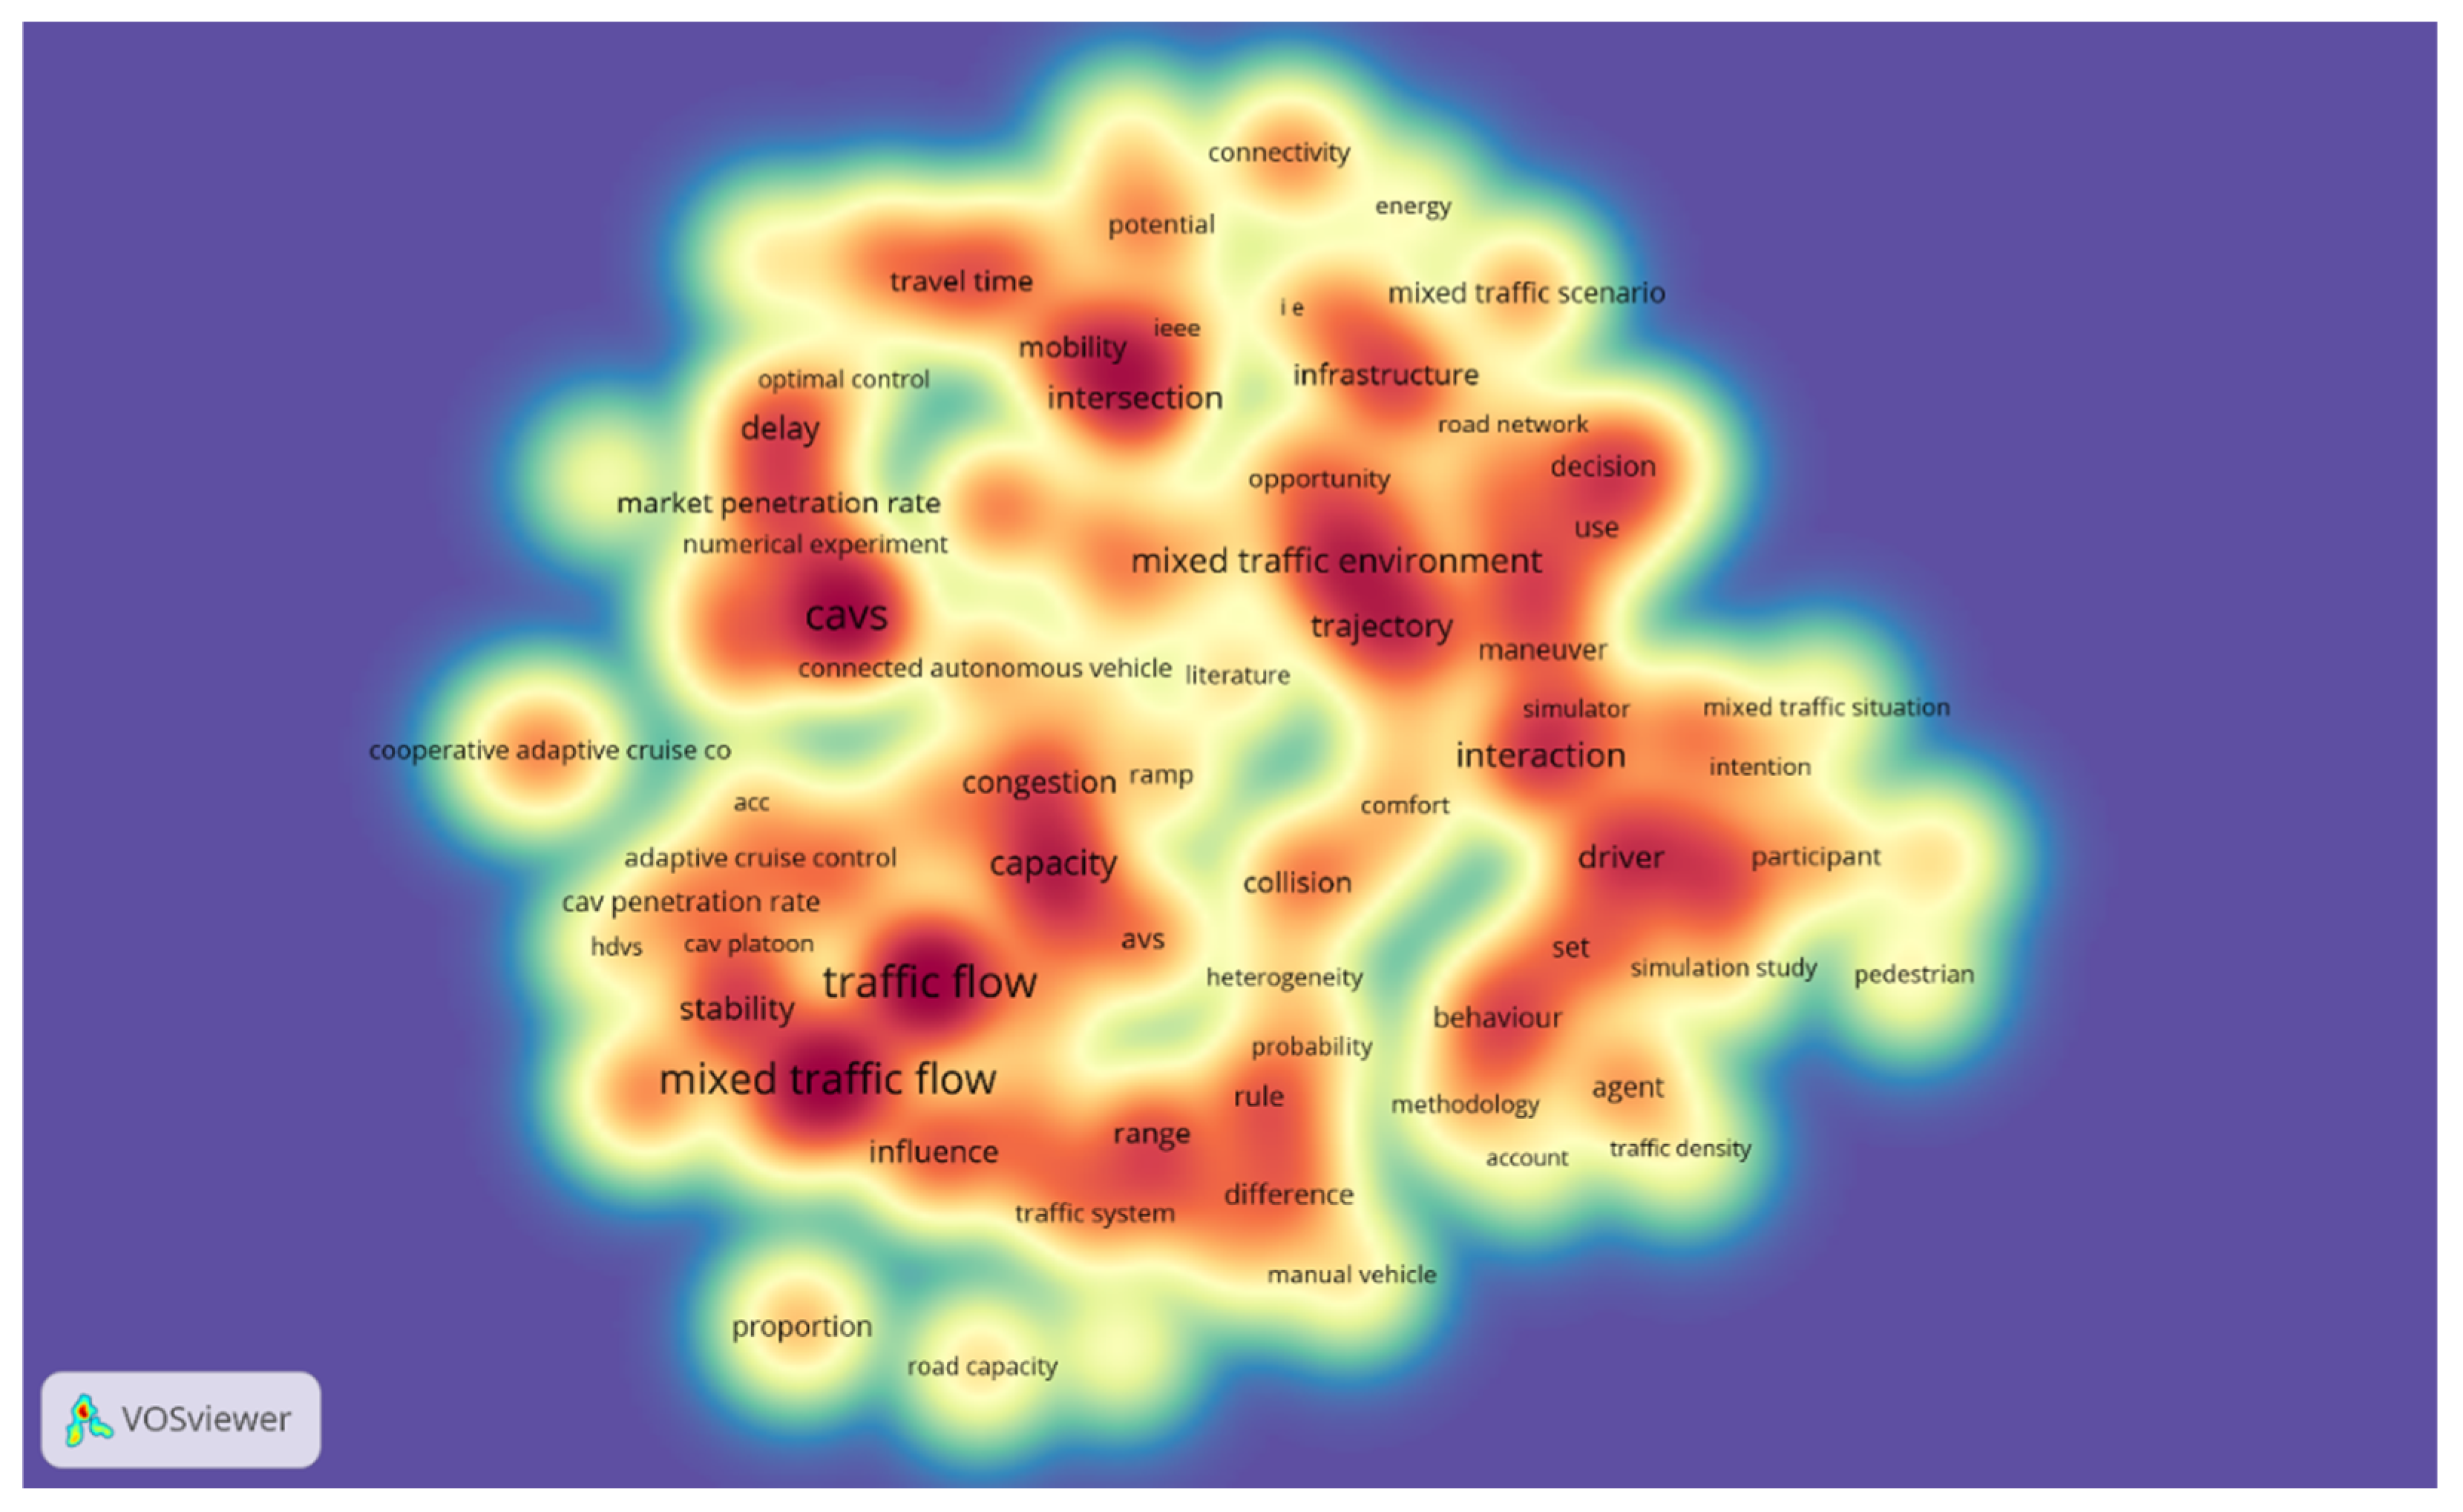
4.9. Text-Data Analysis

The VOSviewer offers extraction and analysis of text data and computes the relevance score of each term used in the title or/and abstract of the documents. The terms with a higher relevance score refer to a specific theme of research area and the terms with a low relevance score refer to general areas and do not represent any specific theme. The VOSviewer extracts the terms from the Scopus file and offers an option to exclude 40% of the irrelevant terms while including the remaining 60% for analysis [114]. In the text analysis, the terms can be extracted from the title, abstract or from both. The extracted text is analyzed by binary coding and relevance score [115].
The Scopus file was used in VOSviewer which showed a total of 8035 terms extracted from the titles and abstracts of the documents. To have a clear image of the topics discussed in the titles and abstracts of the documents, the minimum occurrence for a term was set to 10. This reduced the total text terms to 207 which were further reduced to 124 after the software selected the 60% most relevant terms. A density map created based on the aforementioned criteria is shown in Figure 14 below. It is then followed by Table 10 which shows the top 10 terms used in titles and abstracts of the documents. The ranking of terms was completed based on the occurrence frequency and relevance score of each term.
As seen in Table 10 above, the terms “traffic flow”, “mixed traffic flow” and “CAVs” appeared more than 80 times among the top 10 terms with relevance values of 0.53, 0.83 and 0.33, respectively. In terms of the highest relevance score, the terms “mixed traffic situation”, “cooperative adaptive cruise control” and “cellular automata” showed the highest relevance values of 3.45, 2.17 and 2.07, respectively. The term “mixed traffic situation” showed the highest relevance score of 3.45 but it only occurred 12 times.

4.10. Three Field Plots on Autonomous Vehicles in Mixed Traffic Conditions

For this paper, three field plots were prepared in the Bibliometrix R-package to understand the relationship between the sources, countries, organizations, affiliations and keywords [116]. For each of the considered aspects, the rectangles of different colors appear in the plots and the height of the rectangle denotes the strength of the relationship with other components.
Figure 15 shows a Sankey diagram for autonomous vehicles in mixed traffic conditions created between author keywords (left), authors (middle) and sources (right). For better visualizations of potential components, the number of keywords was set to 15 and the values for authors and sources were set to 10.
It can be observed from Figure 15 that the “mixed traffic flow”, “autonomous vehicle” and “mixed traffic” are the most dominant keywords, and authors Wang, J., Wang, H., Li, X., and Zheng, Y., mainly worked and published in sources such as Transportation Research Part C: Emerging Technologies, IEEE Transactions on Intelligent Transportation Systems, Journal of Advanced Transportation and Physica A: Statistical Mechanics and its Applications.
Another plot explaining the relationship between authors (left), countries (middle) and keywords (right) is shown in Figure 16. The information of the most productive authors, their affiliated countries and their research areas can be seen with the help of rectangle sizes for each of the considered components. This graph was generated by considering the number of counties as 10 and the authors and keywords as 15. It can be seen that the most productive authors are from China, the United States and Germany and their potential areas are autonomous vehicles, mixed traffic flow and mixed traffic.
Figure 17 below explains the relationship between the prominent institutions, their most productive authors and the journals where they are publishing their work. Three field plots were created by considering 15 institutions (left), 10 authors (middle) and 15 potential sources (right). The potential authors Zheng, Y., and Wang, H. have their affiliations with the Southeast University, China and Wang, J., is affiliated with Tsinghua University, China. These institutions with their productive authors are publishing their research works in Transportation Research Part C: Emerging Technologies, IEEE Transactions on Intelligent Transportation Systems, IEE conference on Intelligent Transportation Systems and Journal of Advanced Transportation.

5. Discussion on Thematic Areas and Research Hotspots

This section elaborates the evolution of the various research areas linked with the autonomous vehicles in previous years. The latest areas in the concerned research domain will be highlighted through the text analysis in the form of clusters and thematic maps.

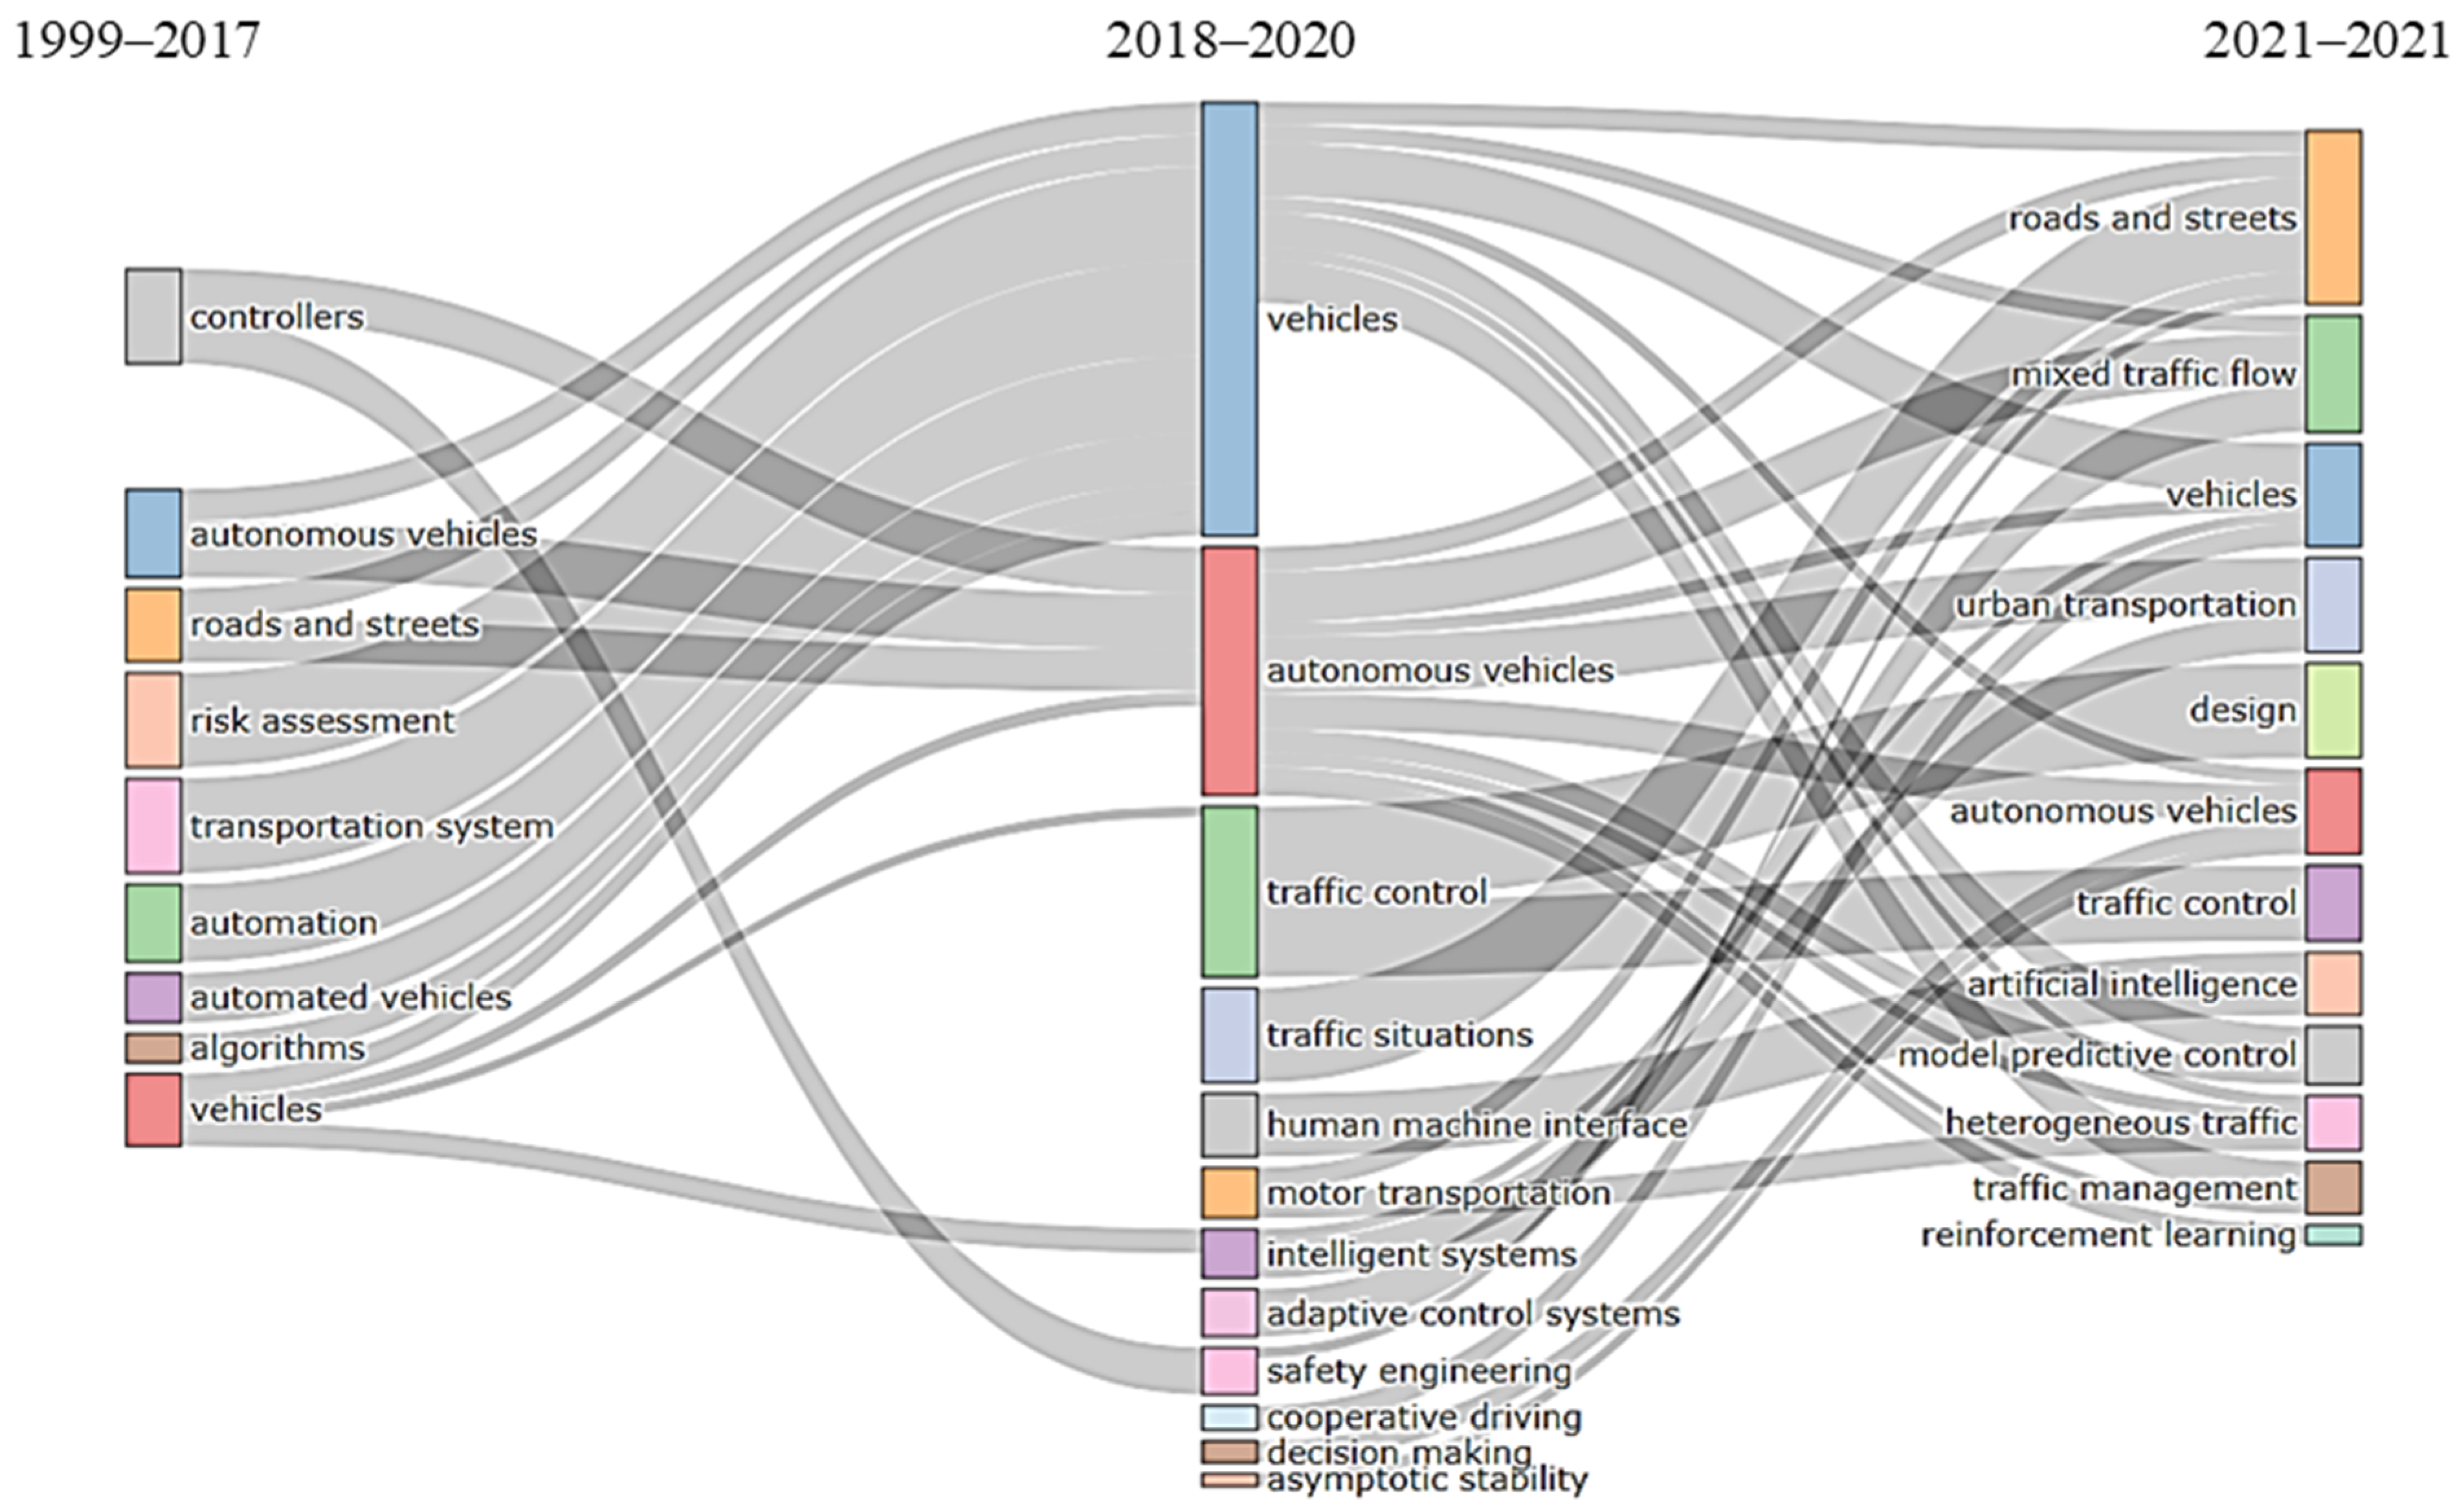
5.1. Thematic Evolution of Autonomous Vehicles in Mixed Traffic from 1999 to 2021

The evolution of different research areas associated with autonomous vehicles is shown in Figure 18 below. The thematic map was created by considering three time slices, based on what has been published in the previous years (1999–2017), what were the hotspots research areas on this concerned topic in recent years (2018–2020) and what areas are current research themes (2021).
The potential areas from each of the considered time slices based on notable keywords are given in Table 11 below. The prominent keywords in each time slice denote the maturity of the research areas for that time frame. For the time slice 1999–2017, the keywords such as transportation system, algorithms and controller specify the active start of this research area and the major research concerns were the development of interfaces and algorithms as an input to in-vehicle controllers for the development of automation in vehicular technology. The time slice 2017–2020 denotes the maturity of the research concerning the development of autonomous vehicular technology having valid control algorithms and in-vehicle sensors. During the years 2017–2020, the most prominent research areas were related to enhancement of autonomous vehicles for different traffic situations and human–machine interactions. The key interests were to develop highly automated vehicles which would be capable of driving in any traffic situation and their errorless interaction with human drivers and pedestrians. These preparations were based on certain control algorithms, sensors, cameras and radars that provided information on the surrounding roadway conditions [117].
The latest developments in the research pertaining to autonomous vehicles are illustrated in Figure 18 above for the time slice 2021 and the notable keywords for the same time slice are given in Table 11 below. The new and notable terms which appeared during this time frame are linked with the deployment of autonomous vehicles in real-world mixed traffic streams. Mixed traffic streams refer to the traffic streams having both autonomous vehicles and human-driven vehicles. The latest research areas working on various components include the impacts of autonomous vehicles on network performance [118,119], infrastructure planning and management for heterogeneous traffic streams [120,121] and interaction with different vehicular classes in urban transport networks [34,122,123].

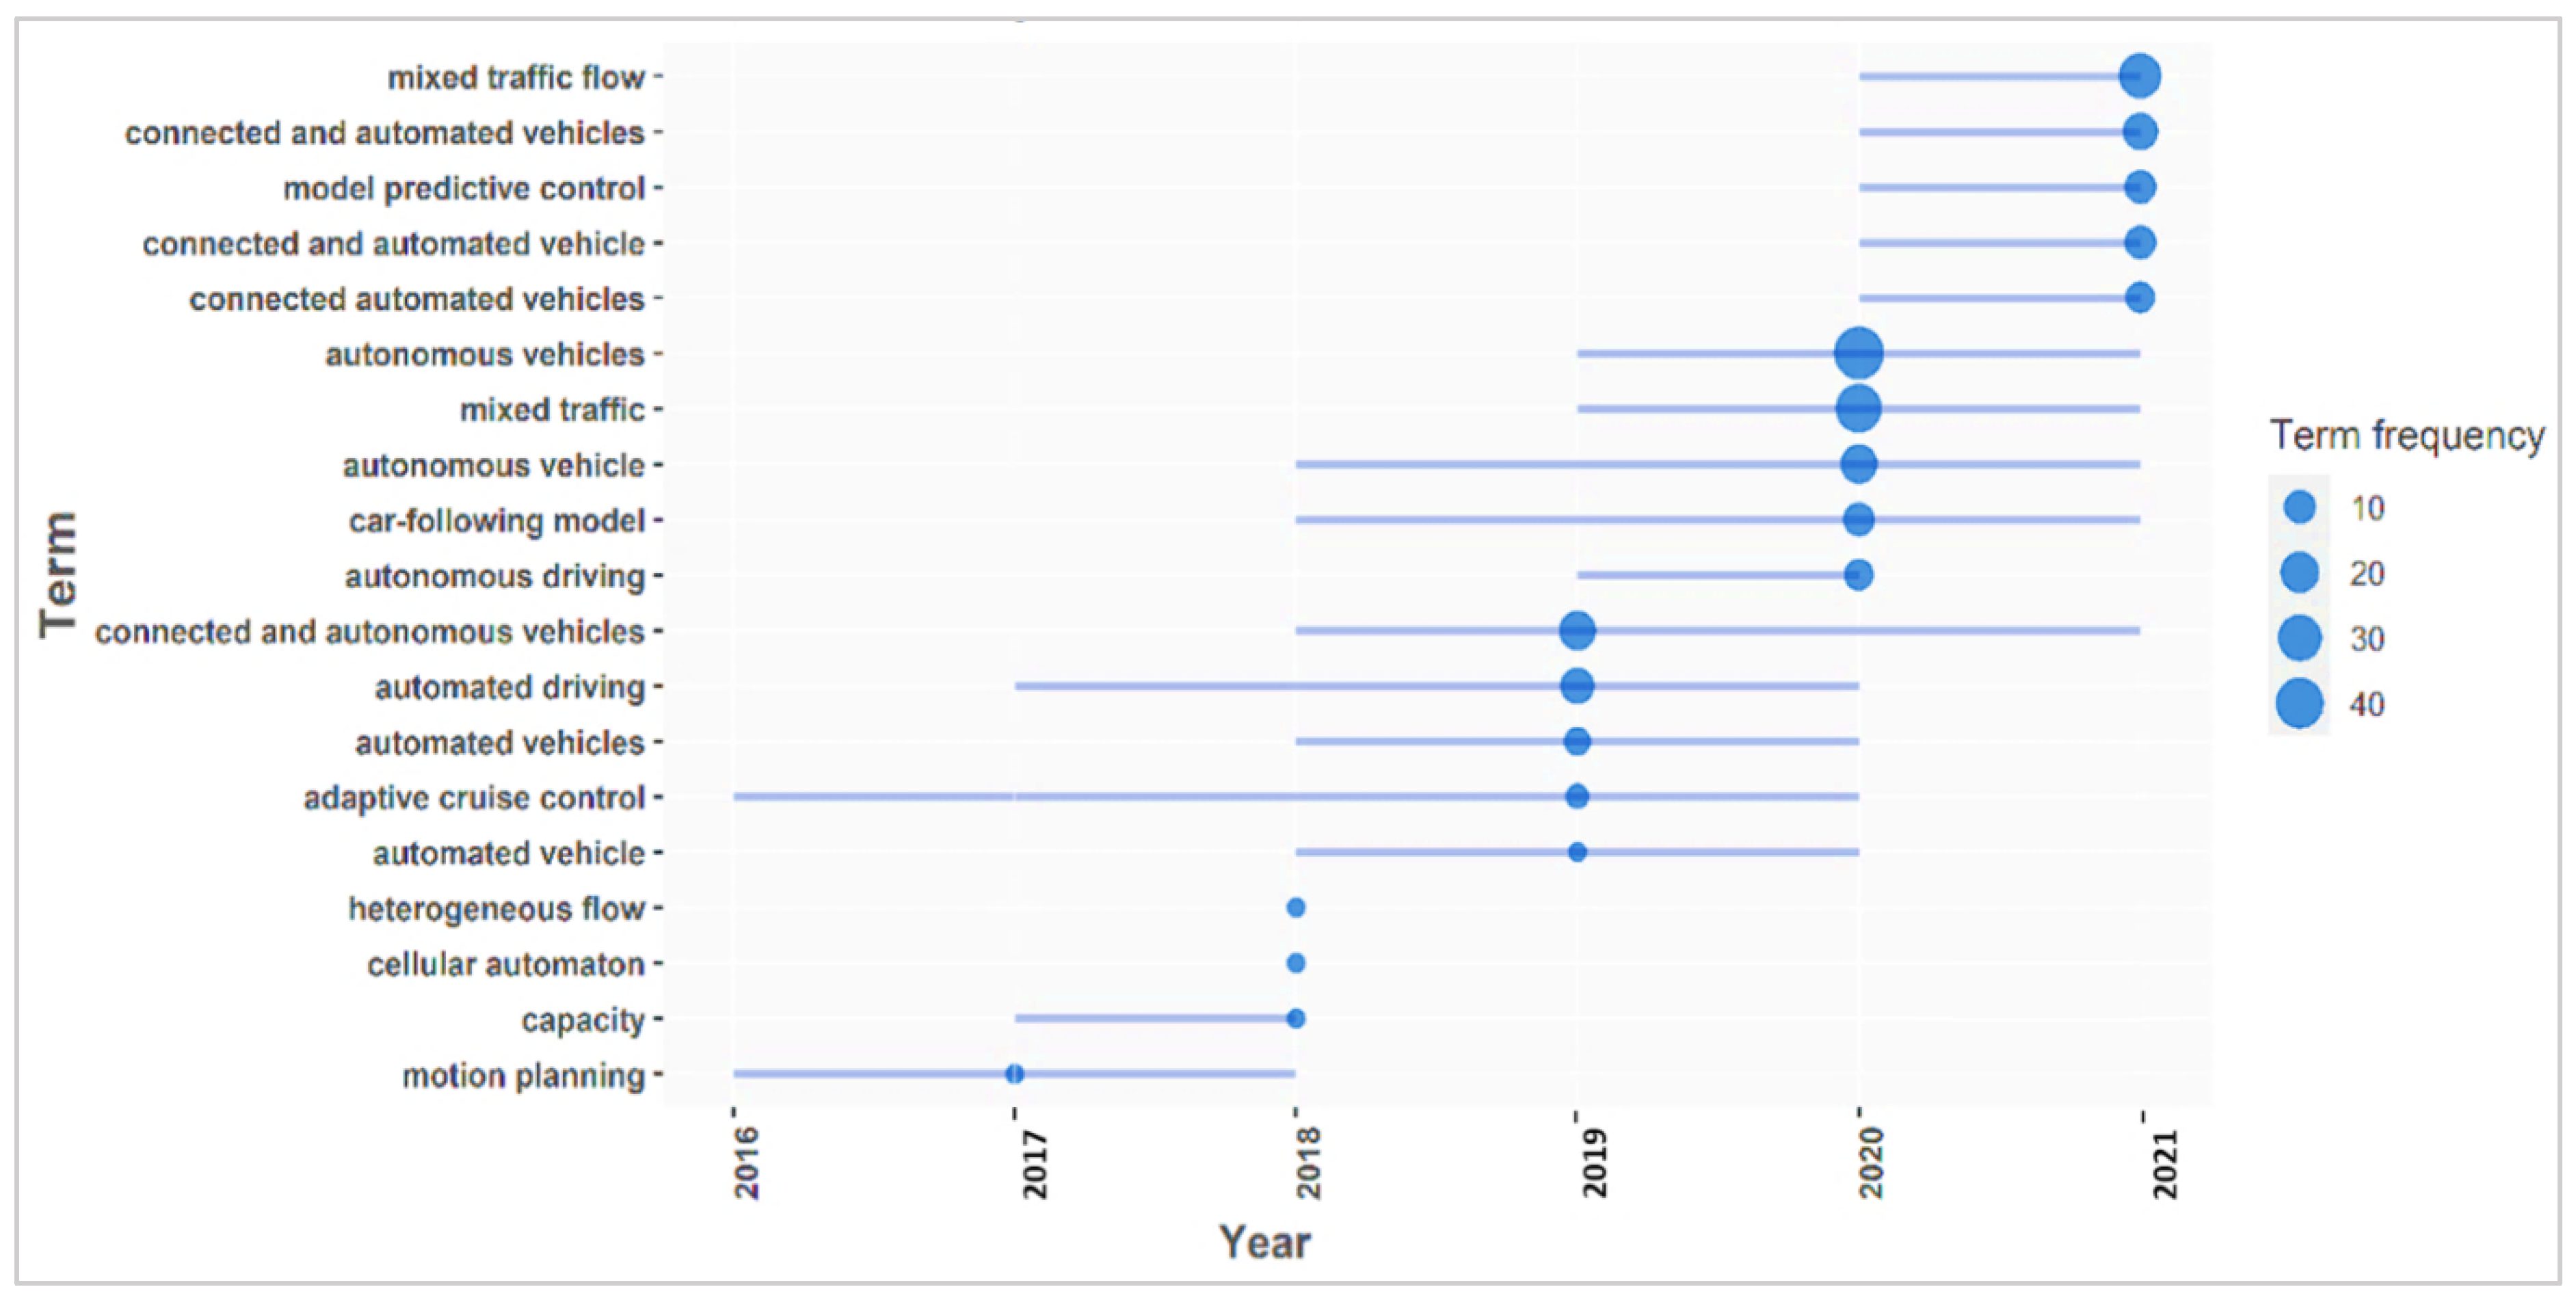
5.2. Trending Topics and Research Hotspots

Based on the occurrence frequency of author keywords, the trending research areas allied with autonomous vehicles in mixed traffic conditions for each specific year are shown in Figure 19 below. For a better demonstration, the minimum words per year were chosen as five and the minimum occurrence was set to three. A total of 19 words met the defined criteria spanning from 2016 to 2021. The size of the circle refers to the occurrence frequency of the author keyword. In 2017, some work had been published on the motion planning of autonomous vehicles. The capacity, cellular automation and heterogeneous flow were the most trending topics in 2018 but the smaller size of the circles denotes the fewer publications on these topics. In 2020, the terms “autonomous vehicles” and “mixed traffic” were the most occurring author keywords as specified by the greater size of the circles. In recent years, the most trending topics are related to the mixed traffic flow having both AVs and HVs. In 2021, the author keyword “mixed traffic flow” denoted by the greater size of the circle shows that this research area is of utmost importance to many researchers now and sufficient work is being published to advance this field.
In addition to the author keywords, the network map shown in Figure 20 below was created in VOSviewer by considering the index keywords with minimum occurrences of 15. The higher number for the minimum occurrences was used to reduce the keywords that appear on the map and to obtain the most closely linked research areas with the topic of concern. The concentration of any keyword is denoted by the size of the circle, and strength of its linkage with another area is specified by the thickness of the connecting line. The color scheme is used to identify the year-wise potential areas on which most the work is being published. Pertaining to the autonomous vehicles, the current research areas are transportation planning, traffic efficiency, reinforcement learning and trajectories of traffic flow. The smaller size of circle for these aforementioned areas show that the areas are under-saturated and more research is needed to signify these areas in the context of autonomous vehicles.
As seen in Figure 20, the other prominent areas which were a topic of interest to many researchers in recent years are mixed traffic flow, energy efficiency, heterogeneous traffic and automobile drivers. Among these index keywords, the mixed traffic flow has the larger size of circle showing significant research in this area and also the strongest link is observed between autonomous vehicles and mixed traffic flow. Although the research on mixed traffic flows is being carried out, the majority of it is still centered in developed economies having homogeneous traffic conditions. Only Europe and North America hold around 80% of the studies discussing the impacts of AVs [124,125]. The traffic conditions in developing economies are characterized by various factors which include: static and dynamic characteristics of the vehicles, non-lane-based movement, greater proportion of two-wheeler vehicles (motorcycles) and involvement of some unique three-wheeler vehicular classes, such as rickshaws and qingqis. Sufficient research on mixed traffic from the perspective of developing economies is needed to create a regional balance. The keywords “automobile drivers” and “energy efficiency” have smaller sizes of circles showing that these research areas are underexplored and need further research with a link with autonomous vehicles. Computer simulations, intelligent systems and intelligent vehicle highway systems were popular topics in previous years. Computer simulations have provided a competent means of exploring the various components and uncertainties associated with autonomous vehicles.

6. Concluding Remarks

The objective of this paper was to provide a landscape of the research in the area of autonomous vehicles in mixed traffic conditions. The specific data on the topic of concern were extracted from the Scopus database from 1999 to 2021. The use of a valid search string in the title and abstract field of Scopus produced 434 documents which were further screened and refined to 374 documents. The extracted data were used to conduct a systematic bibliometric analysis and visualization review to highlight the potential components and identify the hotspots in research. The research area pertaining to the autonomous vehicles in mixed traffic has gained immense scholarly attention as endorsed by the exponential increase in the number of publications since 2017. Based on the results of citation analysis, the most productive and highly cited article is by [53] with the title “Autonomous vehicles and connected vehicle systems: Flow and operations considerations” and published in Transportation science. The most productive and dominant source was the Transportation Research Part C: Emerging Technologies followed by the IEEE Conference on Intelligent Transportation Systems Proceedings (ITSC), and IEEE Transactions on Intelligent Transportation Systems. Among the potential authors, Ran, B. published the highest number of articles followed by Wang, H. The Southeast University, China emerged as the leading institution with the highest total publications of 27 and total citations of 94. Among the top ranking countries, the United States is the highest ranked country in terms of total publications and total citations, followed by China and Germany.
The “autonomous vehicle” was the leading author keyword contributing 16% followed by “mixed traffic” with a 13% contribution. On the relevance score, the terms “mixed traffic situation”, “cooperative adaptive cruise control” and “cellular automata and numerical simulation” showed the highest relevance values. The value relationships among the authors, keywords, sources, countries and institutions were produced and visualized with the help of the three field plots. The thematic map showed different themes of research during three different phases based on notable keywords. The research progress was divided into three phases: pre-development (1999–2017), development (2018–2020) and deployment (2021). The research hotspots indicate that the transportation planning, traffic efficiency, reinforcement learning and trajectories of traffic flow need to be explored in the context of autonomous vehicles. Computer simulations have been a competent method of exploring the different aspects of autonomous vehicles. The study highlighted various potential areas, such as the involvement of autonomous vehicles in transportation planning, interaction between autonomous vehicles and human-driven vehicles, traffic and energy efficiencies associated with automated driving, penetration rates for autonomous vehicles in mixed traffic scenarios and the safe and efficient operation of autonomous vehicles in mixed traffic environments. This paper provides ample future directions to the people willing to work on this area of autonomous vehicles in mixed traffic conditions.
The review summarized the findings based on three areas: impacts of AVs on mixed traffic, driving characteristics of AVs and various strategies to address different aspects of AVs for the case of mixed traffic. The studies endorsed the positive operational, safety and environmental impacts of AVs when simulated in mixed traffic streams. The review showed that VISSIM was the most frequently adopted simulation tool for the assessment of various scenarios involving AVs. For the driving characteristics of AVs, the studies showed that AVs maintain a smaller time headway, smaller standstill distances, strict speed deviation and less deviation in acceleration and deceleration compared with conventional vehicles. Most of the reported advantages of AVs are associated with the driving characteristics of AVs. The review also highlighted the strategies to understand the behavior of AVs in mixed traffic. The researchers provided the basis for the simulation frameworks, motion and trajectory planning, development of human-like driving models and the role of exclusive CAV lanes for the enhancement of operational efficiency. There are further studies in progress to provide a competent environment for the successful deployment of AVs in mixed traffic during the transition period. Further research topics can be comprehended by extracting the relevant data from databases and creating more visualization networks with a prior focus on other aspects, such as smart and responsive infrastructure, public transport aspects after introduction of autonomous vehicles in urban areas and performance of autonomous vehicles in a heterogeneous traffic environment having a higher proportion of two-wheelers.

Author Contributions

Conceptualization, M.A., S.A.H. and O.C.P.; methodology, M.A. and S.A.H.; software, M.A. and S.A.H.; validation, S.A.H. and O.C.P.; formal analysis, M.A.; investigation, M.A. and S.A.H.; resources, S.A.H.; data curation, M.A.; writing—original draft preparation, M.A.; writing—review and editing, M.A., S.A.H. and O.C.P.; supervision, S.A.H. and O.C.P.; funding acquisition, S.A.H. All authors have read and agreed to the published version of the manuscript.

Funding

This research was funded by the Universiti Teknologi Malaysia, vote number Q.J130000.2551.21H41 (PY/2019/01306).

Institutional Review Board Statement

Not applicable.

Informed Consent Statement

Not applicable.

Data Availability Statement

Not applicable.

Acknowledgments

The authors acknowledge financial support from the Universiti Teknologi Malaysia.

Conflicts of Interest

The authors declare no conflict of interest.

References

  1. Minelli, S.; Izadpanah, P.; Razavi, S. Evaluation of Connected Vehicle Impact on Mobility and Mode Choice. J. Traffic Transp. Eng. 2015, 2, 301–312. [Google Scholar] [CrossRef]
  2. Hashim, H.H.; Omar, M.Z. Towards Autonomous Vehicle Implementation: Issues and Opportunities. J. Soc. Automot. Eng. Malaysia 2017, 1, 111–123. [Google Scholar] [CrossRef]
  3. Jana, A.; Sarkar, A.; Kallakurchi, J.; Kumar, S. Autonomous Vehicle as a Future Mode of Transport in India: Analyzing the Perception, Opportunities and Hurdles. In Proceedings of the Eastern Asia Society for Transportation Studies, Colombo, Sri Lanka, 9–12 September 2019. [Google Scholar]
  4. Buehler, M.; Iagnemma, K.; Singh, S. Autonomous Vehicles in City Traffic. In The DARPA Urban Challenge; Springer: Berlin/Heidelberg, Germany, 2009; Volume 56. [Google Scholar]
  5. Fagnant, D.J.; Kockelman, K. Preparing a Nation for Autonomous Vehicles: Opportunities, Barriers and Policy Recommendations. Transp. Res. Part A Policy Pract. 2015, 77, 167–181. [Google Scholar] [CrossRef]
  6. Bierstedt, J.; Gooze, A.; Gray, C.; Peterman, J.; Raykin, L.; Walters, J. Effects of Next-Generation Vehicles on Travel Demand and Highway Capacity. Available online: https://www.urbanismnext.org/resources/effects-of-next-generation-vehicles-on-travel-demand-and-highway-capacity (accessed on 27 July 2022).
  7. Silberg, G.; Wallace, R. Self-Driving Cars: The Next Revolution; KPMG LLP Center Automotive Research: Ann Arbor, MI, USA, 2012; Volume 9, pp. 132–146. [Google Scholar]
  8. Chehri, A.; Mouftah, H.T. Autonomous Vehicles in the Sustainable Cities, the Beginning of a Green Adventure. Sustain. Cities Soc. 2019, 51, 101751. [Google Scholar] [CrossRef]
  9. Sohrweide, T. Driverless Vehicles Set to Change the Way We Design Our Roadways? Short Elliott Hendrickson Inc.: Saint Paul, MN, USA, 2018. [Google Scholar]
  10. Talebpour, A.; Mahmassani, H.S. Influence of Connected and Autonomous Vehicles on Traffic Flow Stability and Throughput. Transp. Res. Part C Emerg. Technol. 2016, 71, 143–163. [Google Scholar] [CrossRef]
  11. Patella, S.M.; Scrucca, F.; Asdrubali, F.; Carrese, S. Carbon Footprint of Autonomous Vehicles at the Urban Mobility System Level: A Traffic Simulation-Based Approach. Transp. Res. Part D Transp. Environ. 2019, 74, 189–200. [Google Scholar] [CrossRef]
  12. Tibljaš, A.D.; Giuffrè, T.; Surdonja, S.; Trubia, S. Introduction of Autonomous Vehicles: Roundabouts Design and Safety Performance Evaluation. Sustainability 2018, 10, 1060. [Google Scholar] [CrossRef]
  13. Morando, M.M.; Tian, Q.; Truong, L.T.; Vu, H.L. Studying the Safety Impact of Autonomous Vehicles Using Simulation-Based Surrogate Safety Measures. J. Adv. Transp. 2018, 2018, 6135183. [Google Scholar] [CrossRef]
  14. Papadoulis, A.; Quddus, M.; Imprialou, M. Evaluating the Safety Impact of Connected and Autonomous Vehicles on Motorways. Accid. Anal. Prev. 2019, 124, 12–22. [Google Scholar] [CrossRef]
  15. Bansal, P.; Kockelman, K.M. Forecasting Americans’ Long-Term Adoption of Connected and Autonomous Vehicle Technologies. Transp. Res. Part A Policy Pract. 2017, 95, 49–63. [Google Scholar] [CrossRef]
  16. Xie, H.; Tanin, E.; Karunasekera, S.; Qi, J.; Zhang, R.; Kulik, L.; Ramamohanarao, K. Quantifying the Impact of Autonomous Vehicles Using Microscopic Simulations. In Proceedings of the IWCTS 2019—12th International Workshop on Computational Transportation Science, Chicago, IL, USA, 5–8 November 2019; pp. 1–10. [Google Scholar]
  17. Fagnant, D.J. The Future of Fully Automated Vehicles: Opportunities for Vehicle- and Ride-Sharing, with Cost and Emissions Savings; Texas A&M Transportation Institute: College Station, TX, USA, 2014. [Google Scholar]
  18. Kockelman, A.K.; Avery, P.; Bansal, P.; Boyles, S.D.; Bujanovic, P.; Choudhary, T.; Clements, L.; Domnenko, G.; Fagnant, D.; Helsel, J.; et al. Implications of Connected and Automated Vehicles on the Safety and Operations of Roadway Networks: A Final Report; The University of Texas: Austin, TX, USA, 2016. [Google Scholar]
  19. Joshi, D.J.; Kale, I.; Gandewar, S.; Korate, O.; Patwari, D.; Patil, S. Reinforcement Learning: A Survey; Springer: Singapore, 2021; Volume 1311. [Google Scholar]
  20. Litman, T. Autonomous Vehicle Implementation Predictions; Victoria Transport Policy Institute: Victoria, BC, Canada, 2022. [Google Scholar]
  21. Sinha, A.; Chand, S.; Wijayaratna, K.P.; Virdi, N.; Dixit, V. Comprehensive Safety Assessment in Mixed Fleets with Connected and Automated Vehicles: A Crash Severity and Rate Evaluation of Conventional Vehicles. Accid. Anal. Prev. 2020, 142, 105567. [Google Scholar] [CrossRef]
  22. Almobayedh, H.B. Simulation of the Impact of Connected and Automated Vehicles at a Signalized Intersection; University of Dayton: Dayton, OH, USA, 2019. [Google Scholar]
  23. Zhang, G. Connected Autonomous Vehicle Control Optimization at Intersections. In Advances in Intelligent Systems and Computing; Springer: Cham, Switzerland, 2017; Volume 454, pp. 5–6. [Google Scholar]
  24. Sun, W.; Zheng, J.; Liu, H.X. A Capacity Maximization Scheme for Intersection Management with Automated Vehicles. Transp. Res. Procedia 2017, 23, 121–136. [Google Scholar] [CrossRef]
  25. Alfaseeh, L.; Djavadian, S.; Farooq, B. Impact of Distributed Routing of Intelligent Vehicles on Urban Traffic. In Proceedings of the 2018 IEEE International Smart Cities Conference (ISC2 2018), Kansas City, MO, USA, 16–19 September 2018; Institute of Electrical and Electronics Engineers Inc.: Toronto, ON, Canada, 2019. [Google Scholar]
  26. Rios-Torres, J.; Malikopoulos, A.A. Impact of Partial Penetrations of Connected and Automated Vehicles on Fuel Consumption and Traffic Flow. IEEE Trans. Intell. Veh. 2018, 3, 453–462. [Google Scholar] [CrossRef]
  27. Maarafi, A. The Impact of Autonomous Vehicles on Freeway Throughput. Master’s Thesis, West Virginia University, Morgantown, WV, USA, 2015. [Google Scholar]
  28. Aria, E.; Olstam, J.; Schwietering, C. Investigation of Automated Vehicle e Ffects on Driver’s Behavior and Traffic Performance. Transp. Res. Procedia 2016, 15, 761–770. [Google Scholar] [CrossRef]
  29. Motamedidehkordi, N.; Margreiter, M.; Benz, T. Effects of Connected Highly Automated Vehicles on the Propagation of Congested Patterns on Freeways. In Proceedings of the Transportation Research Board 95th Annual Meeting, Washington, DC, USA, 10–14 January 2016; pp. 1–16. [Google Scholar] [CrossRef]
  30. Khashayarfard, M.; Nassiri, H. Studying the Simultaneous Effect of Autonomous Vehicles and Distracted Driving on Safety at Unsignalized Intersections. J. Adv. Transp. 2021, 2021, 6677010. [Google Scholar] [CrossRef]
  31. El-Hansali, Y.; Farrag, S.; Yasar, A.; Shakshuki, E.; Al-Abri, K. Using Surrogate Measures to Evaluate the Safety of Autonomous Vehicles. Procedia Comput. Sci. 2021, 191, 151–159. [Google Scholar] [CrossRef]
  32. Mousavi, S.M.; Osman, O.A.; Lord, D.; Dixon, K.K.; Dadashova, B. Investigating the Safety and Operational Benefits of Mixed Traffic Environments with Different Automated Vehicle Market Penetration Rates in the Proximity of a Driveway on an Urban Arterial. Accid. Anal. Prev. 2021, 152, 105982. [Google Scholar] [CrossRef] [PubMed]
  33. Postigo, I.; Olstam, J.; Rydergren, C. Effects on Traffic Performance Due to Heterogeneity of Automated Vehicles on Motorways: A Microscopic Simulation Study. In Proceedings of the VEHITS 2021 7th International Conference on Vehicle Technology and Intelligent Transport Systems, Oline, 28–30 April 2021; pp. 142–151. [Google Scholar]
  34. Hertel, T.W.; Reimer, J.J. Predicting the Poverty Impacts of Trade Reform. J. Int. Trade Econ. Dev. 2005, 14, 377–405. [Google Scholar] [CrossRef]
  35. Evanson, A. Connected Autonomous Vehicle (CAV) Simulation Using PTV Vissim. In Proceedings of the 2017 Winter Simulation Conference, Las Vegas, NV, USA, 3–6 December 2017; pp. 4420–4425. [Google Scholar]
  36. Wang, Y.; Wang, L. Autonomous Vehicles’ Performance on Single Lane Road: A Simulation under VISSIM Environment. In Proceedings of the 2017 10th International Congress on Image and Signal Processing, BioMedical Engineering and Informatics, CISP-BMEI, Shanghai, China, 14–16 October 2017. [Google Scholar]
  37. Zhong, Z.; Lee, E.E. Alternative Intersection Designs with Connected and Automated Vehicle. In Proceedings of the 2019 IEEE 2nd Connected and Automated Vehicles Symposium (CAVS), Honolulu, HI, USA, 22–23 September 2019. [Google Scholar]
  38. Yu, H.; Tak, S.; Park, M.; Yeo, H. Impact of Autonomous-Vehicle-Only Lanes in Mixed Traffic Conditions. Transp. Res. Rec. 2019, 2673, 430–439. [Google Scholar] [CrossRef]
  39. Stogios, C.; Kasraian, D.; Roorda, M.J.; Hatzopoulou, M. Simulating Impacts of Automated Driving Behavior and Traffic Conditions on Vehicle Emissions. Transp. Res. Part D Transp. Environ. 2019, 76, 176–192. [Google Scholar] [CrossRef]
  40. Tomás, R.F.; Fernandes, P.; MacEdo, E.; Bandeira, J.M.; Coelho, M.C. Assessing the Emission Impacts of Autonomous Vehicles on Metropolitan Freeways. Transp. Res. Procedia 2020, 47, 617–624. [Google Scholar] [CrossRef]
  41. Khondaker, B.; Kattan, L. Variable Speed Limit: A Microscopic Analysis in a Connected Vehicle Environment. Transp. Res. Part C Emerg. Technol. 2015, 58, 146–159. [Google Scholar] [CrossRef]
  42. Li, D.; Wagner, P. Impacts of Gradual Automated Vehicle Penetration on Motorway Operation: A Comprehensive Evaluation. Eur. Transp. Res. Rev. 2019, 11, 36. [Google Scholar] [CrossRef]
  43. Rosique, F.; Navarro, P.J.; Fernández, C.; Padilla, A. A Systematic Review of Perception System and Simulators for Autonomous Vehicles Research. Sensors 2019, 19, 648. [Google Scholar] [CrossRef]
  44. Overtoom, I.; Correia, G.; Huang, Y.; Verbraeck, A. Assessing the Impacts of Shared Autonomous Vehicles on Congestion and Curb Use: A Traffic Simulation Study in The Hague, Netherlands. Int. J. Transp. Sci. Technol. 2020, 9, 195–206. [Google Scholar] [CrossRef]
  45. ElSahly, O.; Abdelfatah, A. Influence of Autonomous Vehicles on Freeway Traffic Performance for Undersaturated Traffic Conditions. Athens J. Τechnol. Eng. 2020, 7, 117–132. [Google Scholar] [CrossRef]
  46. Eissler, C.; Kaufmann, S. Model Calibration to Simulate Driving Recommendations for Traffic Flow Optimization in Oversaturated City Traffic. Procedia Comput. Sci. 2020, 170, 482–489. [Google Scholar] [CrossRef]
  47. Stanek, D.; Huang, E.; Milam, R.T.; Wang, A. Measuring Autonomous Vehicle Impacts on Congested Networks Using Simulation. In Proceedings of the Transportation Research Board Annual Meeting, Washington, DC, USA, 7–11 January 2018; Volume 18, pp. 1–19. [Google Scholar]
  48. Sukennik, P. Micro-Simulation Guide for Automated Vehicles; PTV Group: Karlsruhe, Germany, 2018. [Google Scholar]
  49. Olia, A.; Razavi, S.; Abdulhai, B.; Abdelgawad, H. Traffic Capacity Implications of Automated Vehicles Mixed with Regular Vehicles. J. Intell. Transp. Syst. Technol. Plan. Oper. 2018, 22, 244–262. [Google Scholar] [CrossRef]
  50. Stogios, C. Investigating the Effects of Automated Vehicle Driving Operations on Road Emissions and Traffic Performance. Master Thesis, University of Toronto, Toronto, ON, Canada, 2018. [Google Scholar]
  51. Atkins Research on the Impacts of Connected and Autonomous Vehicles (CAVs) on Traffic Flow Stage 2: Traffic Modelling and Analysis Technical Report. 2016. Available online: https://www.gov.uk/government/uploads/system/uploads/attachment_data/file/530091/impacts-of-connected-and-autonomous-vehicles-on-traffic-flow-summary-report.pdf (accessed on 18 April 2022).
  52. Jamson, A.H.; Merat, N.; Carsten, O.M.J.; Lai, F.C.H. Behavioural Changes in Drivers Experiencing Highly-Automated Vehicle Control in Varying Traffic Conditions. Transp. Res. Part C Emerg. Technol. 2013, 30, 116–125. [Google Scholar] [CrossRef] [Green Version]
  53. Mahmassani, H.S. Autonomous Vehicles and Connected Vehicle Systems: Flow and Operations Considerations. Transp. Sci. 2016, 50, 1140–1162. [Google Scholar] [CrossRef]
  54. Calvert, S.C.; van Arem, B. A Generic Multi-Level Framework for Microscopic Traffic Simulation with Automated Vehicles in Mixed Traffic. Transp. Res. Part C Emerg. Technol. 2020, 110, 291–311. [Google Scholar] [CrossRef]
  55. Zhang, Y.; Cassandras, C.G. The Penetration Effect of Connected Automated Vehicles in Urban Traffic: An Energy Impact Study. In Proceedings of the 2nd IEEE Conference on Control Technology and Applications, CCTA 2018, Copenhagen, Denmark, 21–24 August 2018; Institute of Electrical and Electronics Engineers Inc., Division of Systems Engineering, Center for Information and Systems Engineering, Boston University: Boston, MA, USA, 2018; pp. 620–625. [Google Scholar]
  56. Seraj, M.; Li, J.; Qiu, Z.; Wu, G. Modeling Microscopic Car-Following Strategy of Mixed Traffic to Identify Optimal Platoon Configurations for Multiobjective Decision-Making. J. Adv. Transp. 2018, 2018, 7835010. [Google Scholar] [CrossRef]
  57. Ghiasi, A.; Hussain, O.; Qian, Z.; Li, X. A Mixed Traffic Capacity Analysis and Lane Management Model for Connected Automated Vehicles: A Markov Chain Method. Transp. Res. Part B Methodol. 2017, 106, 266–292. [Google Scholar] [CrossRef]
  58. Qin, Y.Y.; Wang, H. Improving Traffic Safety via Traffic Flow Optimization of Connected and Automated Vehicles. China J. Highw. Transp. 2018, 31, 202–210. [Google Scholar]
  59. Lee, S.; Jeong, E.; Oh, M.; Oh, C. Driving Aggressiveness Management Policy to Enhance the Performance of Mixed Traffic Conditions in Automated Driving Environments. Transp. Res. Part A Policy Pract. 2019, 121, 136–146. [Google Scholar] [CrossRef]
  60. Ye, L.; Yamamoto, T. Modeling Connected and Autonomous Vehicles in Heterogeneous Traffic Flow. Phys. A Stat. Mech. Its Appl. 2018, 490, 269–277. [Google Scholar] [CrossRef]
  61. Jin, S.; Sun, D.H.; Zhao, M.; Li, Y.; Chen, J. Modeling and Stability Analysis of Mixed Traffic with Conventional and Connected Automated Vehicles from Cyber Physical Perspective. Phys. A Stat. Mech. Its Appl. 2020, 551, 124217. [Google Scholar] [CrossRef]
  62. Mohajerpoor, R.; Ramezani, M. Mixed Flow of Autonomous and Human-Driven Vehicles: Analytical Headway Modeling and Optimal Lane Management. Transp. Res. Part C Emerg. Technol. 2019, 109, 194–210. [Google Scholar] [CrossRef]
  63. Fu, R.; Li, Z.; Sun, Q.; Wang, C. Human-like Car-Following Model for Autonomous Vehicles Considering the Cut-in Behavior of Other Vehicles in Mixed Traffic. Accid. Anal. Prev. 2019, 132, 105260. [Google Scholar] [CrossRef]
  64. Ma, Y.; Zhu, X.; Zhang, S.; Yang, R.; Wang, W.; Manocha, D. TrafficPredict: Trajectory Prediction for Heterogeneous Traffic-Agents. Proc. AAAI Conf. Artif. Intell. 2019, 33, 6120–6127. [Google Scholar] [CrossRef] [Green Version]
  65. Ghiasi, A.; Li, X.; Ma, J. A Mixed Traffic Speed Harmonization Model with Connected Autonomous Vehicles. Transp. Res. Part C Emerg. Technol. 2019, 104, 210–233. [Google Scholar] [CrossRef]
  66. Zhong, Z.; Lee, E.E.; Nejad, M.; Lee, J. Influence of CAV Clustering Strategies on Mixed Traffic Flow Characteristics: An Analysis of Vehicle Trajectory Data. arXiv 2020, arXiv:2003.08290. [Google Scholar] [CrossRef]
  67. Wang, Y.; Wei, L.; Chen, P. Trajectory Reconstruction for Freeway Traffic Mixed with Human-Driven Vehicles and Connected and Automated Vehicles. Transp. Res. Part C Emerg. Technol. 2020, 111, 135–155. [Google Scholar] [CrossRef]
  68. Sharath, M.N.; Velaga, N.R. Enhanced Intelligent Driver Model for Two-Dimensional Motion Planning in Mixed Traffic. Transp. Res. Part C Emerg. Technol. 2020, 120, 102780. [Google Scholar] [CrossRef]
  69. González Debada, E. Motion Planning for CAVs in Mixed Traffic, a Study on Roundabouts; EPFL: Lausanne, Switzerland, 2020. [Google Scholar] [CrossRef]
  70. Chen, Z.; He, F.; Zhang, L.; Yin, Y. Optimal Deployment of Autonomous Vehicle Lanes with Endogenous Market Penetration. Transp. Res. Part C Emerg. Technol. 2016, 72, 143–156. [Google Scholar] [CrossRef]
  71. Ye, L.; Yamamoto, T. Impact of Dedicated Lanes for Connected and Autonomous Vehicle on Traffic Flow Throughput. Phys. A Stat. Mech. Its Appl. 2018, 512, 588–597. [Google Scholar] [CrossRef]
  72. Ma, K.; Wang, H. Influence of Exclusive Lanes for Connected and Autonomous Vehicles on Freeway Traffic Flow. IEEE Access 2019, 7, 50168–50178. [Google Scholar] [CrossRef]
  73. Rehman, S.U.; Butt, F.M.; Ashiq, M.; Minhas, K.S.; Ajmal Khan, M. Bibliometric Analysis of Road Traffic Injuries Research in the Gulf Cooperation Council Region. F1000Research 2020, 9, 1155. [Google Scholar] [CrossRef]
  74. Wallin, J.A. Bibliometric Methods: Pitfalls and Possibilities. Basic Clin. Pharmacol. Toxicol. 2005, 97, 261–275. [Google Scholar] [CrossRef]
  75. Lin, Y.; Jia, H.; Zou, B.; Miao, H.; Wu, R.; Tian, J.; Wang, G. Multiobjective Environmentally Sustainable Optimal Design of Dedicated Connected Autonomous Vehicle Lanes. Sustainability 2021, 13, 3454. [Google Scholar] [CrossRef]
  76. Gandia, R.M.; Antonialli, F.; Cavazza, B.H.; Neto, A.M.; Lima, D.A.D.; Sugano, J.Y.; Nicolai, I.; Zambalde, A.L. Autonomous Vehicles: Scientometric and Bibliometric Review *. Transp. Rev. 2019, 39, 9–28. [Google Scholar] [CrossRef]
  77. Wang, S.; Yu, J. A Bibliometric Research on Next-Generation Vehicles Using Citespace. Recycling 2021, 6, 14. [Google Scholar] [CrossRef]
  78. Kushairi, N.; Ahmi, A. Flipped Classroom in the Second Decade of the Millenia: A Bibliometrics Analysis with Lotka’s Law. Educ. Inf. Technol. 2021, 26, 4401–4431. [Google Scholar] [CrossRef] [PubMed]
  79. Burnham, J.F. Scopus Database: A Review. Biomed. Digit. Libr. 2006, 3, 1–8. [Google Scholar] [CrossRef]
  80. Anik, M.A.H.; Hossain, M.; Habib, M.A. Investigation of Pedestrian Jaywalking Behaviour at Mid-Block Locations Using Artificial Neural Networks. Saf. Sci. 2021, 144, 105448. [Google Scholar] [CrossRef]
  81. Asha, A.Z.; Smith, C.; Freeman, G.; Crump, S.; Somanath, S.; Oehlberg, L.; Sharlin, E. Co-Designing Interactions between Pedestrians in Wheelchairs and Autonomous Vehicles; Association for Computing Machinery: New York, NY, USA, 2021; pp. 339–351. [Google Scholar] [CrossRef]
  82. Cooney, M.; Valle, F.; Vinel, A. Robot First Aid: Autonomous Vehicles Could Help in Emergencies. In Proceedings of the 2021 Swedish Artificial Intelligence Society Workshop (SAIS), Luleå, Sweden, 14–15 June 2021. [Google Scholar] [CrossRef]
  83. Yu, J.; Chen, A. Differentiating and Modeling the Installation and the Usage of Autonomous Vehicle Technologies: A System Dynamics Approach for Policy Impact Studies. Transp. Res. Part C Emerg. Technol. 2021, 127, 103089. [Google Scholar] [CrossRef]
  84. Camara, F.; Dickinson, P.; Fox, C. Evaluating Pedestrian Interaction Preferences with a Game Theoretic Autonomous Vehicle in Virtual Reality. Transp. Res. Part F Traffic Psychol. Behav. 2021, 78, 410–423. [Google Scholar] [CrossRef]
  85. Di, X.; Shi, R. A Survey on Autonomous Vehicle Control in the Era of Mixed-Autonomy: From Physics-Based to AI-Guided Driving Policy Learning. arXiv 2020, arXiv:2007.05156. [Google Scholar] [CrossRef]
  86. Ramana, A.S.V.; Jabari, S.E. Power Laws and Phase Transitions in Heterogenous Car Following with Reaction Times. Phys. Rev. E 2021, 103, 032202. [Google Scholar] [CrossRef]
  87. Gonzalez-Delicado, J.J.; Gozalvez, J.; Mena-Oreja, J.; Sepulcre, M.; Coll-Perales, B. Alicante-Murcia Freeway Scenario: A High-Accuracy and Large-Scale Traffic Simulation Scenario Generated Using a Novel Traffic Demand Calibration Method in SUMO. IEEE Access 2021, 9, 154423–154434. [Google Scholar] [CrossRef]
  88. Stange, V.; Goralzik, A.; Vollrath, M. Keep Your Distance, Automated Vehicle!—Configuration of Automated Driving Behavior at an Urban Junction from a Cyclist’s Perspective. Lect. Notes Networks Syst. 2021, 270, 393–402. [Google Scholar] [CrossRef]
  89. Amini, R.E.; Dhamaniya, A.; Antoniou, C. Towards a Game Theoretic Approach to Model Pedestrian Road Crossings. Transp. Res. Procedia 2021, 52, 692–699. [Google Scholar] [CrossRef]
  90. Caballero, W.N.; Ríos Insua, D.; Banks, D. Decision Support Issues in Automated Driving Systems. Int. Trans. Oper. Res. 2021. [Google Scholar] [CrossRef]
  91. Chen, H.; Zhang, X.; Yang, W.; Jin, W.; Zhu, W.; Zhao, B. W/CDM-MSFM-Driven Pedestrian Path Prediction at Signalized Crosswalk with Mixed Traffic Flow. Transp. B Transp. Dyn. 2020, 9, 172–197. [Google Scholar] [CrossRef]
  92. Koch, A.; Teichert, O.; Kalt, S.; Ongel, A.; Lienkamp, M. Powertrain Optimization for Electric Buses under Optimal Energy-Efficient Driving. Energies 2020, 13, 6451. [Google Scholar] [CrossRef]
  93. Padma, A.M.; Alsheikh, A.B.; Song, M.J.; Lundgren, M.; Andersson, J.; Enerbäck, O.; Dolins, S. User Acceptance of Mixed-Traffic Autonomous Shuttles in Gothenburg, Sweden. IOP Conf. Ser. Earth Environ. Sci. 2020, 588, 042002. [Google Scholar] [CrossRef]
  94. Feys, M.; Rombaut, E.; Vanhaverbeke, L. Experience and Acceptance of Autonomous Shuttles in the Brussels Capital Region. Sustainability 2020, 12, 8403. [Google Scholar] [CrossRef]
  95. Hilgarter, K.; Granig, P. Public Perception of Autonomous Vehicles: A Qualitative Study Based on Interviews after Riding an Autonomous Shuttle. Transp. Res. Part F Traffic Psychol. Behav. 2020, 72, 226–243. [Google Scholar] [CrossRef]
  96. Kalatian, A.; Farooq, B. DeepWait: Pedestrian Wait Time Estimation in Mixed Traffic Conditions Using Deep Survival Analysis. arXiv 2019, arXiv:1904.11008. [Google Scholar] [CrossRef]
  97. Holländer, K. A Pedestrian Perspective on Autonomous Vehicles. In Proceedings of the IUI 2019 24th International Conference on Intelligent User Interfaces, Marina del Ray, CA, USA, 10–14 March 2019; pp. 149–150. [Google Scholar]
  98. Gandhi, P.; Luo, X.; Tian, R. Modeling Vehicle-Pedestrian Encountering Risks in the Natural Driving Environment Using Machine Learning Algorithms; Springer: Cham, Switzerland, 2019; Volume 11581, pp. 382–393. [Google Scholar] [CrossRef]
  99. Chen, T.; Chen, F.; Chen, C. Review on Driverless Traffic from Management Perspective. MATEC Web Conf. 2017, 124, 03002. [Google Scholar] [CrossRef]
  100. Forchhammer, N.; Lim, P.Y.; Cornet, H.; Frenkler, F. A Virtual Reality Study on How Communication and Gamification Influence Driver Compliance and Emotion. In Proceedings of the DSC 2020 EUROPE Driving Simulation and Virtual Reality Conference and Exhibition, Strasbourg, France, 9–11 September 2020; pp. 141–146. [Google Scholar]
  101. Zakaria, R.; Ahmi, A.; Ahmad, A.H.; Othman, Z. Worldwide Melatonin Research: A Bibliometric Analysis of the Published Literature between 2015 and 2019. Chronobiol. Int. 2021, 38, 27–37. [Google Scholar] [CrossRef] [PubMed]
  102. Khudzari, J.M.; Kurian, J.; Tartakovsky, B.; Raghavan, G.S.V. Bibliometric Analysis of Global Research Trends on Microbial Fuel Cells Using Scopus Database. Biochem. Eng. J. 2018, 136, 51–60. [Google Scholar] [CrossRef]
  103. Rillings, J.H. Automated Highways. Sci. Am. 1997, 277, 80–85. [Google Scholar] [CrossRef]
  104. Behringer, R. The DARPA Grand Challenge—Autonomous Ground Vehicles in the Desert. IFAC Proc. Vol. 2004, 37, 904–909. [Google Scholar] [CrossRef]
  105. Endo, S.; Ukawa, H.; Sanada, K.; Kitagawa, A. Study on Speed Control Law for Automated Driving of Heavy-Duty Vehicles Considering Acceleration Characteristics (Simulation of Transient Responses). JSAE Rev. 1999, 20, 331–336. [Google Scholar] [CrossRef]
  106. Merat, N.; Louw, T.; Madigan, R.; Wilbrink, M.; Schieben, A. What Externally Presented Information Do VRUs Require When Interacting with Fully Automated Road Transport Systems in Shared Space? Accid. Anal. Prev. 2018, 118, 244–252. [Google Scholar] [CrossRef]
  107. Gong, S.; Du, L. Cooperative Platoon Control for a Mixed Traffic Flow Including Human Drive Vehicles and Connected and Autonomous Vehicles. Transp. Res. Part B Methodol. 2018, 116, 25–61. [Google Scholar] [CrossRef]
  108. Guo, Y.; Ma, J.; Xiong, C.; Li, X.; Zhou, F.; Hao, W. Joint Optimization of Vehicle Trajectories and Intersection Controllers with Connected Automated Vehicles: Combined Dynamic Programming and Shooting Heuristic Approach. Transp. Res. Part C Emerg. Technol. 2019, 98, 54–72. [Google Scholar] [CrossRef]
  109. Fayazi, S.A.; Vahidi, A. Mixed-Integer Linear Programming for Optimal Scheduling of Autonomous Vehicle Intersection Crossing. IEEE Trans. Intell. Veh. 2018, 3, 287–299. [Google Scholar] [CrossRef]
  110. Waltman, L.; van Eck, N.J.; Noyons, E.C.M. A Unified Approach to Mapping and Clustering of Bibliometric Networks. J. Informetr. 2010, 4, 629–635. [Google Scholar] [CrossRef]
  111. Yao, Z.; Hu, R.; Wang, Y.; Jiang, Y.; Ran, B.; Chen, Y. Stability Analysis and the Fundamental Diagram for Mixed Connected Automated and Human-Driven Vehicles. Phys. A Stat. Mech. Its Appl. 2019, 533, 121931. [Google Scholar] [CrossRef]
  112. Liu, Y.; Guo, J.; Taplin, J.; Wang, Y. Characteristic Analysis of Mixed Traffic Flow of Regular and Autonomous Vehicles Using Cellular Automata. J. Adv. Transp. 2017, 2017, 8142074. [Google Scholar] [CrossRef]
  113. Zhao, X.; Wang, Z.; Xu, Z.; Wang, Y.; Li, X.; Qu, X. Field Experiments on Longitudinal Characteristics of Human Driver Behavior Following an Autonomous Vehicle. Transp. Res. Part C Emerg. Technol. 2020, 114, 205–224. [Google Scholar] [CrossRef]
  114. Van Eck, N.J.; Waltman, L. Software Survey: VOSviewer, a Computer Program for Bibliometric Mapping. Scientometrics 2010, 84, 523–538. [Google Scholar] [CrossRef] [PubMed]
  115. van Eck, N.J.; Waltman, L. Visualizing Bibliometric Networks. In Measuring Scholarly Impact; Springer: Cham, Switzerland, 2014; pp. 285–320. [Google Scholar]
  116. Aria, M.; Cuccurullo, C. Bibliometrix: An R-Tool for Comprehensive Science Mapping Analysis. J. Informetr. 2017, 11, 959–975. [Google Scholar] [CrossRef]
  117. Kukkala, V.K.; Tunnell, J.; Pasricha, S.; Bradley, T. Advanced Driver-Assistance Systems: A Path Toward Autonomous Vehicles. IEEE Consum. Electron. Mag. 2018, 7, 18–25. [Google Scholar] [CrossRef]
  118. Park, J.E.; Byun, W.; Kim, Y.; Ahn, H.; Shin, D.K. The Impact of Automated Vehicles on Traffic Flow and Road Capacity on Urban Road Networks. J. Adv. Transp. 2021, 2021, 8404951. [Google Scholar] [CrossRef]
  119. Al-Turki, M.; Ratrout, N.T.; Rahman, S.M.; Reza, I. Impacts of Autonomous Vehicles on Traffic Flow Characteristics under Mixed Traffic Environment: Future Perspectives. Sustainability 2021, 13, 11052. [Google Scholar] [CrossRef]
  120. Manivasakan, H.; Kalra, R.; O’Hern, S.; Fang, Y.; Xi, Y.; Zheng, N. Infrastructure Requirement for Autonomous Vehicle Integration for Future Urban and Suburban Roads—Current Practice and a Case Study of Melbourne, Australia. Transp. Res. Part A Policy Pract. 2021, 152, 36–53. [Google Scholar] [CrossRef]
  121. McAslan, D.; Gabriele, M.; Miller, T.R. Planning and Policy Directions for Autonomous Vehicles in Metropolitan Planning Organizations (MPOs) in the United States. J. Urban Technol. 2021, 28, 175–201. [Google Scholar] [CrossRef]
  122. Mahdinia, I.; Mohammadnazar, A.; Arvin, R.; Khattak, A.J. Integration of Automated Vehicles in Mixed Traffic: Evaluating Changes in Performance of Following Human-Driven Vehicles. Accid. Anal. Prev. 2021, 152, 106006. [Google Scholar] [CrossRef] [PubMed]
  123. Remonda, A.; Veas, E.; Luzhnica, G. Comparing Driving Behavior of Humans and Autonomous Driving in a Professional Racing Simulator. PLoS ONE 2021, 16, e0245320. [Google Scholar] [CrossRef] [PubMed]
  124. Spence, J.C.; Kim, Y.B.; Lamboglia, C.G.; Lindeman, C.; Mangan, A.J.; McCurdy, A.P.; Stearns, J.A.; Wohlers, B.; Sivak, A.; Clark, M.I. Potential Impact of Autonomous Vehicles on Movement Behavior: A Scoping Review. Am. J. Prev. Med. 2020, 58, e191–e199. [Google Scholar] [CrossRef]
  125. Jing, P.; Xu, G.; Chen, Y.; Shi, Y.; Zhan, F. The Determinants behind the Acceptance of Autonomous Vehicles: A Systematic Review. Sustainability 2020, 12, 1719. [Google Scholar] [CrossRef] [Green Version]
Figure 1. Proposed framework (adopted from Kushairi and Ahmi [78]), the asterisk (*) wildcard was used in search string to find word endings.
Sustainability 14 10743 g001
Figure 2. Evolution of publications during 1999–2021.
Sustainability 14 10743 g002
Figure 3. Annual publications and total citations during 1999–2021.
Sustainability 14 10743 g003
Figure 4. Document network visualization based on citations.
Sustainability 14 10743 g004
Figure 5. Citation analysis of the sources based on single document and two citations.
Sustainability 14 10743 g005
Figure 6. Author network visualization based on 20 citations and two documents per author.
Sustainability 14 10743 g006
Figure 7. Geographical distribution of the publications.
Sustainability 14 10743 g007
Figure 8. Countries with the minimum of 5 publications.
Sustainability 14 10743 g008
Figure 9. Co-authorship network visualization between countries.
Sustainability 14 10743 g009
Figure 10. Density map of country-based citations.
Sustainability 14 10743 g010
Figure 11. Density map of co-authorship.
Sustainability 14 10743 g011
Figure 12. Visualization network of co-occurrence of author keywords.
Sustainability 14 10743 g012
Figure 13. Tree-Map of top 20 author keywords.
Sustainability 14 10743 g013
Figure 14. Density map showing the most occurring author keywords.
Sustainability 14 10743 g014
Figure 15. Three field plots between keywords (left), authors (middle) and sources (right).
Sustainability 14 10743 g015
Figure 16. Three field plots between authors (left), countries (middle) and keywords (right).
Sustainability 14 10743 g016
Figure 17. Three field plots between institutions (left), authors (middle) and sources (right).
Sustainability 14 10743 g017
Figure 18. Thematic evolution of AVs in mixed traffic during different time slices.
Sustainability 14 10743 g018
Figure 19. Trending topics in concerned research area.
Sustainability 14 10743 g019
Figure 20. Research hotspots created based on occurrence of index keywords.
Sustainability 14 10743 g020
Table 1. Impacts of AVs.
StudyStudy SiteSimulation ToolAspectImpact/Findings
[27]Freeway section
Hypothetical section
VISSIMOperationIncrease in throughput was observed by above 17% for freeways with MPR of 60% and higher.
[28]Segment of highway including network of secondary urban roadsVISSIMOperationFor AV scenario, average density improved by 8.09%, average travel speed enhanced relatively by 8.48% and average travel time improved by 9.00%.
[29]Stretch of freewayVISSIMOperationWith increase in MPR of CAVs, congestion length and congestion area become smaller. In addition, the speed of shockwave reduces
[34]Freeway and arterial network Freeway corridorVISSIMOperationFor network level evaluation, the study finds an improvement of 30% in network total delay and 6% in average network speed at 100% CAV penetration rate.
For freeway corridor, the results show 33% improvement in network total delay and 23% in average network speed.
[12]RoundaboutVISSIMOperationIn all cases there was an increase in travel speed and decrease in average stop delay with the increase in percentage of AVs.
[35]-VISSIMOperationThe study found incorporation of CAVs advantageous for operational performance as it reduced the travel time by 11% and delays by more than 40%.
[36]4-km long single lane roadVISSIMOperationThe average capacity per lane for AV in single-lane road segment was 1.13% higher than HV.
[37]Diverging Diamond Interchange
Restricted Crossing U-Turn (RCUT) Intersection
VISSIMOperationThe results show a 7% improvement in throughput when both Alternative Intersection Design and full penetration of level-3 autonomous vehicles are employed simultaneously.
[25]Highway network-OperationIncorporating higher percentages of CAVs improves the throughput, travel time, density and speed even with the highly congested conditions.
[33]Motorway sectionVISSIMOperationResults show higher vehicle throughput and lower travel delays as AVs evolve from cautious to more advanced logics.
[13]Signalized intersection
Roundabout
VISSIMSafetyFor signalized intersection, number of conflicts reduced from 20% to 65% with MPR between 50–100%.
For the roundabout, the number of conflicts reduced by 29% to 64% with the 100% AV.
[30]Unsignalized intersectionVISSIMSafetyIt was concluded that the presence of 100% of AVs could reduce the potential for accidents by up to 93%.
[31]Motorway sectionVISSIMSafetyReductions in total conflict points and rear-end collision points were 8.6% and 13%, respectively.
Reduction in the annual crash rate was 12%
[38]10.2 km three-lane roadway with 400 m as merging and diverging sectionAIMSUNOperation and SafetyThe study found that at higher penetration rates of AVs, throughput can improve up to 84% while safety conditions are different at different penetration rates.
[16]Freeway network
CBD roads
Streets in university campus/
Scalable Microscopic Adaptive Road Traffic Simulator (SMARTS)Operation and SafetyThe findings showed that higher proportion of low-level vehicles reduces the efficiency. A reduction of 11% in safety impact is reported for CBD at 3k volume when proportion of level 4 vehicles increases by 20%.
[32]Urban arterial with unsignalized drivewayVISSIMOperation and SafetyIncreasing MPR of AVs improves the density and speed and reduces the number of lane changes and rear end collisions.
[26]Merging on-ramp area-Operation and EnvironmentAt 100% penetration rate of CAVs, a reduction of 16–60% for fuel consumption and 40–67% for travel time was observed. Highest benefits in travel time and fuel consumption are achieved with medium traffic conditions.
[39]Signalized urban corridor
Freeway section
VISSIMOperation and EnvironmentAggressive AVs can reduce the subsequent emission factors by up to 26% on the expressway, while cautiously programmed AVs could deteriorate traffic performance and lead to a 35% increase in emissions.
[11]Road Network-Operation and Environment100% AVs penetration rate reduces the environmental impacts at mobility level by 60%. Network performances improves by 100% AV penetration in terms of travel time (–33%) and average network speed (+51%) whereas the total distance travelled increases for highways (8%).
[40]Freeway corridorVISSIMOperation and EnvironmentCorridor-level analysis showed decreases of 5% in emissions can be expected with AV technology, but it penalizes travel time up to 13% for both AVs and CVs, when compared to the existing situation
[41]Hypothetical 8-km single-lane roadVISSIMOperation, Safety and EnvironmentThe proposed algorithm involving connected vehicles can reduce travel time by 20%, safety improvement of 6–11% and overall fuel consumption reduction of 5–16% with 100% CV penetration
[42]3 km stretch on Auckland MotorwaySUMOOperation, Safety and EnvironmentFor current scenarios, having 0.5% to 0.95% of the capacity, deploying more than 70% of AVs can improve travel time, TTC, emission and fuel consumption.
Table 2. Search strings for extraction of the relevant documents.
No.StageSearch StringDocument Results
1Initial search stringTITLE-ABS ((“Autonomous vehicle*” OR “driverless car*” OR “automated driving” OR “connected autonomous vehicle*” OR “CAVs”) AND (“mix* traffic*” OR “heterogeneous traffic*” OR “mix* traffic flow”))434
2Specifying the document typeTITLE-ABS ((“Autonomous vehicle*” OR “driverless car*” OR “automated driving” OR “connected autonomous vehicle*” OR “CAVs”) AND (“mix* traffic*” OR “heterogeneous traffic*” OR “mix* traffic flow”)) AND (LIMIT-TO (DOCTYPE, “ar”) OR LIMIT-TO (DOCTYPE, “cp”))404
3Limiting the time frameTITLE-ABS ((“Autonomous vehicle*” OR “driverless car*” OR “automated driving” OR “connected autonomous vehicle*” OR “CAVs”) AND (“mix* traffic*” OR “heterogeneous traffic*” OR “mix* traffic flow”)) AND (LIMIT-TO (DOCTYPE,”ar”) OR LIMIT-TO (DOCTYPE, “cp”)) AND (EXCLUDE (PUBYEAR, 2022))395
4Screening and excluding the irrelevant documentsTITLE-ABS ((“Autonomous vehicle*” OR “driverless car*” OR “automated driving” OR “connected autonomous vehicle*” OR “CAVs”) AND (“mix* traffic*” OR “heterogeneous traffic*” OR “mix* traffic flow”)) AND NOT EID (2-s2.0-85113502346 OR 2-s2.0-85110113635 OR 2-s2.0-85111559787 OR 2-s2.0-85105690111 OR 2-s2.0-85105304706 OR 2-s2.0-85102260094 OR 2-s2.0-8510292210 OR 2-s2.0-85120523634 OR 2-s2.0-85112662827 OR 2-s2.0-85101020669 OR 2-s2.0-85099345593 OR 2-s2.0-85092091552 OR 2-s2.0-85106318730 OR 2-s2.0-85097173824 OR 2-s2.0-85093119962 OR 2-s2.0-85086721434 OR 2-s2.0-85076820374 OR 2-s2.0-85074453871 OR 2-s2.0-85069684311 OR 2-s2.0-85031293900 OR 2-s2.0-85106204730) AND (LIMIT-TO (DOCTYPE, “ar”) OR LIMIT-TO (DOCTYPE, “cp”)) AND (EXCLUDE (PUBYEAR, 2022))374
Notes: The asterisk (*) wildcard was used in search string to find word endings.
Table 3. Details of excluded documents with reasons of exclusion.
Sr. No.ReferenceEIDReason of Exclusion
1[80]2-s2.0-85113502346Pedestrians’ trajectories at midblock—jaywalkers
2[81]2-s2.0-85110113635Interaction between wheelchairs, pedestrians and AVs
3[82]2-s2.0-85111559787Design to deploy AVs to carry a first aid robot
4[83]2-s2.0-85105690111Policy study providing a framework to differentiate between installation and usage of AVs
5[84]2-s2.0-85105304706AV-pedestrian interactions
6[85]2-s2.0-85102260094Survey paper
7[86]2-s2.0-85102922104Primarily not focused on AVs
8[87]2-s2.0-85120523634Calibration method for existing traffic
9[88]2-s2.0-85112662827AVs interactions with cyclists explored
10[89]2-s2.0-85101020669Modeling pedestrians road crossing
11[90]2-s2.0-85099345593Review paper
12[91]2-s2.0-85092091552Pedestrian path prediction at signalized crosswalk
13[92]2-s2.0-85106318730Key focus was connected buses and energy consumption
14[93]2-s2.0-85097173824Survey-based study about user perceptions
15[94]2-s2.0-85093119962User perception based on autonomous shuttle rides—user survey
16[95]2-s2.0-85086721434User perception based on autonomous shuttle rides—user survey
17[96]2-s2.0-85076820374Estimating pedestrian’s waiting time at unsignalized mid-block crosswalks
18[97]2-s2.0-85074453871Pedestrians’ perspective
19[98]2-s2.0-85069684311Vehicle–pedestrian encountering
20[99]2-s2.0-85031293900Review paper discussing future perspectives of AVs
21[100]2-s2.0-85106204730Prior focus was communication from in-vehicle and from infrastructure signage.
Table 4. Yearly publications and citation matrix for the selected documents during 1999 to 2021.
YearTP%NCPTCC/PC/CPhg
202112633.69%521981.573.81611
202010929.14%754844.446.451215
20196517.38%5870410.8312.141324
2018369.63%3460816.8917.881224
2017164.28%1430619.1321.86814
2016112.94%1139135.5535.55711
201520.53%22211.0011.0022
201410.27%111.001.0011
201310.27%13333.0033.0011
201241.07%3174.255.6723
200910.27%111.001.0011
200010.27%14242.0042.0011
199910.27%122.002.0011
Notes: total publications (TPs); number of cited papers (NCPs); total citations (TC); mean citations per paper (C/P); mean citations per cited paper (C/CP); h-indices (h); g-indices (g).
Table 5. Top 10 most cited documents.
No.TCAuthorTitleTypeSourceCPY
1162[53]Autonomous vehicles and connected vehicle systems: Flow and operations considerationsArticleTransportation Science27
2115[57]A mixed traffic capacity analysis and lane management model for connected automated vehicles: A Markov chain methodArticleTransportation Research Part B: Methodological23
399[60]Modeling connected and autonomous vehicles in heterogeneous traffic flowArticlePhysica A: Statistical Mechanics and its Applications24.75
497[64]TrafficPredict: Trajectory prediction for heterogeneous traffic-agentsConference PaperProceedings of the AAAI Conference on Artificial Intelligence32.33
585[70]Optimal deployment of autonomous vehicle lanes with endogenous market penetrationArticleTransportation Research Part C: Emerging Technologies14.17
676[106]What externally presented information do VRUs require when interacting with fully Automated Road Transport Systems in shared space?ArticleAccident Analysis and Prevention19
775[107]Cooperative platoon control for a mixed traffic flow including human drive vehicles and connected and autonomous vehiclesArticleTransportation Research Part B: Methodological18.75
873[108]Joint optimization of vehicle trajectories and intersection controllers with connected automated vehicles: Combined dynamic programming and shooting heuristic approachArticleTransportation Research Part C: Emerging Technologies24.33
955[109]Mixed-integer linear programming for optimal scheduling of autonomous vehicle intersection crossingArticleIEEE Transactions on Intelligent Vehicles13.75
1053[28]Investigation of Automated Vehicle Effects on Driver’s Behavior and Traffic PerformanceConference PaperTransportation Research Procedia8.83
Notes: total citations (TC); citations per year (CPY).
Table 6. Most active source title with minimum TP of 8.
RankSource TitleTP%PublisherNCPTCC/P
1Transportation Research Part C Emerging Technologies318.29%Elsevier Ltd.2741213.29
2IEEE Conference on Intelligent Transportation Systems Proceedings (ITSC)256.68%IEEE Inc.131044.16
3IEEE Transactions on Intelligent Transportation Systems205.35%IEEE Inc.141085.40
4Journal Of Advanced Transportation164.28%Hindawi Limited11754.69
5Physica A: Statistical Mechanics and Its Applications143.74%Elsevier B.V.1030621.86
6IET Intelligent Transport Systems112.94%Institution of Engineering and Technology8484.36
7SAE Technical Papers112.94%SAE International5141.27
8Transportation Research Record102.67%SAGE Publications Ltd.9797.90
9IEEE Access92.41%IEEE Inc.8556.11
10Transportation Research Part B: Methodological82.14%Elsevier Ltd.733141.38
11Transportation Research Procedia82.14%Elsevier B.V.78310.38
Notes: total publications (TPs); number of cited papers (NCPs); total citations (TC); mean citations per paper (C/P).
Table 7. Authors with a minimum of 5 publications.
Author Name
(Scopus ID)
TP%AffiliationCountryNCPTCC/PC/CPhg
Ran, B.
(7003397581)
92.41%Southeast UniversityChina6566.229.3336
Wang, H.
(55883671300)
92.41%Southeast UniversityChina6596.569.8346
Li, K.
(26643211100)
71.87%Tsinghua UniversityChina6395.576.5036
Wang, J.
(57211026358)
71.87%Tsinghua UniversityChina6395.576.5036
Ahn, S.
(7401989918)
51.34%University of Wisconsin–MadisonUnited States5153.003.0023
Bouroche, M.
(15134891000)
51.34%Trinity College DublinIreland4397.809.7544
Jiang, Y.
(34876737100)
51.34%Southwest Jiaotong UniversityChina36513.0021.6733
Li, X.
(57192545155)
51.34%University of South FloridaUnited States525250.4050.4045
Shao, Y.
(57188803628)
51.34%Oak Ridge National LaboratoryUnited States5112.202.2023
Xu, Q.
(57199199887)
51.34%Tsinghua UniversityChina4142.803.5023
Yao, Z.
(57190090062)
51.34%Southwest Jiaotong UniversityChina36513.0021.6733
van Arem, B.
(6602784888)
51.34%Delft University of TechnologyThe Netherlands3295.809.6723
Notes: total publications (TPs); number of cited papers (NCPs); total citations (TC); mean citations per paper (C/P); mean citations per cited paper (C/CP); h-indices (h); g-indices (g).
Table 8. Top 10 productive organizations ranked based on total publications.
RankInstitutionTPCountryTCC/PC/CPAuthors of MCPTC of MCP
1Southeast University27China943.486.27[72]22
2Tsinghua University21China1878.9011.00[70]85
3Ministry of Education China18China713.945.92[61]17
4University of Wisconsin–Madison17United States814.766.75[111]34
5Tongji University17China633.715.73[112]25
6Southwest Jiaotong University14China1369.7112.36[111]34
7Chang’an University13China765.857.60[113]18
8Clemson University10United States11011.0018.33[109]55
9University of South Florida, Tampa9United States14916.5621.29[108]73
10Zhejiang University8China13717.1322.83[70]85
Notes: total publications (TPs); total citations (TC); mean citations per paper (C/P); mean citations per cited paper (C/CP); most cited paper (MCP)s.
Table 9. Most leading countries with minimum of 5 publications.
CountryTP%NCPTCC/PC/CPhg
United States14839.6%11314709.9313.011734
China14639.0%868665.9310.071624
Germany349.1%232527.4110.96615
Japan154.0%1228318.8723.58712
United Kingdom143.7%1116711.9315.18611
Netherlands123.2%11917.588.2769
Italy92.4%8717.898.8858
Sweden82.1%68410.5014.0046
Spain71.9%4182.574.5034
Canada61.6%5457.509.0045
France61.6%5498.179.8035
Ireland61.6%5447.338.8045
Singapore61.6%58313.8316.6035
South Korea61.6%5325.336.4035
Australia51.3%410120.2025.2544
Notes: total publications (TPs); number of cited papers (NCPs); total citations (TC); mean citations per paper (C/P); mean citations per cited paper (C/CP); h-indices (h); g-indices (g).
Table 10. Top 10 terms based on occurrence frequency and relevance score.
RankBased on Occurrence FrequencyRankBased on Relevance Score
TermOccurrenceRelevance ScoreTermOccurrenceRelevance Score
1Traffic flow990.531Mixed traffic situation123.45
2Mixed traffic flow880.832Cooperative adaptive cruise control182.17
3CAVs860.333Cellular automata112.07
4Capacity520.544Numerical simulation311.9
5Interaction500.845Situation421.86
6Mixed traffic environment490.526Mixed traffic scenario261.83
7Stability481.137Road capacity171.79
8Intersection470.448Automated driving271.58
9Driver460.949Simulation study151.56
10Delay430.5610Adaptive cruise control191.54
Table 11. Notable Keywords and Research Themes.
Time FrameNotable KeywordsResearch Front
1999–2017Autonomous vehicles, controllers, transportation system, algorithmsPre-Development
2017–2020Autonomous vehicles, traffic control, traffic situation, human–machine interface, intelligent systemsDevelopment
2021Mixed traffic flow, autonomous vehicles, heterogeneous traffic, traffic management, urban transportationDeployment
Publisher’s Note: MDPI stays neutral with regard to jurisdictional claims in published maps and institutional affiliations.

