Article

Study on Peak Travel Avoidance Behavior of Car Travelers during Holidays

1
School of Civil and Traffic Engineering, Qinghai Nationalities University, Xining 810007, China
2
Faculty of Urban Construction, Beijing University of Technology, Beijing 100124, China
*
Authors to whom correspondence should be addressed.
Sustainability 2022, 14(17), 10744; https://doi.org/10.3390/su141710744
Submission received: 15 July 2022 / Revised: 23 August 2022 / Accepted: 25 August 2022 / Published: 29 August 2022
(This article belongs to the Section Sustainable Transportation)

Abstract

:
Traveling during off-peak season can mean cheaper flights, cheaper hotels, and the chance to see a destination at a less frenetic time of year. To alleviate the congestion of roads and tourist attractions, a better demand management plan is needed to guide tourists to avoid travel during holidays. This study takes holiday tourists’ peak travel avoidance behavior as the research object, and a Nested Logit (NL) model of travel time and destination joint decisions was established based on Utility Maximization Theory. Model calibration and elastic analysis were carried out using Revealed Preference/Stated Preference (RP/SP) survey data. Results show that tourist attributes such as the number of tourists traveling together, travel companion, duration of the visit, the number of previous visits, tourism motivation, type of tourist attraction, quality grade of tourist attraction, and degree of congestion significantly influence destination decisions. Travel scope, travel duration, age, and other factors significantly influence travel time decisions. The traffic congestion around tourist attractions, holiday admission ticket prices, and non-holiday admission ticket prices significantly influence travel time and destination decisions. Holiday admission ticket price increases have a strong impact on the decision to change the travel destination, while non-holiday admission ticket discounts have a weak impact on travel time decision behavior. The findings of this study offer a theoretical basis for holiday travel management and tourism management. It is practical and significant to reasonably guide tourists to travel during the off-peak season and to understand the travel needs and characteristics of holiday tourists, thus adjusting the distribution of holiday tourist flow.

1. Introduction

Due to the increase in tourism demand, many tourist attractions in China are excessively crowded during holidays, especially some popular tourist attractions and their surrounding roads [1,2]. The implementation in 2012 of the policy of free passage for cars with seven or fewer seats on expressways during the holidays stimulates car travel. Self-driving tours have become a main force of the domestic tourism market, and statistical data show that the average growth rate reached 21.09% (National Bureau of Statistics of China). Due to length constraints of holiday time, much of the travel time is concentrated on certain days, and heavy travel to scenic areas causes excessive pressure. These factors, accompanied with some non-standard highway driving behaviors and traffic accidents, increase holiday congestion around tourist attractions, and many tourist attractions are overcrowded due to tourists’ concentrated traveling, and even stampedes and other safety accidents may occur [3,4,5]. The overcrowding of tourist attractions cause pressure on the personal safety of tourists and the traffic environment of surrounding roads. Meanwhile, it also poses a serious threat to the travel efficiency and safety of tourists and the ecological environment of tourist attractions, thus restricting the sustainable development of tourism. Therefore, it is necessary to discuss the travel patterns of tourists during holidays to seek effective countermeasures to reduce holiday congestion and improve the travel experience for tourists.
Traffic congestion is a problem that affects sustainable development [6,7,8]. To alleviate traffic congestion, the existing traffic demand management measures mainly focus on the change in transportation mode and the change in travel time. By attracting and encouraging travelers to adopt high-volume and intensive public transportation, the frequency of car use can be reduced to ease road congestion during peak hours [9,10,11]. Furthermore, the congestion problem of concentrated travel times may be avoided by shifting peak hours and adjusting departure times [12,13]. To alleviate the problem of holiday travel congestion and tourist attraction congestion, relevant departments regulate holiday tourist flow from the perspective of trip regulation and tourist attraction control through holiday information induction, vehicle type restrictions, tourist attraction flow restrictions and reservations, etc. [14]. In addition, some research institutions and network data platforms, through the release of holiday travel reports to provide tourists with travel references, are trying to guide people’s travel behaviors. These measures have limited effects because people spend so much time traveling. Therefore, taking measures to adjust people’s travel times or destinations to encourage avoiding peak travel times or congested destinations (space-time avoid peak) has become important to alleviate the traffic congestion problems at holiday tourism destinations.
According to previous studies, cost is a direct impact factor in people’s travel behaviors, and it is a common and effective measure to use cost to adjust travel behavior to alleviate traffic congestion [15,16]. In tourism, the price to visit tourist attractions is an important part of the travel cost, an important factor affecting tourists’ behavioral intention, and a major level for the management of tourist attractions to control visitor flow [17,18]. However, there is little discussion on the influence of tourist attraction ticket prices on travel time and destination. Therefore, it is necessary to consider the effect of ticket strategy on tourists’ peak travel avoidance behavior, especially the differences in the impact of time and destination choice.
This paper aims to explore the possibility of avoiding peak travel during holidays, especially the influence and effect of external strategies. Based on the behavioral survey data, an NL model was established to discuss the joint decision-making behavior of travel time and destination for tourists, and the likelihood of tourists avoiding spatial–temporal peaks was explored under certain admission ticket strategies. It provides theoretical references for the formulation of admission ticket strategies to tourist attractions, tourist flow regulation, and off-peak travel guidance plans during holidays.
The remaining sections are organized as follows. Section 2 briefly reviews the literature on holiday travel and peak travel avoidance behavior. Section 3 presents the research methodology. Section 4 analyzes the data of holiday car travel and establishes the model. Section 5 discusses the results of the model estimation. Finally, the main conclusions and future research work are summarized in Section 6.

2. Literature Review

Travel behavior analysis is the basis of traffic planning and management [19]. Studies have shown that holiday travel behavior is different from commuter travel behavior [20,21,22], with different decision-making structures, greater sensitivity to travel time changes, and stronger dependence on cars, and the holiday itself has an impact on travel behavior [23]. With the rapid growth of the holiday travel market, the analysis of holiday travel behavior has attracted increased attention. Studies on holiday travel behavior focus on travel mode [21], travel destination [24], travel time [25], parking choice [26], joint choice of departure time and travel mode or travel destination [27,28,29], etc. In the existing studies, the discrete choice model is an appropriate and effective method for behavior modeling [30,31]. Logit models with different structures, such as the Multinomial Logit (MNL) model and the Nested Logit (NL) model, have been widely used in the analysis of travel behavior [1]. Holiday travel demand is elastic relative to the rigid demand of daily commuting [19]. Holiday travel behavior has greater flexibility in time and space. Therefore, it is necessary to explore the possibility of avoiding peak travel during holidays and devise corresponding travel demand management plans.
Avoiding peak travel was first proposed to solve the problem of traffic congestion caused by concentrated commuting time [32]. “Alternative Work Schedules” is an initial manifestation of avoiding peak travel. It was proposed by German economists in the 1960s, and mainly includes three forms: the combination of core time and flexible time, the compact work time system, and off-peak commuting [32]. European and American countries have learned from and implemented this system for more than 40 years, and they solved the traffic congestion problem during morning and evening rush hours in a relatively extended period of time [33].
Researchers have conducted relevant studies on the evaluation and analysis of the implementation effect of peak travel avoidance policy. For example, Henderson [34] used the bottleneck model to explore the effect of a peak commuting avoidance system where commuters went to work from their dormitory to CBD through a crowded road, and they analyzed the optimal commuting time. Later, Wilson [35], Arnott [36], and others expanded the model to study the effect of peak travel avoidance by considering the accommodation area, enterprise attributes, and congestion changes. Jansson [37] took a city in Sweden as an example to explore the possibility of staggered class times for students during peak demand for public transportation. Li [38] established a two-level programming model to analyze and evaluate the effect of staggered peak travel. Chu et al. [39] analyzed the mechanism of peak travel avoidance and found that avoiding peak travel is conducive to alleviating public traffic congestion. Yang et al. [32] posit that avoiding peak travel is a strategy to adjust people’s fixed travel time such as commuting and school travel, which can balance traffic flow in time and alleviate the contradiction between supply and demand. Chen et al. [36] analyzed the “avoid peak travel” policy from the perspective of behavioral economics using the reference dependency principle. Chen et al. [40] used the bottleneck model to build a theoretical model of off-peak regulation and presented management principles related to off-peak interval and the number of trips.
To better study the effects of peak travel avoidance policy and to alleviate the congestion problem during peak hours, many scholars have explored the influencing factors and characteristics of off-peak travel behavior from the perspective of travelers. For example, Ben-Elia [41] used Ordered Logit (OL) and Mixed OL models to verify the impact of working time flexibility, family constraints, work location, and personal motivation on car travelers’ transition from peak to low peak travel. Ben-elia [42,43] hypothesized that reward is the motivation that influences car travelers to avoid peak hours. The choice behaviors of avoiding peak travel are influenced by additional factors such as sociodemographic characteristics, time arrangement and flexibility of working time, habitual behavior, attitude, availability of travel information, and weather. Tillema et al. [44] compared the impact of two congestion management schemes, road pricing and off-peak travel incentive, on commuting behavior through RP/SP fusion data, and incentive was more effective in making commuters avoid peak hours. Zhang et al. [45] investigated the impact of incentive measures on commuters’ travel behavior based on a questionnaire survey of Beijing subway system users, and found that services related to fast food restaurants, reduced ticket prices, and flexible working hours had positive effects on avoiding morning rush hours. Thorhauge et al. [46] considered that the flexibility of daily activity time had a significant impact on travelers’ willingness to change departure time. Wang et al. [47] studied the acceptability of avoiding peak travel under the preferential degree of subway ticket prices, in which about 25% of passengers were willing to accept the fare discount for a specific period and choose off-peak travel. Qin et al. [48] used the prospect theory to explore the choice intention of off-peak travel behavior in car commuting under incentives and punishments and found that diverse groups showed different risk preferences. These studies focus on commuter travelers, with a lack attention to the behavior of tourists during holidays.
In sum, existing studies on avoiding peak travel mainly explore the internal and external influencing factors of commuter travelers and have insufficient focus on this special period of holidays. Therefore, it is significant to explore the peak travel avoidance intention of holiday travelers, which fills the gap in current research and facilitates the development of holiday travel management strategies.

3. Methodology

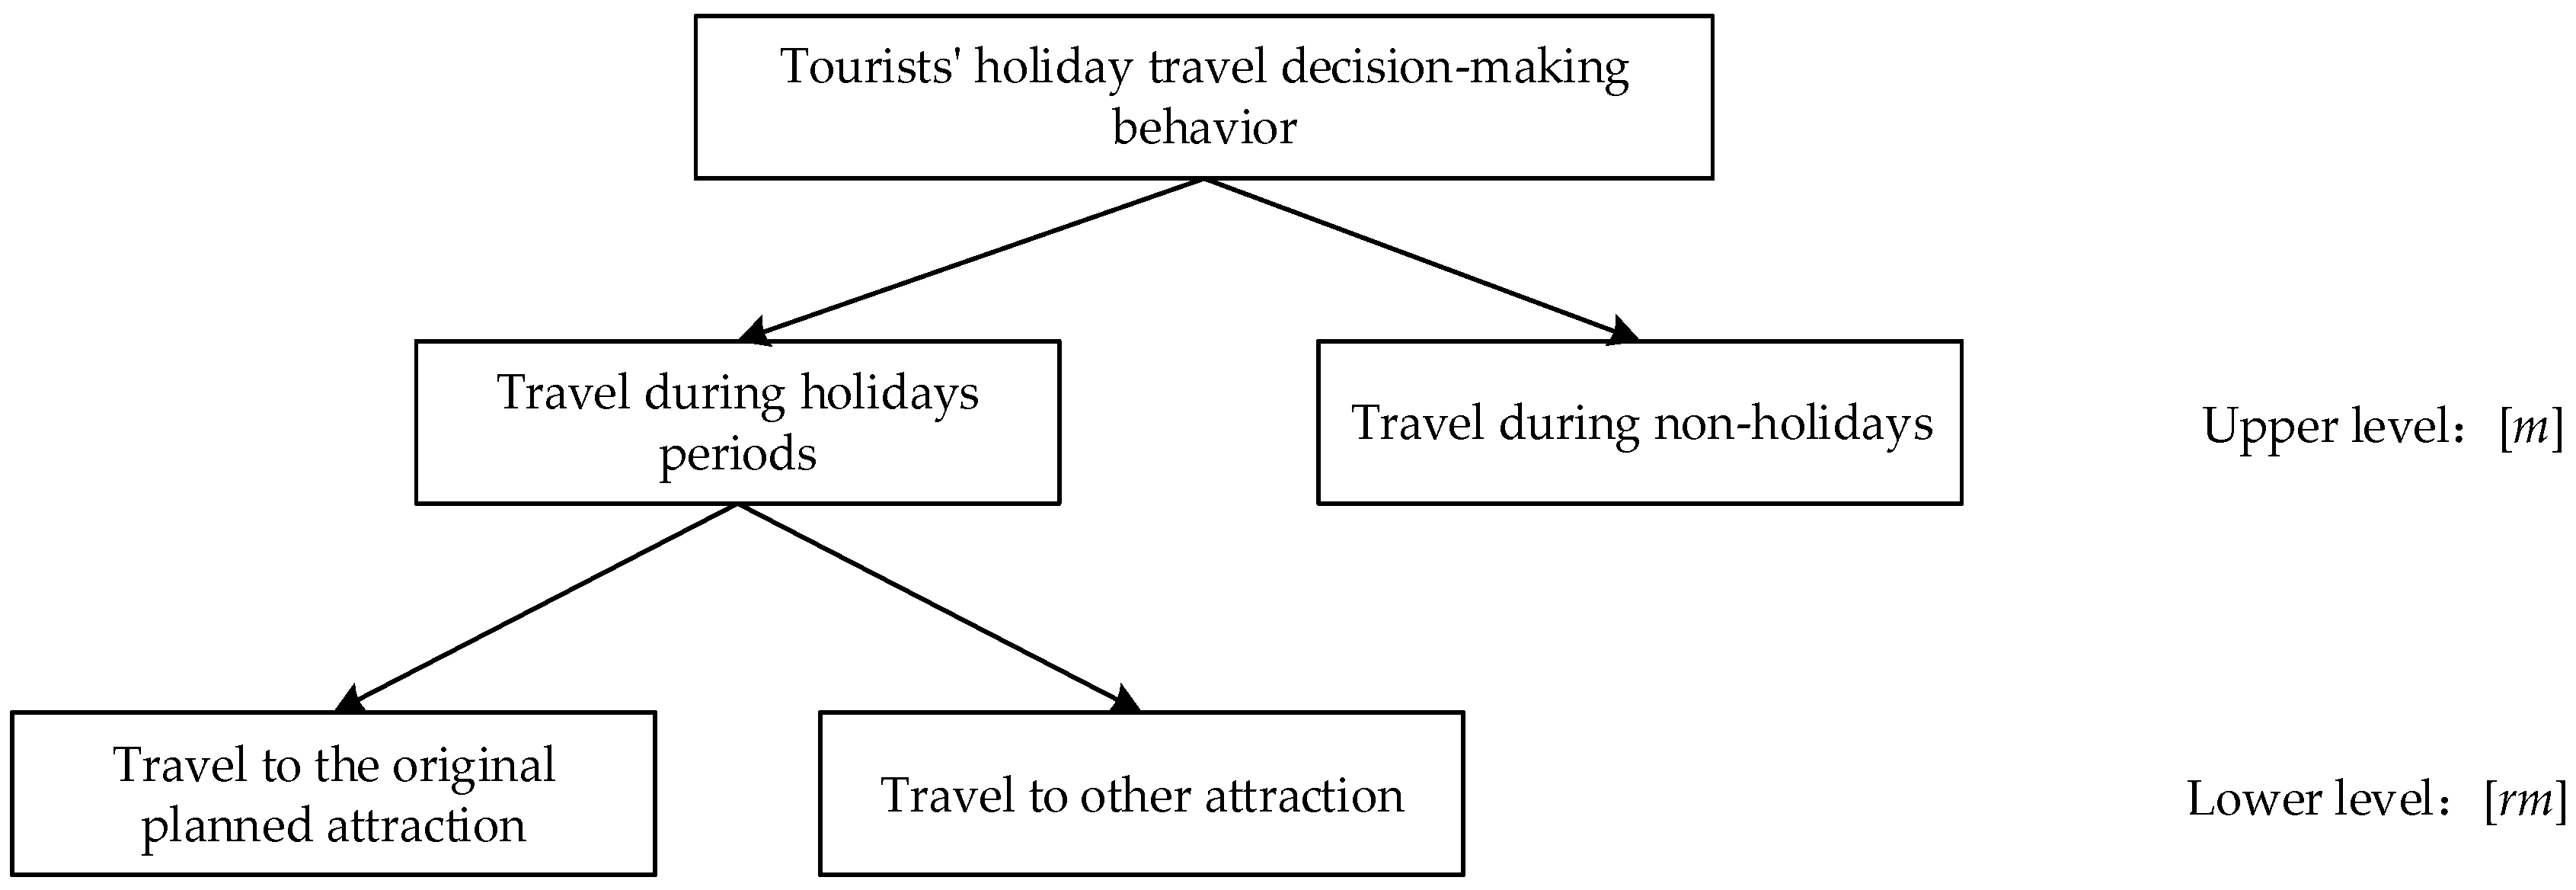
3.1. Framework of NL Model

The discrete choice model stems from the microeconomic theory of consumer demand proposed by Lancaste [49] and the random utility theory proposed by Marschak, Thurstone [50], and McFadden [51]. It plays a key role in the study of travel behavior. This kind of model is simple to operate and has a good model fitting effect, which has strong persuasiveness to describe individual decision-making behavior. Among them, the Nested Logit (NL) model is proposed on the basis of the Multinomial Logit (MNL) model. Its hierarchical structure can consider the utility correlation between different choice limbs, and different nests of each choice limb remain independent; thus, it can overcome the independence from irrelevant alternative (IIA) characteristics of the MNL model [52].
In studying travel behavior, the NL model is widely used to interpret people’s travel modes, travel destination, parking choice behavior, departure time, travel chain, place of residence, and activity arrangement behavior [1,2,53]. At the same time, the NL model has a closed form of probability expression, which is suitable for large-scale resident travel prediction analysis. The choices of travel time and destination are discrete choices, as tourists are often offered with two or more options. Therefore, in this work, the double-layer NL model was adopted to model the joint choice behavior of travel time and destination in holidays, so as to explore the behavioral intention of avoiding peak travel in terms of time and destination of holiday travelers.
To construct the joint decision NL model of travel time and destination, three key problems need to be solved including: (i) determine the structure of the model, (ii) determine the choice limbs, and (iii) establish the utility variable function. In this paper, a two-layer NL model for the joint decision of travel time and destination is established to analyze the spatial–temporal characteristics of peak travel avoidance behavior during holidays. The structure of the NL model in this paper is shown in Figure 1, where 1, 2, …, m is used to represent selection schemes on the upper-level model (travel time choice). The travel time sets are divided into holiday travel and non-holiday travel. Then, tourists need to decide which tourist attraction to visit, and 1 m, 2 m, …, Rm is used to represent selection schemes on the lower-level model (destination choice) under the arbitrary choice scheme m. The destination sets are divided into the original planned attractions and other attractions.

3.2. Estimation Method of NL Model

The decision-making process of holiday travelers can be described by a utility function. According to the random utility theory, the utility function consists of two parts [51], as shown in Equation (1):
U m n = V m n + ε m n ( m A n )
Umn is the utility of the traveler n selecting scheme m; Vmn is a fixed term in the utility function of the explanatory variables associated with traveler n and alternative m; εmn is a random component in the utility function, which captures all other factors unobserved by the researcher; An is the set of selection schemes.
Assuming that the observed utility V(r/m)n and Vmn of traveler n are both linear, the expressions of V(r/m)n and Vmn are obtained, which are shown in Equations (2) and (3), respectively.
V ( r / m ) n = k = 1 K 1 β k X ( r / m ) n k
V m n = k = 1 K 2 θ k X m n k
where V ( r / m ) n is the fixed utility of change part because of a combination of scheme rm and m when traveler n has selected the scheme (rm); V m n is the utility of a fixed item that follows travel time m changes and is not related to r when traveler n has selected the scheme (rm); X ( r / m ) n k is the kth characteristic variable included in the scheme (rm) selected by traveler n , and it responds to changes in r; X m n k is the kth characteristic variable included in the scheme (m) selected by traveler n , and it responds to changes in m; β k ( k = 1 , 2 , , K 2 ) is the coefficient for X ( r / m ) n k ; and θ k ( k = 1 , 2 , , K 2 ) is the coefficient for X m n k .
According to the conditional probability equation, the NL model formula is shown in Equations (4)–(7) [54]:
P n ( r m ) = P n ( r / m ) P n ( m )
P n ( r / m ) = e λ 1 V ( r / m ) n r = 1 R m n e λ 1 V ( r / m ) n
P n ( m ) = e λ 2 ( V m n + V m n * ) m = 1 M n e λ 2 ( V m n + V m n * )
V m n * = 1 λ 1 ln r = 1 R m n e λ 1 V ( r / m ) n
where P n ( r m ) is the probability that traveler n chooses destination (rm). P n ( r / m ) is the probability that traveler n chooses destination r under the condition of choosing travel time m. P n ( m ) is the probability that traveler n chooses travel time m. r = 1 , 2 , , R m n . R m n is the number of destination schemes related to the selection of travel time m for travelers, which equals two in this paper. m = 1 , 2 , , M n . M n is the number of travel time schemes for travelers, which equals two in this paper. V r m n is the observed utility of scheme (rm) selected by traveler n . V m n * is an inclusive value that can indicate that when traveler n chooses a travel time in the upper model, traveler n will consider the total utility that can be obtained from the destination choice scheme contained in the lower-level model. λ 1 and λ 2 are inclusive coefficients. Their size can reflect the influence of the lower model on the upper model. If 0 < λ < 1 , it indicates that the NL model is consistent with random utility maximization [52,54].
The NL model was estimated using maximum likelihood [55]. The t test is used to estimate the significance of each coefficient. In addition, the goodness of fit ρ2 and adjusted goodness of fit ρ−2 are commonly used to measure the overall fit of the model. When ρ2 reaches 0.2–0.4, the model has high accuracy [56].

4. Data and Modeling

4.1. Sample Description

To investigate and reflect the preferences of travelers in making travel decisions in an actual travel situation, the first step is to collect and obtain travel data including the actual holiday travel activities. At the same time, it is necessary to conduct a survey and obtain the change in travel behavior given the change in external conditions by studying the stated travel preferences of tourists. Therefore, revealed preference (RP) and stated preference (SP) surveys were adopted, and simple random sampling techniques were used in the survey process. An online questionnaire survey was carried out in December 2019, assisted by the domestic Internet survey platform “SO JUMP”, and random travelers with holiday car travel experience were recruited as the respondents. The sample covers 27 administrative regions of China (34 in total) by statistical analysis of the Internet Protocol (IP) address of the respondents. A total of 544 questionnaires were obtained, and 460 valid questionnaires were retained. After excluding surveys with obvious contradictions and incomplete answers, the total number of received questionnaires accounts for 84.6%.
The questionnaire consists of three parts.
Part 1 collects the demographic characteristics of travelers, including gender, age, income, number of family members, etc. (for details, see [15]).
Part 2 investigates the holiday travel characteristics of travelers (RP data), and inquires about the travel situation of travelers in the last holiday, including the travel duration, the number of tourists in a group and the relationship of the group, the number of previous visits to the same spot, travel motivation, travel distance, departure time, etc.
Part 3 investigates the travelers’ stated preference (SP), querying whether attraction ticket prices and road congestion around tourist attractions influence travelers’ behavioral intention in terms of travel time and destination. Three characteristic variables, namely, admission ticket for tourist attractions during the holidays, non-holiday admission ticket, and road congestion during the holidays, were selected to characterize travel behaviors to derive the temporal and spatial preferences of tourists. Among them, the preferential price strategies for holiday admission tickets include 20% and 40%. Preferential price strategies for non-holiday admission tickets include a 40% reduction and free. The duration of road congestion is divided into two levels: half an hour and one hour.
Figure 2 and Figure 3 reflect the choice intention of travelers to avoid peak travel amid road congestion and ticket changes in the original planned tourist attractions during holidays. We found that when the duration of road congestion increases from 0.5 to 1 h, the proportion of visiting original tourist attractions drops from 54.3% to 38.1%, while the proportion of choosing to change tourist attractions increases significantly, by 13.5%. When the ticket price of original tourist attractions is increased by 40%, the proportion of travelers changing tourist attractions increased from 29.1% to 37.5%. In general, the change rate of travel time from holidays to non-holidays is not obvious under the influence of congestion information and ticket price increase.

4.2. Model Specification

To explore and analyze the characteristics of tourists’ choice behavior, five variables including socioeconomic characteristics, travel characteristics, tour characteristics, destinations (tourist attractions) and external conditions are mainly considered as factors of inquiry. Cross-contingency table and correlation analyses were carried out for the survey data, and the variables were screened. After repeated calibration, the characteristic variables that affect tourists’ joint decision behavior of travel time and destination were finally determined. The specific explanations of the variables are shown in Table 1.
The observed utility variables include specific constants, specific variables, and common variables. Considering the impact on the choice, these explanatory variables were set under the upper and lower levels of the NL model, as shown in Table 2 [57].
According to the characteristic variables and data structure table of the NL model, the utility functions of the upper level and the lower level are established. The utility functions of the lower level are shown in Equations (8) and (9). The utility functions of the upper level are shown in Equations (10) and (11).
V ( 1 / 1 ) n = β 1 X ( r / m ) 1 + β 2 X ( r / m ) 2 + β 5 X ( r / m ) 5 + β 6 X ( r / m ) 6 + β 9 X ( r / m ) 9 + β 10 X ( r / m ) 10 + β 11 X ( r / m ) 11
V ( 2 / 1 ) n = A S C + β 3 X ( r / m ) 3 + β 4 X ( r / m ) 4 + β 7 X ( r / m ) 7 + β 8 X ( r / m ) 8 + β 12 X ( r / m ) 12 + β 13 X ( r / m ) 13
V 1 n = θ 1 X m 1 + θ 4 X m 4 + θ 5 X m 5 + θ 6 X m 6 + θ 8 X m 8
V 2 n = A S C + θ 2 X m 2 + θ 3 X m 3 + θ 7 X m 7 + θ 9 X m 9

5. Results and Discussion

5.1. Estimation Results of NL Model

Based on the measured data of the survey, Biogeme software was used to calibrate the NL model. The model calibration and inspection results are shown in Table 3. Firstly, according to the calibration and inspection results of the model, the absolute value of the t test of the model variable is greater than 1.65, indicating that the variable has a significant influence on the joint decision behavior of travel time and destination under the ticket strategy at 90% confidence. Secondly, the ratios ρ2 of the lower and upper levels of the NL model are 0.213 and 0.277, respectively, which meet the requirements of accuracy, indicating a strong ability to explain tourists’ decision-making behavior [58]. Moreover, the inclusion coefficient λ2 is the parameter estimation value [59], which reflects the rationality of the NL model structure, and λ2 means that the model structure is reasonable between 0 and 1. The estimate of the inclusion coefficient λ2 in this model is 0.273, which indicates a clear hierarchy between the upper and lower layers of the NL model, and the selected tree structure is reasonable.
From the results of parameter calibration of Table 3, for the lower model regarding the original attractions and changing the destination selection, the variables of occupation, tourist group size, relationship with tourist group, tour duration time, number of visits, tourism motivation, tourist attraction tour time, tourist attraction type, tourist attraction grade, tourist attraction crowding degree, road congestion, and holiday admission ticket prices have a significant influence. The upper model is the decision-making behavior of travel departure time, and the variables of age, family resident population, tour duration time, travel range, last trip time, scenic crowding degree, road congestion, holiday admission ticket prices, and non-holiday admission ticket prices have a significant impact.
(1)
Decision-making behavior analysis of travel destination of the lower model
① Socioeconomic characteristics: The estimated coefficient β1 of occupation is positive, indicating that administrative personnel and workers are more inclined to go to their originally planned tourist attractions, which may be due to the limited travel time of this group, and their travel destinations are mostly planned and not easy to change due to time constraints.
② Tour characteristics: The estimated coefficient β2 of the tourist group is positive, indicating that the greater the number of tourists in a group, the more inclined they are to visit the original tourist attractions. This may be because a larger group size requires more planning, making it more difficult to change the destination. The estimated coefficient β3 of the relationship with one’s tourist group is negative, indicating that tourists traveling with family and friends are less inclined to change tourist attractions, which may be because the travel plan of a group is not easy to change. The estimated coefficient β4 of tour duration time is positive, indicating that with more days of travel, tourists are more inclined to change tourist attractions. The estimated coefficient β5 of the number of visits is negative, indicating that with the increase in the number of visits to the original tourist attraction, tourists are more inclined to change tourist attractions. The estimated coefficient β6 of tourism motivation is positive, which indicates that the tourists with leisure and sightseeing motives are more inclined to continue to the original planned tourist attraction. The estimated coefficient β7 is positive, indicating that tourists who visit tourist attractions for less than 4 h are more inclined to change tourist attractions.
③ Tourist attraction characteristics: The estimated coefficient β8 of tourist attraction type is positive, indicating that tourists who plan to visit tourist attractions are more inclined to change tourist attractions. The estimated coefficient β9 of tourist attraction grade is positive, indicating that when the tourist attraction tourists planned to visit is 3A or above, they are more inclined to continue to that original tourist attraction. The estimated coefficient β10 of tourist attraction ticket price is positive, indicating that tourists are more inclined to go to the original tourist attraction if the ticket price is less than 100 yuan. The estimated coefficient β11 of the crowding degree of tourist attractions was negative, indicating that the more crowded the planned site is, the more inclined tourists are to change sites.
④ External conditions: The estimated coefficient β12 of road congestion around tourist attractions is positive, indicating that tourists are more inclined to change tourist attractions as the congestion duration increases. The estimated coefficient β13 of holiday admission ticket prices is positive, indicating that tourists are more inclined to change tourist attractions if the tourist attractions they planned to visit implement a holiday admission ticket price increase strategy.
(2)
Decision-making behavior analysis of travel time of upper model
① Socioeconomic characteristics: The estimated coefficient θ1 of age is positive, indicating that tourists aged between 18 and 44 are more inclined to travel during holidays, which may be because these people mostly go to work or school and have time off during holidays. The estimated coefficient θ2 of family resident population is positive, indicating that the tourist groups of 1–2 people are more inclined to go on non-holiday trips. This may be because families with more permanent residents have more people to consider and their time is mutually influenced and restricted, so most of them can only go on holiday trips.
② Tour characteristics: The estimated coefficient θ3 of tour duration time is positive, indicating that the more days of travel, the more tourists tend to travel in non-holidays.
③ Tourist attraction characteristics: The estimated coefficient θ6 of the crowding degree of tourist attractions is negative, indicating that the more crowded tourist attractions are during a holiday, the less inclined tourists are to visit it during the holiday.
④ Travel characteristics: The estimated coefficient of travel range θ4 is positive, which indicates that the tourists who travel in the city and its suburbs are more inclined to travel during holidays. The estimated coefficient θ5 is positive, indicating that the tourists whose last trip time was during the holiday are more inclined to travel during the holiday.
⑤ External conditions: The estimated coefficient θ7 of road congestion around tourist attractions is positive, indicating that tourists are more inclined to travel during non-holidays given the increase in road congestion duration during holidays. The estimated coefficient θ8 of holiday admission ticket prices is negative, which indicates that tourists are less inclined to travel during holidays if the tourist attractions planned to go to implement a holiday admission ticket price increase strategy. The non-holiday admission ticket coefficient θ9 is positive, indicating that tourists are more inclined to travel during non-holidays if the tourist attraction tickets are discounted.

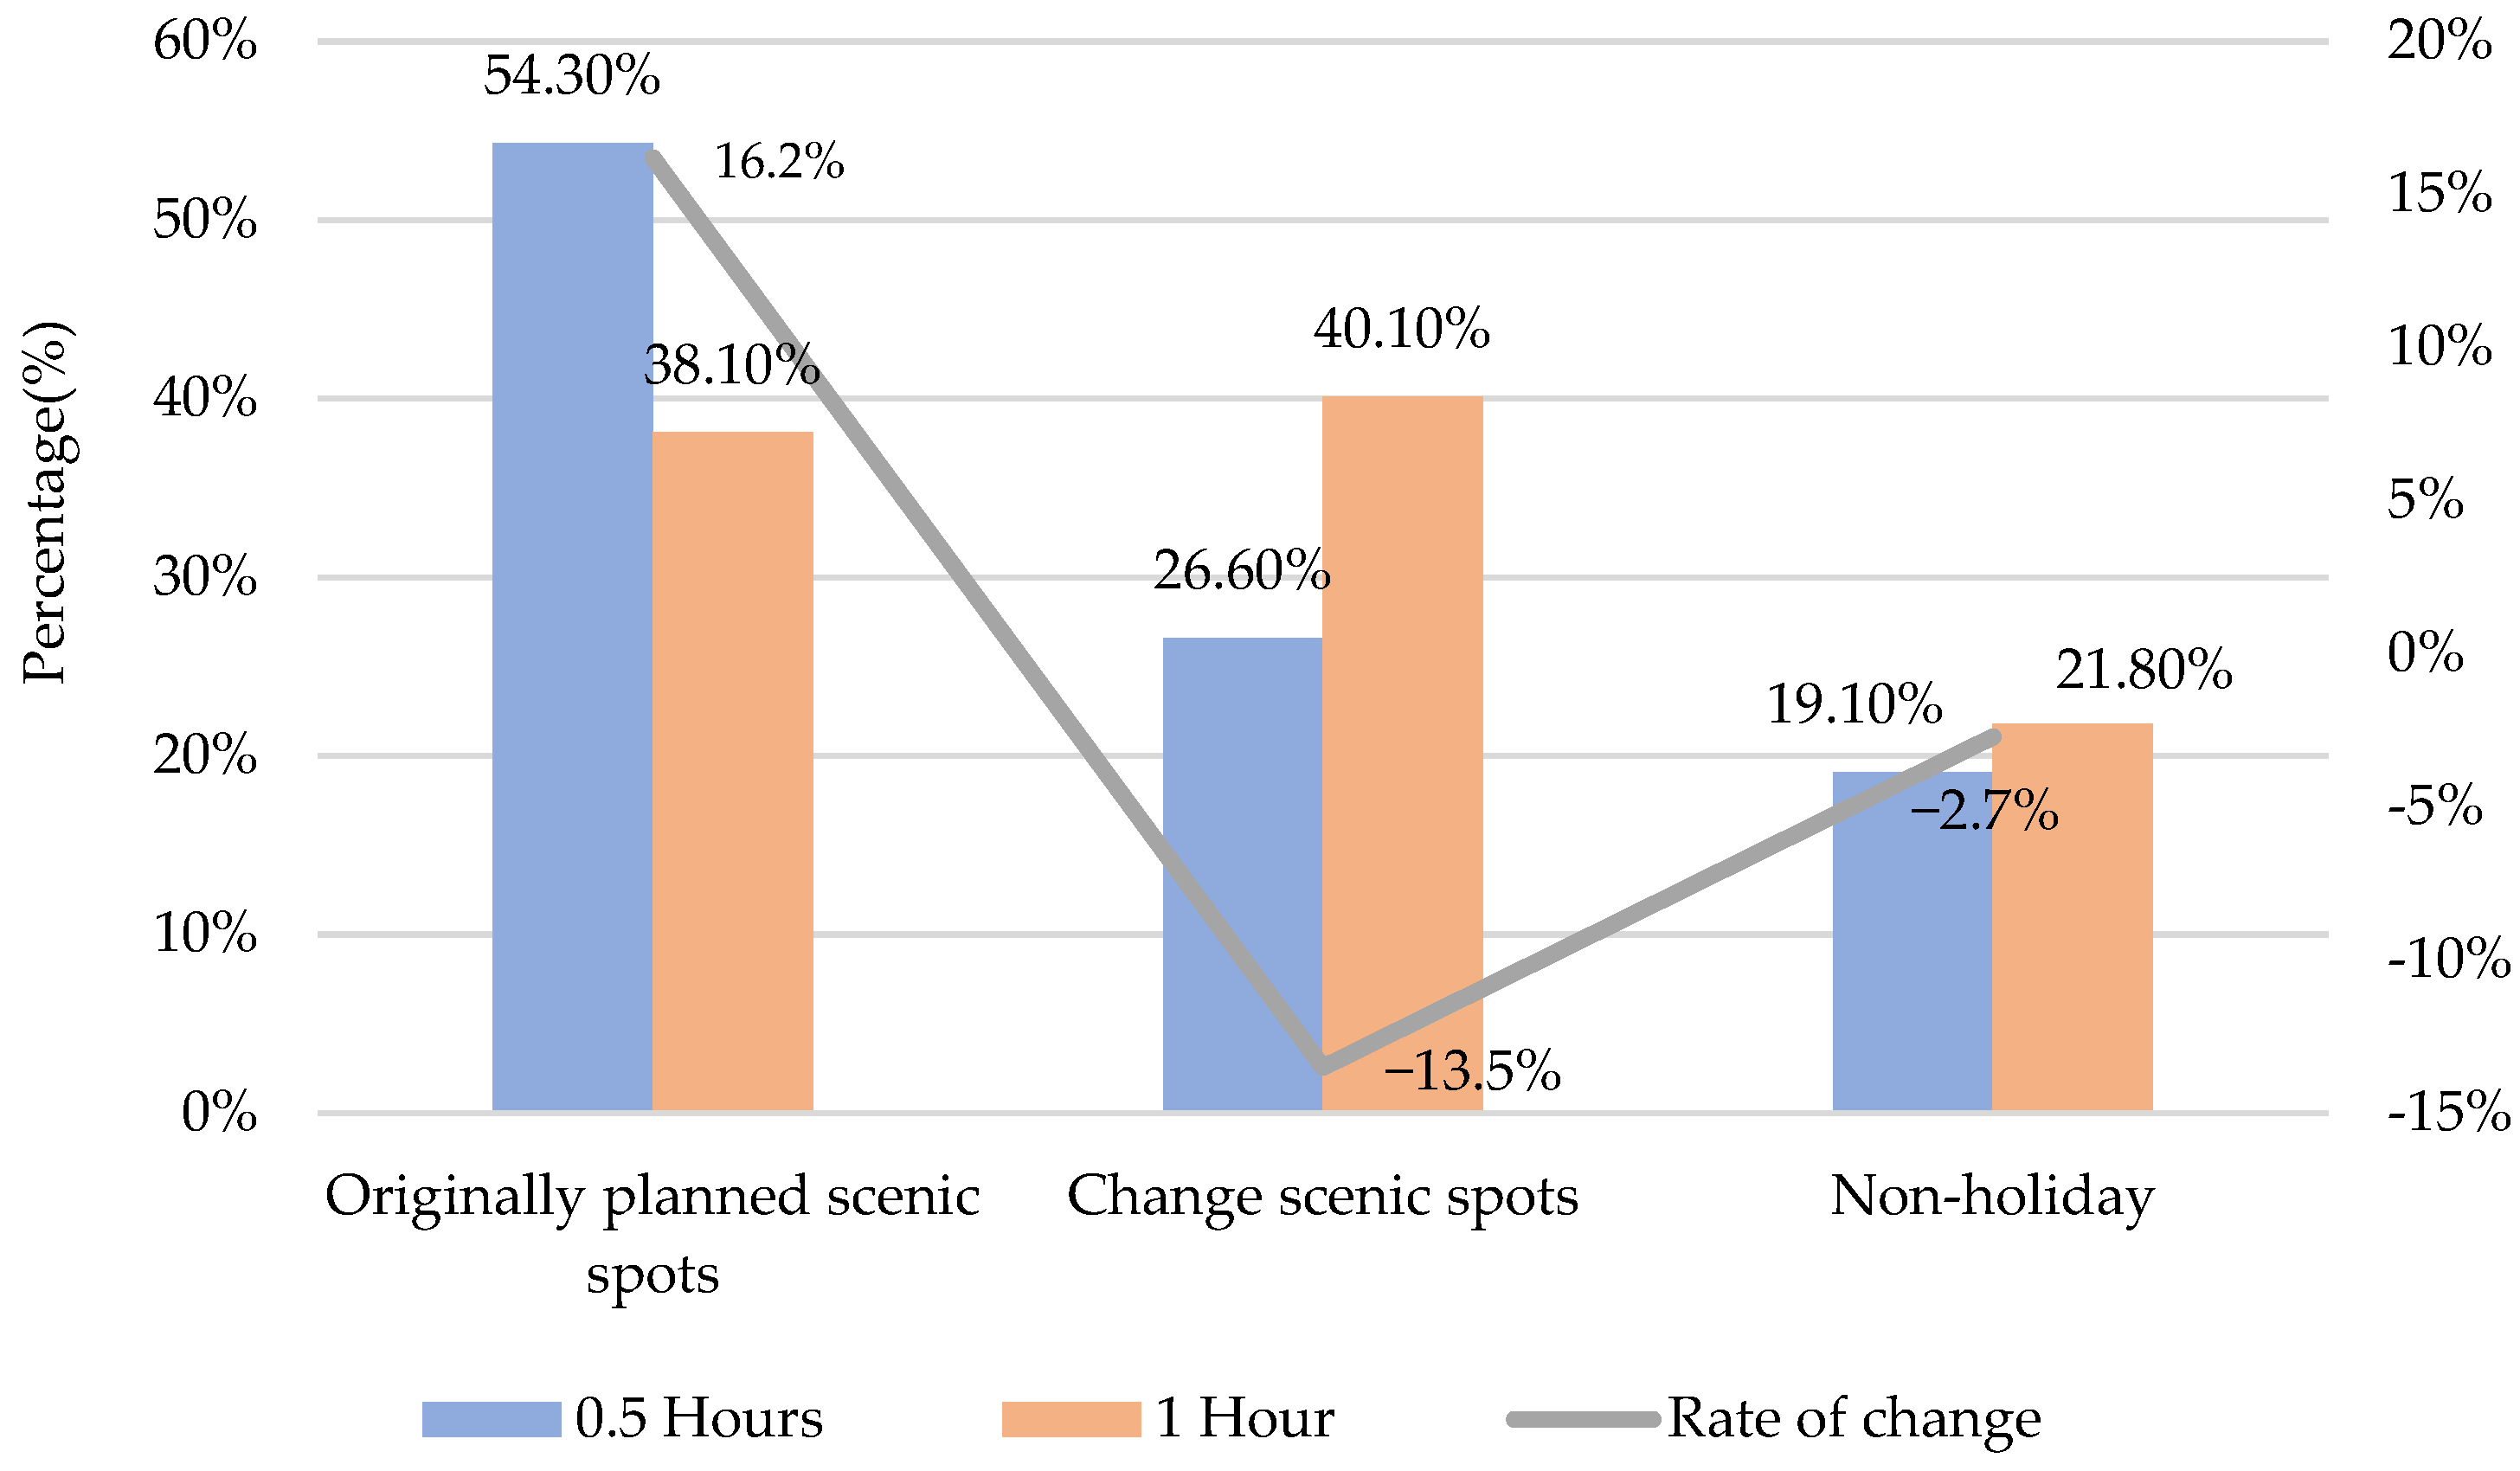
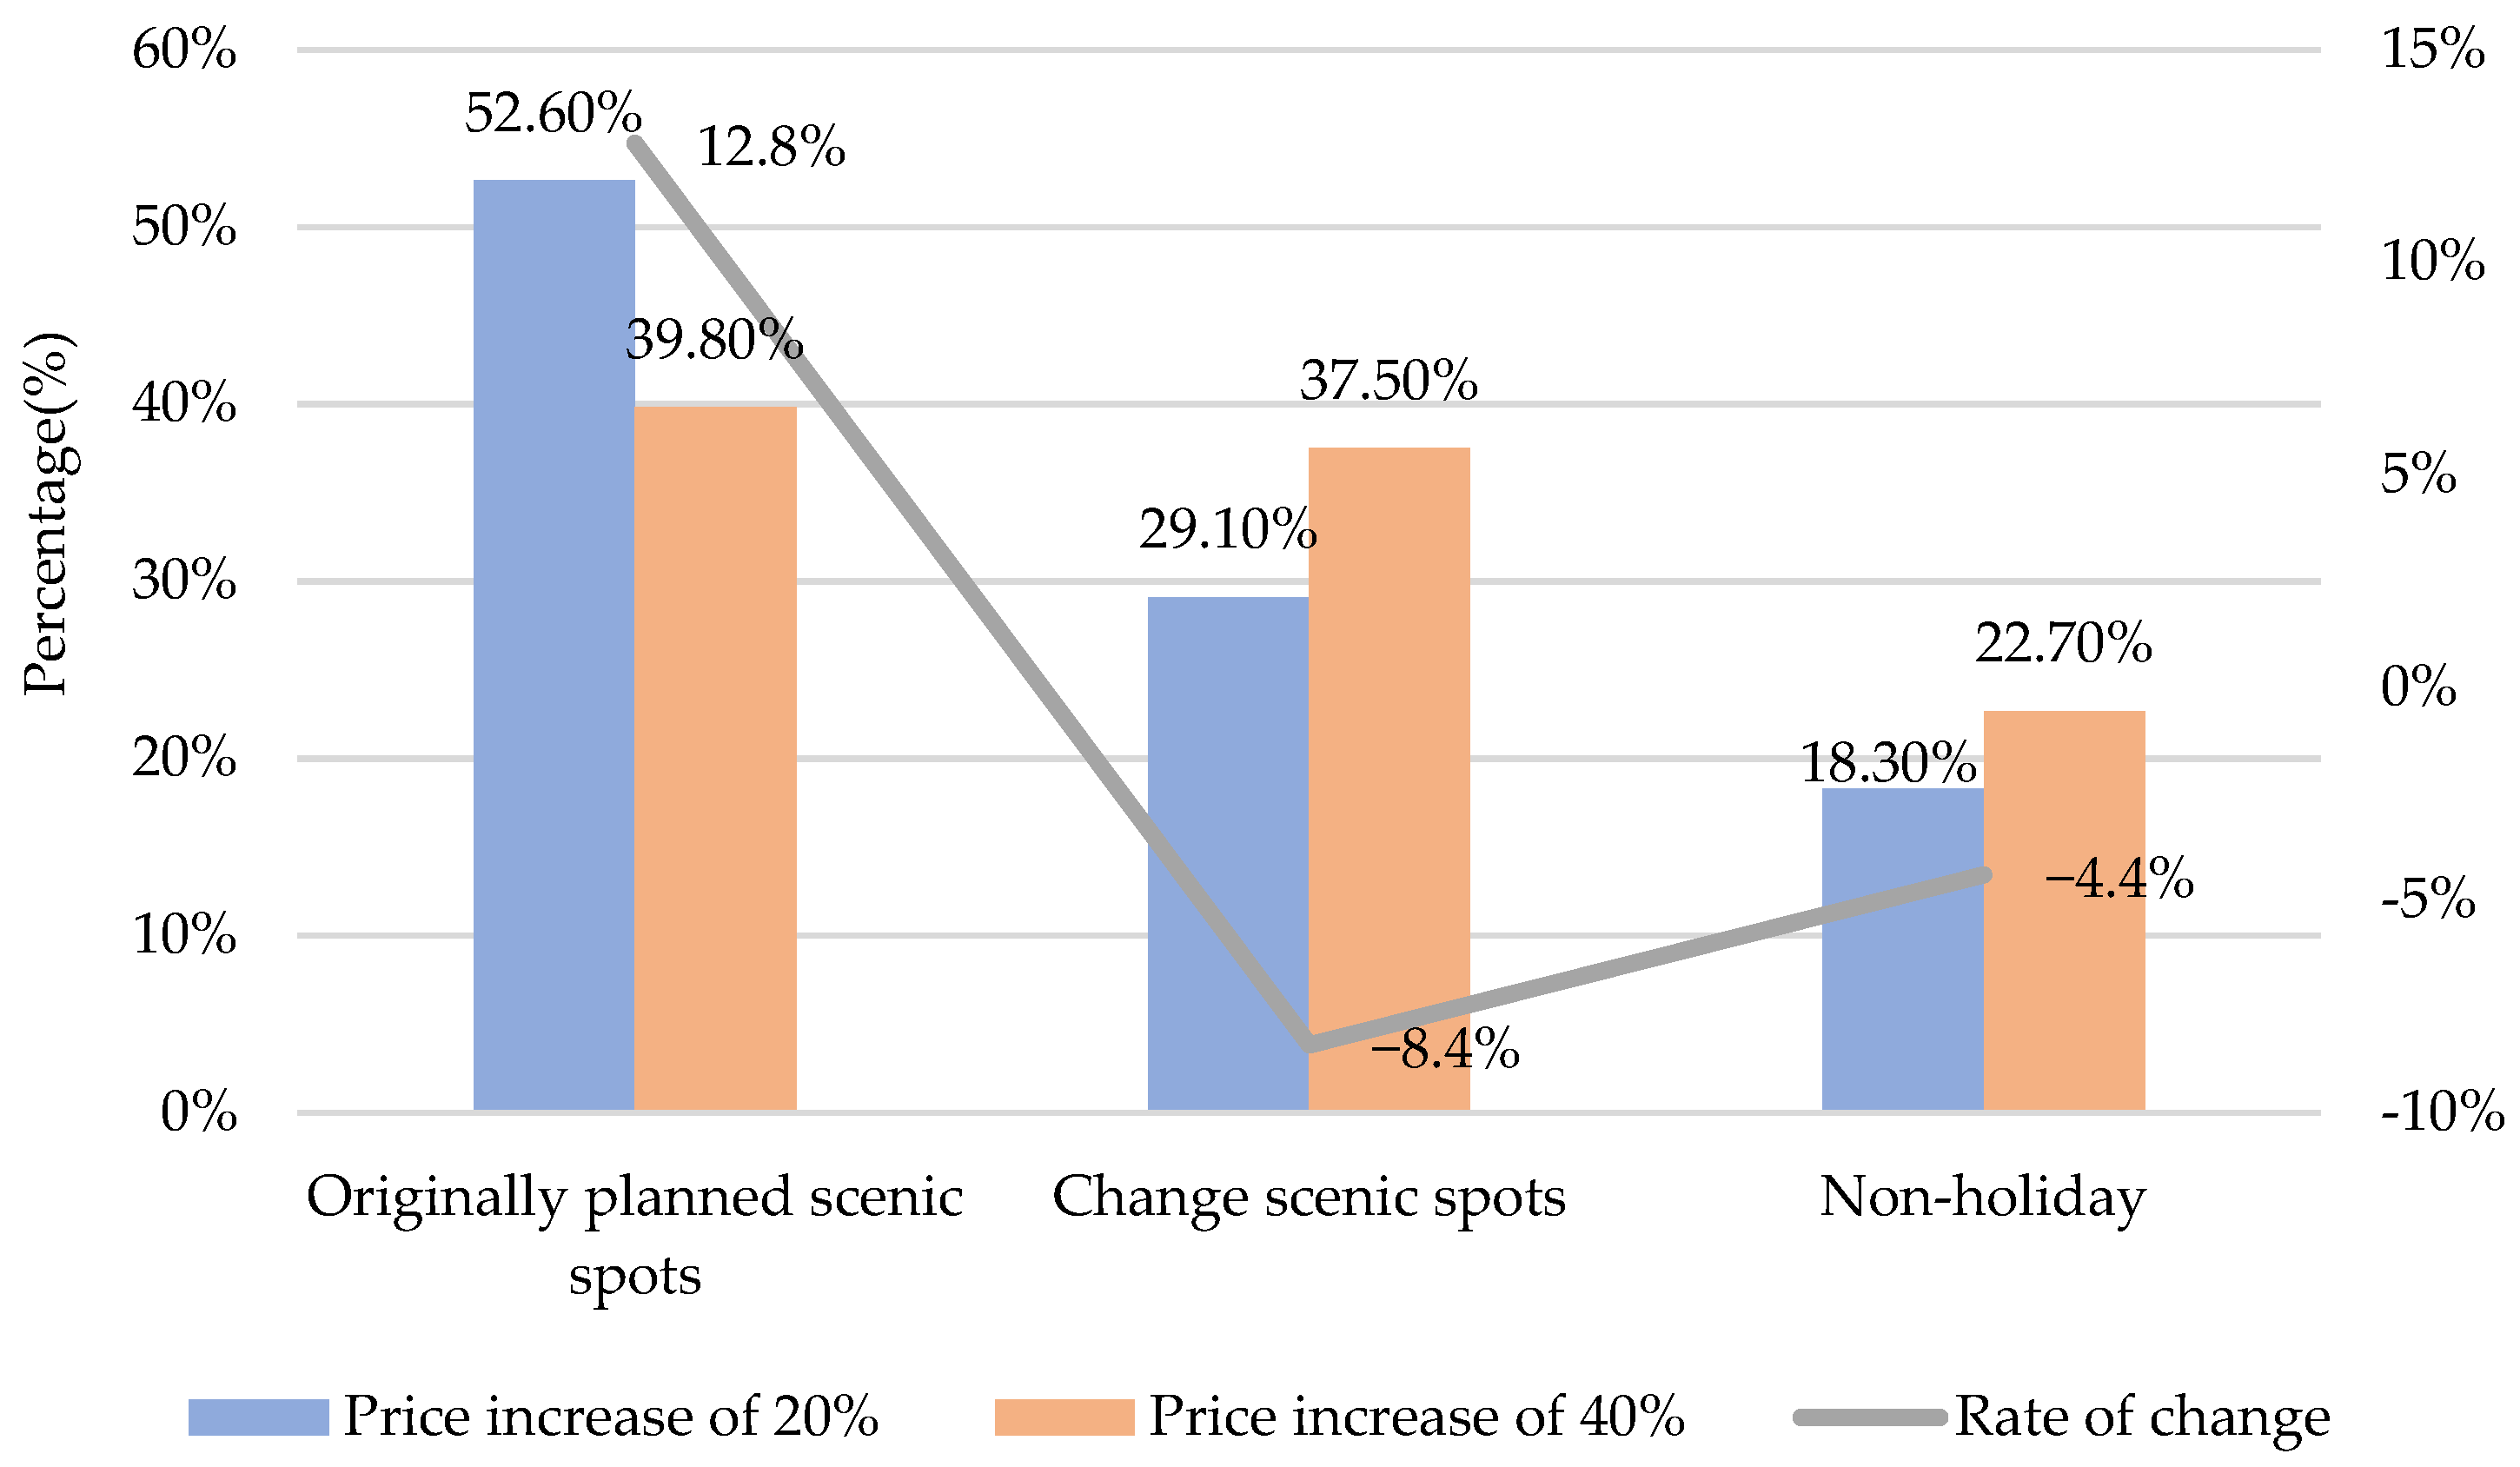
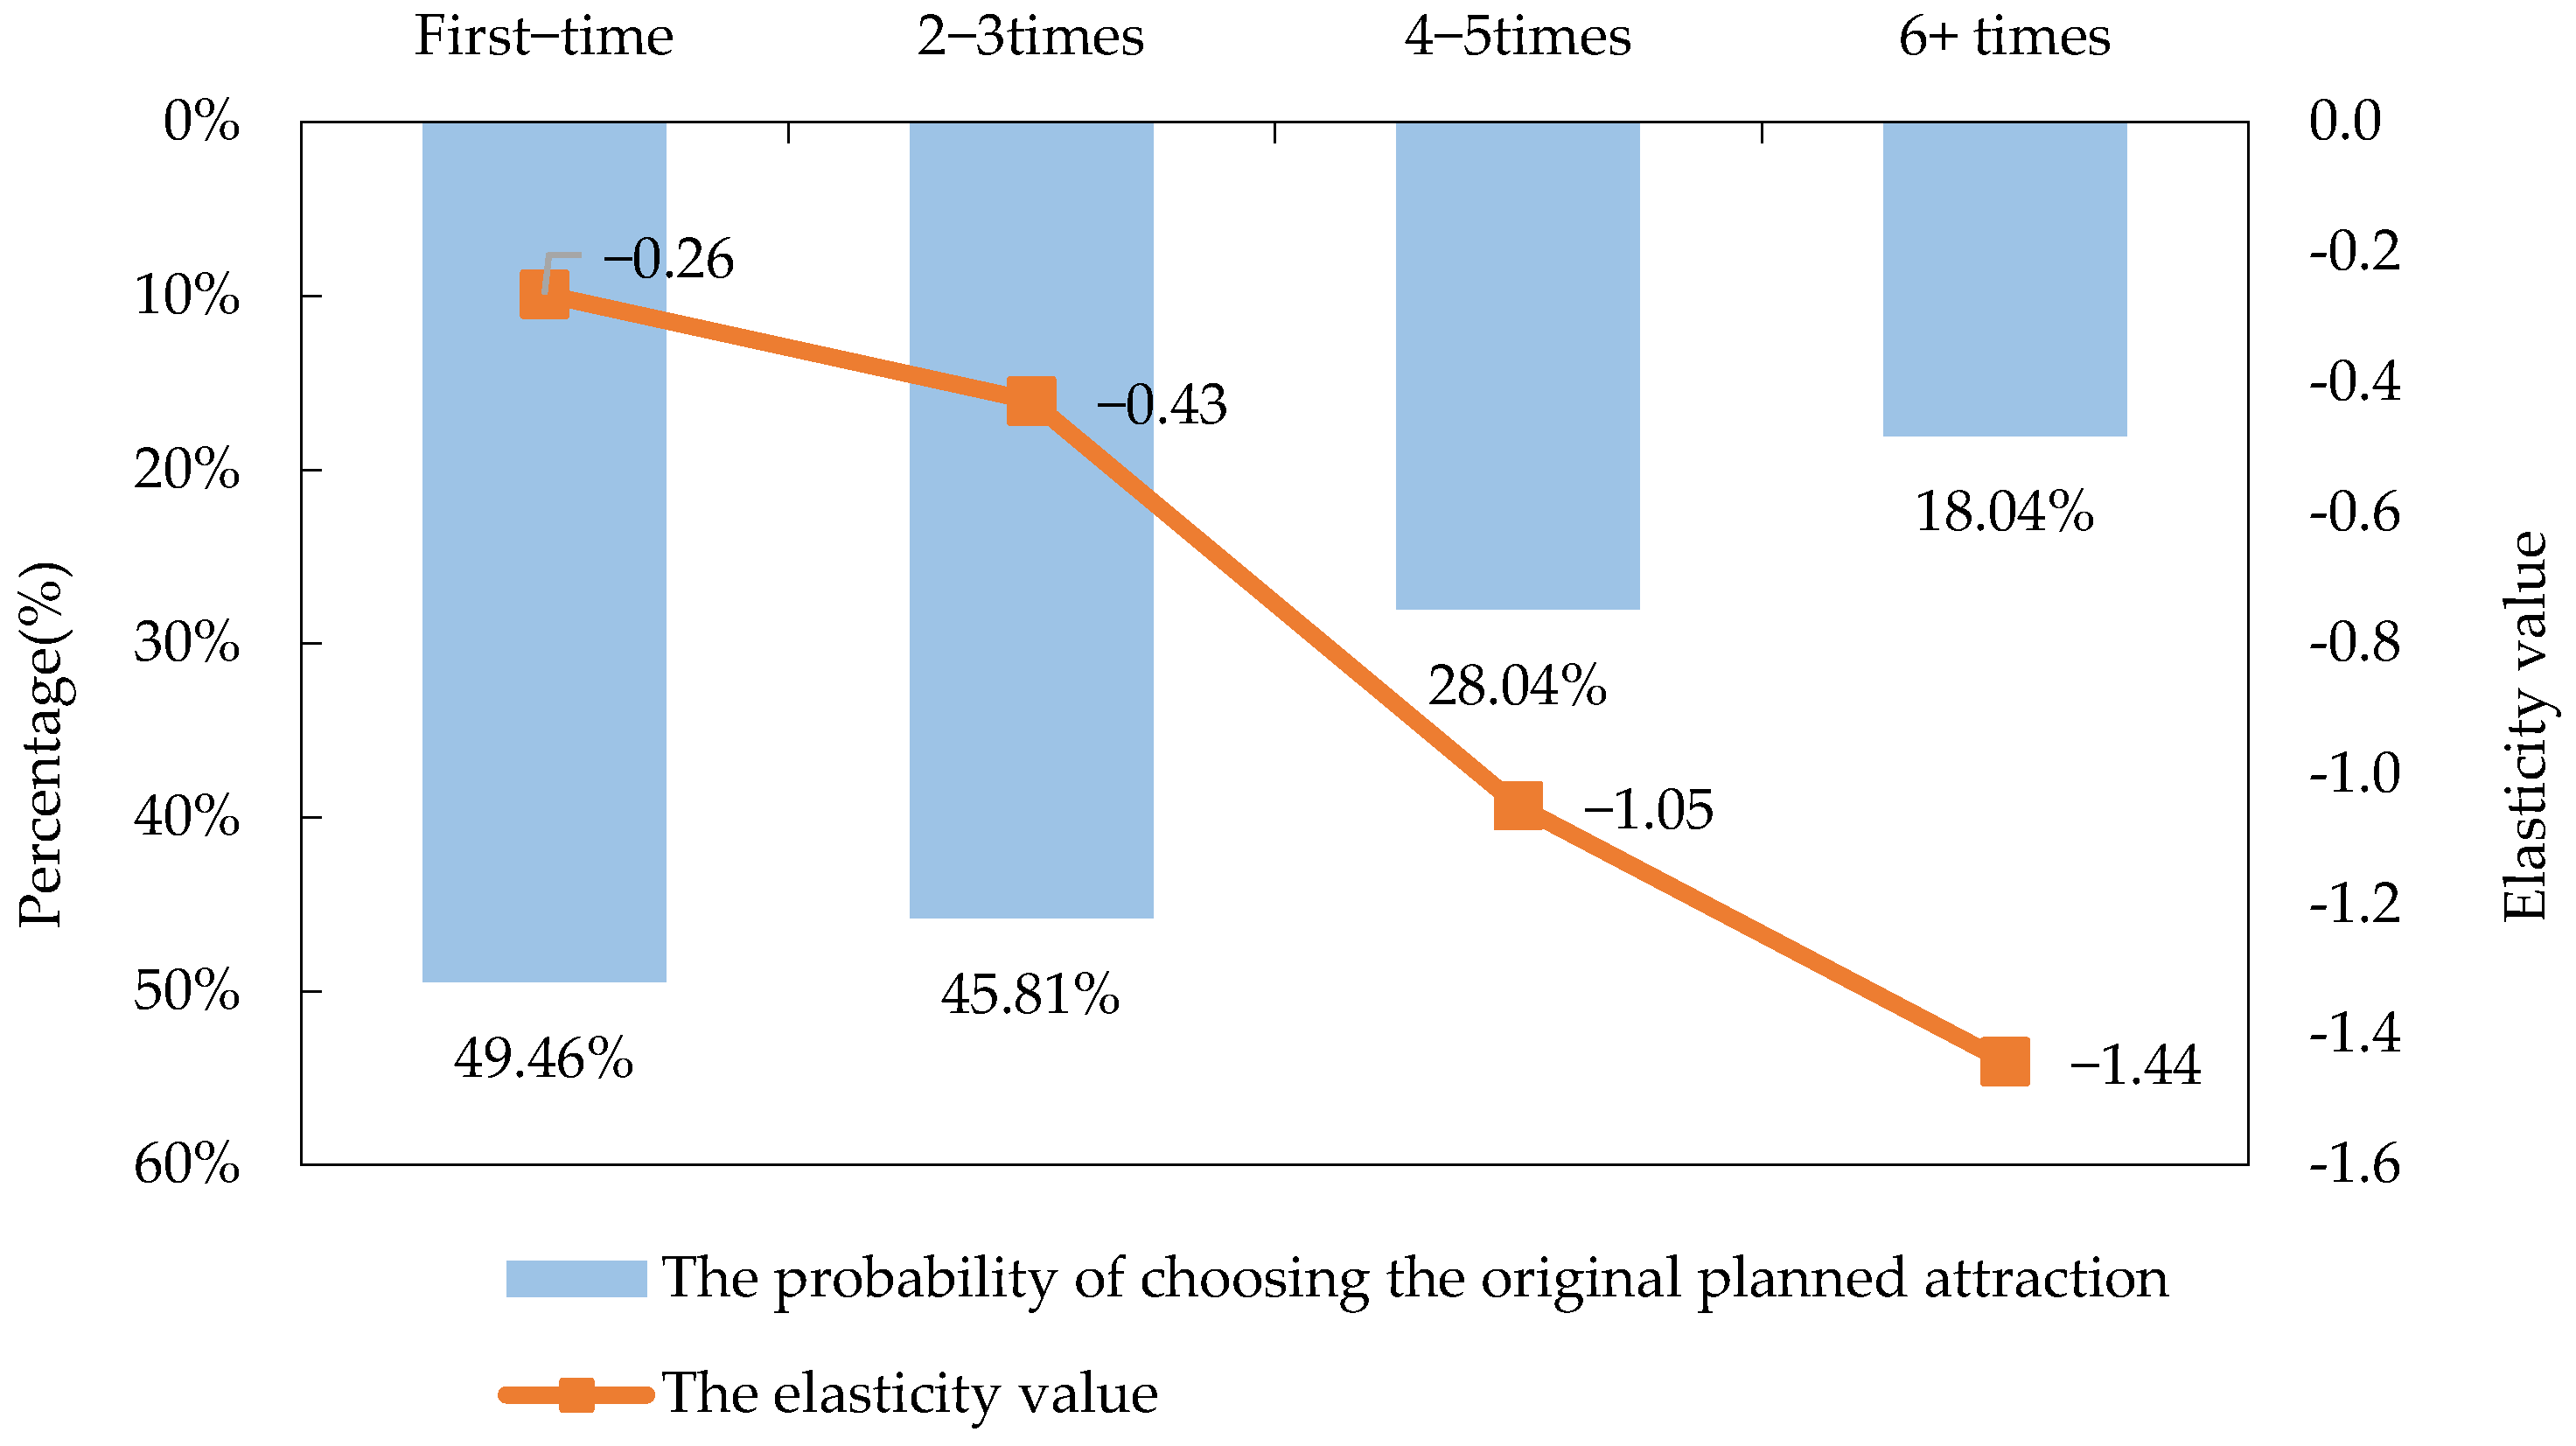
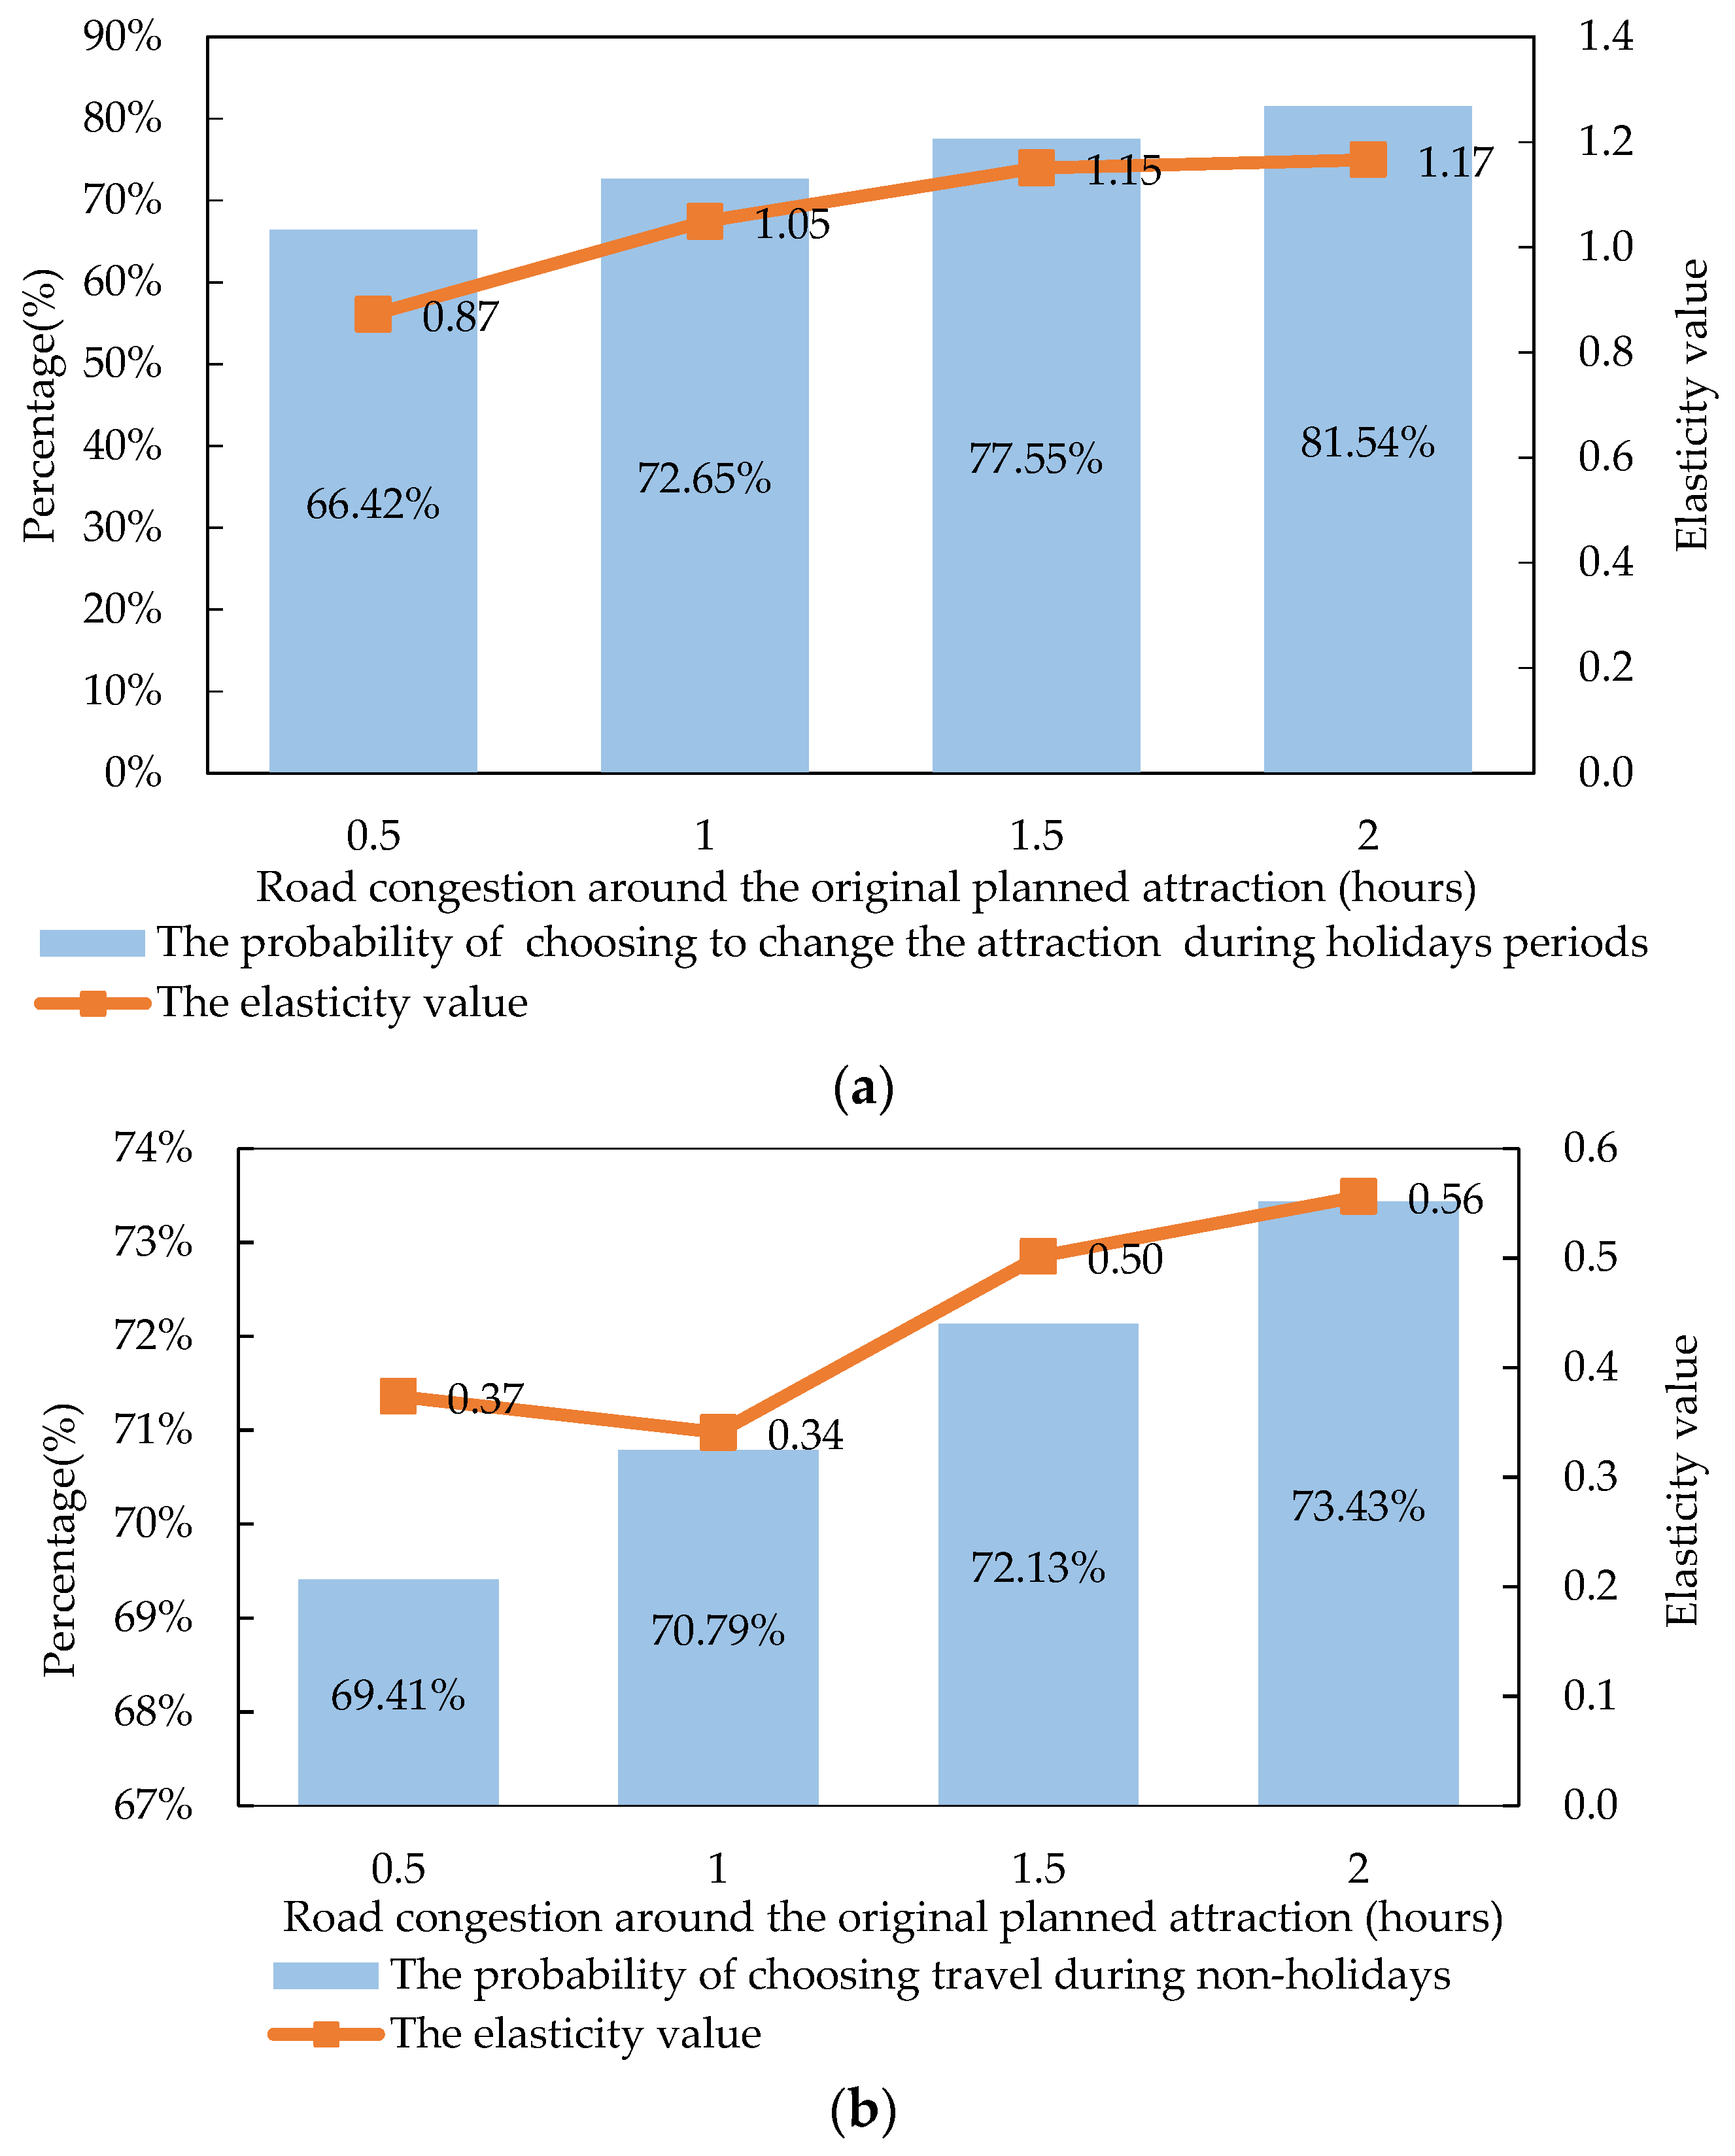
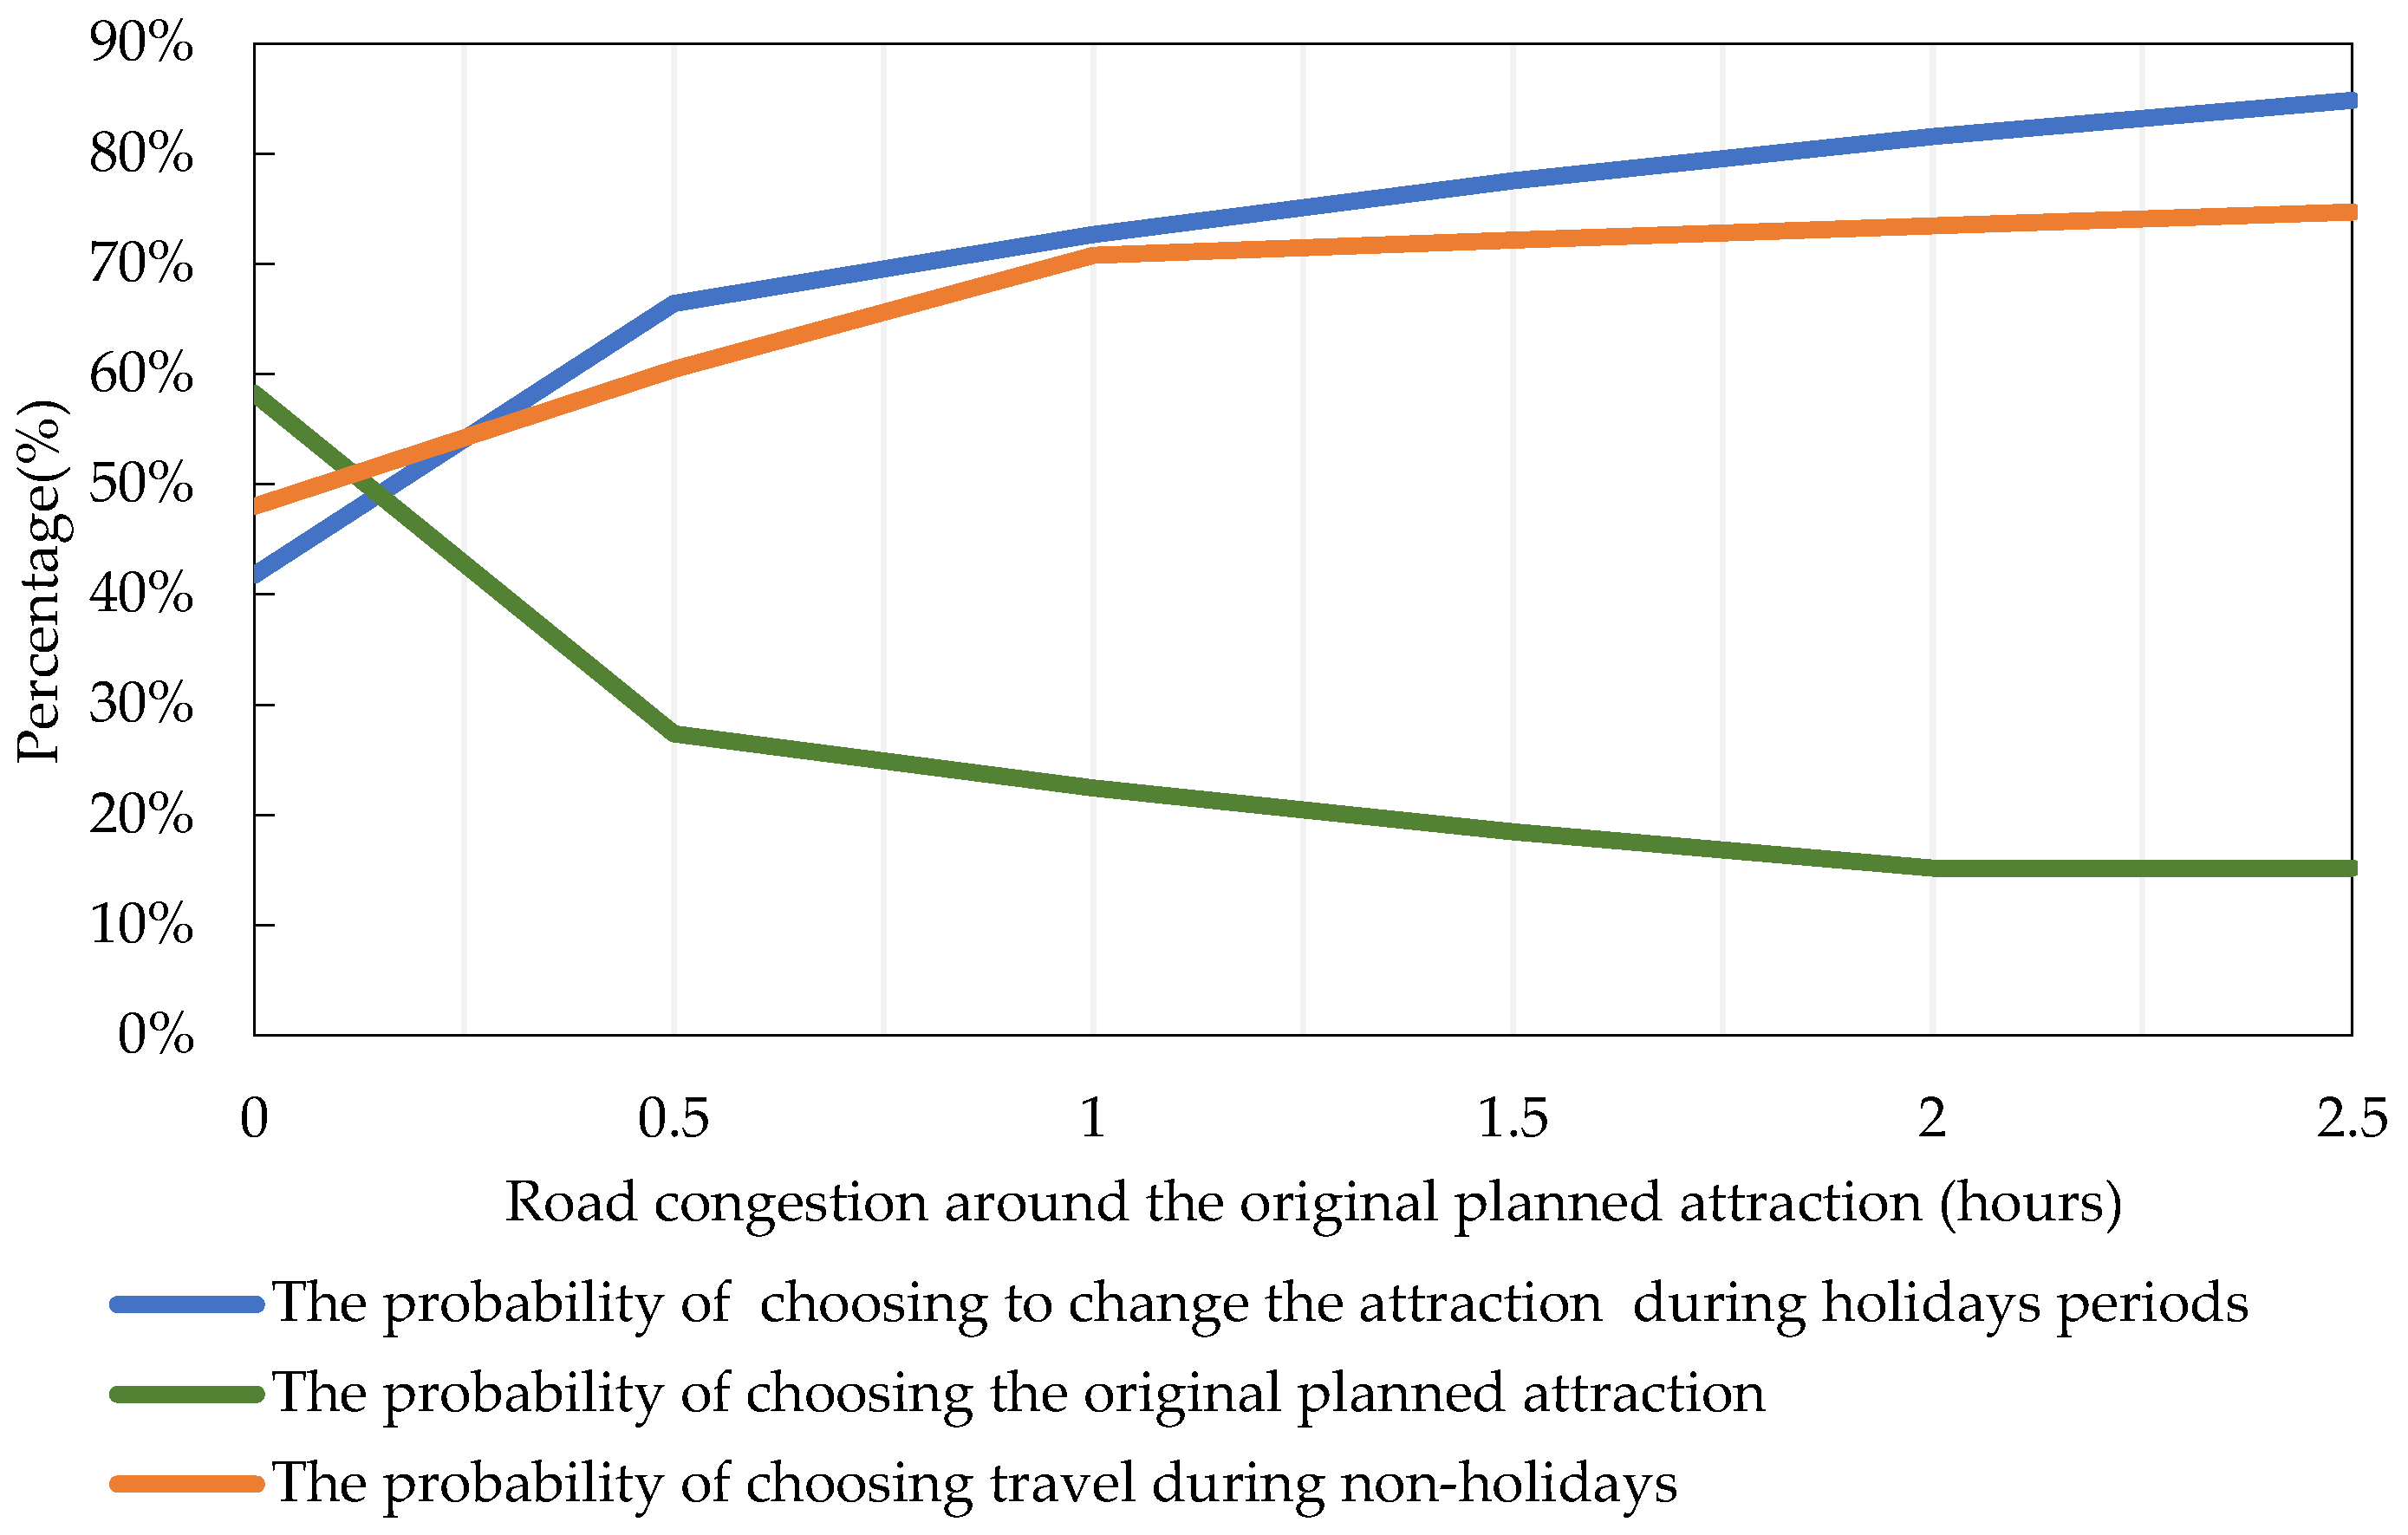
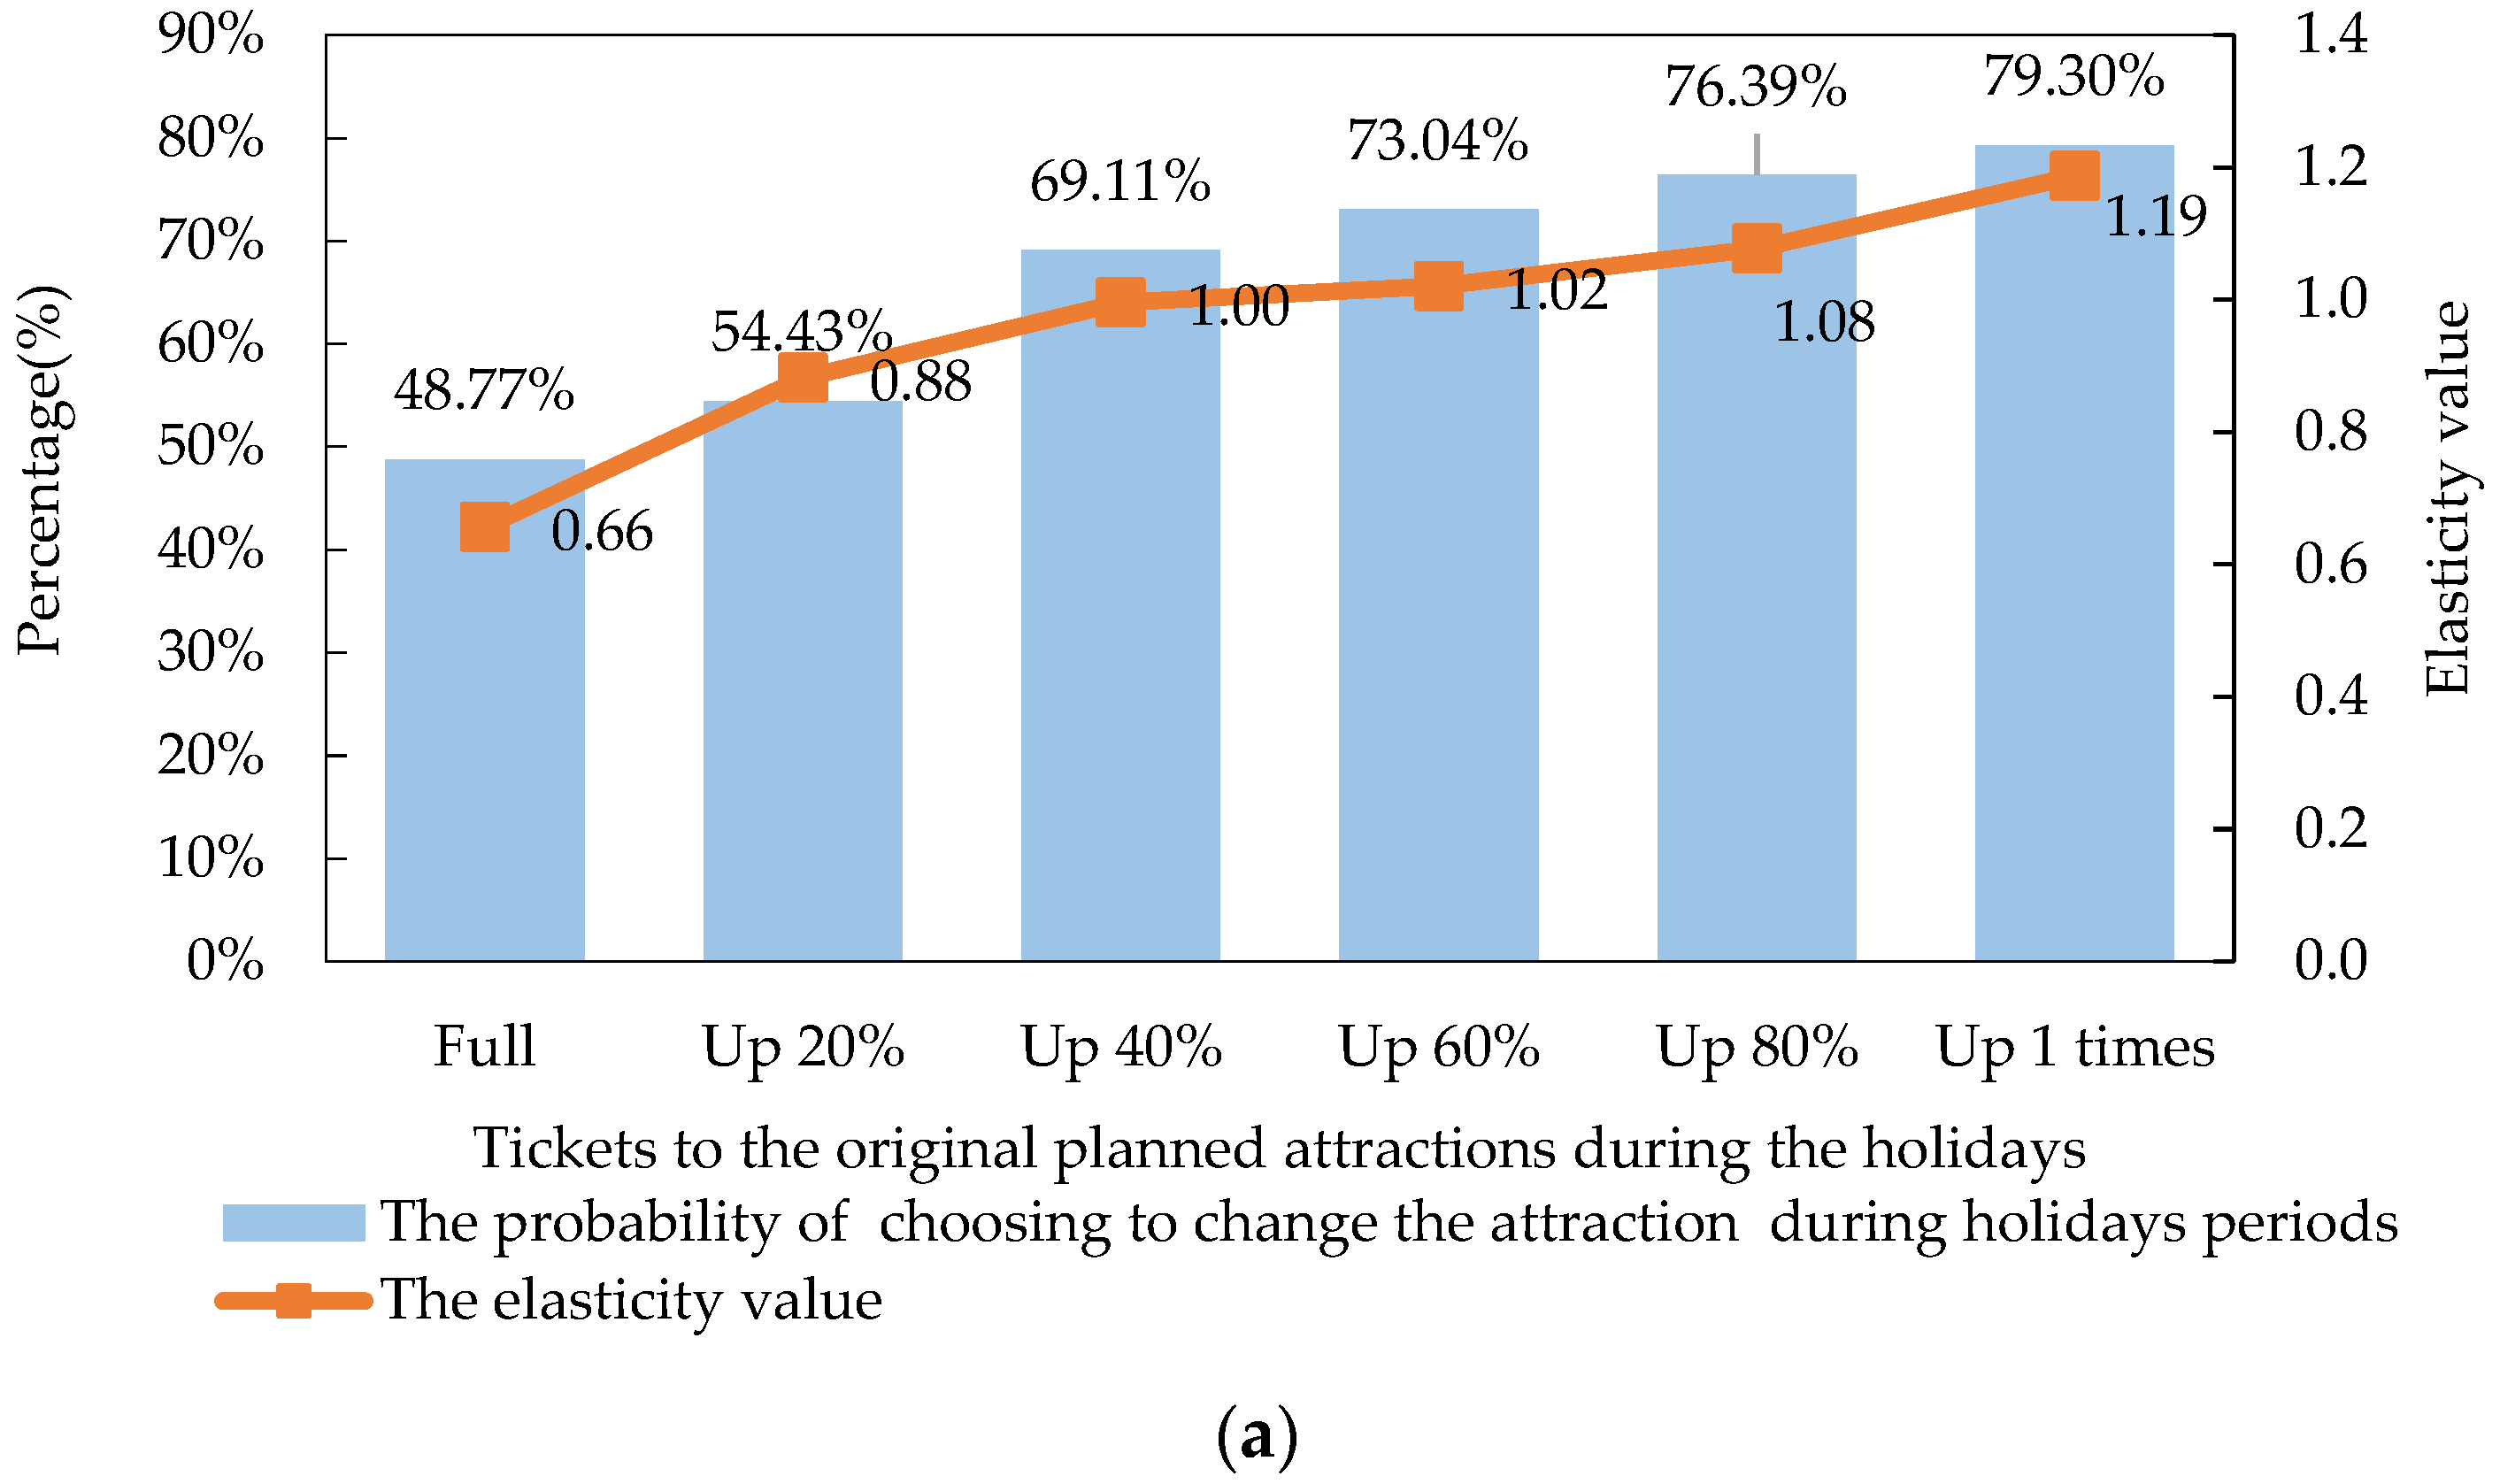
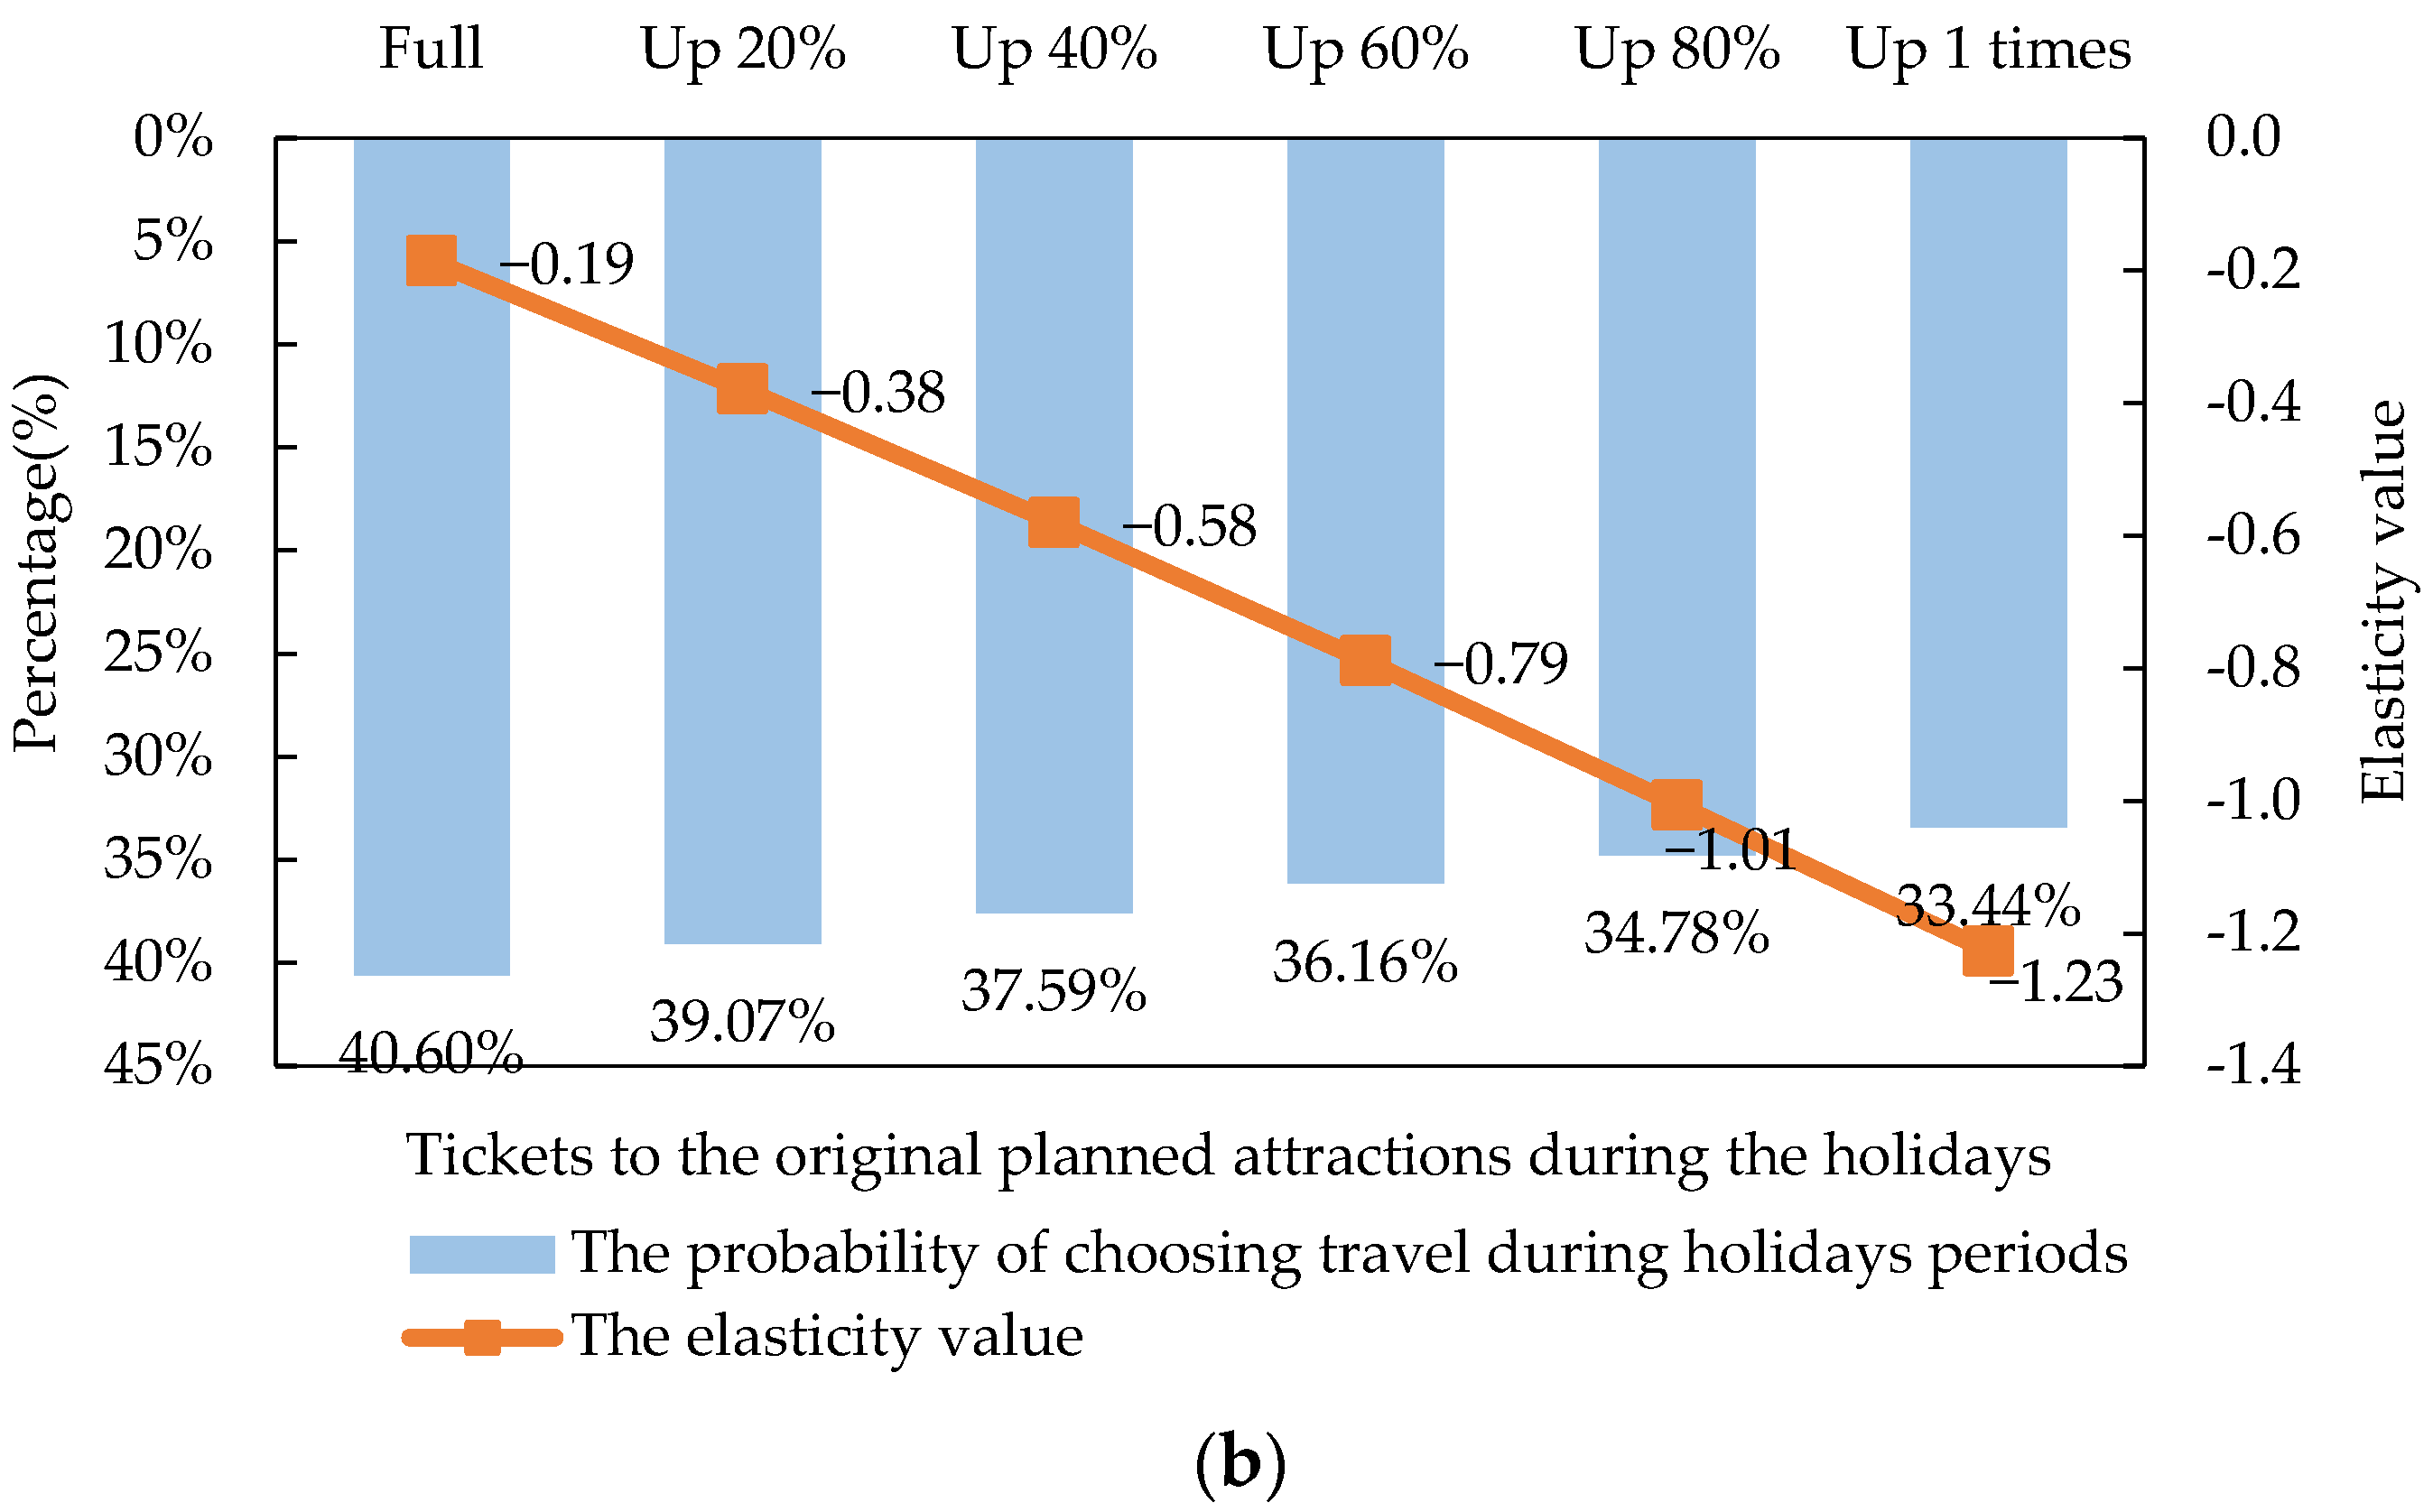
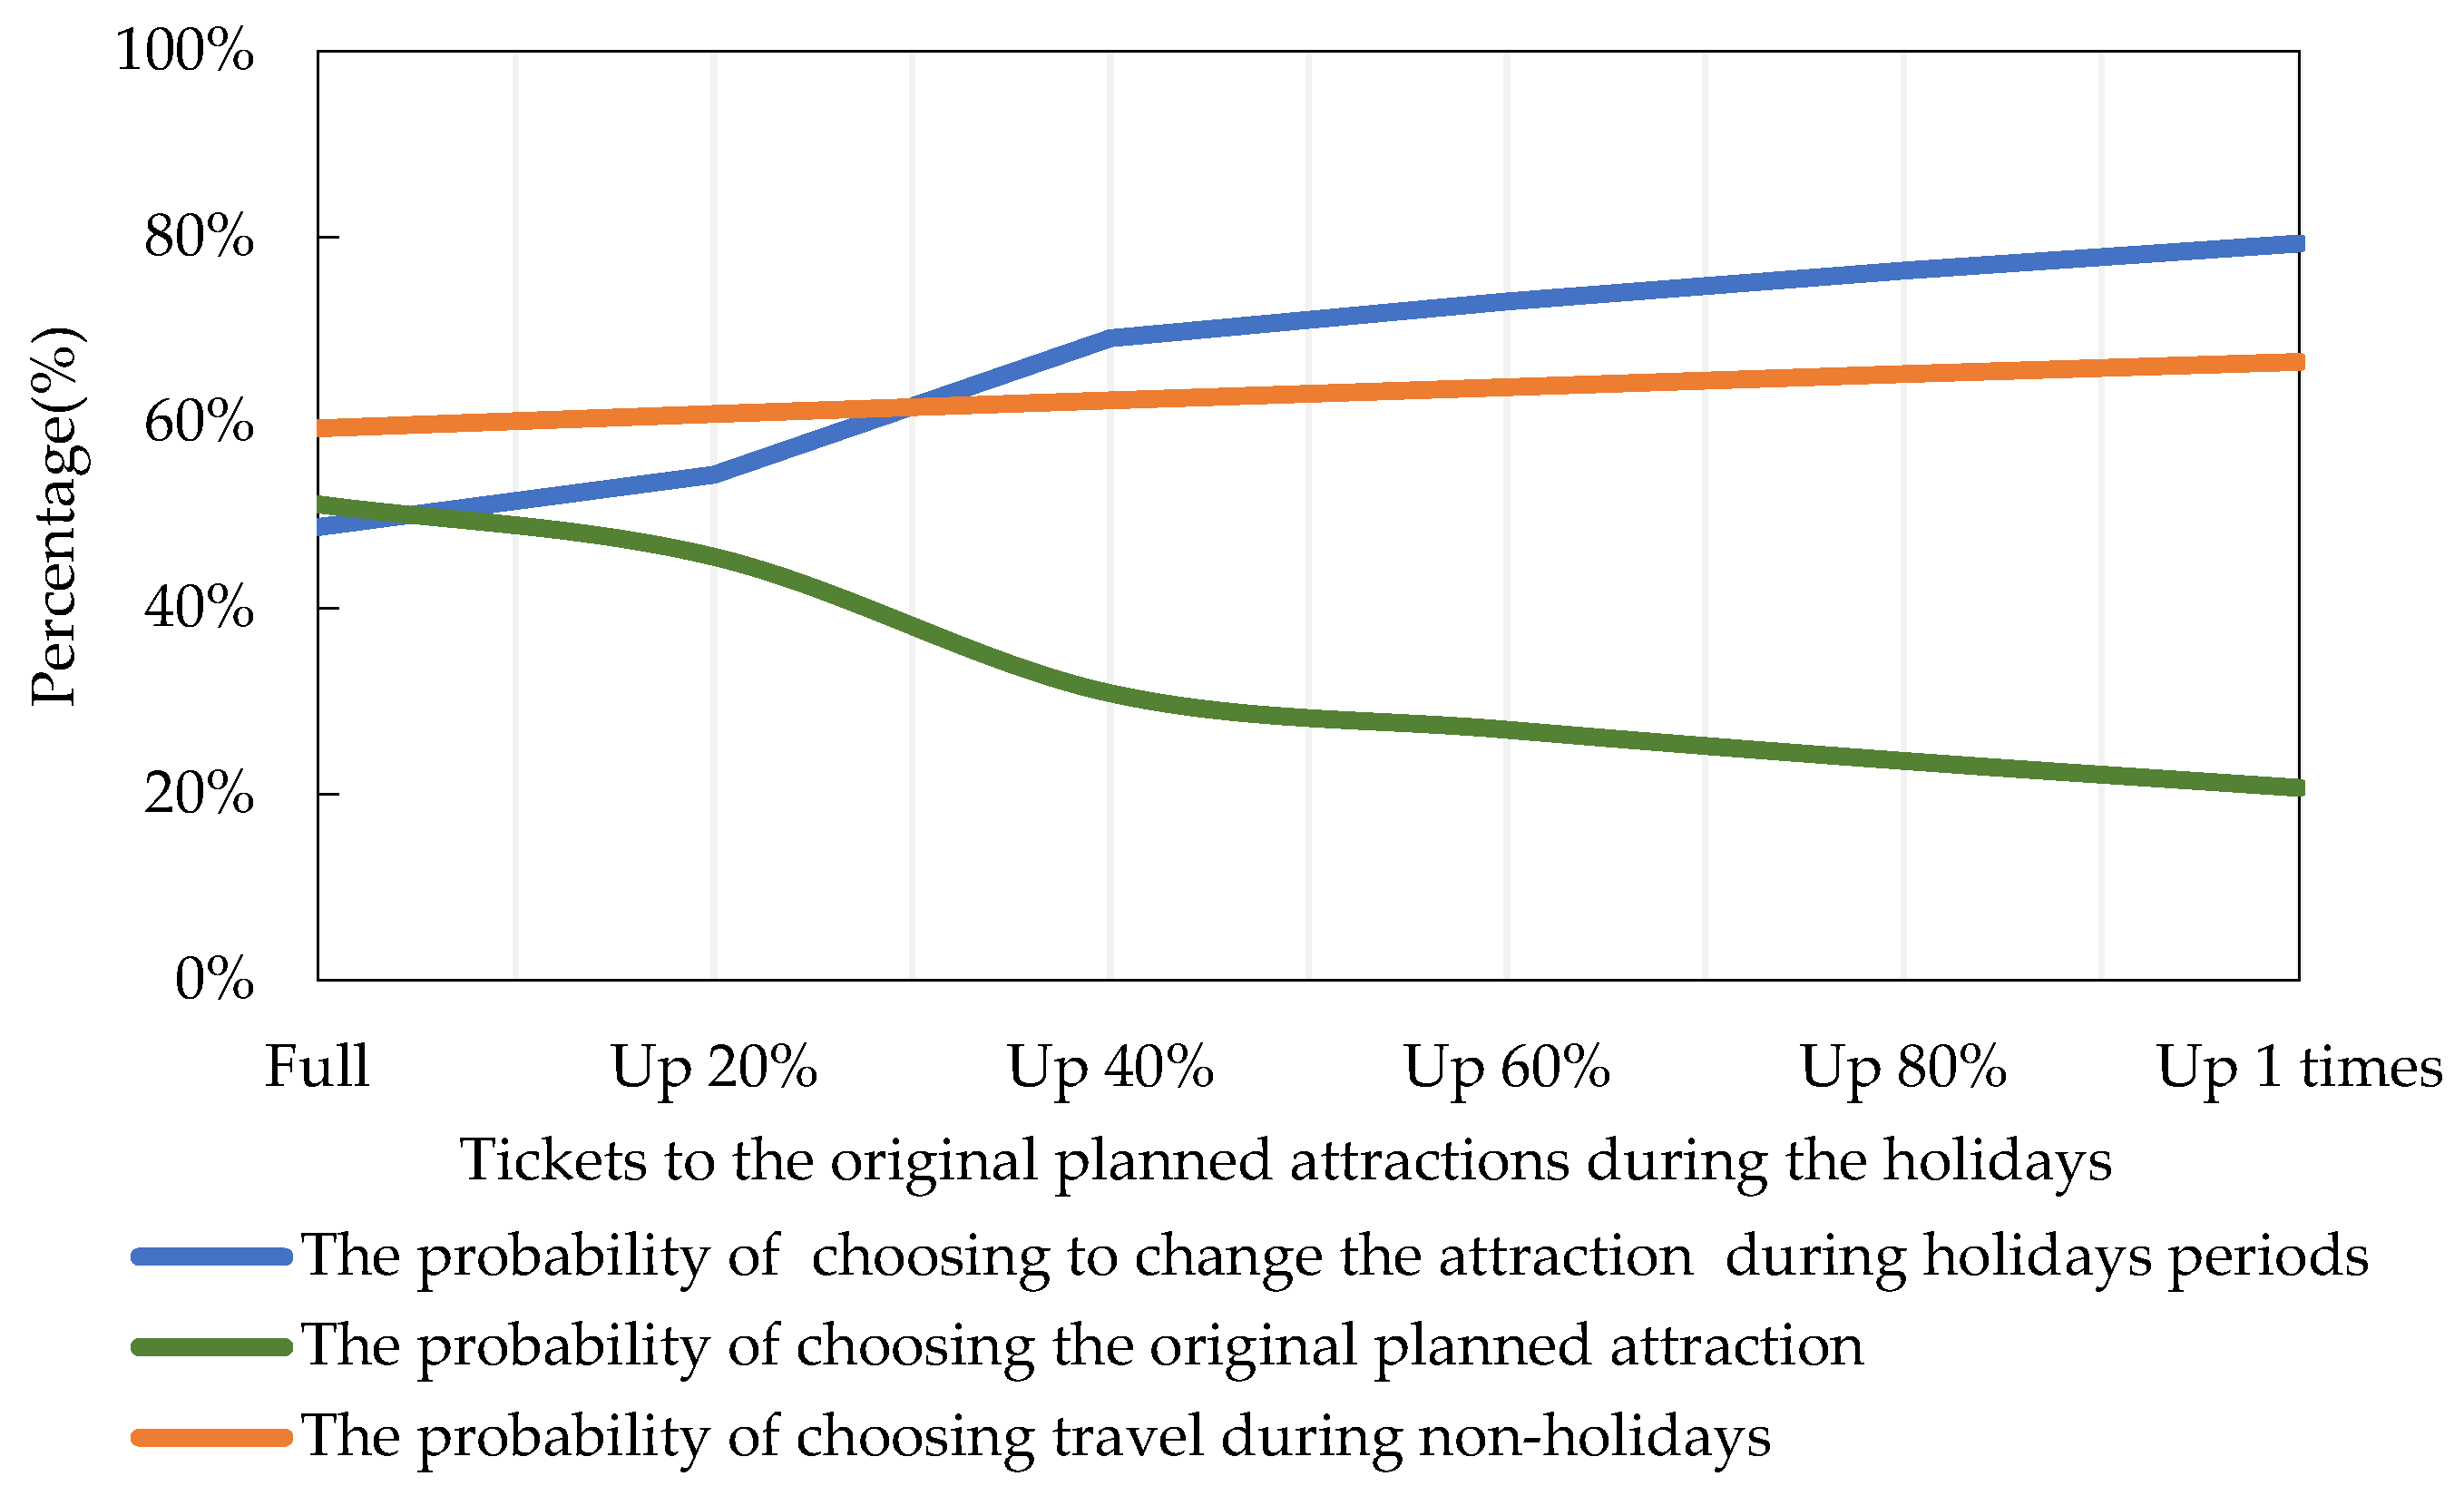
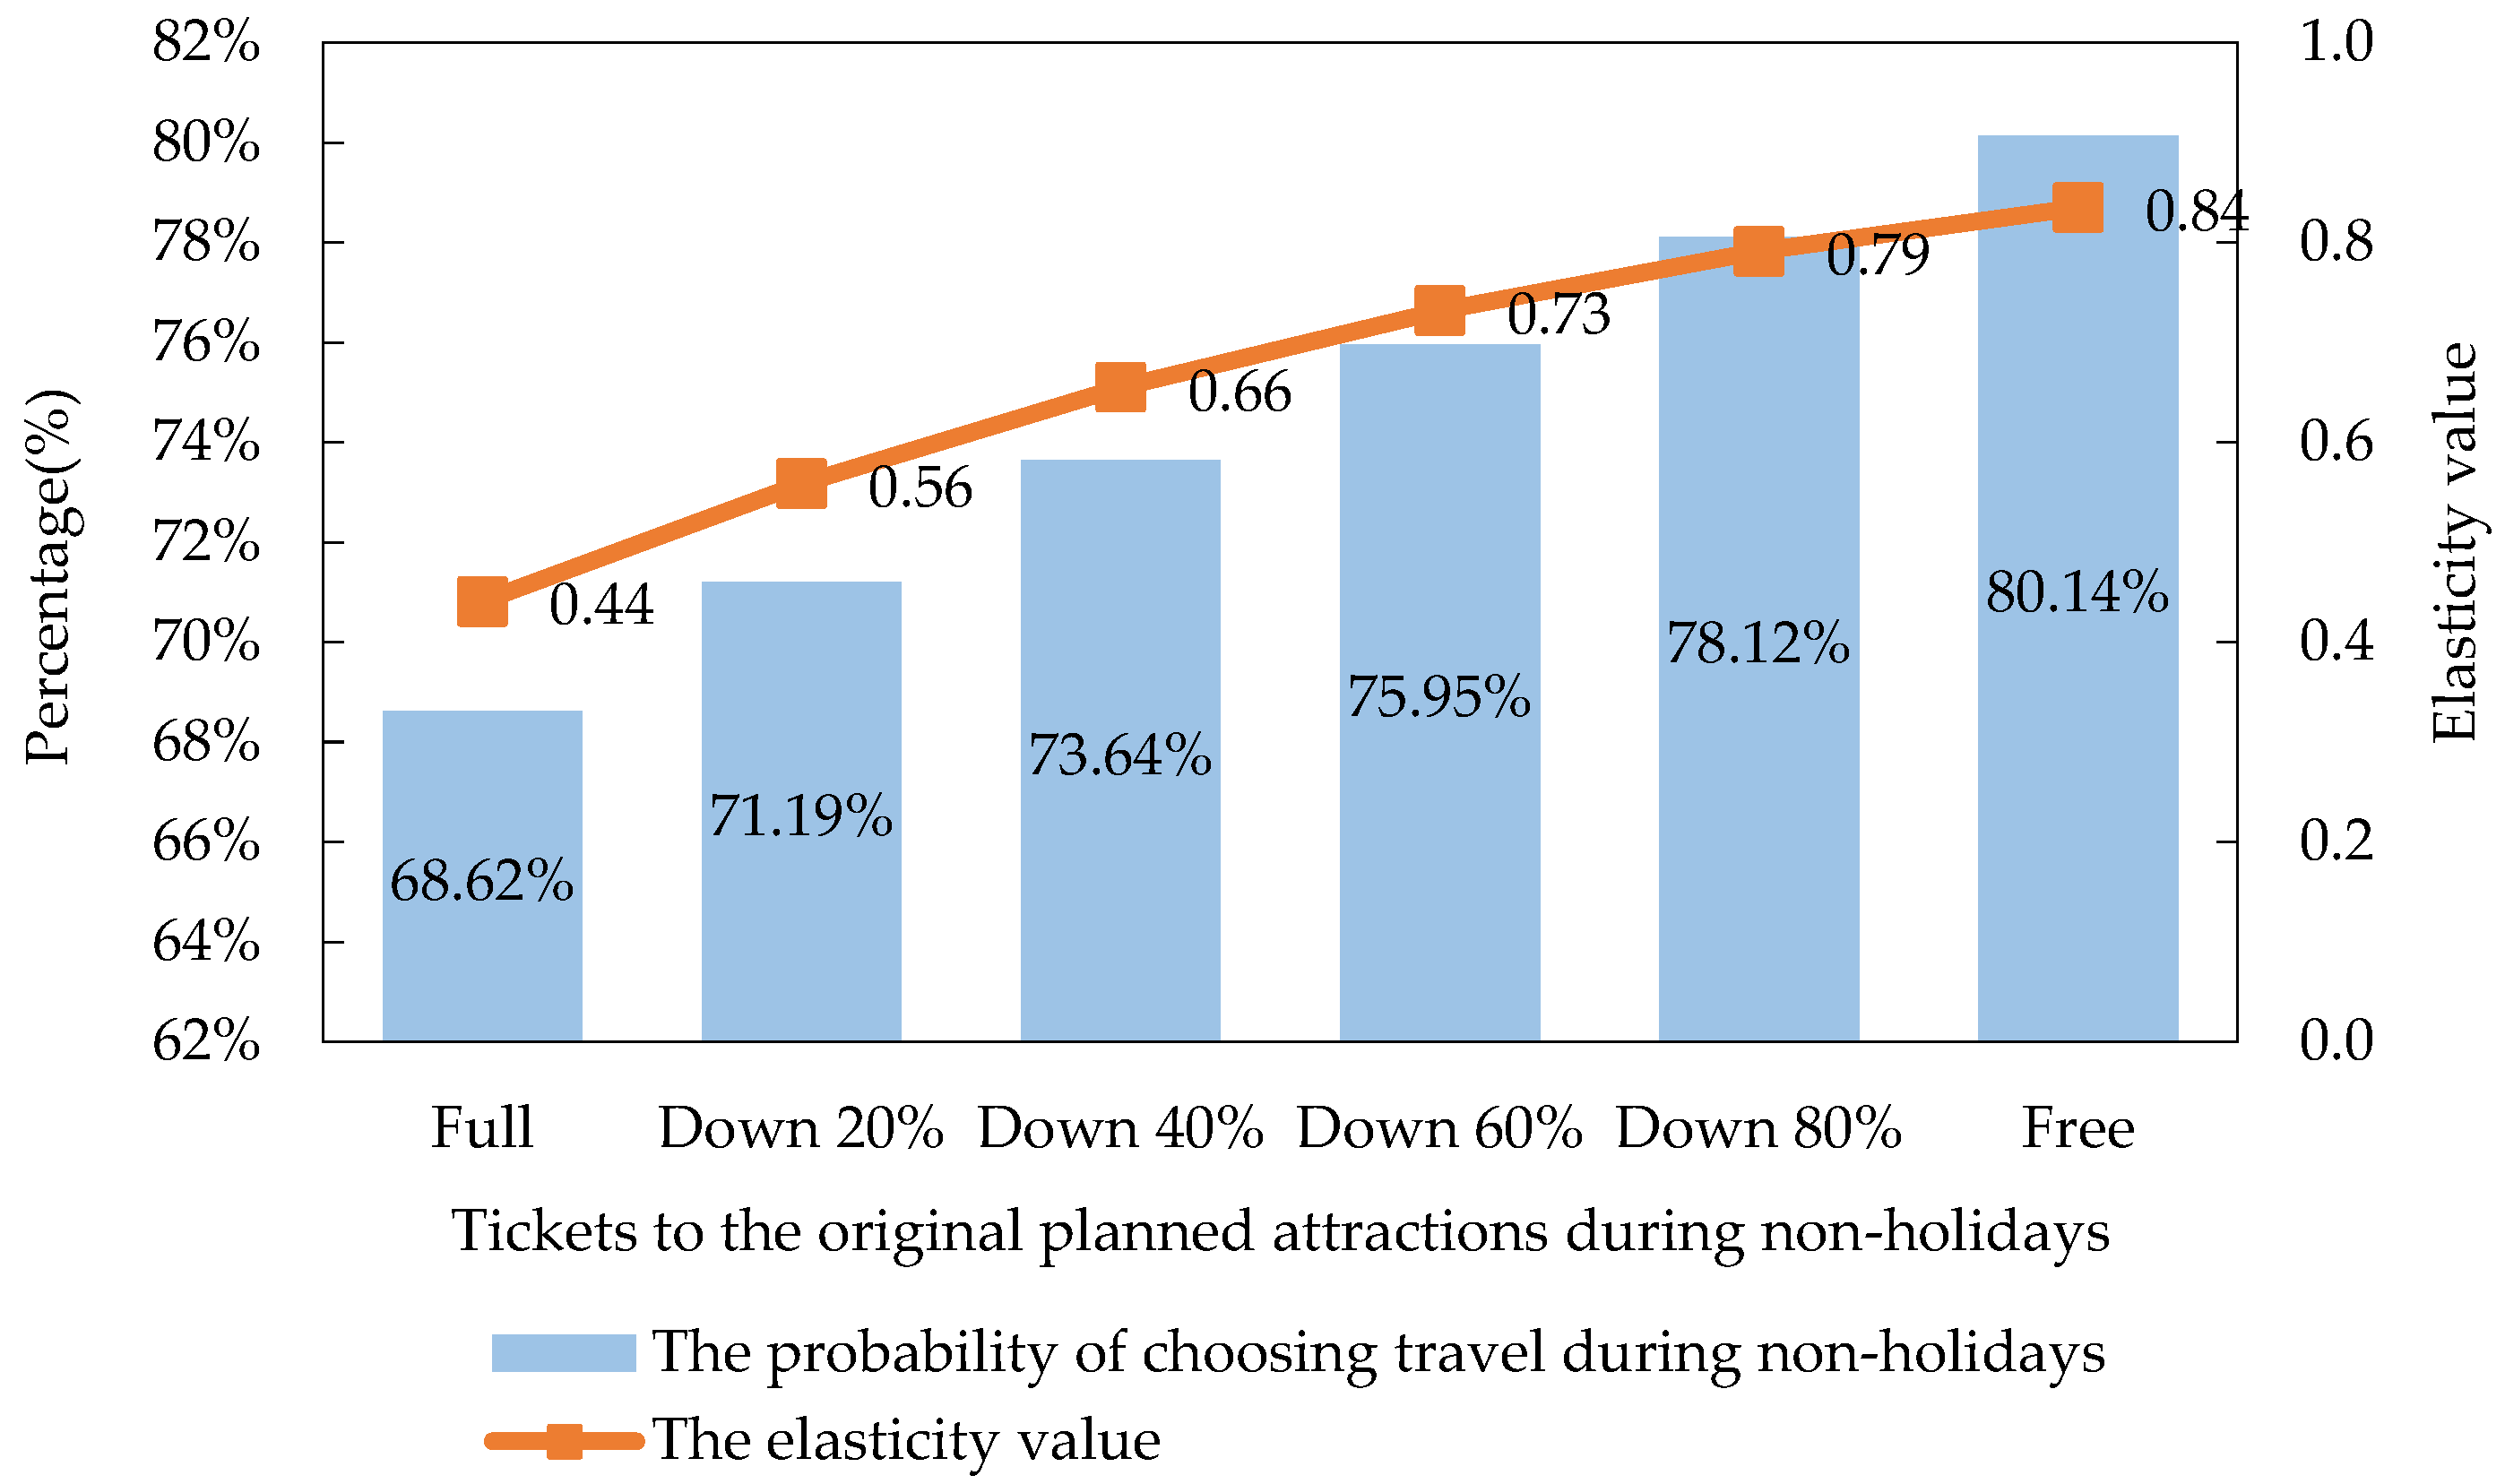
5.2. Sensitivity Analysis of Variables

To quantitatively analyze the influence of some variables on the probability of tourists’ peak travel avoidance decision-making behavior under the condition of external changes, the sensitivity of a given variable was analyzed, while other factors in the model remained unchanged. The corresponding elasticity coefficient is usually expressed by elasticity value (E), which measures the relative degree change in the dependent variable caused by the unit change in an explanatory variable [60]. The elastic analysis formulas of the NL model are shown in Equations (12) and (13); Equation (12) applies to the scheme outside the nest, and Equation (13) applies to the scheme inside the nest [57,61].
E X m n k P n ( m ) = X m n k P n ( m ) d P n ( m ) d X m n k = θ k X m n k [ 1 P n ( m ) ]
E X ( r / m ) n k P n ( m ) = X ( r / m ) n k P n ( m ) d P n ( m ) d X ( r / m ) n k = λ 2 β k X ( r / m ) n k [ 1 P n ( m ) ] P n ( r / m )
To analyze the effect of influencing factors further quantitatively on tourists’ travel decisions, the point elasticity values, and probabilities of tourists’ travel time and destination choices were calculated with Equations (12) and (13). With the changing number of visits, increased holiday admission ticket prices of original tourist attractions, and the discount for non-holiday attractions, the average value method was applied to obtain the corresponding elasticity coefficient E, while the other variables remained unchanged [57].
According to research on consumer behavior, experience has an important influence on tourists’ choice behavior. In order to understand the influence of tourists’ visiting experience on their spatial decision-making behavior to avoid peak travel during holidays, the relationship between the changes in the number of visits to tourist attractions and the probability of tourists choosing to continue to visit the original tourist attractions during holidays was analyzed, as shown in Figure 4.
The results show that the elasticity value is negative, indicating that the number of visits and the probability of continuing to visit the original tourist attractions change in opposite directions. It means that with the increase in the number of visits, the probability of tourists choosing to continue to visit the original tourist attractions decreases during holiday periods. When the number of visits is more than three, the absolute value of elasticity exceeds one, showing an extensive range of elasticity changes, while the probability of choosing to go to the original tourist attraction drops from 45.81% to 28.04%, a significant decrease of 17.77%. It can be concluded that the number of visits to tourist attractions has a significant impact on the next visit to the same tourist attraction. When the tourist attraction experiences crowded holiday peaks, it can consider implementing preferential admission for tourists who visit more frequently. The more the tourists visit the park, the more preferential treatment will be given during off-peak times (or non-holiday time), so as to attract more tourists to off-peak travel.
It is helpful for researchers through elastic analysis to understand how to improve the effect of travel information on tourists’ peak travel avoidance behavior, and the impact of changes in traffic congestion degree on tourists’ travel decision-making behavior, and analyze the changes in tourists’ destination and travel time decision-making behavior given changes in congestion duration. The elastic analysis results are shown in Figure 5a,b.
The results according of the model calibration, when the road congestion estimated coefficient X(r|m)13 is positive, meaning that the longer congestion time, the more tourists tend to change destinations. The elastic value analysis results in Figure 5a show that with the increase in road congestion duration around the original tourist attraction, the probability of choosing to visit a different tourist attraction keeps increasing, as does the elastic value. When the congestion duration is more than 1 h, the elastic value is greater than 1, and the tourists are elastic under the influence of road congestion duration. This shows that the change in congestion duration has a great influence on tourists’ destination decisions. When the congestion time increases from half an hour, the probability of changing tourist attractions increases by 6.23%, 11.13%, and 15.12%, respectively. It can be seen that the duration of road congestion around the original tourist attractions is an important factor influencing tourists’ choice of travel destination. Therefore, the detailed and accurate release of travel congestion information can help tourists make destination decisions before traveling.
According to the results of the model calibration, the estimated coefficient X(m)7 is positive, indicating that the change in road congestion duration around the etourist attraction positively affects the probability of tourists carrying out non-holiday travel; that is, the longer the congestion duration, the more inclined tourists are to choose non-holiday travel. According to the elasticity analysis of Figure 5b, as the congestion duration of roads around original tourist attractions keeps increasing, the probability of choosing non-holiday travel keeps increasing, indicating that road congestion will affect tourists’ choice of non-congested travel times. An elasticity value between 0 and 1, however, shows that the congestion time weakly influences tourists’ decision to travel during the holiday season, perhaps because many tourists travel under strict time constraints, and their available travel time may only be during holidays. Thus, they may still choose to travel during peak times knowing they could face road congestion due to time limits or psychological factors. Especially for the tourist attractions that they have not been to, the desire and enthusiasm for tourism often give tourists a better expectation of road congestion. Therefore, the duration of road congestion around the tourist attraction is not the main factor affecting the decision of travel time.
In general (as shown in Figure 6), with the increase in the congestion duration around the original tourist attractions, the probability of tourists choosing to change the tourist attractions and carry out non-holiday travel is increasing, while the probability of choosing to go to the original tourist attractions gradually decreases. When the congestion duration is 0, the probability of tourists going to the original tourist attraction is greater than the probability of changing the tourist attraction. When the congestion duration is more than 0.5 h, the probability of changing the tourist attraction increases significantly. The probability of choosing non-holiday travel increases significantly with congestion duration of more than 1 h, and the probability of choosing to change the tourist attraction is higher than the probability of choosing non-holiday travel. Judging from the trend of the selection probability chart, knowing that the roads around the tourist attraction are congested, tourists are more inclined to change their destination, followed by changing their travel time.
Figure 7a,b analyzes the changes in tourist destination and travel time decision behavior given the changes in ticket prices to the original planned tourist attractions. According to the results of the model calibration, the original estimated coefficient of holiday admission ticket prices X(r|m)12 is positive, indicating that when attractions increase holiday admission ticket prices, tourists are more inclined to visit a different tourist attraction. The analysis results of the elasticity value in Figure 7a show that with the rising holiday admission ticket prices of the original tourist attractions, the probability of choosing to replace the tourist attractions is constantly increasing, and the elasticity value is constantly increasing. When the proportion of the ticket price increase is less than 40%, the probability of tourists changing destinations is less affected, and within this scope, tourists are not sensitive to the increase in the ticket price. When the price increase is more than 40%, the elastic value E is greater than 1. In this case, the change in tourists affected by the ticket price increase is flexible, indicating that the holiday admission ticket price increase for the original tourist attractions has a significant impact on tourists’ travel destinations. From the full price to a 40% price increase, the probability of changing the tourist attractions increases from 48.77% to 69.11%, an increase of 20.34%. It can be seen that the implementation of ticket price increase strategies for crowded tourist attractions during holidays has a strong impact on tourists altering their travel destinations, and the spatial behavior of tourists at different peaks is more sensitive.
According to the results of the model calibration, the estimated coefficient X(m)8 is negative, indicating that the ticket price of the original tourist attractions increases during holidays, and tourists are not inclined to travel on holidays. From the analysis results of Figure 7b, it can be concluded that with the increasing price of holiday admission tickets in the original tourist attractions, the probability of choosing holiday travel is constantly decreasing. The elasticity value E is negative. When the price increase is 80%, the absolute value of the elasticity value E is greater than 1. In this case, the change in tourists affected by the ticket price increase is flexible, indicating that the holiday admission ticket price increase for the original tourist attractions has a significant impact on tourists’ travel time. This shows that when making a decision on travel time, the ticket price increase for tourist attractions has a weaker impact on tourists, and tourists are more sensitive when the price increase is large. Therefore, the high ticket price increase strategy can enhance the willingness of tourists to change their travel time.
As can be seen from Figure 8, with the increase in the price of holiday admission tickets of the original tourist attractions, the probability of tourists changing destinations gradually increases, while the probability of going to the original tourist attractions gradually decreases. When the price increase is greater than 40%, the probability of changing tourist attractions and going to the original tourist attractions changes notably, and the final probability curve tends to be flat. However, the probability of choosing non-holiday travel shows a steady and slow growth on the whole, and the range of change is not too large. It can be seen that under the strategy of holiday admission ticket price increase, tourists are more inclined to change their travel destination and thus achieve staggered peaks.
Figure 9 illustrates the impact of non-holiday (flat peak) ticket price discounts on tourists’ holiday travel decisions, and the probability that such discounts would attract tourists to travel during off-peak times and the corresponding elastic value.
The model calibration results show that the parameter X(m)9 of non-holiday admission ticket prices is positive, indicating that the lower the ticket price that tourists are willing to pay during non-holiday times, the greater the ticket discount for tourist attractions, and the more tourists prefer to choose non-holiday travel. According to the analysis of the elastic value of Figure 5 and Figure 6, for every 20% decrease in the ticket discount, the probability of tourists choosing non-holiday travel increases by 2.57%, 5.02%, 7.33%, 9.5%, and 12.52% compared to the full price. The ticket price ranges from full price to free, the elastic value is between 0 and 1, and the elasticity change is small. The probability of tourists choosing holiday travel changes slightly with the tourist attraction ticket discount; that is, tourists are not sensitive to the peak ticket discount. It can be seen that the effect of encouraging tourists to adjust their travel time through the strategy of non-holiday admission ticket discounts is not obvious, which may be due to the limitation of available travel time or the mutual constraints between travel partners; thus, the effect of a flat peak ticket discount may be more obvious for tourists with relatively free time.
The same tourist attraction ticket strategy has different effects on tourists. The implementation of holiday admission ticket price increase strategies for crowded tourist attractions can better attract tourists to visit other tourist attractions; moreover, discounted tickets do not appear to play an obvious role in travel time adjustments. In addition to the limitations of some practical conditions, these results also reflect people’s greater psychological sensitivity to losses (such as ticket price increases).

6. Conclusions

The focus of this study was on the problem of traffic congestion at tourist attractions and surrounding roads during holidays. Taking holiday car travelers as the research object, based on utility maximization theory and RP/SP survey data, a joint decision-making NL model of tourists’ travel time and destination decisions was established to explore strategies encouraging peak travel avoidance behaviors. The research conclusions are as follows:
(1)
According to the calibration results of the NL model, occupation, age, family resident population, the size of the tourist group and the relationship with the group, tour duration time, number of visits, tourism motivation, travel range, tourist attraction type, tourist attraction grade, crowding degree, traffic congestion around tourist attractions, holiday admission ticket prices, and non-holiday admission ticket prices significantly impact tourists’ travel time and destination decisions.
① The larger the tourist group, the higher the grade of tourist attractions visited, and the tourists who are motivated by leisure and sightseeing are more inclined to go to the original planned tourist attractions.
② The more tourists have previously visited certain spots, the more crowded the tourist attractions, and the longer the tour duration time, the more inclined tourists are to change the tourist attractions they visit. When the number of previous visits to a spot is more than three, the probability of choosing to change the tourist attraction increases by 17.77%.
③ The smaller the family resident population, the shorter the travel range, and the longer the tour duration time (the more days), the more tourists tend to travel during non-holidays.
④ The greater the road congestion around the original tourist attraction, the greater the price increase for holiday admission tickets, and the greater the discount for non-holiday admission tickets, tourists are more inclined to change tourist attractions and engage in non-holiday travel.
(2)
The results of the elasticity analysis show that travel time and destination decision behavior are elastic to the number of visits, the degree of road congestion around the original tourist attraction, and holiday admission ticket prices.
① When the congestion time increased from half an hour to two hours, the probability of choosing to change tourist attractions increased by 15.12%, and the probability of choosing non-holiday travel increased by 4.02%.
② When holiday admission ticket prices increase by more than 40%, the probability of changing attractions increases significantly. When the rate of ticket price increases from 40% to 100%, the probability of tourists choosing to change tourist attractions increases by 3.93%, 3.35%, and 2.91%, respectively, for every unit increase in ticket price. Tourists are sensitive to the rate of ticket price increase. When the holiday admission ticket price increases by 80%, the decision behavior of choosing non-holiday travel is significantly affected by the increase ratio. The results show that adjusting the pricing strategies of tourist attractions can prompt tourists to change their destinations and thus reduce crowding.
③ The change in non-holiday admission ticket discount has little influence on the probability of tourists’ travel time decision. The same tourist attraction ticket strategy has different effects on tourists. The implementation of a holiday admission ticket price increase strategy for crowded tourist attractions can better attract tourists to visit other tourist attractions, and discounted tickets do not appear to play an obvious role in travel time adjustment. In addition to the constraints of disposable tourism time, these results reflect people’s greater psychological sensitivity to losses, such as ticket price increases.
Based on the results, the established joint decision model can predict the decision-making choice behaviors well for tourists with distinctive characteristics under different admission ticket prices. Understanding the behavior change characteristics of tourists given changes in external environmental factors is beneficial for tourist attractions to regulate tourist flow during holidays, and this work offers a reference for guiding tourists’ off-peak travel during holidays.
This paper only examines the peak travel avoidance behavior of car travelers. In the future, the characteristics and rules of peak-shifting behavior among travelers of various modes of transportation (such as high-speed railway, ordinary railway, air transport, etc.) during holidays can be explored. It is also possible to discuss the influence of changes in the external environment such as weather and temperature on this behavior. In addition, the NL model is based on the assumption that travelers are completely rational and choose maximal utility for themselves, but due to the ambiguity of information and limited computing ability for travelers, travelers’ rational decision-making behavior in some cases is still limited. Thus, the next step is to consider the use of bounded rationality to explore the limited rationality of travelers’ peak travel avoidance behavior characteristics and decision making.

Author Contributions

H.Z. and Y.H. conceived and designed the research; Y.H. and W.L. devised the questionnaire; H.Z. developed the model and wrote the paper; H.G. guided the research process and revised the manuscript; H.Z. and W.L. performed the analysis of the sample and helped edit the manuscript. All authors have read and agreed to the published version of the manuscript.

Funding

This research was funded by the National Natural Science Foundation of China (No. 71971005), the Beijing Municipal Natural Science Foundation (No. 8202003).

Institutional Review Board Statement

Not applicable.

Informed Consent Statement

This article does not cover moral or ethical aspects. Informed consent was obtained from all the subjects involved in the study.

Data Availability Statement

The data that support the findings of this paper are available on request from the first and corresponding authors.

Acknowledgments

The authors are grateful to all the participants who filled in the questionnaire. We would like to thank the anonymous reviewers for their helpful comments and suggestions, which improved the quality greatly of this paper.

Conflicts of Interest

The authors declare no conflict of interest.

References

  1. Han, Y.; Zhang, T.; Wang, M. Holiday travel behavior analysis and empirical study with Integrated Travel Reservation Information usage. Transp. Res. Part A Policy Pract. 2020, 134, 130–151. [Google Scholar] [CrossRef]
  2. Lin, X.; Susilo, Y.; Shao, C.; Liu, C. The Implication of Road Toll Discount for Mode Choice: Intercity Travel during the Chinese Spring Festival Holiday. Sustainability 2018, 10, 2700. [Google Scholar] [CrossRef]
  3. Bao, Y.; Xiao, F.; Gao, Z.; Gao, Z. Investigation of the traffic congestion during public holiday and the impact of the toll-exemption policy. Transp. Res. Part B Methodol. 2017, 104, 58–81. [Google Scholar] [CrossRef]
  4. Jin, Q.; Hu, H.; Kavan, P. Factors Influencing Perceived Crowding of Tourists and Sustainable Tourism Destination Management. Sustainability 2016, 8, 976. [Google Scholar] [CrossRef]
  5. Yang, G.; Han, Y.; Gong, H.; Zhang, T. Spatial-Temporal Response Patterns of Tourist Flow under Real-Time Tourist Flow Diversion Scheme. Sustainability 2020, 12, 3478. [Google Scholar] [CrossRef]
  6. Wu, J.; Zhou, X.; Peng, Y.; Zhao, X. Recurrence analysis of urban traffic congestion index on multi-scale. Phys. A Stat. Mech. Its Appl. 2022, 585, 126439. [Google Scholar] [CrossRef]
  7. Hammami, F. The impact of optimizing delivery areas on urban traffic congestion. Res. Transp. Bus. Manag. 2020, 37, 100569. [Google Scholar] [CrossRef]
  8. Rahman, M.M.; Najaf, P.; Fields, M.G.; Thill, J.C. Traffic congestion and its urban scale factors: Empirical evidence from American urban areas. Int. J. Sustain. Transp. 2022, 16, 406–421. [Google Scholar] [CrossRef]
  9. Brög, W.; Erl, E.; Ker, I.; Ryle, J.; Wall, R. Evaluation of voluntary travel behaviour change: Experiences from three continents. Transp. Policy 2009, 16, 281–292. [Google Scholar] [CrossRef]
  10. Eriksson, L.; Nordlund, A.M.; Garvill, J. Expected car use reduction in response to structural travel demand management measures. Transp. Res. Part F Traffic Psychol. Behav. 2010, 13, 329–342. [Google Scholar] [CrossRef]
  11. Habibian, M.; Kermanshah, M. Coping with congestion: Understanding the role of simultaneous transportation demand management policies on commuters. Transp. Policy 2013, 30, 229–237. [Google Scholar] [CrossRef]
  12. Salomon, I.; Mokhtarian, P.L. Coping with Congestion: Understanding the Gap between Policy Assumptions and Behavior. Transp. Res. Part D Trans. Environ. 1997, 2, 107–123. [Google Scholar] [CrossRef]
  13. Choo, S.; Mokhtarian, P.L. Individual responses to congestion policies: Modeling the consideration of factor-based travel-related strategy bundles. KSCE J. Civ. Eng. 2012, 16, 822–834. [Google Scholar] [CrossRef]
  14. Zhu, H.; Guan, H.; Han, Y.; Li, W. A study of tourists’ holiday rush-hour avoidance travel behavior considering psychographic segmentation. Sustainability 2019, 11, 3755. [Google Scholar] [CrossRef]
  15. Zhu, H.; Guan, H.; Han, Y.; Li, W. Can Road Toll Convince Car Travelers to Adjust Their Departure Times? Accounting for the Effect of Choice Behavior under Long and Short Holidays. Sustainability 2020, 12, 10470. [Google Scholar] [CrossRef]
  16. Lim, X.; Shao, C.; Dong, C. The behavior characteristics of inter-city travel under the implication of expressway toll-free policy during holiday. J. Transp. Sys. Eng. Inf. Technol. 2019, 19, 247–254. [Google Scholar]
  17. Chung, J.Y.; Kyle, G.T.; Petrick, J.F.; Absher, J.D. Fairness of prices, user fee policy and willingness to pay among visitors to a national forest. Tour. Manag. 2011, 32, 1038–1046. [Google Scholar] [CrossRef]
  18. Han, Y.; Yang, G.; Zhang, T. Spatial-temporal response patterns of tourist flow under entrance tourist flow control scheme. Tour. Manag. 2021, 83, 104246. [Google Scholar] [CrossRef]
  19. Wang, B.; Shao, C.; Li, J.; Weng, J.; Ji, X. Holiday travel behavior analysis and empirical study under integrated multimodal travel information service. Transp. Policy 2015, 39, 21–36. [Google Scholar] [CrossRef]
  20. Kaplan, S.; Manca, F.; Nielsen, T.A.S.; Prato, C.G. Intentions to use bike-sharing for holiday cycling: An application of the Theory of Planned Behavior. Tour. Manag. 2015, 47, 34–46. [Google Scholar] [CrossRef]
  21. Yang, L.; Shen, Q.; Li, Z. Comparing travel mode and trip chain choices between holidays and weekdays. Transp. Res. Part A Policy Pract. 2016, 91, 273–285. [Google Scholar] [CrossRef]
  22. Lia, J.; Wenga, J.; Shaoa, C.; Guo, H. Cluster-Based Logistic Regression Model for Holiday Travel Mode Choice. Proc. Eng. 2016, 137, 729–737. [Google Scholar] [CrossRef]
  23. Cools, M.A.W. Assessing the Impact of Public Holidays on Travel Time Expenditure: Differentiation by Trip Motive. Transp. Res. Rec. J. Transp. Res. Board 2010, 2157, 29–37. [Google Scholar] [CrossRef]
  24. Huybers, T. Domestic tourism destination choices—A choice modelling analysis. Int. J. Tour. Res. 2003, 5, 445–459. [Google Scholar] [CrossRef]
  25. Wen, C.; Yeh, Y. Modeling air travelers’ choice of flight departure and return dates on long holiday weekends. J. Air Transp. Manag. 2017, 65, 220–225. [Google Scholar] [CrossRef]
  26. Wang, B.; Shao, C.; Li, J.; Zhao, D.; Meng, M. Investigating the interaction between the parking choice and holiday travel behavior. Adv. Mech. Eng. 2015, 7, 1687814015589499. [Google Scholar] [CrossRef]
  27. Yang, L.; Zheng, G.; Zhu, X. Cross-nested logit model for the joint choice of residential location, travel mode, and departure time. Habitat Int. 2013, 38, 157–166. [Google Scholar] [CrossRef]
  28. Dargay, J.M.; Clark, S. The determinants of long distance travel in Great Britain. Transp. Res. Part A Policy Pract. 2012, 46, 576–587. [Google Scholar] [CrossRef]
  29. Wang, B.; Shao, C.; Ji, X. Dynamic analysis of holiday travel behaviour with integrated multimodal travel information usage: A life-oriented approach. Transp. Res. Part A Policy Pract. 2017, 104, 255–280. [Google Scholar] [CrossRef]
  30. Ben-Akiva, M.; Lerman, S.R. Discrete Choice Analysis: Theory and Application to Travel Demand; MIT Press: Cambridge, UK, 1985. [Google Scholar]
  31. Morley, C. Experimental destination choice analysis. Ann. Tour. Res. 1994, 21, 780–791. [Google Scholar] [CrossRef]
  32. Yang, X.; Chu, H. Study on Macro-Travel Impact Analysis of Staggered Shifts. J. Tongji Univ. 2006, 34, 899–903. [Google Scholar]
  33. Zhu, H.R.; Yang, X.G. Effect Mechanism of Stagger Shifts and Its Traffic Feasibility—A Case Study of Shanghai. J. Transp. Syst. Eng. Inf. Technol. 2005, 5, 77–81. [Google Scholar]
  34. Henderson, J.V. The economics of staggered work hours. J. Urban Econ. 1981, 9, 349–364. [Google Scholar] [CrossRef]
  35. Wilson, P.W. Residential location and scheduling of work hours. J. Urban Econ. 1992, 31, 325–336. [Google Scholar] [CrossRef]
  36. Arnott, R.; Palma, A.D.; Lindsey, R. A Structural Model of Peak-Period Congestion: A Traffic Bottleneck with Elastic Demand. Amer. Econ. Rev. 1993, 83, 161–179. [Google Scholar]
  37. Jansson, J.O.; Ljungberg, A. Staggered school hours to spread Peak demand for public transport–Benefits and costs. Int. J. Transp. Econ. 2009, 36, 141–160. [Google Scholar]
  38. Li, S. Determination of optimal work start time. Transport 2007, 22, 45–49. [Google Scholar] [CrossRef]
  39. Lin, C.X. Behavioral Economic Analysis of avoid peak Travel Policy. Integr. Transp. 2013, 5, 27–31. [Google Scholar]
  40. Chen, D.; Zhang, N.; Liu, L. Bottleneck Model for dual objective time-The principle of traffic staggered peak. J. Manag. Sci. 2015, 18, 52–60. [Google Scholar]
  41. Ben-Elia, E.; Ettema, D. Carrots versus sticks: Rewarding commuters for avoiding the rush-hour—A study of willingness to participate. Transp. Policy 2009, 16, 68–76. [Google Scholar] [CrossRef]
  42. Ben-Elia, E.; Ettema, D. Changing commuters’ behavior using rewards: A study of rush-hour avoidance. Transp. Res. Part F Traffic Psychol. Behav. 2011, 14, 354–368. [Google Scholar] [CrossRef]
  43. Ben-Elia, E.; Ettema, D. Rewarding rush-hour avoidance: A study of commuters’ travel behavior. Transp. Res. Part A Policy Pract. 2011, 45, 567–582. [Google Scholar] [CrossRef]
  44. Tillema, T.; Ben-Elia, E.; Ettema, D.; van Delden, J. Charging versus rewarding: A comparison of road-pricing and rewarding peak avoidance in the Netherlands. Transp. Policy 2013, 26, 4–14. [Google Scholar] [CrossRef]
  45. Zhang, Z.; Fujii, H.; Managi, S. How does commuting behavior change due to incentives? An empirical study of the Beijing Subway System. Transp. Res. Part F Traffic Psychol. Behav. 2014, 24, 17–26. [Google Scholar] [CrossRef]
  46. Thorhauge, M.; Cherchi, E.; Rich, J. How flexible is flexible? Accounting for the effect of rescheduling possibilities in choice of departure time for work trips. Transp. Res. Part A Policy Pract. 2016, 86, 177–193. [Google Scholar] [CrossRef]
  47. Wang, C.C. Feasibility of subway fare guiding peak travel avoidance based on tourist flow survey. Urban Rapid Rail Transit. 2014, 5, 52–54. [Google Scholar]
  48. Qin, H.M.; Gao, J.Q. Car Commuters’ Travel Behavior Based on Rewarding and Punishments Strategies. J. Transp. Sys. Eng. Inf. Technol. 2018, 18, 115–120. [Google Scholar]
  49. Lancaster, K.J. A New Approach to Consumer Theory. J. Political Econ. 1966, 74, 132–157. [Google Scholar] [CrossRef]
  50. Thurstone, L.L. A law of comparative judgement. Psychol. Rev. 1994, 101, 266. [Google Scholar] [CrossRef]
  51. Mcfadden, D. Conditional logit analysis of qualitative choice behavior. In Frontiers in Econometrics; Academic Press: Cambridge, MA, USA, 1974. [Google Scholar]
  52. McFadden, D. Econometric models of probabilistic choice. In Structural Analysis of Discrete Data with Econometric Applications; MIT Press: Cambridge, MA, USA, 1981. [Google Scholar]
  53. Pan, L.; Zhang, M.; Gursoy, D.; Lu, L. Development and validation of a destination personality scale for mainland Chinese travelers. Tour. Manag. 2017, 59, 338–348. [Google Scholar] [CrossRef]
  54. Williams, H.C.W.L. On the formation of travel demand models and economic evaluation measures of user benefit. Environ. Plan. A 1977, 9, 285–344. [Google Scholar] [CrossRef]
  55. Train, K.E. Discrete Choice Methods with Simulation; Cambridge University Press: Cambridge, UK, 2009. [Google Scholar]
  56. Louviere, J.J.; Hensher, D.A.; Swait, J.D. Swait Stated Choice Methods: Analysis and Applications; Cambridge University Press: Cambridge, UK, 2000; pp. 34–82. [Google Scholar]
  57. Guan, H. The theoretical foundation of disaggregate model. In Disaggregate Model-A Tool for Traffic Behavior Analysis; China Communication Press: Beijing, China, 2004. [Google Scholar]
  58. Hess, S.; Daly, A.; Rohr, C.; Hyman, G. On the development of time period and mode choice models for use in large scale modelling forecasting systems. Transp. Res. Part A Policy Pract. 2007, 41, 802–826. [Google Scholar] [CrossRef]
  59. Asakura, Y.; Iryo, T. Analysis of tourist behaviour based on the tracking data collected using a mobile communication instrument. Transp. Res. Part A Policy Pract. 2007, 41, 684–690. [Google Scholar] [CrossRef]
  60. Jones, S.; Hensher, D.A. Modelling corporate failure: A multinomial nested logit analysis for unordered outcomes. Br. Account. Rev. 2007, 39, 89–107. [Google Scholar] [CrossRef]
  61. Koppelman, F.S.; Wen, C. The paired combinatorial logit model: Properties, estimation and application. Transp. Res. Part B Methodol. 2000, 34, 75–89. [Google Scholar] [CrossRef]
Figure 1. Selection tree structure of the NL model.
Sustainability 14 10744 g001
Figure 2. Intention of avoid peak travel under road congestion.
Sustainability 14 10744 g002
Figure 3. Intention of avoid peak travel under ticket changes.
Sustainability 14 10744 g003
Figure 4. The elastic analysis figure of the number of visits.
Sustainability 14 10744 g004
Figure 5. Probability and point elasticity of tour duration time. (a) Relationship with tourist destination. (b) Relationship with travel time.
Sustainability 14 10744 g005
Figure 6. Probability and point elasticity of tour duration time.
Sustainability 14 10744 g006
Figure 7. Probability and point elasticity of tour duration time. (a) Relationship with tourist destination. (b) Relationship with travel time.
Sustainability 14 10744 g007aSustainability 14 10744 g007b
Figure 8. Probability and point elasticity of tour duration time.
Sustainability 14 10744 g008
Figure 9. Probability and point elasticity of tour duration time.
Sustainability 14 10744 g009
Table 1. Explanatory variables and parameter settings of NL.
Variable CategoryVariableParameter Setting and Definition
Socioeconomic characteristicsOccupation1 = staff and worker;
0 = teacher, student, retired/unemployed, freelance
Age (year)1 = 18–44; 0 = 45–65
Family resident population1 = 1 and 2 people; 0 = 3 and more
Travel characteristicsTravel range1 = in the city and suburbs; 0 = cross-city
Last trip time1 = during holidays; 0 = before holidays
Tourism characteristicsTour duration timedivided into 1–7 days and above, value is 1–7, taking the actual value
Tourist groupdivided into 1–7 persons and above, value is 1–7, taking the actual value
Travel companion1 = family, friends/colleagues/classmates; 0 = alone and other
Tourism motivation1 = leisure, relaxation, and sightseeing attractions
0 = expand knowledge, enjoy delicious food and shopping, spend time with family
Tourist attraction characteristicsThe number of visitstaking the actual value, 1 = the first tour, 2 = 1–2, 3 = 3–4, 4 = 5 times and more
Tourist attraction tour time1 = within 4 h; 0 = 4 h or more
Original tourist attraction type1 = culture and nature; 0 = outdoor and entertainment
Original tourist attraction grade1 = 3A and above; 0 = 2A and below and no grades
Original attractions ticket price1 = RMB 100 or less; 0 = more than 100 yuan
Crowding degree of the original tourist attractiondivided into 1–5 grades, the crowding degree increases step by step, and the value is 1–5
External conditionsRoad congestion around the tourist attractionsdivided into 0.5 h and 1 h, with values of 1 and 2
Holiday attraction ticket price divided into 20% increase and 40% increase, with values of 1 and 2
Non-holiday attraction ticket price divided into 40% off and free, with values of 1 and 2
Table 2. The characteristic variables of the NL model and the data structure.
Upper Level (Travel Time Choice)
Alternative setsSelect resultsAgeFamily resident populationTour duration timeTravel rangeLast trip timeCrowding degree
Upper levelLower level Xm1Xm2Xm3Xm4Xm5Xm6
HolidayOriginal tourist attractionM11n100111
Change tourist attractionM21n
Non-holiday M2n011000
Unknown parameterλ2θ1θ2θ3θ4θ5θ6
Upper Level (Travel Time Choice)Lower Level (Destination Choice)
Road congestionHoliday attractions ticket priceNon-holiday attractions ticket priceOccupationTourist groupRelationshipTour duration timeThe number of visits
Xm7Xm8Xm9X(r|m)1X(r|m)2X(r|m)3X(r|m)4X(r|m)5
01011001
00110
101
θ7θ8θ9β1β2β3β4β5
Lower Level (Destination Choice)
Tourism motivationTourist attraction tour timeTourist attraction typeTourist attraction gradeAttractions ticket priceCrowding degreeRoad congestionHoliday attractions ticket price
X(r|m)6X(r|m)7X(r|m)8X(r|m)9X(r|m)10X(r|m)11X(r|m)12X(r|m)13
10011100
01100011
β6β7β8β9β10β11β12β13
Table 3. Calibration of the Nested Logit model.
LevelVariableEstimateStd. Err.t Test
Lower LevelInherent dummyASC2.090.5913.54 ***
OccupationX(r|m)10.4490.1592.83 ***
Tourist groupX(r|m)20.1060.04842.19 **
Relationship with tourist groupX(r|m)3−1.470.321−4.59 ***
Tour duration timeX(r|m)40.8950.1625.53 ***
The number of visitsX(r|m)5−1.640.224−7.35 ***
Tourism motivationX(r|m)60.7820.1884.17 ***
Tourist attraction tour timeX(r|m)70.3440.1622.13 **
Tourist attraction typeX(r|m)80.5990.2032.95 ***
Tourist attraction gradeX(r|m)90.3430.1771.94 **
Attractions ticket priceX(r|m)100.4220.1852.28 **
Crowding degree of spotX(r|m)11−0.470.0809−5.82 ***
Road congestionX(r|m)120.8280.1366.08 ***
Holiday attractions ticket priceX(r|m)130.5560.1354.11 ***
Model statistics: L(0): −813.755; L( θ ^ ): −652.612; −2(L(0) − L( θ ^ )): 322.286; ρ 2 : 0.213; ρ 2 : 0.202
LevelVariableEstimateStd. Err.t Test
Upper LevelInherent dummyASC2.850.5954.79 ***
AgeX(m)10.2460.1421.73 *
Family resident populationX(m)20.5710.1314.37 ***
Tour duration timeX(m)30.1390.06752.06 **
Travel rangeX(m)40.3540.1453.24 ***
Last trip timeX(m)50.530.1852.86 ***
Crowding degree of spotX(m)6−0.1310.0606−2.16 **
Road congestionX(m)70.2410.122.01 **
Holiday attractions ticket priceX(m)8−0.2670.122−2.2 **
Non-holiday attractions ticket priceX(m)90.4490.1223.68 ***
Inclusive coefficients λ 2 X(m)100.2730.0693.96 ***
Model statistics: L(0): −966.940; L( θ ^ ): −699.437; −2(L(0) − L( θ ^ )): 535.007; ρ 2 : 0.277; ρ 2 : 0.263
Note: ASC means alternative specific constant. *, ** and *** respectively indicate that the significance index is less than 0.1, 0.05 and 0.01.
Publisher’s Note: MDPI stays neutral with regard to jurisdictional claims in published maps and institutional affiliations.

