Article

The Environmental Risk Assessment of Fire and Explosion in Storage Tanks of Petroleum Products

1
Department of Natural Resources and Environment, Science and Research Branch, Islamic Azad University, Tehran 1477893855, Iran
2
Department of Health, Safety &Environment, Petroleum University of Technology, Abadan P.O. Box 63187-14317, Iran
3
Department of Environment, North Tehran Branch, Islamic Azad University, Tehran 1651153511, Iran
*
Author to whom correspondence should be addressed.
Sustainability 2022, 14(17), 10747; https://doi.org/10.3390/su141710747
Submission received: 16 July 2022 / Revised: 23 August 2022 / Accepted: 25 August 2022 / Published: 29 August 2022

Abstract

:
The present study provides a framework for assessing the environmental risk associated with fire and explosion of gasoline storage tanks in oil depots. The proposed framework includes three main steps: problem formulation, risk analysis, and risk description. The necessary basic details were identified and collected in formulating the problem. The source, pathway, receptor (SPR) model was employed in the risk analysis process. Each part was analyzed using tools that provide appropriate results and maintain the model integrity; additionally, the findings can be used in the whole process. The Dow Fire and Explosion Index (F&EI) was deployed to scrutinize the source, the pollutant dispersion and transmission path characteristics were measured to inspect the pathway, and the vulnerability indicators of the receptor and the degree of impact were determined to scrutinize the receptor. Finally, the risk assessment results were presented in the form of risk description tables. The purpose of this integration was to develop a framework thoroughly evaluating the risk associated with fire and explosion to the point of environmental consequences and providing a better understanding of the outcomes. This study, conducted for the first time specifically for an oil depot, provides an exhaustive view highly contributing to managers and decision makers.

1. Introduction

In oil depots and refineries, large quantities of petroleum products are temporarily stored for upcoming transmissions. These products are typically stored in floating-roof tanks and fixed-roof tanks [1]. The floating-roof storage tanks are cylinder-shaped tanks characterized by their movable roof covering the liquid surface, floating up or down with the level of liquid [2]. Floating-roof storage tanks mitigate the product losses caused by evaporation; however, the consequences of incidents related to this type of tank can be considerably catastrophic [3]. Floating-roof storage tanks are highly threatening [4,5,6,7]. Concomitant with the increasing global demand for energy, the storage of liquid fuel in oil terminals has also expanded, and this, in turn, may enhance the probability of fires, explosions, and release of toxic substances, of which fire is the most common incident [8].
Oil depot accidents may cause destructive damage to the environment [6,9]. Environmental consequences can, per se, turn out to be even more crucial than economic damages because the former may highly draw the attention of the media and that of the general public and subsequently disgrace the organization [10]. The ERA index is a preferential approach to evaluating environmental hazards because it is a simple method decision makers can easily use [11]. The ERA is the process of identifying and evaluating potential adverse impacts (i.e., exposure to chemical or non-chemical substances released from industrial activities) upon organisms, populations, or communities. The environment consists of multiple factors, e.g., water, air, plants, and animals; hence, experts’ views on these factors are required to achieve the final result [12]. The ecological risk assessment is utilized in risk management by decision makers who amalgamate risk assessment results with economic, political, and social considerations to improve people’s quality of life [13]. Noteworthily, industries are responsible for mitigating the environmental risks they cause [14].
The concept of risk was first put forth by Pascal (1657) along with the invention of probability theory [15]. Risk assessment has a crucial role in evaluating the consequences of potential accidents; moreover, it is a noticeable tool for developing preventive strategies and measures to reduce potential damages [16,17].
There are many quantitative and qualitative methods for risk assessment, e.g., HAZOP, MADM, MCDM, FTA, and FMEA. The qualitative methods help to identify risks and obtain an overview of risk. Quantitative methods contribute to estimating the consequences and examining the pertinent details; accordingly, they can be employed to provide a more accurate plan to reduce risk. Integrating the qualitative and quantitative methods can help manage risks more effectively [18].
Numerous studies have dealt with the root cause analysis and risk assessment of fires and explosions in oil industries. Xie et al. [19] used an amalgam of several methods to assess the risk of fires and explosions in oil depots. Bouafia et al. [3] analyzed the gasoline release of storage tanks using HAZID and bow-tie methods and modeled the affected areas with PHAST software. Guo et al. [20] assessed the risk of storage tank accidents using the fuzzy Bayesian network based on the similarity aggregation method. Combining a risk matrix and the bow-tie model, Luo et al. [21] and Lu et al. [10] assessed the safety of natural gas spherical tanks and gas pipelines, respectively. In investigating a large refinery, Zhao et al. [22] evaluated the fire or explosion risk in oil terminals using the Dow F&EI. Fu et al. [23] examined the risk of liquefied natural gas leakage from LNG-fueled vessels by defining appropriate and complementary steps. Wang and Song [24] also classified the study site safety using the Dow F&EI. Wu and Chen [25] presented a quantitative assessment of oil tank fires caused by lightning.
There are also studies dedicated to environmental risk assessment. For instance, Vora et al. [12] proposed an environmental risk assessment framework for produced water discharges, drilling discharges, and emissions from EOR solutions in the process of oil extraction. Zeleňáková and Zvijáková [26] identified 26 parameters following negotiating with experts, conducting field studies, and reviewing the literature to assess the environmental effects of flooding. Qinqin et al. [27] determined the environmental risk sources of fire and explosion in the petrochemical industry using bow-tie analysis and evaluated the environmental risk via an integrated ERA index. Topuz et al. [14] also employed three factors to examine the environmental risk and human health in industries using hazardous substances.
Shahriar et al. [28] analyzed the risk of gas and oil pipelines using the bow-tie method and assessed the consequences in three categories (social, environmental, and economic) following experts’ opinions. To assess the risk of an oil spill at the water surface, Bi and Si [29] identified the consequences in four categories: environmental, economic, health-threatening, and social using the AHP technique and experts’ opinions. Yari et al. [30] used the fuzzy hierarchical analysis method to identify environmental risks. MADM methods are efficient in risk assessment and management and help managers in making decisions. Yari et al. [31] used this method to manage blasting operations.
Various studies address the risk assessment of oil tank explosion or fire and identify the causes and safety dimensions of these accidents. There are also studies on the environmental consequences of risks in process industries. However, the present study proposed an integrated and step-by-step risk assessment framework for fire and gasoline explosions in oil depots and the environmental consequences of such accidents.
The conceptual model of this research is supported by basic and accepted methods, and its steps have been implemented using innovative methods in a way that has led to the integration and correct understanding of environmental risk assessment. The main basis of this study was created according to the three basic stages of EPA’s ecological risk assessment, including problem formulation, risk analysis, and risk description. The SPR method was used for risk analysis, which shows the risk process, including the beginning (occurrence of the accident) to the end (consequences). EPA risk analysis is more appropriate for a species and assesses the interaction of stressors with organisms and the response to stressors, which requires detailed data. The SPR method analyzes an accident in a comprehensive and integrated way. This study was done without the need to require detailed data (in some of steps) that is usually associated with challenges. Therefore, an innovative method is presented that can be useful for risk managers of high-risk industries.

2. Materials and Methods

Following the primary ecological risk assessment framework provided by the US Environmental Protection Agency [32] and various studies [12,17,27,33,34], the present study proposed a comprehensible, easy-to-use, practical, and holistic environmental risk assessment. The chief phases of the proposed ERA framework are presented in Figure 1.

2.1. Problem Formulation

Problem formulation is the first step in ERA. The data associated with the site investigation, the ecological condition of the region, the accident of crucial concern, the conceptual model of risk assessment, and the assessment endpoint are evaluated in this phase.

2.1.1. Problem Statement

The consequences of accidents can cause damage to plants, human health, the environment, and ecology [27]. Considering the storage of gasoline as a flammable chemical in floating-roof oil tanks and reviewing the related incidents and research on oil depots, fire and explosion were chosen as the most critical risk and their environmental risk was set as the study objective. Floating-roof oil tanks are the most vulnerable equipment in oil depots [6]. Fire and explosion were assessed using the Dow method.

2.1.2. Case Study

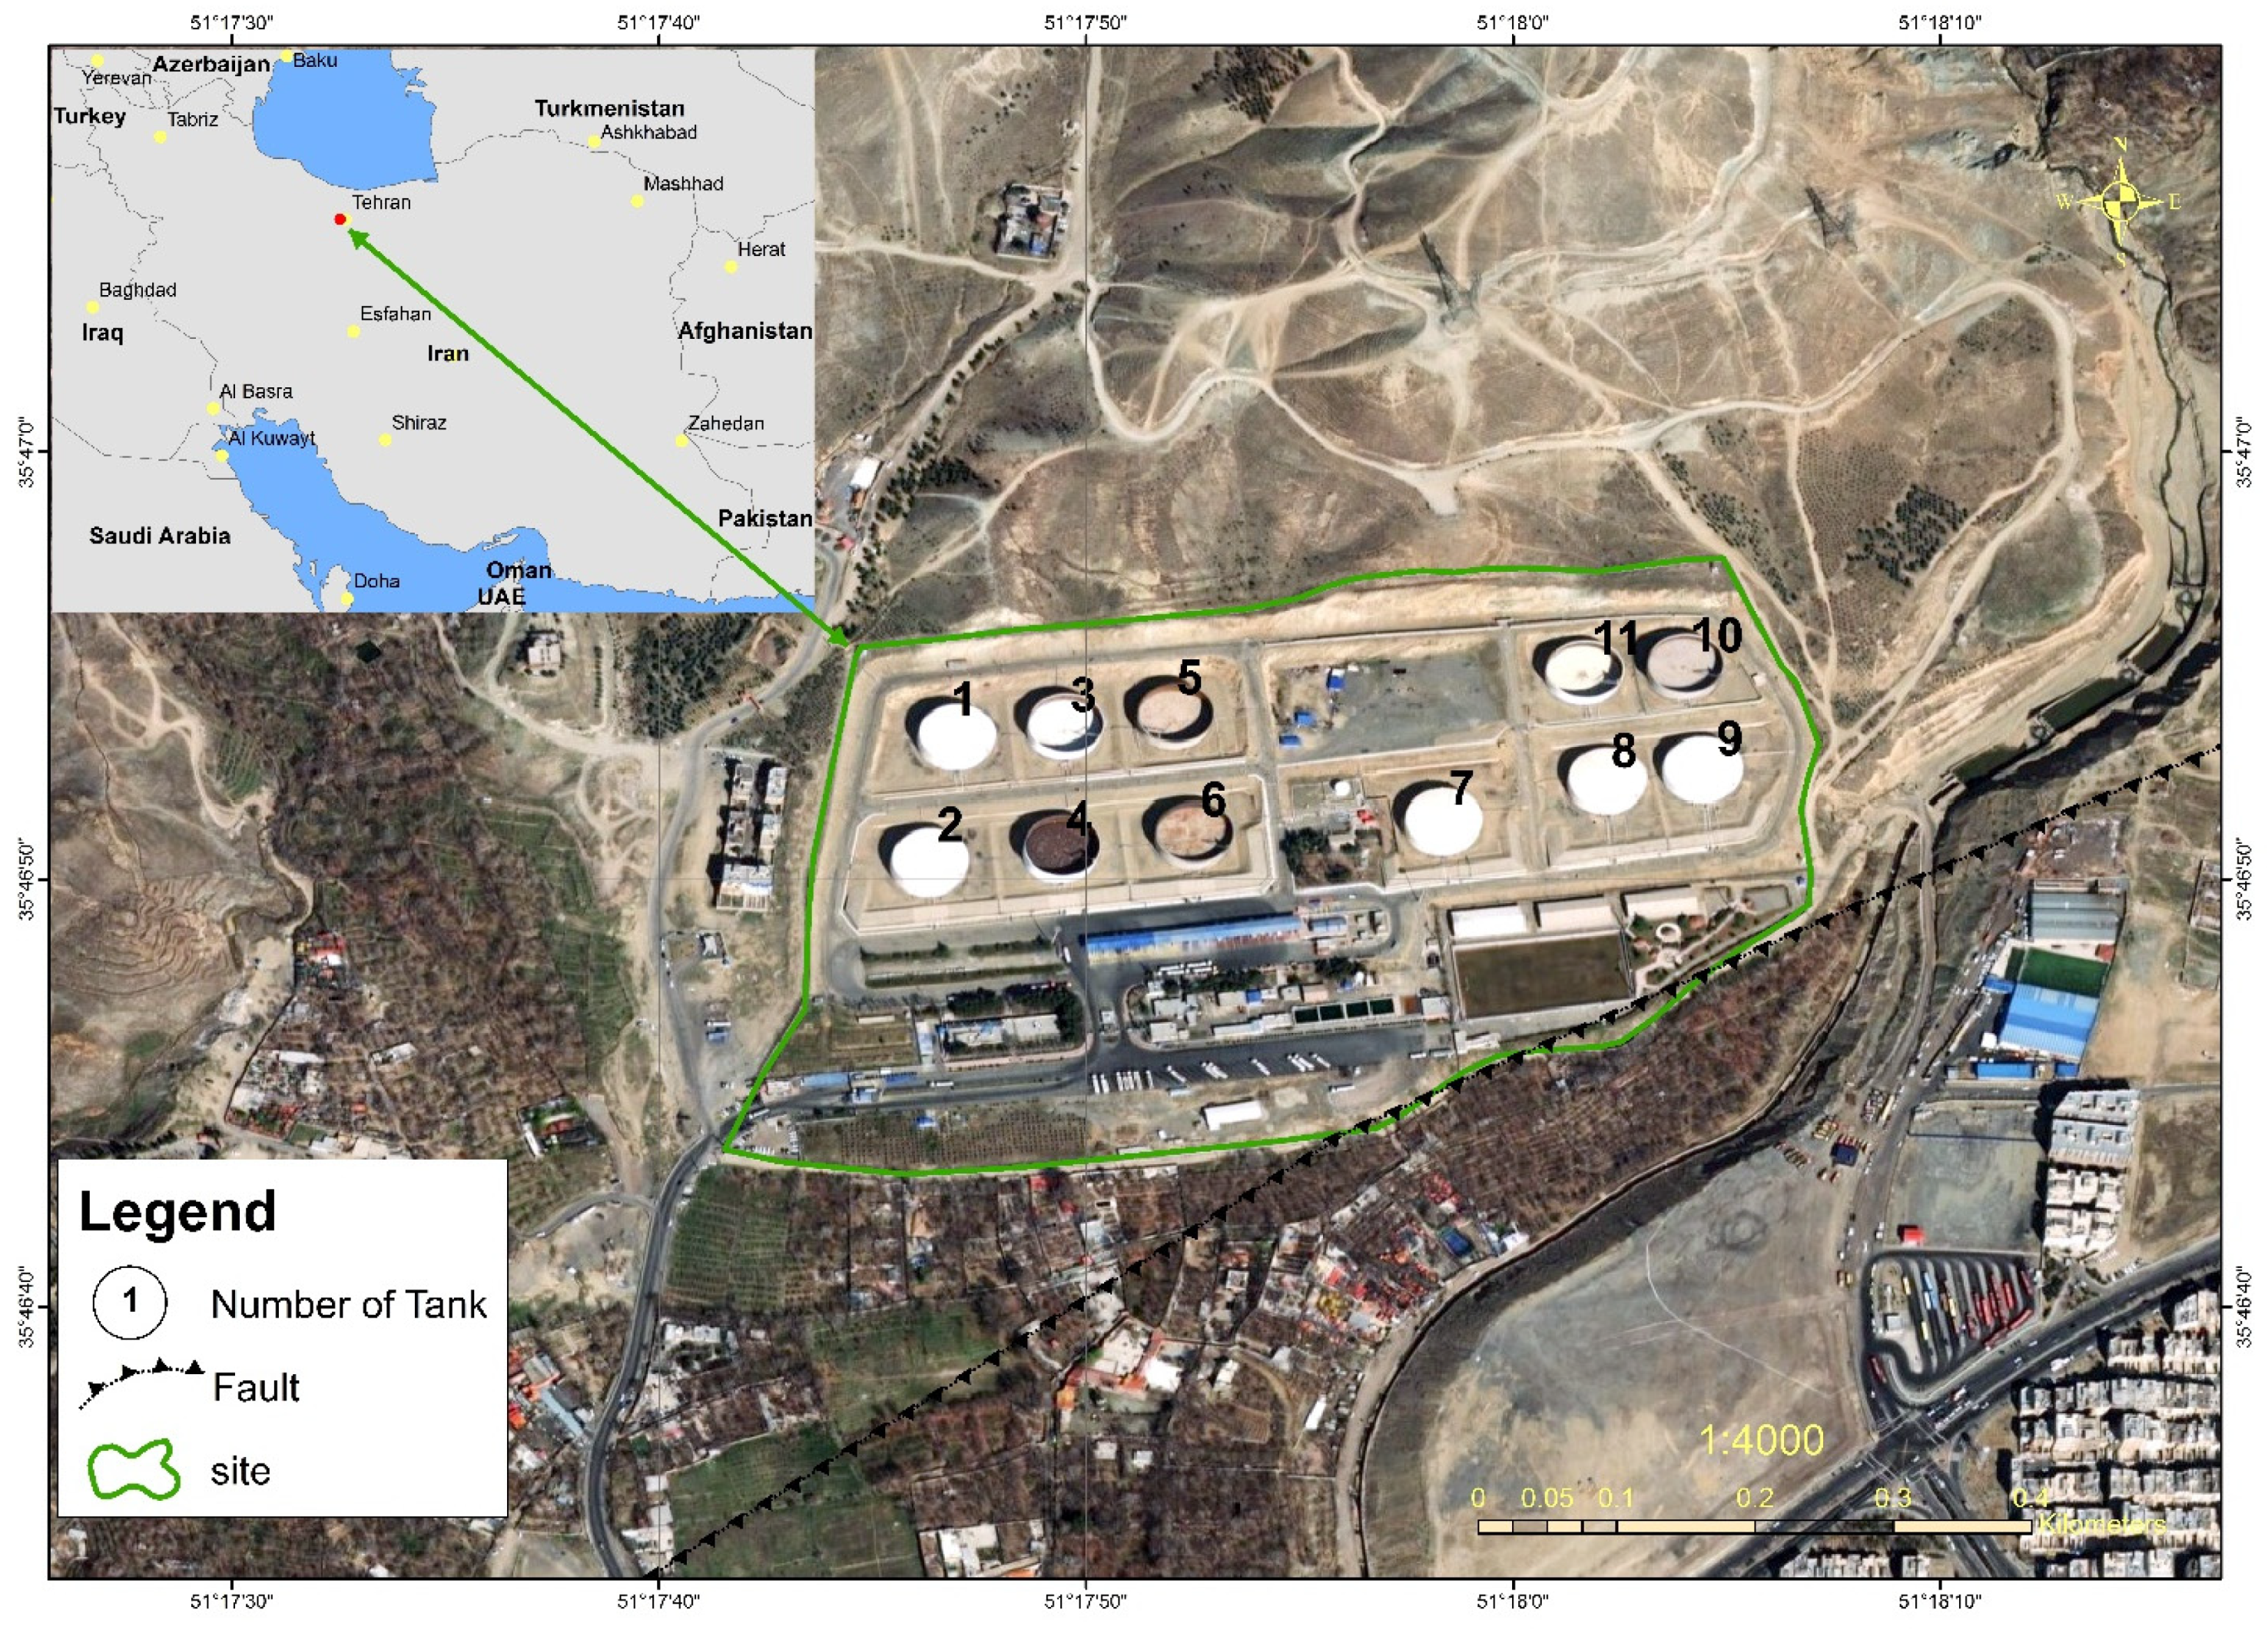
In this research, an oil depot was considered in a case study due to its important role in providing fuel for the Tehran metropolis. This oil depot is located in the vicinity of residential areas in the northwestern part of a city. Figure 2 exhibits a satellite image of the study site.

2.1.3. The Ecological Status of the Study Site

Table 1 summarizes the ecological status of the study site.

2.2. Risk Analysis

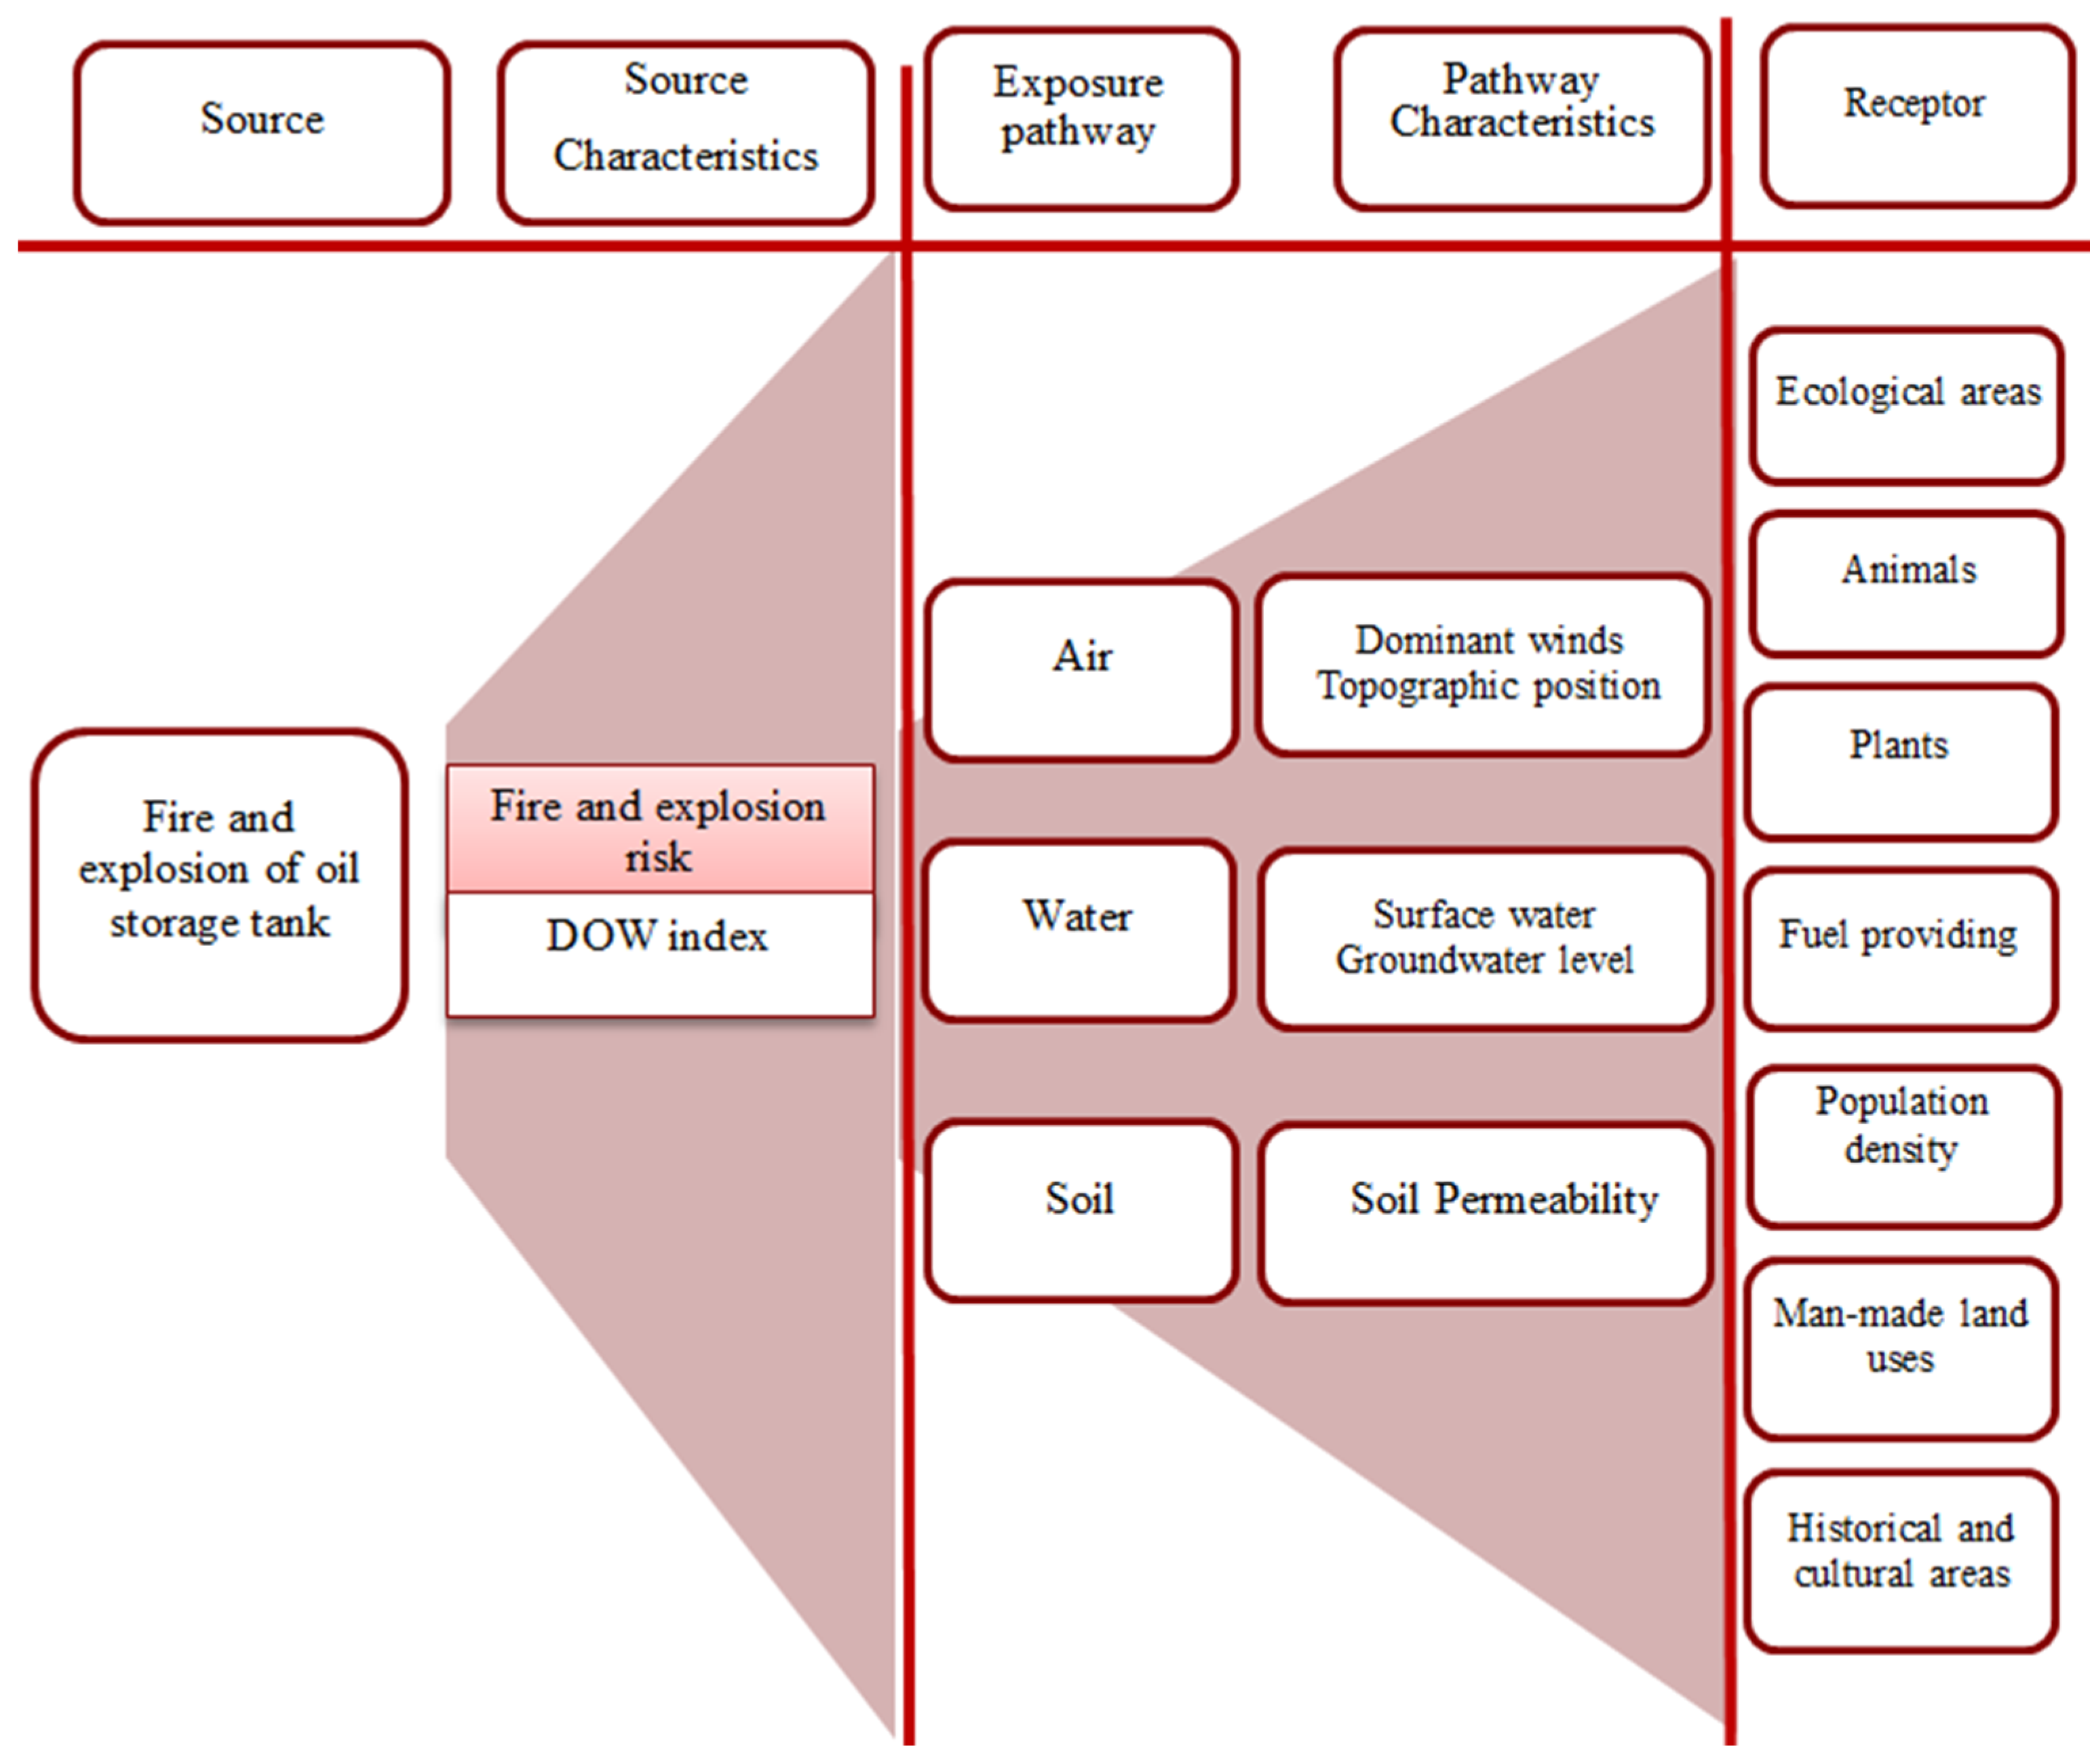
In this step, the risk analysis was performed following the approach shown in Figure 3. It was intended to investigate the whole process from the starting point to the endpoint; hence, the risk assessment process includes inspecting the release source, the exposure pathway, and the effect receptor (SPR).

2.2.1. Source

Here, the source refers to a critical accident that causes damage to the environment. In this study, the source refers to fire or explosion of a gasoline tank in the oil depot located in the northwestern region of a city.
The hazards associated with the risk source correlate with the characteristics of the substance and the site. The hazardous properties of substances are usually defined as potential dangers [14]. Furthermore, the process, equipment, and current site status may affect the occurrence of an accident.
The Dow F&EI was employed to examine the characteristics mentioned above. This index is widely used in the petrochemical industry. The index also covers aspects related to the inherent hazards of substances, operating conditions, quantities used, and influential hazard factors of petrochemical units. The factors influencing the process—classified as material factors, special process hazard factors, and general process hazard factors—were considered in the index calculation. To calculate the F&EI, a special value called the penalty or penalty factor was assigned to each risk factor based on its degree of risk. An increased penalty factor indicates a rise in the severity or likelihood of fire and explosion risk. If a factor fails to cause any damage or hazard, the penalty factor is assumed to be zero [35].
The stressors of fire and explosion of gasoline storage tanks may result from (1) ignition and thermal radiation, (2) toxic cloud dispersion, (3) liquid flow, and (4) increased level of noise and vibration [3].

2.2.2. Pathway

The pollutant-transmitting pathways include water, soil, and air [12,27,34]. The pathway is examined in two ways: indicators determining the characteristics of the pollutant-transmitting path and the dispersion range.
  • Pathway characterization
    (1)
    Air: floating masses of pollutants are likely to be dispersed; henceforth, the local air pollution may expand and turn to regional air pollution. The prevailing winds [36] and the region’s topographic position (the presence of physical barriers) [37] have the highest impact on the distribution of air pollutants.
    (2)
    Water: water supplies may transfer contaminants [38] (e.g., stored fuel, firewater, and other extinguishing agents). The parameters overshadowing the exposure probability of water resources (surface water and groundwater level) were also identified.
    (3)
    Soil: permeability is the foremost factor affecting the distribution of soil contaminants. In this regard, the soil granularity, i.e., whether the soil is coarse- or fine-grain, may affect the permeability level.
  • Dispersion level
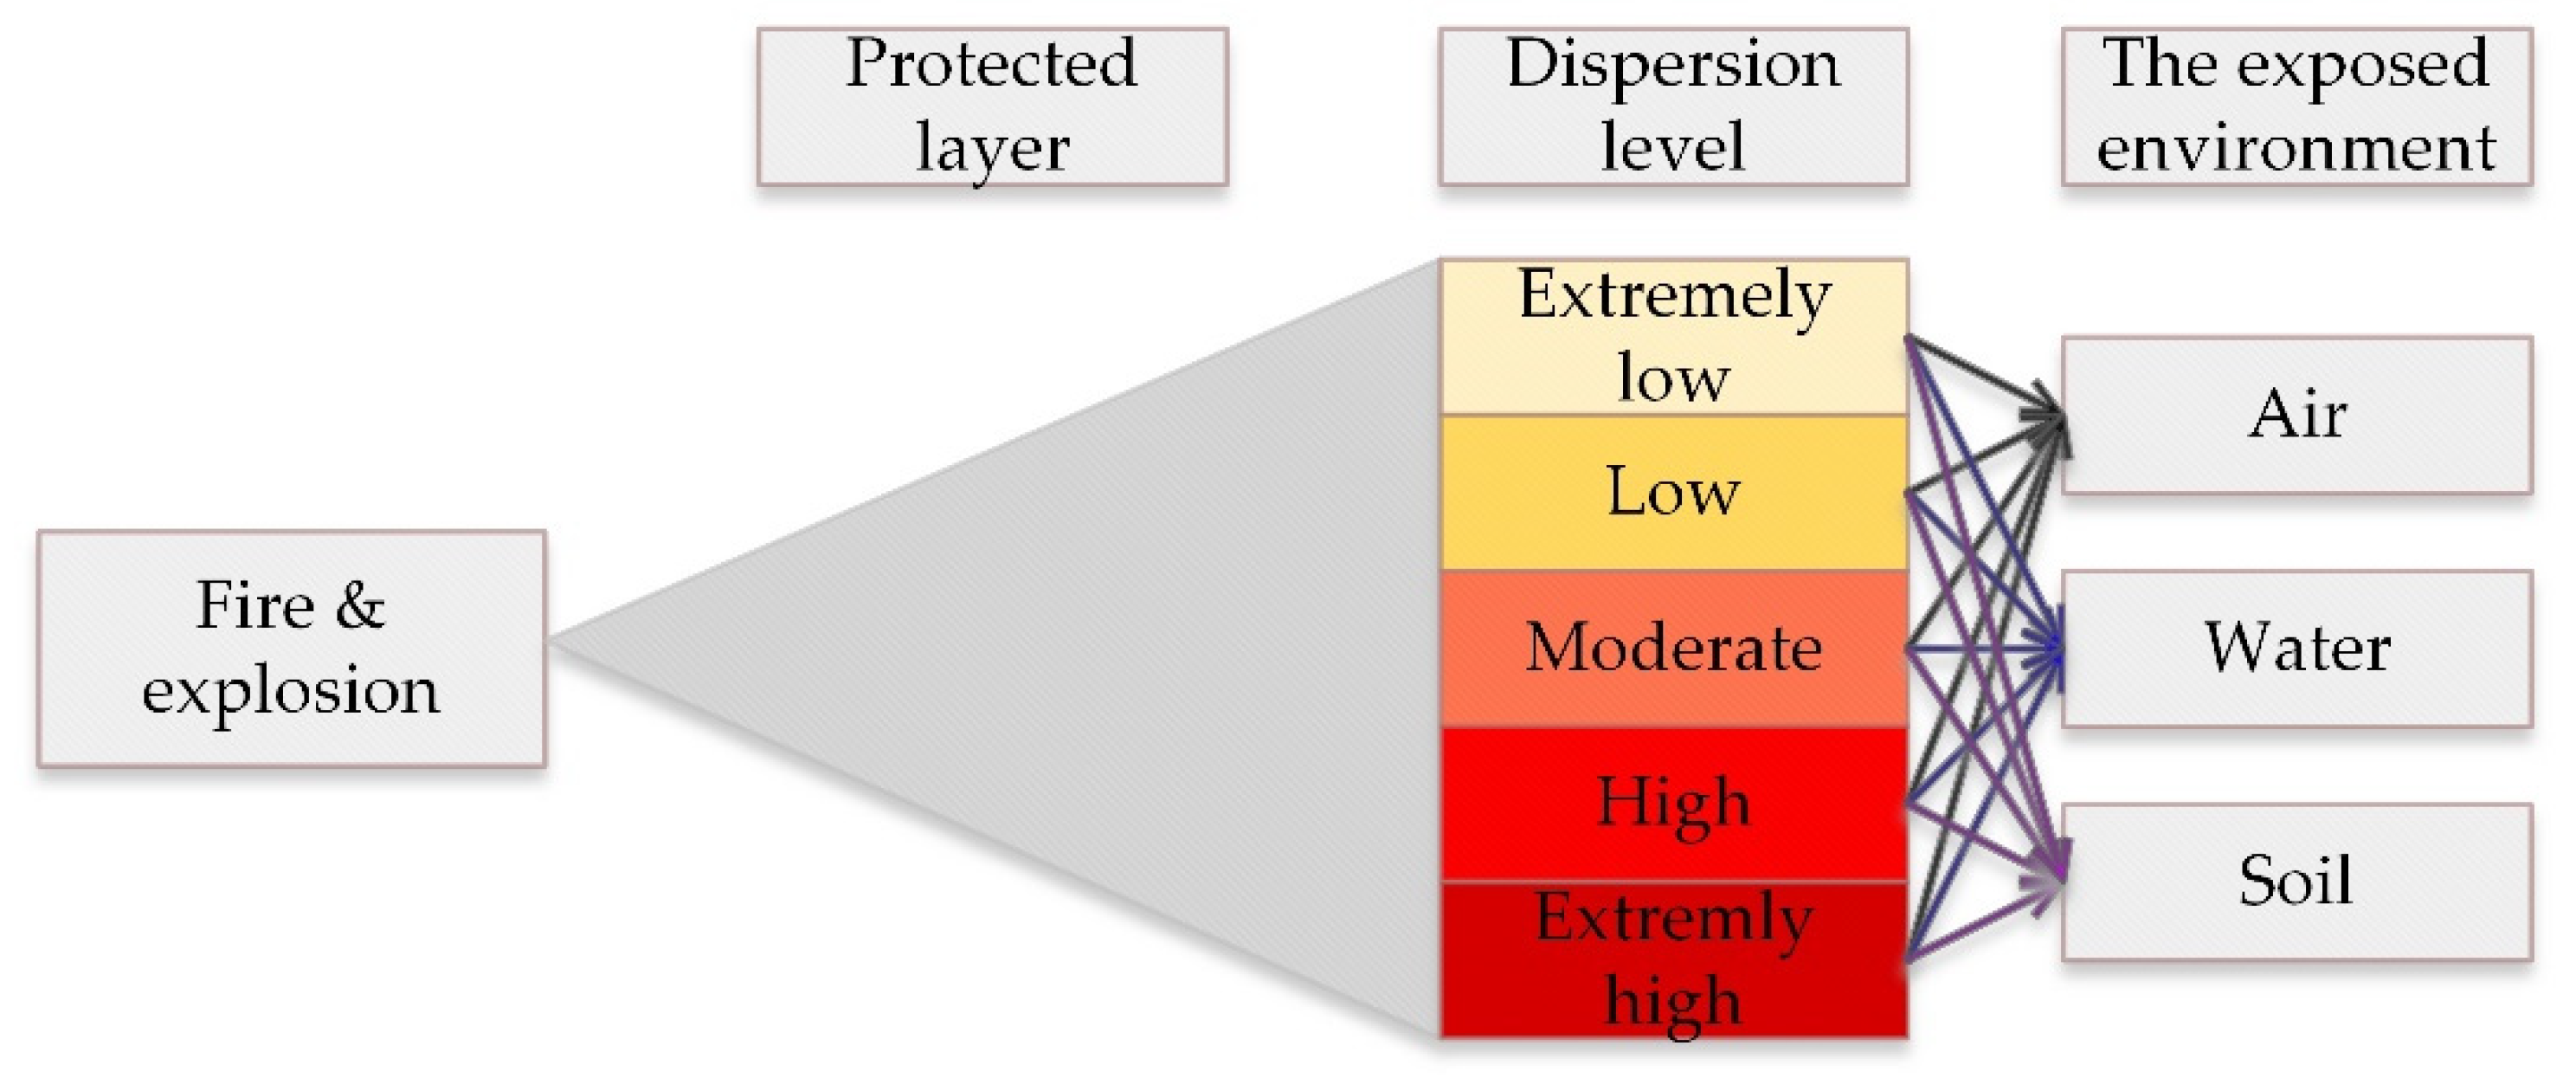
Event tree analysis (ETA) is a deductive logic with a beneficial graphical representation that can help to identify the various consequences of a critical event [23]. The event tree starts with the critical event and ends with the output events, i.e., consequences [28]. The traditional ETA assumption is access to accurate data, which is often unrealistic. Therefore, it leads to incorrect results and challenges the objectives of risk analysis [39]. Applying a different approach, the present study employed, for the first time, the graphical representation of ETA to evaluate the distribution of environmental pollutants as a result of fire and explosion (as the consequence of fire and explosion). The ETA method was used to determine the pollutant distribution in air, water, and soil in this study. Actually, the spread of pollution in water, soil, and air environments is the result of fire and explosion. The protection layers may affect the dispersion level; therefore, the opinions of experts on the influence of each protection layer were asked for using the Delphi method, and then the dispersion level was determined for each pathway. The event tree associated with the pollutant dispersion caused by fire and explosion is shown in Figure 4. This tree started with the critical event of fire and explosion; protective layers reduce the amount of pollution spread in air, water, and soil environments, so the range of spread in each of the pollution transfer environments is determined from extremely low to extremely high. For example, after assessing the performance of the protective layers, experts predict that the contamination by fire and explosion in the air will spread at levels that are extremely low, low, moderate, high, or extremely high. In the following sections, the characteristics of each contamination transmission environment and the definitions of distribution leveling are presented.
The dispersion probability in each of the environments was determined based on the effectiveness of the identified protective layers (barriers), which play an effective role in accident assessment [4]. Assuming that protective layers supplement each other, the present study considered the total efficiency of the barriers in lessening the level of dispersion. In contrast, conventional ETA considers the success probability of every single protective layer in determining the type of upcoming events or accidents (Table 2 displays the dispersion pathways in the exposed environment.
To determine the limits of the distribution of pollution, and by reviewing the incidents that have happened in Iran and the world, Table 3 was created and given to experts to score points. The validity and reliability of the questionnaire were measured using content validity and Cronbach’s alpha, respectively. The pollutants may spread on-site or off-site [12,23]. Due to the changes in the pollutant concentration during conveying within physical environments and the self-purifying ability of the environments identified (soil, water, and air), the significant effects of pollution and impacts upon the receptor may dispute distance, i.e., although pollutants are flowing through the environment, their severity may recede. Therefore, pollutant dispersion is divided into two aspects, namely ‘extent of dispersion’ and ‘extent of exposure.’ There is no source that specifically shows the level of dispersion of contamination. In fact, Table 3 is part of the innovation of the study and has an information gap. Therefore, by studying the accidents that have occurred around the world and specifically the accidents recorded on the CSB website, scientific studies and articles and expert opinions gained during the workshop sessions are presented in Table 3.

2.2.3. Receptor

The third level of assessment dealt with the receptor characterization and its vulnerability to the effects of the accident. The biological and socio-economic indicators were defined to assess the vulnerability of environmental receptors. The receptors were examined from two aspects: the receptor vulnerability and degree of impact.
  • Receptor vulnerability

Biological Indicators

The foremost goal in assessing environmental risk is to measure the vulnerability of ecological receptors [27]. Accordingly, the hazard level is determined using the important indicators identified for this purpose. Environmental components likely to be exposed and affected include terrestrial ecosystems, plants and animals, and population density [14]. The indicators identified in this regard are as follows:
  • Protected areas (of ecological value) [38].
  • Animals: the indigenous and introduced species in the affected area or species with a degree of protection [26,38].
  • Plants: on-site green spaces, plants of Kuhsar forest park, self-sown plants, and hand plants in Tehran city or species of conservation value [36,38].

Socio-Economic Indicators

  • Socio-economic parameters include human-related indicators and provide the extent of damage to mankind as part of the environment. The most important indicators identified are as follows:
  • Population density: the number of people per unit area in the affected area [26,27,38,40].
  • Man-made land-use changes: the type of man-made changes that may endanger human life and exacerbate the condition in the case of being damaged [26,27]. In assessing the damage to land uses (industry, agriculture, tourism, housing, etc.), the activities and land uses of the region are of strategic importance.
  • Disruption in fuel supply: it is of crucial importance owing to its prominent role in the economy, welfare, security, national image, and the occurrence of chaos.
  • Historical and cultural areas: the registered sites, buildings, and places that are historically and culturally valuable [29].
  • Severity of impact
Based on reviewing the related accidents in Iran and abroad and applying the experts’ opinions, the severity score of the environmental impacts is provided in Table 4 [23,41]. The validity and reliability of the questionnaire were measured using content validity and Cronbach’s alpha, respectively. Health effects depend on the type of the contaminant, its concentration, duration of exposure, other existing pollutants, and individual sensitivity [42].

2.3. Risk Description

Risk assessment is a systematic and scientific method used to prognosticate and prevent adverse risk-related events by collecting and integrating qualitative and quantitative data [28]. Risk description is the last step in the environmental risk assessment process. At this stage, the risk assessors use the analysis phase results to estimate the risk and report the results to the risk managers. In this study, the results obtained in each part of the risk analysis were systematically presented to risk managers.

3. Results

3.1. Problem Formulation

The purpose of the problem formulation is to identify the problem under scrutiny. In the present study, the following elements were identified to better understand the problem at hand:
  • Study site: an oil depot in the northwest of a city, specifically gasoline storage tanks.
  • The site ecology: the site in question is located in the northwest region of a city (the site’s ecological characterization was presented in the previous section).
  • The accident of foremost concern: fire and explosion.
  • Conceptual model: risk analysis using the SPR model.
  • Endpoint and objective: mitigating risk and preserving the environment.

3.2. Risk Analysis

Figure 5 shows a schematic of the steps and parameters involved in risk analysis. The results of each section are separately presented in the following sections.

3.2.1. Source

Calculation of the Dow F&EI

The results associated with each phase of the F&EI calculations are presented in Table 5.

Degree of Hazard

After calculating the process risk factors, the F&EI of gasoline tanks was measured via Equation (1) by multiplying the unit risk factor (F3) values by the material factor (MF). According to Dow guidelines, 5 degrees of hazard are set. The index obtained in this study equaled 123.52 for the gasoline tank, which is in the moderate risk range.
                          F & E I = F 3 × M F = 7.72   ×   16   =   123.52

The F&EI Hazard Zone Measurement

According to the results associated with the Dow F&EI, the zone of the accident caused by the fire and the explosion of a gasoline tank in an oil depot was measured to be 31 m.
R = 0.84 × X = 0.84 ×   123.52 = 103.75   F = 31   m
A = Π R2 = 33816 F2 = 3019 M2
There is at least one more tank in each zone of the four gasoline tanks.

3.2.2. Pathway

The characteristics of the exposure pathway and the exposure range were measured to investigate the role of the exposure pathway in environmental risk assessment.

Pathway Characterization

Considering the characteristics of the pathway, the degree of environmental hazard may vary. Therefore, the pathways were characterized following the investigation into the current ecological status (Table 6).

Dispersion Level

The results associated with the level of pollutant dispersion in water, soil, and air were obtained using the graphic-mathematical ETA method, analyzing the related accidents and surveying experts. The protective layer potential in effectively reducing the fire and explosion consequences was also determined using the Delphi method. The final results related to the ranking of protection layers are presented in Table 7. Kendall’s τ and Cronbach’s alpha coefficients were measured at 0.73 and 0.72, respectively.
The pollutant dispersion in air, water, and soil was estimated by considering the function of the protective layers (Table 8). The validity and reliability of this section were confirmed by experts’ opinions and Cronbach’s alpha (which was more than 0.7 (0.78)), respectively.

3.2.3. Receptor

The results associated with the impacts on the receptor are presented in two parts as follows:

Receptor Vulnerability

The vulnerability of the receptor, considering its current position in the region, is shown in Table 9.

Severity of Impact

Table 10 presents the extent of potential impacts on the receptors. The reliability of this questionnaire was measured at 0.76 using Cronbach’s alpha.

3.3. Risk Description

The results associated with each part, viz. source, pathway, and receptor, are presented in Table 11 to conclude the findings and describe the potential hazards.

4. Discussion

In this study, the environmental risk assessment was conducted via integrating complementary methods. In the future, this method can be employed as a structured framework to investigate oil depots in different geographical locations and conditions as well as other sectors of the oil industry (refineries and petrochemicals, to name a few). A variety of techniques used in risk assessment can be considered complements rather than substitutes because each technique evaluates the system under analysis in a distinct way and from a specific perspective. It is scientifically proven that no technique is adequately powerful enough to answer all questions, or applicable to all conditions. In this research, the problem was first formulated as a step-by-step study. Then, the SPR model was applied to analyze the impacts. The source characterization was carried out using the Dow index. Following the calculation of three identified factors (material factor, general process hazard factor, and certain process hazard factor), the extent of hazard lay at a medium range and the fire zone and the affected radius were measured at 31 m and 3019 square meters, respectively. Considering the similar characterization of four gasoline tanks, the result can be generalized to other tanks as well; therefore, the probable scenarios can be formed as follows:
  • If tank No. 3 has a fire accident, according to the Dow method calculations, the fire will affect a radius of 31 m, in which two storage tanks, including tank No. 1 containing diesel and tank No. 5 containing gasoline, are located, which can possibly influence it.
  • If a fire or explosion occurs in Tank No. 5, subsequently, Tank No. 3 containing gasoline will also be in danger.
  • If tank No. 5 has a fire accident, there is a tank within 31 m of it, including tank No. 3 containing gasoline, which is likely to be affected by the accident.
  • If tank No. 11 has a fire incident, tank No. 3 containing gasoline and tank No. 8 containing kerosene will be affected.
  • If a fire occurs in Tank No. 10, subsequently, Tank No. 11 and Tank No. 9 containing gasoline and diesel, respectively, will also be in the danger zone.
In fact, if any of the four tanks containing gasoline has a fire accident, the other tanks that are in their danger zone will probably be affected and catch fire as well. Immediate and correct actions regarding risk managers are very important because affecting the tanks located in the danger radius will possibly spread the fire, affecting more tanks. Each of these scenarios that actually shows the domino effect needs separate studies. Therefore, the time, cost, quality, and focus of studies are limiting factors. It may be better to model one of the most extreme scenarios with appropriate methods. This scenario is probably primary because it sees more tanks in close proximity than the other scenarios.
6.
The control room, offices, and machinery station should be distanced at least 31 m from the fuel tanks.
According to the study by Bouafia et al. [3], the exposure area of a fuel tank containing a maximum of 2,500,000 L of gasoline was measured to be 1963 square meters using the Phast pool fire model. Even though their estimated value is less than the exposure area calculated in the present study, it is somewhat justifiable by taking into account the lower volume of fuel; however, the role of other factors should not be overlooked.
Since the oil depot of concern is located at the northwestern border of a city (365 m from the Hesarak district), and also regarding the presence of restaurants in the vicinity of this oil depot, safety is a matter of crucial importance because in the event of an accident, not only will the oil depot operation shut off but also considerable environmental and especially human damages will follow.
The pathways were characterized using a five-point scale to analyze the exposure pathway (water, soil, and air). To this end, some indicators were defined for each of the pathways. Due to the prevailing wind flowing toward the city, the location of the oil depot—at the foot of the mountain—and the possibility of air trapping, a score of five was allocated to the air pathway. Groundwater received a score of 1, and surface water received a score of 4 due to the proximity of the Hesarak River to the oil depot in question. Given the varied granularity of the site soil, i.e., coarse-grain and fine-grain, the permeability received a score of 4. The scope of pollutant dispersion was plotted using the graphic-mathematical ETA method. Protective layers mitigating dispersion were identified and rated using the Delphi method, and then the dispersion level in each environment at exposure, i.e., air, water, and soil, was scored by experts using the Likert scale. According to the findings, air, water, and soil had the highest dispersion, in the stated order. The effects on receptors were evaluated in the risk analysis process. To this end, the receptor vulnerability was first analyzed using a five-point scale by defining the indicators that determine the current situation. From the biological aspect, the parameter of the ecological area was assigned a score of 1 due to the lack of an area under environmental protection, the animal parameter was given a score of 2 due to the lack of both endemic species and species of conservation value, and the plant parameter received a score of 4 owing to natural vegetation (albeit scant), fruitful trees, agriculture, and urban green spaces. The highest impacts pointed to the socio-economic aspect. In this regard, the population density and man-made land use parameters were assigned a score of 5 due to the proximity of the Tehran metropolis. Similarly, the fueling (fuel supply) parameter, an economically notable parameter affecting national image, chaos, and public welfare, received a score of 5. As there is no registered historical and cultural site in the exposure area, this parameter was assigned a score of 1. According to experts’ opinions, the average exposure intensities of socio-economic and biological receptors were estimated at 4.7 and 2.4, respectively.
Risk description using the SPR model can substantially help risk appraisers, decision makers, and managers to develop a plan and reduce and control risks and related consequences. The score of the F&EI—ranked third out of five—showed the high possibility of pollutants’ movement through air and water, and high vulnerability of receptors—as identified in this study—especially mankind, proving the importance of the F&EI as a hazard of crucial concern in the study site, which is required to be taken into account. Therefore, examining the safety of the site with the latest and most valid methods; controlling and managing the potential causes of danger; mitigating the quantity of fuel storage in this depot; determining the feasibility of site relocation by observing safety, environmental, technical, and economic issues; and diminishing operations seem to be of great necessity.
The knowledge related to the source, pathway, receptor model for the fate of microplastics in the environment has been investigated in a previous study [34].
Vora et al. [12] proposed an ERA framework for the EOR solutions in the process of oil extraction in three main steps, viz., problem formulation, risk analysis, and risk description. In the present applied study, the source, pathway, receptor model was employed to analyze risk for a case study, while the studies mentioned above were merely a review of previously published research.

5. Conclusions

In this study, the basis of the model was formed using the basic approaches and acceptable frameworks of ERA of EPA and SPR. In the form of a conceptual model, the objectives of the study include risk assessment from the beginning and occurrence of the accident to the end, and its environmental consequences.
Considering that the environmental risk assessment in this study starts from the fire and explosion accident, each step was done in a specific way.
An appropriate and integrated combination of methods was performed for environmental risk assessment. Comprehensive visibility helped make the output of the technical methods (Dow) a, appropriate input for environmental assessment.
Since the risk rating obtained by the Dow method is in the middle class, due to the conditions of the pathways, especially the air, and the proximity of the oil storage to a large city, which includes the vulnerability of the receptors, the management plan risk is important, which can be presented during a study and scientific program.
The proposed model considerably reflects the current knowledge and gaps via a structured environmental risk assessment framework; however, it can be expanded with further findings. Various scenarios can be put forth, emphasizing the domino effects of fire and explosion accidents in the oil depot. In this process, the routes and the modes of dispersion must be well understood and analyzed in more detail by considering other factors, such as concentrations and main transport processes. Studies can also be designed to scrutinize the damage to plants and animals, considering various concentrations depending on the accident in question. In this way, it is possible to provide a more accurate and quantitative estimation of the damage severity. Furthermore, an emergency preparedness plan can be developed by providing methods for controlling the environmental damage caused by the spread of pollution.

Author Contributions

Conceptualization, R.D.Z. and T.D.; methodology, R.D.Z.; software, R.D.Z.; validation, S.M.M., S.A.J. and E.R.; formal analysis, E.R.; investigation, S.M.M.; resources, S.A.J.; data curation, S.M.M.; writing—original draft preparation, R.D.Z.; writing—review and editing, T.D.; visualization, E.R.; supervision, S.M.M.; project administration, R.D.Z.; funding acquisition, T.D. All authors have read and agreed to the published version of the manuscript.

Funding

This study was funded by the Ministry of Petroleum of the Islamic Republic of Iran (970712/16), which is highly appreciated.

Data Availability Statement

Data related to this article are available upon request from the corresponding author.

Acknowledgments

We thank Hajialiloo for providing access to the data.

Conflicts of Interest

The authors declare no conflict of interest.

References

  1. Doregar Zavareh, R.; Dana, T.; Roayaei, E.; Monavari, S.M.; Jozi, S.A. Emission Risk Assessment of Toxic Gases of Floating Roof Tanks. Pollution 2022, 8, 875–888. [Google Scholar] [CrossRef]
  2. Zinke, R.; Köhler, F.; Klippel, A.; Krause, U.; Leitl, B. Emissions of volatile hydrocarbons from floating roof tanks and their local dispersion: Considerations for normal operation and in case of damage. J. Loss Prev. Process Ind. 2020, 66, 104179. [Google Scholar] [CrossRef]
  3. Bouafia, A.; Bougofa, M.; Rouainia, M.; Medjram, M.S. Safety Risk Analysis and Accidents Modeling of a Major Gasoline Release in Petrochemical Plant. J. Fail Anal. Prev. 2020, 20, 358–369. [Google Scholar] [CrossRef]
  4. Necci, A.; Argenti, F.; Landucci, G.; Cozzani, V. Accident scenarios triggered by lightning strike on atmospheric storage tanks. Reliab. Eng. Syst. Saf. 2014, 127, 30–46. [Google Scholar] [CrossRef]
  5. Qin, R.; Khakzad, N.; Zhu, J. An overview of the impact of Hurricane Harvey on chemical and process facilities in Texas. Int. J. Disaster Risk Reduct. 2020, 45, 101453. [Google Scholar] [CrossRef]
  6. Shi, L.; Shuai, J.; Xu, K. Fuzzy fault tree assessment based on improved AHP for fire and explosion accidents for steel oil storage tanks. J. Hazard. Mater. 2014, 278, 529–538. [Google Scholar] [CrossRef]
  7. Zinke, R.; Melnychuk, J.; Köhler, F.; Krause, U. Quantitative risk assessment of emissions from external floating roof tanks during normal operation and in case of damages using Bayesian Networks. Reliab. Eng. Syst. Saf. 2020, 197, 2–12. [Google Scholar] [CrossRef]
  8. Pouyakian, M.; Jafari, M.J.; Laal, F.; Nourai, F.; Zarei, E. A comprehensive approach to analyze the risk of floating roof storage tanks. Process Saf. Environ. Prot. 2021, 146, 811–836. [Google Scholar] [CrossRef]
  9. Kang, J.; Liang, W.; Zhang, L.; Lu, Z.; Liu, D.; Yin, W.; Zhang, G. A new risk evaluation method for oil storage tank zones based on the theory of two types of hazards. J. Loss Prev. Process Ind. 2014, 29, 267–276. [Google Scholar] [CrossRef]
  10. Lu, L.; Liang, W.; Zhang, L.; Zhang, H.; Lu, Z.; Shan, J. A comprehensive risk evaluation method for natural gas pipelines by combining a risk matrix with a bow-tie model. J. Nat. Gas Sci. Eng. 2015, 25, 124–133. [Google Scholar] [CrossRef]
  11. Chen, S.; Chen, B.; Fath, B.D. Ecological risk assessment on the system scale: A review of state-of-the-art models and future perspectives. Ecol. Model. 2013, 250, 25–33. [Google Scholar] [CrossRef]
  12. Vora, M.; Sanni, S.; Flage, R. An environmental risk assessment framework for enhanced oil recovery solutions from offshore oil and gas industry. Environ. Impact Assess. Rev. 2021, 88, 106512. [Google Scholar] [CrossRef]
  13. DEAT. Ecological Risk Assesment, Integrated Environmental Management Information Series 6; Department of Environmental Affairs and Tourism (DEAT): Pretoria, South Africa, 2005.
  14. Topuz, E.; Talinli, I.; Aydin, E. Integration of environmental and human health risk assessment for industries using hazardous materials: A quantitative multi criteria approach for environmental decision makers. Environ. Int. 2011, 37, 393–403. [Google Scholar] [CrossRef] [PubMed]
  15. Khan, F.; Rathnayaka, S.; Ahmed, S. Methods and Models in Process Safety and Risk Management: Past, Present and Future. Process Saf. Environ. Prot. 2015, 98, 116–147. [Google Scholar] [CrossRef]
  16. Khakzad, N.; Khan, F.; Amyotte, P. Quantitative risk analysis of offshore drilling operations: A Bayesian approach. Saf. Sci. 2013, 57, 108–117. [Google Scholar] [CrossRef]
  17. Xin, P.; Khan, F.; Ahmed, S. Dynamic Hazard Identification and Scenario Mapping Using Bayesian Network. Process Saf. Environ. Prot. 2016, 105, 143–155. [Google Scholar] [CrossRef]
  18. Nakayama, J.; Sakamoto, J.; Kasai, N.; Shibutani, T.; Miyake, A. Preliminary hazard identification for qualitative risk assessment on a hybrid gasoline-hydrogen fueling station with an on-site hydrogen production system using organic chemical hydride. Int. J. Hydrogen Energy 2016, 41, 7518–7525. [Google Scholar] [CrossRef]
  19. Xie, S.; Dong, S.; Chen, Y.; Peng, Y.; Li, X. A novel risk evaluation method for fire and explosion accidents in oil depots using bow-tie analysis and risk matrix analysis method based on cloud model theory. Reliab. Eng. Syst. Saf. 2021, 215, 107791. [Google Scholar] [CrossRef]
  20. Guo, X.; Ji, J.; Khan, F.; Ding, L. Fuzzy bayesian network based on an improved similarity aggregation method for risk assessment of storage tank accident. Process Saf. Environ. Pro.t 2020, 144, 242–252. [Google Scholar] [CrossRef]
  21. Luo, T.; Wu, C.; Duan, L. Fishbone diagram and risk matrix analysis method and its application in safety assessment of natural gas spherical tank. J. Clean Prod. 2018, 174, 296–304. [Google Scholar] [CrossRef]
  22. Zhao, J.; Li, W.; Bai, C. Risk Evaluation for Fire and Explosion Accidents in the Storage Tank Farm of the Refinery. Chem. Eng. Trans. 2017, 62, 1345–1350. [Google Scholar] [CrossRef]
  23. Fu, S.; Yan, X.; Zhang, D.; Li, C.; Zio, E. Framework for the quantitative assessment of the risk of leakage from LNG-fueled vessels by an event tree-CFD. J. Loss Prev. Process Ind. 2017, 43, 42–52. [Google Scholar] [CrossRef]
  24. Wang, J.; Song, W.H. Fire and Explosion Index calculation method incorporating classified safety measure credits. J. Loss Prev. Process Ind. 2013, 26, 1128–1133. [Google Scholar] [CrossRef]
  25. Wu, D.; Chen, Z. Quantitative risk assessment of fi re accidents of large-scale oil tanks triggered by lightning. EFA 2016, 63, 172–181. [Google Scholar] [CrossRef]
  26. Zeleňáková, M.; Zvijáková, L. Risk analysis within environmental impact assessment of proposed construction activity. Environ. Impact Assess. Rev. 2017, 62, 76–89. [Google Scholar] [CrossRef]
  27. Qinqin, C.; Jia, Q.; Yuan, Z.; Huang, L. Environmental risk source management system for the petrochemical industry. Process Saf. Environ. Prot. 2014, 92, 251–260. [Google Scholar] [CrossRef]
  28. Shahriar, A.; Sadiq, R.; Tesfamariam, S. Risk analysis for oil & gas pipelines: A sustainability assessment approach using fuzzy based bow-tie analysis. J. Loss Prev. Process Ind. 2012, 25, 505–523. [Google Scholar] [CrossRef]
  29. Bi, H.; Si, H. Dynamic risk assessment of oil spill scenario for Three Gorges Reservoir in China based on numerical simulation. Saf. Sci. 2012, 50, 1112–1118. [Google Scholar] [CrossRef]
  30. Yari, M.; Bagherpour, R.; Khoshouei, M.; Pedram, H. Investigating a comprehensive model for evaluating occupational and environmental risks of dimensional stone mining. Rud. Geološko-Naft. Zb. 2020, 35, 101–109. [Google Scholar] [CrossRef]
  31. Yari, M.; Monjezi, M.; Bagherpour, R.; Sayadi, A.R. Blasting Operation Management Using Mathematical Methods. Eng. Geol. Soc. Territ. 2015, 1, 483–493. [Google Scholar] [CrossRef]
  32. Norton, S.B.; Rodier, D.J.; van der Schalie, W.H.; Wood, W.P.; Slimak, M.W.; Gentile, J.H. A framework for ecological risk assessment at the EPA. Environ. Toxicol. Chem. 1992, 11, 1663–1672. [Google Scholar] [CrossRef]
  33. Waldschläger, K.; Lechthaler, S.; Stauch, G.; Schüttrumpf, H. The way of microplastic through the environment–Application of the source-pathway-receptor model (review). Sci. Total Environ. 2020, 713, 136584. [Google Scholar] [CrossRef] [PubMed]
  34. Holdgate, M.W. A Perspective of Environmental Pollution. Int. Relat. 1980, 6, 850–851. [Google Scholar] [CrossRef]
  35. AIChE. Dow’s Fire & Explosion Index Hazard Classification Guide, 7th ed.; Wiley: Hoboken, NJ, USA, 1994. [Google Scholar]
  36. Stevens, C.J.; Bell, J.N.B.; Brimblecombe, P.; Clark, C.M.; Dise, N.B.; Fowler, D.; Lovett, G.M.; Wolseley, P.A. The impact of air pollution on terrestrial managed and natural vegetation: Air pollution impacts on vegetation. Philos. Trans. R. Soc. A Math. Phys. Eng. Sci. 2020, 378, 20190317. [Google Scholar] [CrossRef] [PubMed]
  37. Goldemberg, J.; Lucon, O. Energy, Environment and Development, 2nd ed.; Earthscan: Oxford, UK, 2010. [Google Scholar] [CrossRef]
  38. Papadopoulou, M.P.; Antoniou, C. Environmental impact assessment methodological framework for liquefied natural gas terminal and transport network planning. Energy Policy 2014, 68, 306–319. [Google Scholar] [CrossRef]
  39. Ferdous, R.; Khan, F.; Sadiq, R.; Amyotte, P.; Veitch, B. Analyzing system safety and risks under uncertainty using a bow-tie diagram: An innovative approach. Process Saf. Environ. Prot. 2011, 91, 1–18. [Google Scholar] [CrossRef]
  40. Tenerelli, P.; Gallego, J.F.; Ehrlich, D. Population density modelling in support of disaster risk assessment. Int. J. Disaster Risk Reduct. 2015, 13, 334–341. [Google Scholar] [CrossRef]
  41. Kokangül, A.; Polat, U.; Dağsuyu, C. A new approximation for risk assessment using the AHP and Fine Kinney methodologies. Saf. Sci. 2017, 91, 24–32. [Google Scholar] [CrossRef]
  42. Kampa, M.; Castanas, E. Human health effects of air pollution. Environ. Pollut. 2008, 151, 362–367. [Google Scholar] [CrossRef]
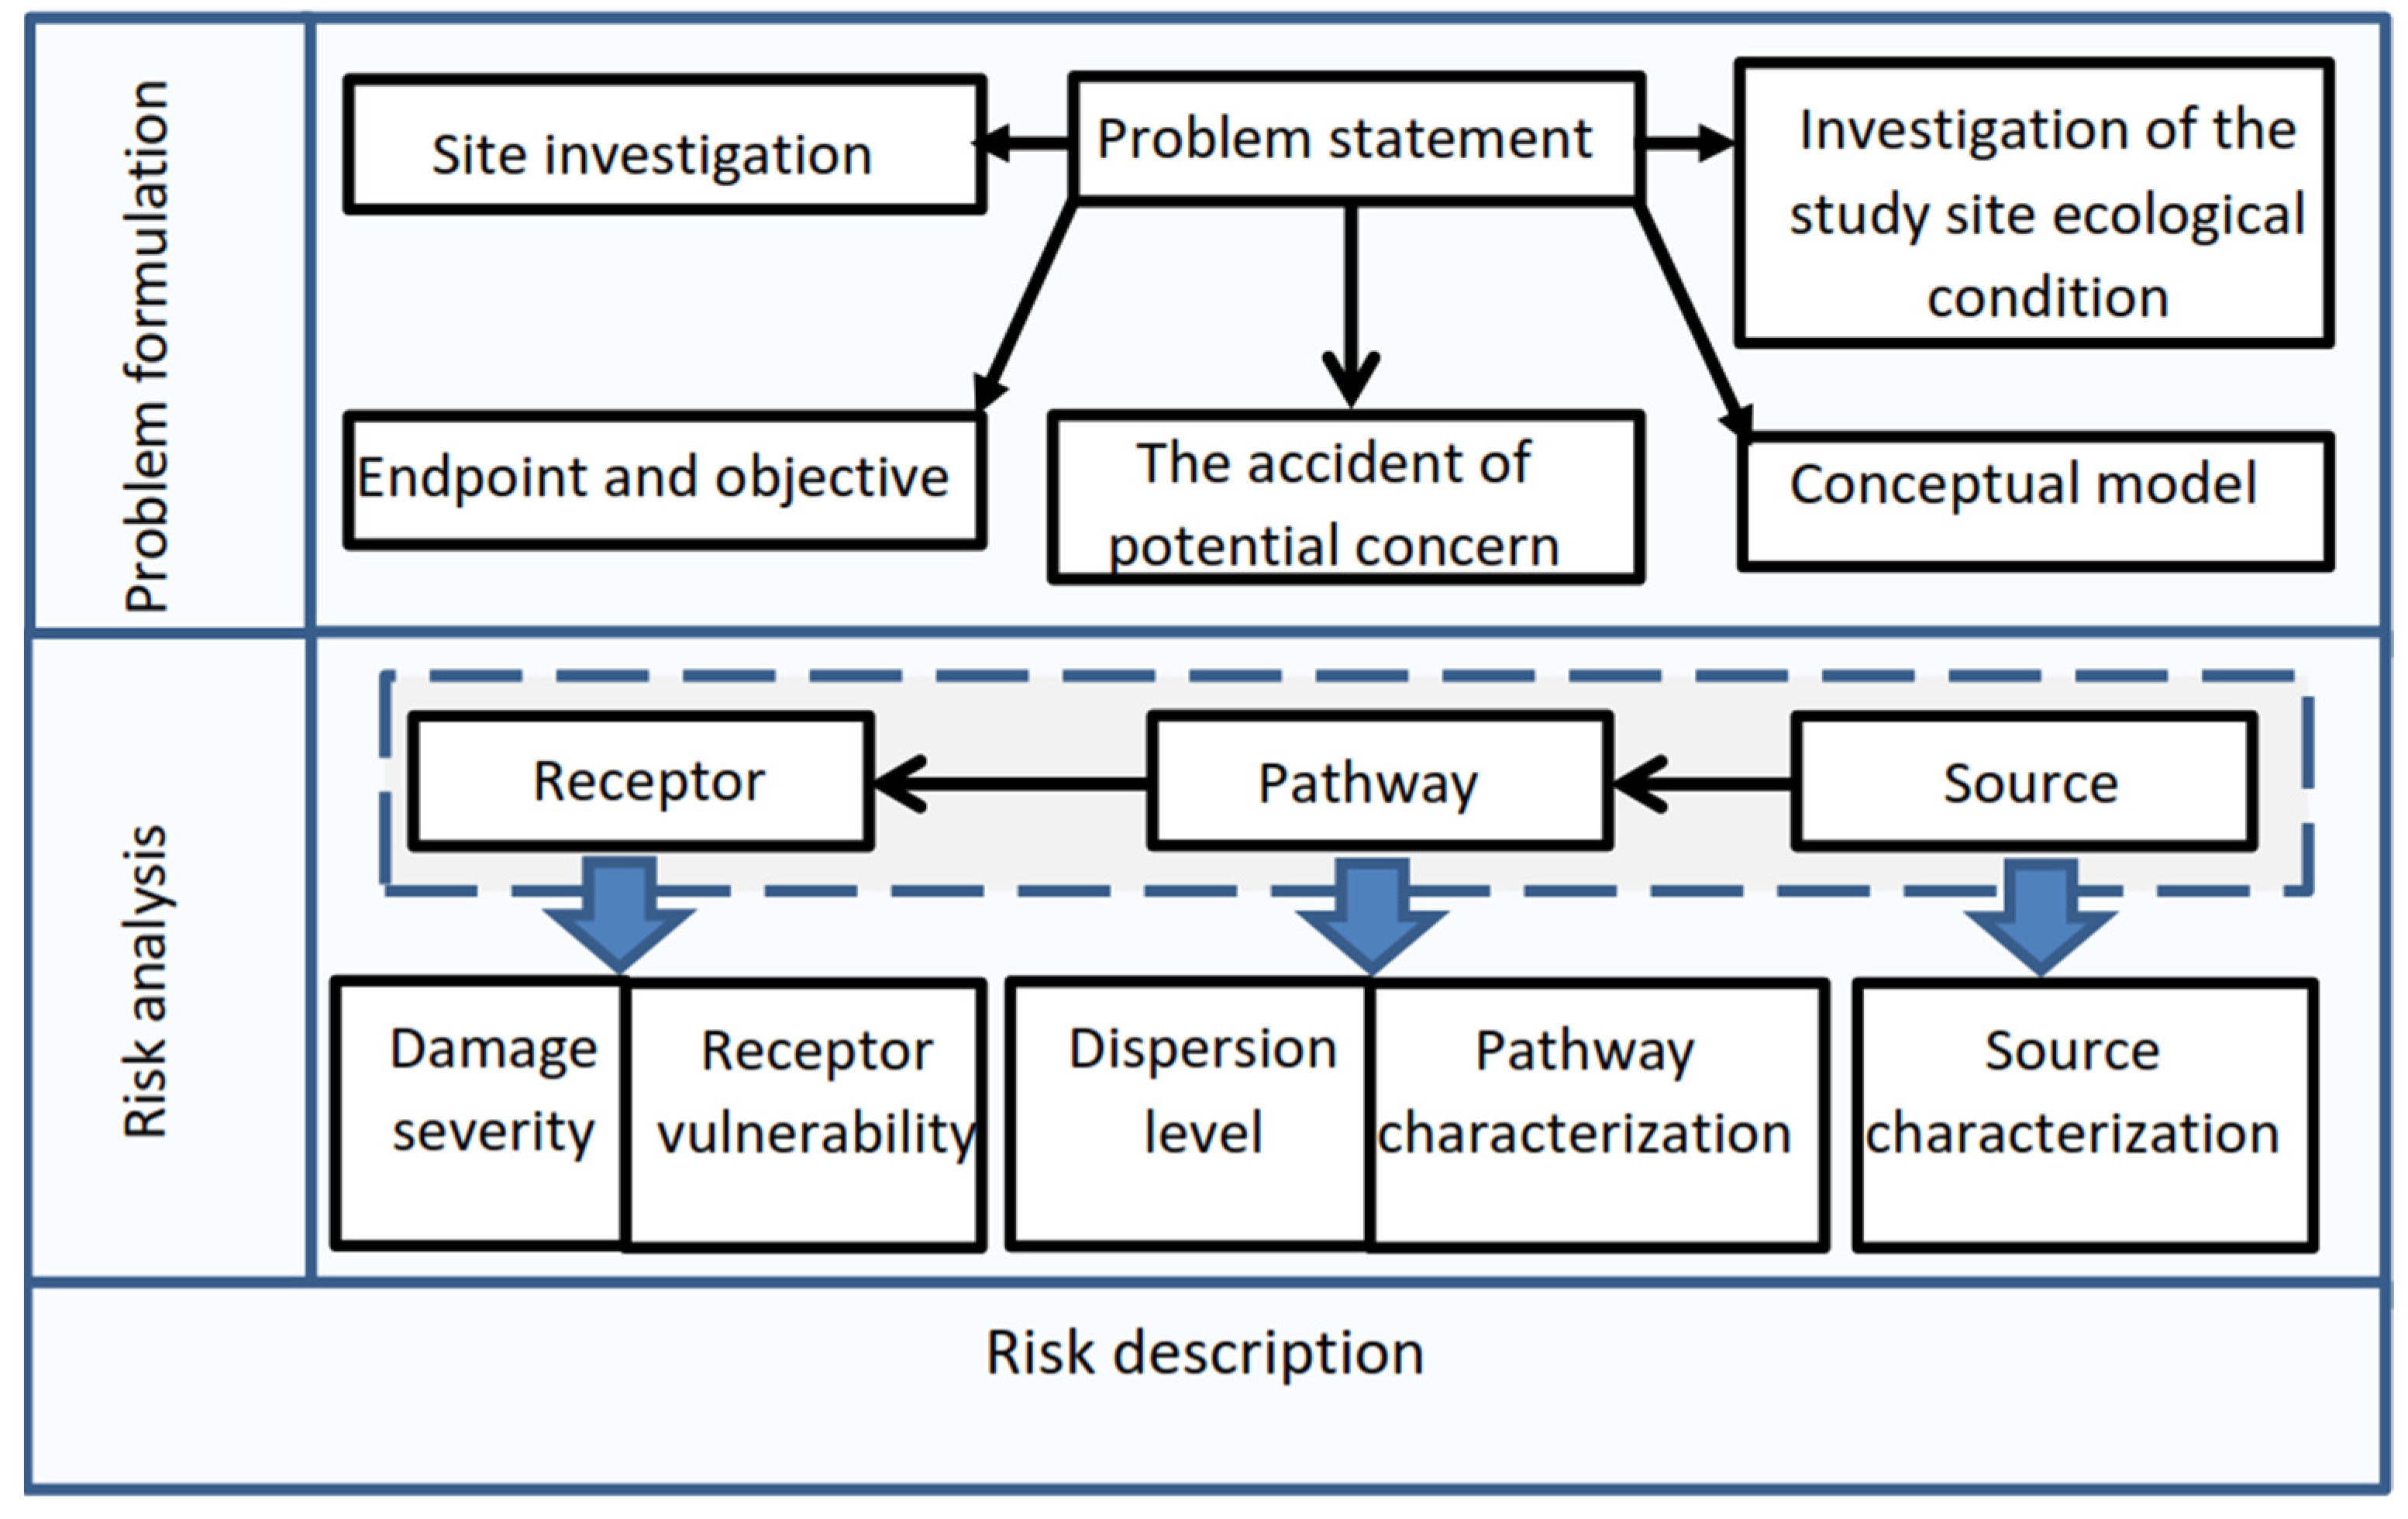
Figure 1. The proposed conceptual model.
Sustainability 14 10747 g001
Figure 2. Location of oil depot.
Sustainability 14 10747 g002
Figure 3. The environmental risk assessment associated with fire/explosion in this study.
Sustainability 14 10747 g003
Figure 4. The event tree associated with the pollutant dispersion caused by fire and explosion.
Sustainability 14 10747 g004
Figure 5. The steps and parameters of environmental risk analysis.
Sustainability 14 10747 g005
Table 1. Location and ecological status of the study site.
ParameterDescription
Geographical
coordinates
Latitudes: between 35°46′55″ and 35°46′43″ N
Longitude: between 51°17′43″ and 51°18′6″ E
ClimateModerate: the average daily temperature is 17.4 °C
Distance to
settlements
From the North: there is no settlement.
From the South: the border of the oil depot near the restaurants located in District 5 of Tehran Municipality.
From the East: 435 m from the Hesarak district
From the West: 25 m from a residential complex with 12,000 square meters and 167 m from Kuhsar Forest Park.
Wind directionWest (W)
Surface waterHesarak River flows along the eastern and southern boundary of the oil depot
Kan River is located about 2.8 km from the western border of this oil depot
Groundwater levelApproximately equal or more than 130 m
Flooding riskThe oil depot under study located in the northwest of a city is subject to instability caused by flooding due to its proximity to the Kan River basin, the high relative share of constructions, relatively high density of population and housing, land-use changes, encroachment on the river bank and its bed, and improper exploitation of watercourse.
GeologyUpper red formation, conglomerate, and sandstone
FaultThe south of the site bordering a fault
Areas with environmental protectionThe study site is located in none of the zones protected by the Environment Organization of Iran and international authorities; moreover, it lacks the characteristics of natural areas containing specific plant and animal species.
Socio-economic statusThe study site is located on the northern edge of a city. The populations of the mentioned district and this city are 858,346 and 8,737,510 people, respectively.
Table 2. Descriptions associated with the pollutant dispersion pathways.
PathwayDescription
AirAir pollutionIncreased vibration and noise level
WaterSurface waters (Hesarak rivers)Groundwater
SoilSurface soils and substrates
Table 3. The pollutant dispersion.
No.Dispersion LevelDescription
Extent of DispersionExtent of Exposure
1Extremely lowAir, water, and soil: slight pollutant dispersion in the study site
2LowAir: ≥1000 m≥500 m
Water: ≥2000 m≥1000 m
Soil: slight pollutant dispersion off-site
3ModerateAir: ≥3000 m≥1000 m
Water: ≥5000 m≥3000 m
Soil: ≥1500 m≥1000 m
4HighAir: ≥6000 m≥1500 m
Water: ≥10,000 m≥8000 m
Soil: ≥2000 m≥1500 m
5Extremely highAir: ≥15,000 m≥2500 m
Water: ≥15,000 m≥10,000 m
Soil: ≥2500 m≥2000 m
Table 4. The severity of impact.
No.DegreeDescription
1Extremely lowNo impact
2LowBiological: minor effects on the green space of the site
Human-related: reversible effects on personnel health
3ModerateBiological: minor off-site effects
Human-related: reversible effects on citizens’ health/severe injuries to the site personnel
4HighBiological: acute off-site effects
Human-relate: acute effects on citizens’ health/death or severe injuries to several site personnel
5Extremely highBiological: acute and long-term effects off-site
Human-related: severe injuries to or death of several citizens
Table 5. Gasoline material factor and properties.
MaterialMFHC(BTU/LB)
×103
NFPA CLASSIFICATIONFlash Point (Deg F)Boiling Point (Deg F)
N(R)N(F)N(H)
Gasoline1618.8130−45100–400
General process hazards factor (F1)
Base factorsPenalty factor rangePenalty factor used
Base factor11
Material handling and transfer0.25–1.050.85
Access0.2–0.350
Drainage and spill control0.25–0.50.20
General process factor2.05
Special process hazards factor (F2)
Base factorsPenalty factor rangePenalty factor used
Base factor11
Toxic materials0.8–0.20.2
Sub-atmospheric pressure0.50
Operation near flammable materials0.8–0.30.5
Low temperature0.2–0.30
Quantity of flammable-unstable material1.57
Corrosion and erosion0.1–0.750
Leakage from joins and packing0.1–1.50
Uses of fired equipment 0
Hot oil heat exchange system0.15–1.150
Rotating equipment0.50.5
Special process hazards factor3.77
Table 6. The results associated with the pathway characterization.
ParameterIndex Score
12345
Air
Prevailing windsAway from residential areasToward the margins of the cityTowards the promenadeTowards villages/low-density settlements/natural areaToward the city/valuable ecological areas
Topographic positionPlainAdjacent to Mahur hillThe foot of the mountain and the probability of air trapping
Water
Groundwater levelGroundwater level more than 10 m/no well and spring at a distance of about 1500 mGroundwater level more than 5 m/no well and spring at a distance of about 700 mGroundwater level more than 5 m/wells and springs at a distance of approximately 300 mAdjacent to wells, aqueducts, and springs/exploited groundwater level about 5 m or lessAdjacent to wells, springs, and aqueducts/exploited groundwater level less than 5 m
Surface waterLack of permanent water resources at a distance of about 2000 mPermanent bodies of surface water at a distance of about 1500 mA permanent river at a distance of about 500 mAdjacent to rivers, lakes, and other surface water sourcesAdjacent to rivers, lakes, and other surface water resources of special ecological importance or overflow to areas of ecological value/habitat of special species
Soil
Soil permeabilityFine-grainedCoarse-/fine-grainedCoarse-/fine-grainedCoarse-grained
Table 7. The performance scores of protective layers in mitigating F&EI consequences.
No.Protective LayerScore
1Alarm systems warning to (1) people on the site and (2) service organizations such as the fire department4.846
2Cooling of adjacent equipment and structures with portable sprinklers (Deluge system)4.846
3Emergency response plan4.769
4Urgent medical measures4.154
5Evacuating staff from the site4.154
6Fixed foam system (foam injection from the top of the tank)4.077
7Portable foam system4.077
8Cooling adjacent equipment and structures with water spray using portable devices4
9Drawing material from the tank3.923
10Monitoring surrounding areas by observing or patrolling personnel3.923
11Gas detectors that constantly monitor the surrounding areas3.923
12Evacuating residents adjacent to the site3.923
13Equipping tanks with an automatic deluge system3.308
14Fixed foam system (foam injection from the bottom of the tank)3.154
Table 8. The results of pollutant dispersion in all exposed environments.
No.Exposed EnvironmentDispersion
1Air4.46
2Water4.15
3Soil3.46
Table 9. The receptor vulnerability to the hazards caused by fire and explosion.
ParameterIndex Score
12345
Biologic
Ecological
areas
Lack of protected area exposed to damageDistance between 200 and 3000 m to areas under the protection of the Environment Organization or other national and international authorities and forest reservesDistance between 1000 and 2000 m to areas under the protection of the Environment Organization or other national and international authorities and forest reservesDistance less than 1000 m to areas under the protection of the Environment Organization or other national and international authorities and forest reservesIn or adjacent to areas of recorded ecological value
AnimalsNo/very few animalsSpecies without conservation value and non-endemicVulnerable speciesOne species of conservation valueA species of conservation value
PlantsNo/very little vegetationUrban green space (shrubs and bushes)Hand-plant trees (non-fruitful)Natural vegetation/fruitful trees/agriculture as well as hand-plant trees and green spaceNatural vegetation (of conservation value)
Socioeconomic
Population densityNo population2074153250
Man-made land-usesNo residential, industrial, service, or commercial land useMicro-scale commercial land useCommercial land useIndustrial, service, and commercial land usesEmergency response centers (fire department, medical centers)/residential land use/oil fields or similar areas
Fuel providingSupporting siteDuty to fueling intercity gas stationsStorage of one type of fuel/tank with a capacity of fewer than 3 million litersContains more than one type of fuel in storage/tanks with a capacity of more than 3 million liters l
Historical and cultural areasNo registered area of the historical and cultural areaRegistered areas of regional valueRegistered areas of national valueRegistered areas of national and supra-regional valueRegistered areas of international and national value
Table 10. The results of the severity of impacts.
Exposed AspectExtent of Potential Impacts
Biologic2.4
Socioeconomic4.7
Table 11. Risk description.
SourcePathwayReceptor
GroupThe characteristics of site and substancesPathway characteristicsPollutant dispersion (exposure)Receptor vulnerabilityDegree of impact
MethodDowIndexQuestionnaireIndexQuestionnaire
Results3 of 5Results presented in Table 6AirWaterSoilResults presented in Table 9BiologicHuman-related
4.44.13.44.24.7
Publisher’s Note: MDPI stays neutral with regard to jurisdictional claims in published maps and institutional affiliations.