
Prediction of China’s Grain Consumption from the Perspective of Sustainable Development—Based on GM(1,1) Model


Abstract
:1. Introduction
2. Materials and Methods
2.1. Basic Principle of GM(1,1) Model
2.1.1. Modeling Conditions
2.1.2. Process the Original Sequence
2.1.3. Process the Newly Generated Sequence x(1)
2.1.4. Establish and Solve the Grey Differential Equation
2.2. Accuracy Tests on the Model

| Accuracy Grade | MAPE | C | P |
|---|---|---|---|
| 1 | 10%< | ≤0.35 | 0.95≤ |
| 2 | 10%~<20% | 0.35~≤0.5 | 0.8~<0.95 |
| 3 | 20%~<50% | 0.5~<0.65 | 0.7~≤0.8 |
| 4 | ≥% | ≥0.65 | ≤0.7 |
2.2.1. Residual Test
2.2.2. Posterior Error Test
2.2.3. Small Error Probability Test
3. Results
3.1. Data Description
| Year | Food Consumption | Feed Consumption | Industry Consumption | Seed Consumption | Squeezing Consumption |
|---|---|---|---|---|---|
| 2010 | 253.95 | 172.47 | 80.40 | 9.61 | 61.94 |
| 2011 | 254.12 | 175.95 | 83.36 | 9.89 | 65.67 |
| 2012 | 255.23 | 179.56 | 85.37 | 10.00 | 67.99 |
| 2013 | 256.49 | 179.61 | 86.99 | 10.08 | 70.81 |
| 2014 | 257.25 | 181.57 | 91.01 | 10.21 | 69.92 |
| 2015 | 258.25 | 187.36 | 94.25 | 10.40 | 71.37 |
| 2016 | 259.77 | 190.79 | 97.40 | 10.55 | 74.58 |
| 2017 | 261.36 | 193.73 | 99.58 | 10.92 | 75.12 |
| 2018 | 261.48 | 199.74 | 101.32 | 10.87 | 78.60 |
| 2019 | 262.12 | 204.57 | 101.23 | 10.91 | 80.45 |
| 2020 | 264.39 | 208.79 | 103.01 | 10.93 | 81.85 |
| 2021 | 264.44 | 218.36 | 104.71 | 11.03 | 83.20 |
3.2. Building and Application of the GM(1,1) Model of China’s Grain Consumption
3.2.1. Step Ratio Test on the Original Data before Modeling
3.2.2. Calculation of Model Parameters to Be Estimated
3.2.3. Accuracy Test on the GM(1,1) Model of China’s Grain Consumption
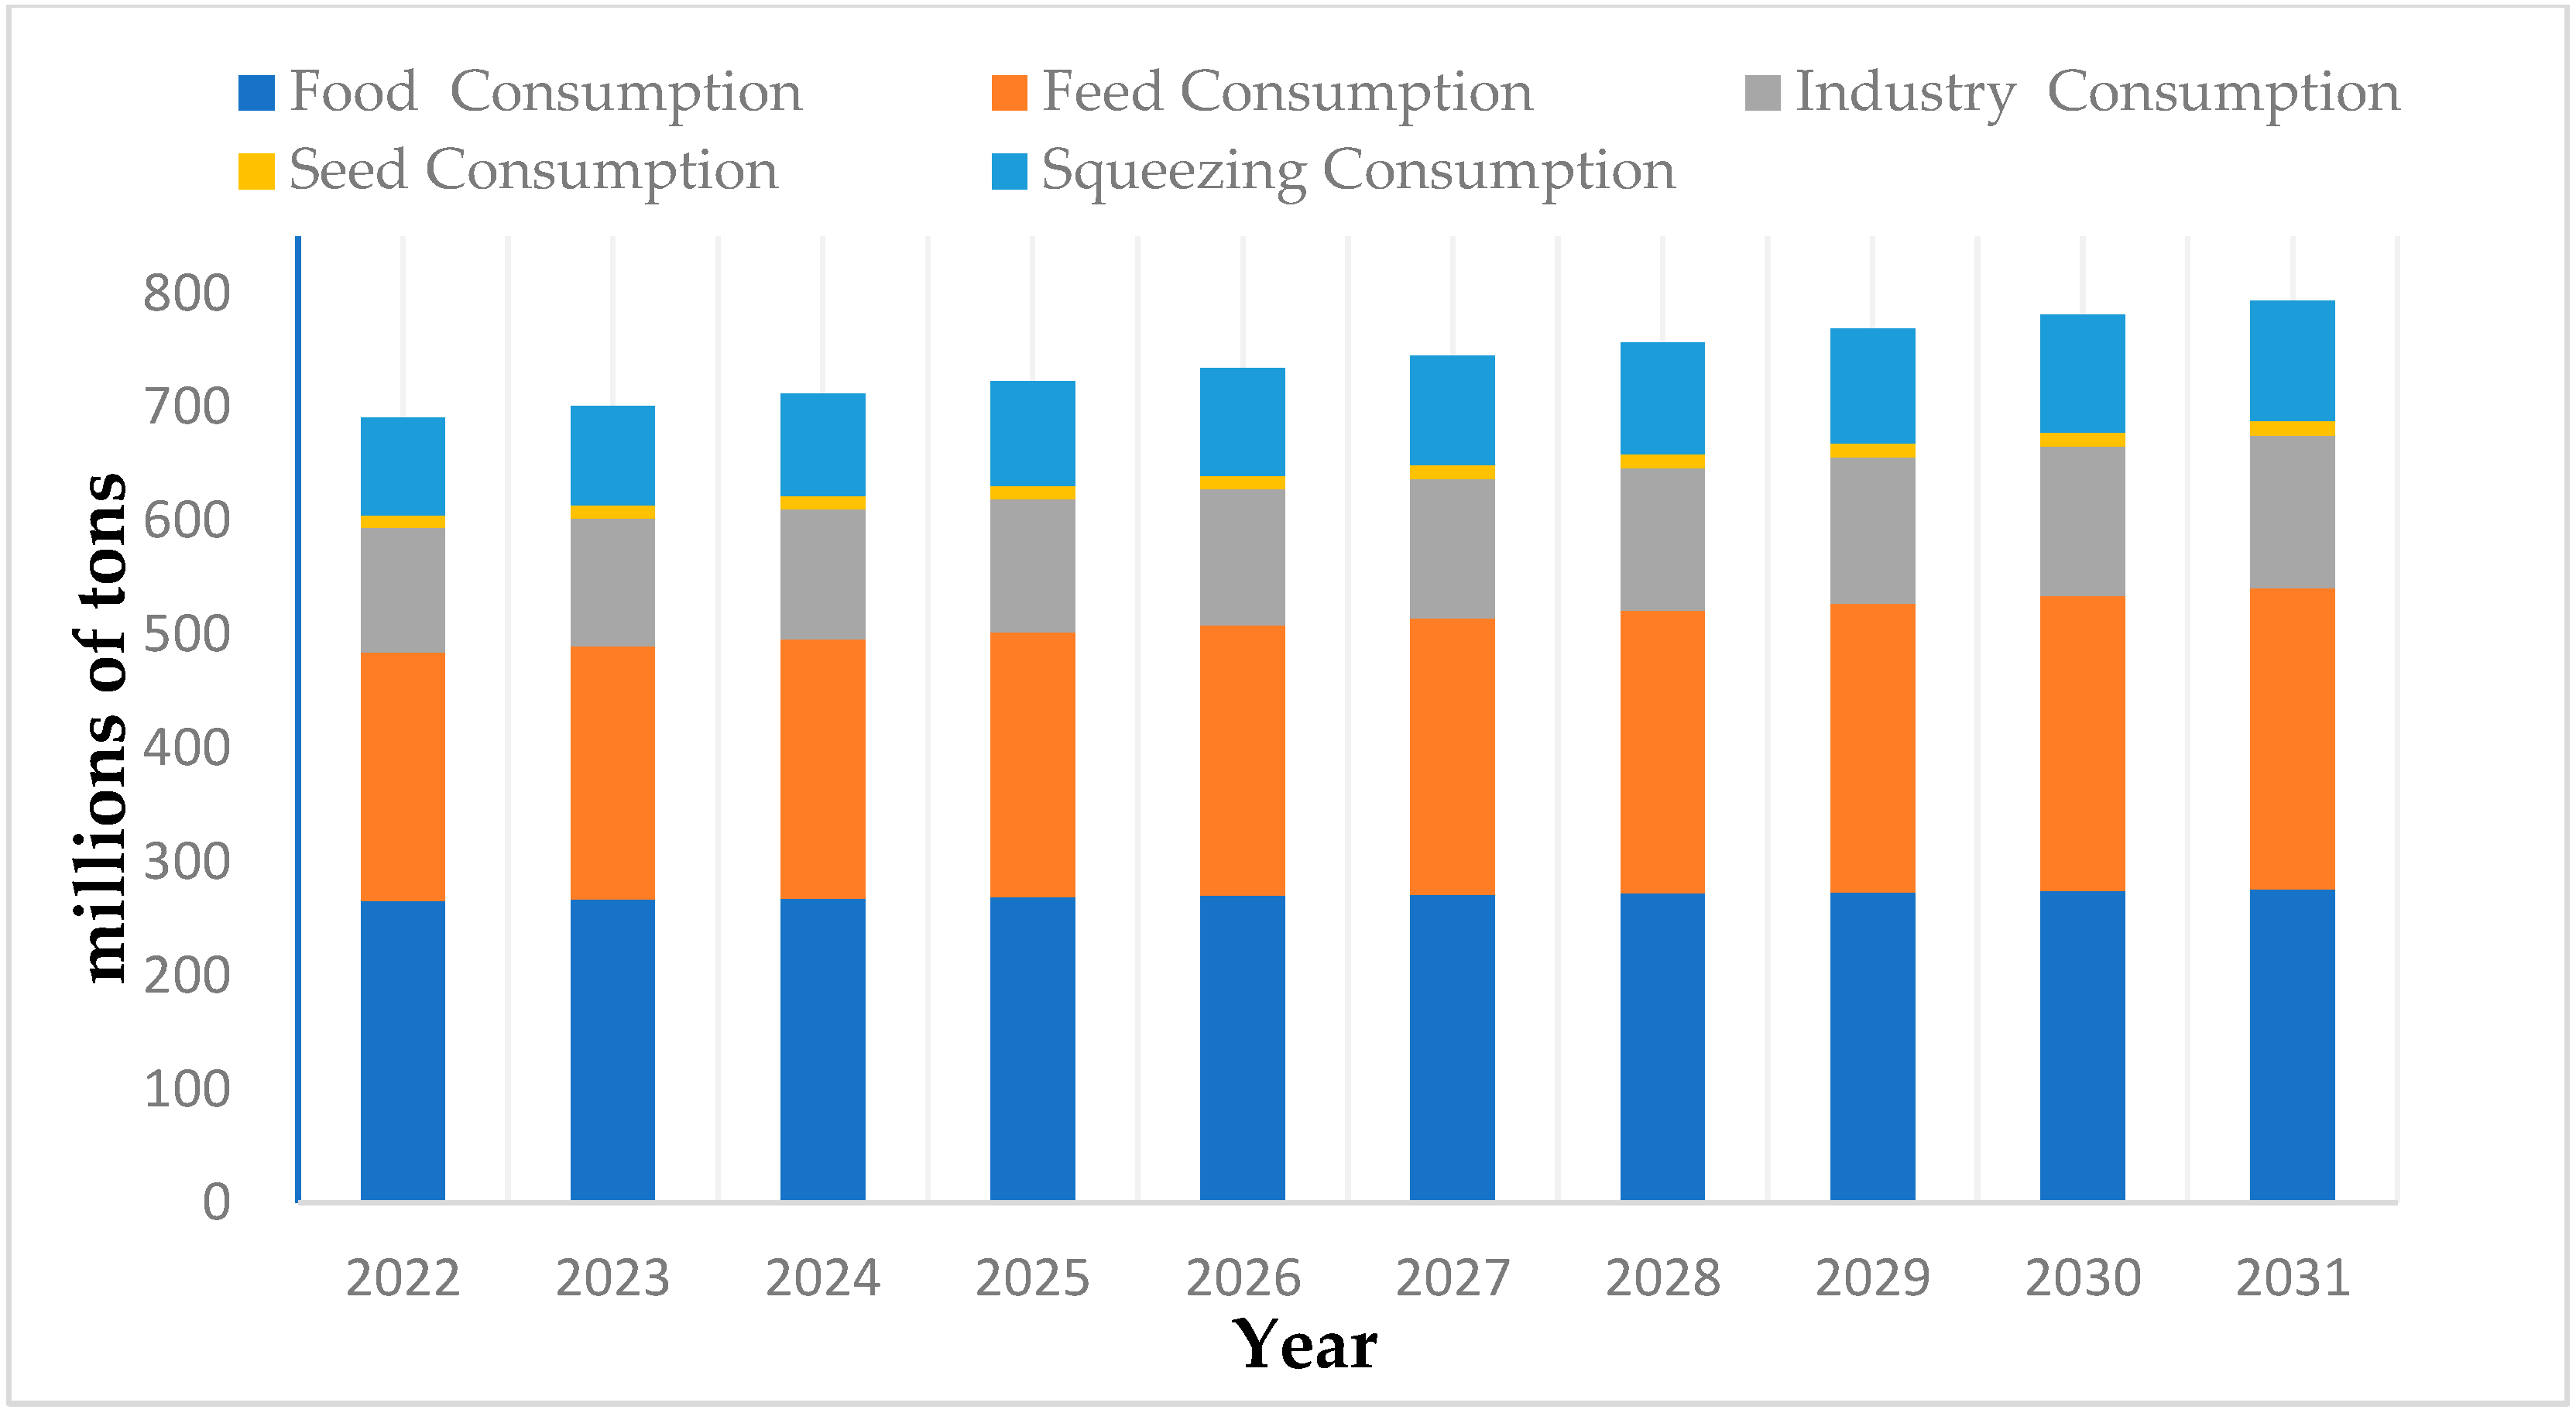
3.3. Prediction of China’s Grain Consumption
3.4. Discussion
4. Conclusions
Author Contributions
Funding
Institutional Review Board Statement
Informed Consent Statement
Data Availability Statement
Acknowledgments
Conflicts of Interest
References
- Cui, K.; Shoemaker, S.P. A look at food security in China. NPJ Sci. Food 2018, 4, 2–4. [Google Scholar] [CrossRef]
- Zhong, S.J. Research on the development path of China’s grain industry from the perspective of sustainable development. Rural Econ. 2022, 02, 28–29. [Google Scholar]
- Fukase, E.; Martin, W. Who Will Feed China in the 21st Century? Income Growth and Food Demand and Supply in China. J. Agric. Econ. 2016, 67, 1, 3–23. [Google Scholar] [CrossRef]
- Huang, J.K.; Wei, W.; Cui, Q.; Xie, W. The prospects for China’s food security and imports: Will China starve the world via imports? J. Integr. Agric. 2017, 16, 2933–2944. [Google Scholar] [CrossRef]
- Si, W.; Zhang, Y.M.; Fan, S.G. How to Ensure Food and Nutrition Security under the COVID—19 Epidemic: A Global Perspective. Issues Agric. Econ. 2020, 3, 11–16. [Google Scholar]
- Cheng, S.K.; Dong, J.C.; Liu, Z.Y.; Ren, Z.G.; Liu, X.L.; Liu, X.J.; Zong, G.; Li, X.T.; Deng, X.Z. Key Scientific Issues on National Nutrition and Food Security in China in the New Era: Summary of the 249th NSFC Shuangqing Forum. Bull. Natl. Nat. Sci. Found. China 2021, 35, 426–434. [Google Scholar]
- Liang, X.Y.; Jin, X.B.; Sun, R.; Han, B.; Ren, J.; Zhou, Y.K. China’s resilience-space for cultivated land protection under the restraint of multi-scenario food security bottom line. Acta Geogr. Sin. 2022, 77, 697–713. [Google Scholar]
- Xing, Y.; Dong, Y.; Yuan, J.X.; Zhang, B.; Yang, Y.P.; Zhang, W. Investigation of Scenario Analysis in Typical Agricultural. Libr. Inf. Serv. 2014, 58, 95–99. [Google Scholar]
- Mi, J.; Luo, Q.Y.; Gao, M.J. A review on food demand forecast methods. Chin. J. Agric. Resour. Reg. Planning. 2013, 34, 28–33. [Google Scholar]
- Liu, Y.; Luo, Q.Y.; Zhou, Z.Y.; You, F.; Gao, M.J.; Tang, Q. Analysis and Prediction of the Supply and Demand of China’s Major Agricultural Products. Strateg. Study CAE 2018, 20, 120–127. [Google Scholar] [CrossRef]
- Fan, S.G.; Long, W.J.; Feng, X.L.; Si, W.; Sheng, Y. The UN Food Systems Summit and Chinese Strategy. Issues Agric. Econ. 2022, 03, 4–16. [Google Scholar]
- Fan, S.G.; Zhang, Y.M.; Chen, K.Z. Antiglobalism and Global Food Security. Issues Agric. Econ. 2019, 3, 4–10. [Google Scholar]
- Chen, R.S.; Guo, X.N.; Xiong, B.; Wang, Y.; Chen, Q. Climate change, land degradation and food insecurity: Linkages and potential solutions. Acta Ecol. Sin. 2021, 41, 2918–2929. [Google Scholar]
- Brown, L.R. Who Will Feed China? Wake-Up Call for a Small Planet? World Watch Norton and CO: New York, NY, USA, 1995; pp. 1–163. [Google Scholar]
- Cheng, G.Q.; Chen, L.B. Long term trend of grain demand in China. China Rural Surv. 1998, 03, 3–8+13. [Google Scholar]
- Zhu, X.G. Analysis on the balance of grain supply and demand in China. Issues Agric. Econ. 2004, 12, 12–19. [Google Scholar]
- Lu, W.C.; Huang, Z.H. Future Prospects of Grain Supply and Demand in China: A Regionalized Multimarket Model Simulation. Econ. Res. J. 2004, 08, 94–104. [Google Scholar]
- Luo, Q.Y.; Mi, J.; Gao, M.J. Research on Forecasting for Long-term Grain Consumption Demands in China. Chin. J. Agric. Resour. Reg. Plan. 2014, 35, 1–7. [Google Scholar]
- Chen, K.; Bi, J.Y.; Nie, F.Y.; Fang, X.M.; Fan, S.G. New Vision and Policy Recommendations for Nutrition-Oriented Food Security in China. Sci. Agric. Sin. 2019, 52, 3097–3107. [Google Scholar]
- Gong, B.; Yin, F.Y. Measurement of the Impact of Urbanization on China’s Grain Consumption. Theory Pract. Financ. Econ. 2018, 39, 134–140. [Google Scholar]
- Zhang, X.Y.; Li, Z.M. GM(1,1) Model-based Sown Area Prediction of Minor Grains in China. Chin. J. Agric. Resour. Reg. Plan. 2018, 39, 81–86. [Google Scholar]
- Xu, Y.; Yang, Z.G. A Projection of Participation Rate of Basic Pension Insurance for Urban and Rural Residents Based on the Grey GM(1,1) Model. Insur. Stud. 2019, 4, 116–127. [Google Scholar]
- Lu, S.S.; Yu, J.S. Research on Shanghai Vegetable Yield Forecasting Based on Grey Mode GM(1,1). Chin. Agric. Sci. Bull. 2014, 30, 255–260. [Google Scholar]
- Ni, C. The application of the GM(1,1) model on the prediction of sustainable land use in Hulan District (County) of Harbin City. Territ. Nat. Resour. Study 2010, 1, 40–41. [Google Scholar]
- Sun, X.R.; Zhang, C. Analysis of population development trend in China based on GM(1,1) model. Stat. Decis. 2016, 23, 104–106. [Google Scholar]
- Dai, S.Y.; Niu, D.X.; Han, Y.R. Forecasting of Energy-Related CO2 Emissions in China Based on GM(1,1) and Least Squares Support Vector Machine Optimized by Modified Shuffled Frog Leaping Algorithm for Sustainability. Sustainability 2018, 10, 958. [Google Scholar] [CrossRef]
- Gao, X.C.; Shi, P.J.; Pan, J.H.; Lv, L.G. A Case Study of Tianshui City in Gansu: Plantation Preservation Quantity Research Based on Food Security and GM(1,1) Model. Syst. Sci. Compr. Stud. Agric. 2011, 27, 407–412. [Google Scholar]
- He, B.; Zhu, L.X. Grey System Theory GM(1,1) Model and Its Application to Tourism Industry Revenue Forecasting-Take Hainan Province as an Example. Torism Forum 2011, 4, 68–70, 102. [Google Scholar]
- Ma, N.S.; Zhi, X.J.; Song, Y.T. Evaluation and prediction of the cultivated land ecological security in Tibet based on PSR and GM(1,1) model. J. Arid Land Resour. Environ. 2018, 32, 81–86. [Google Scholar]
- Yu, S.; Dong, M. Sustainable development of China’s regions from the perspective of ecological welfare performance: Analysis based on GM(1,1) and the malmquist index. Environ. Dev. Sustain. 2022, 24, 1086–1115. [Google Scholar]
- Wang, C.N.; Hsu, H.P.; Wang, J.W.; Kao, Y.C.; Nguyen, T.P. Strategic Alliance for Vietnam Domestic Real Estate Companies Using a Hybrid Approach Combining GM(1,1) with Super SBM DEA. Sustainability 2020, 12, 1891. [Google Scholar] [CrossRef]
- Li, P.; Liu, J.; Wei, C.P. A Dynamic Decision Making Method Based on GM(1,1) Model with Pythagorean Fuzzy Numbers for Selecting Waste Disposal Enterprises. Sustainability 2019, 11, 5557. [Google Scholar] [CrossRef]
- Tang, T.; Jiang, W.H.; Zhang, H.; Nie, J.T.; Xiong, Z.H.; Wu, X.G.; Feng, W.J. GM(1,1) based improved seasonal index model for monthly electricity consumption forecasting. Environ. Dev. Sustain. 2022, 24, 1086–1115. [Google Scholar] [CrossRef]
- Lv, L.G.; Shi, P.J.; Pan, J.H.; Zeng, C.P. Plantation Preservation Quantity Research Based on Food Security and GM(1,1) Model-A Case Study of Tianshui City in Gansu. Syst. Sci. Compr. Stud. Agric. 2010, 26, 91–96. [Google Scholar]
- Tian, S.L.; Lu, L.J. Big data gray system GM(1,1) model application for coal research and development strategies in Jilin. Geol. Bull. China 2015, 34, 1369–1374. [Google Scholar]
- Ran, Q.H.; Yue, Y.H.; Luo, H.Y.; Xie, D.T.; Wei, C.F. The Model of Grain Demand-Supply Based on Population Curve Fit and GM(1,1) and Empirical Analysis. J. Southwest China Norm. Univ. (Nat. Sci. Ed.) 2009, 34, 115–121. [Google Scholar]
- Market Early Warning Expert Committee of Ministry of Agriculture and Rural Affairs. China Agricultural Outlook (2022–2031); China Agricultural Science and Technology Press: Beijing, China, 2022; pp. 1–172.
- Chen, Y.; Lu, C. Future Grain Consumption Trends and Implications on Grain Security in China. Sustainability 2019, 11, 5165. [Google Scholar] [CrossRef]
- Lu, W.-C.; Chen, N.-L.; Qian, W.-X. Modeling the effects of urbanization on grain production and consumption in China. J. Integr. Agric. 2017, 16, 1393–1405. [Google Scholar] [CrossRef] [Green Version]
- Chinese Academy of Agricultural Sciences. China Agricultural Sector Development Report; China Agricultural Science and Technology Press: Beijing, China, 2021. [Google Scholar]
- OECD/FAO. OECD-FAO Agricultural Outlook 2022–2031; OECD Publishing: Paris, France, 2022. [Google Scholar] [CrossRef]
- Yang, Y.; He, D.F.; Tong, H.F.; Wang, J.Y.; Qu, W.S.; Li, Y.Y. Demand and Supply of Chinese Cereal Based on T21 China Model. China Soft Sci. 2013, 12, 32–44. [Google Scholar]
| Parameter | Food Consumption | Feed Consumption | Industry Consumption | Seed Consumption | Squeezing Consumption |
|---|---|---|---|---|---|
| −a | −0.004086 | −0.021280 | −0.023196 | −0.011815 | −0.023611 |
| b | 252.709050 | 167.365463 | 81.789879 | 9.743553 | 63.782232 |
| Year | Food Consumption | Feed Consumption | Industry Consumption | Seed Consumption | Squeezing Consumption | |||||
|---|---|---|---|---|---|---|---|---|---|---|
| OV | PV | OV | PV | OV | PV | OV | PV | OV | PV | |
| 2010 | 253.95 | 253.95 | 172.47 | 172.47 | 80.40 | 80.40 | 9.61 | 9.61 | 61.94 | 61.94 |
| 2011 | 254.12 | 254.27 | 175.95 | 172.87 | 83.36 | 84.63 | 9.89 | 9.92 | 65.67 | 66.02 |
| 2012 | 255.23 | 255.31 | 179.56 | 176.59 | 85.37 | 86.62 | 10.00 | 10.03 | 67.99 | 67.60 |
| 2013 | 256.49 | 256.35 | 179.61 | 180.38 | 86.99 | 88.65 | 10.08 | 10.15 | 70.81 | 69.21 |
| 2014 | 257.25 | 257.40 | 181.57 | 184.26 | 91.01 | 90.73 | 10.21 | 10.27 | 69.92 | 70.87 |
| 2015 | 258.25 | 258.46 | 187.36 | 188.23 | 94.25 | 92.86 | 10.40 | 10.40 | 71.37 | 72.56 |
| 2016 | 259.77 | 259.51 | 190.79 | 192.28 | 97.40 | 95.04 | 10.55 | 10.52 | 74.58 | 74.29 |
| 2017 | 261.36 | 260.58 | 193.73 | 196.41 | 99.58 | 97.27 | 10.92 | 10.64 | 75.12 | 76.07 |
| 2018 | 261.48 | 261.64 | 199.74 | 200.64 | 101.32 | 99.55 | 10.87 | 10.77 | 78.60 | 77.89 |
| 2019 | 262.12 | 262.72 | 204.57 | 204.95 | 101.23 | 101.89 | 10.91 | 10.90 | 80.45 | 79.75 |
| 2020 | 264.39 | 263.79 | 208.79 | 209.36 | 103.01 | 104.28 | 10.93 | 11.03 | 81.85 | 81.65 |
| 2021 | 264.44 | 264.87 | 218.36 | 213.86 | 104.71 | 106.73 | 11.03 | 11.16 | 83.20 | 83.60 |
| Accuracy Assessment | Food Consumption | Feed Consumption | Industry Consumption | Seed Consumption | Squeezing Consumption |
|---|---|---|---|---|---|
| MAPE | 0.12% | 0.99% | 1.54% | 0.72% | 0.96% |
| C | 0.11 | 0.16 | 0.19 | 0.23 | 0.12 |
| P | 1.00 | 1.00 | 1.00 | 1.00 | 1.00 |
| Year | Food Consumption | Feed Consumption | Industry Consumption | Seed Consumption | Squeezing Consumption |
|---|---|---|---|---|---|
| 2022 | 265.96 | 218.46 | 109.23 | 11.29 | 85.6 |
| 2023 | 267.04 | 223.16 | 111.8 | 11.43 | 87.65 |
| 2024 | 268.14 | 227.96 | 114.42 | 11.56 | 89.74 |
| 2025 | 269.24 | 232.86 | 117.1 | 11.7 | 91.88 |
| 2026 | 270.34 | 237.87 | 119.85 | 11.84 | 94.08 |
| 2027 | 271.45 | 242.99 | 122.67 | 11.98 | 96.33 |
| 2028 | 272.56 | 248.21 | 125.54 | 12.12 | 98.63 |
| 2029 | 273.67 | 253.55 | 128.48 | 12.27 | 100.98 |
| 2030 | 274.79 | 259.01 | 131.51 | 12.41 | 103.4 |
| 2031 | 275.92 | 264.58 | 134.59 | 12.56 | 105.87 |
Publisher’s Note: MDPI stays neutral with regard to jurisdictional claims in published maps and institutional affiliations. |
© 2022 by the authors. Licensee MDPI, Basel, Switzerland. This article is an open access article distributed under the terms and conditions of the Creative Commons Attribution (CC BY) license (https://creativecommons.org/licenses/by/4.0/).
Share and Cite
Zhang, X.; Bao, J.; Xu, S.; Wang, Y.; Wang, S. Prediction of China’s Grain Consumption from the Perspective of Sustainable Development—Based on GM(1,1) Model. Sustainability 2022, 14, 10792. https://doi.org/10.3390/su141710792
Zhang X, Bao J, Xu S, Wang Y, Wang S. Prediction of China’s Grain Consumption from the Perspective of Sustainable Development—Based on GM(1,1) Model. Sustainability. 2022; 14(17):10792. https://doi.org/10.3390/su141710792
Chicago/Turabian StyleZhang, Xiaoyun, Jie Bao, Shiwei Xu, Yu Wang, and Shengwei Wang. 2022. "Prediction of China’s Grain Consumption from the Perspective of Sustainable Development—Based on GM(1,1) Model" Sustainability 14, no. 17: 10792. https://doi.org/10.3390/su141710792
APA StyleZhang, X., Bao, J., Xu, S., Wang, Y., & Wang, S. (2022). Prediction of China’s Grain Consumption from the Perspective of Sustainable Development—Based on GM(1,1) Model. Sustainability, 14(17), 10792. https://doi.org/10.3390/su141710792