Article

Adsorption of Copper and Lead Ions in a Binary System onto Orange Peels: Optimization, Equilibrium, and Kinetic Study

by
Felicia Omolara Afolabi
1,2,*,
Paul Musonge
2,3 and
Babatunde Femi Bakare
4
1
Department of Chemical Engineering, Durban University of Technology, Durban 4001, South Africa
2
Institute of Systems Science, Durban University of Technology, Durban 4001, South Africa
3
Faculty of Engineering, Mangosuthu University of Technology, Durban 4031, South Africa
4
Department of Chemical Engineering, Mangosuthu University of Technology, Durban 4031, South Africa
*
Author to whom correspondence should be addressed.
Sustainability 2022, 14(17), 10860; https://doi.org/10.3390/su141710860
Submission received: 30 July 2022 / Revised: 27 August 2022 / Accepted: 28 August 2022 / Published: 31 August 2022
(This article belongs to the Special Issue Sustainability in Water and Wastewater Treatment Technologies)

Abstract

:
Agricultural waste materials have been proven to be efficient for heavy metal sequestration from wastewater. In this paper, the interactive effects of initial concentration, adsorbent dosage, and particle size on the removal of copper and lead ions in a binary system onto orange peels were investigated using a central composite design. The pHpzc of orange peels was determined to be 3.85. The Fourier transform infrared (FTIR) and energy dispersive x-ray (EDX) revealed the functional groups and elemental composition present on the surface of the bio-sorbent, respectively, before and after adsorption. The ANOVA showed a good fit with a coefficient of determination (R2) of 0.973 and 0.993 for Cu and Pb, respectively. The bio-sorption of Cu and Pb increased with increasing adsorbent dosage while the percentage removal of Pb was consistently higher than Cu. The highest percentage removal of Cu and Pb gave 86.27% and 98.85%, respectively. The kinetic and isotherm studies showed that pseudo-second-order and Langmuir isotherm models fitted the experimental data suggesting chemisorption and monolayer adsorption, respectively. The treatment of wastewater is very essential to avoid water scarcity and to achieve the Sustainable Development Goals (SDGs). This study demonstrates the potential of utilizing orange peels as bio-sorbent for the treatment of wastewater containing Cu and Pb ions.

1. Introduction

Copper and lead are toxic elements for plant, animal, and human health. These metals are major contaminants in drinking water. They are released into water bodies both naturally and via anthropogenic sources, such as herbicides in agriculture, mining, and industrial activities, which are the major causes of surface and groundwater pollution [1]. The remediation of metal-contaminated wastewater generated from anthropological activities needs adequate management actions from designated authorities; however, mitigation technologies are required to control the natural sources of copper and lead. Lead is a carcinogen while copper is not; however, long-term exposure to copper can be very severe and chronic. These toxic metals can cause health problems in humans when ingested, such as skin diseases, nausea, vomiting, diarrhea, and abdominal disorders. Thus, the removal of these metal ions from wastewater is a serious concern for environmental sustainability and human health. The World Health Organization (WHO) and the European Union (EU) have set the permissible limit for copper and lead in drinking water at 2 and 0.01 ppm, respectively [2]. In addition, the South African National Standard (SANS) has set the maximum limit for copper and lead in wastewater as 1 mg/L [3,4].
The conventional methods used for the removal of toxic metal ions from wastewater include ion exchange, coagulation, precipitation, electrochemical, membrane separation, and so on. Among these techniques, adsorption has been proven to be more effective due to its ease of operation, low cost, and simple design [5]. Recently, researchers have focused on the use of agricultural wastes as adsorbents for the removal of heavy metals from wastewater. These agricultural wastes, also referred to as green adsorbents, are readily available, cheap, and eco-friendly. These wastes include shells, hulls, and peels from fruits and nuts, sawdust, corncob waste, sunflower stalks, and straw [6]. The bio-sorption process depends on the metal and the properties of the biomass surface. Many researchers have reported the functional groups present on the surface of bio-sorbents and how it affects the adsorption mechanism.
Citrus is the largest fruit in the world with an annual production of more than 124.3 million tons worldwide. After consumption, about 40–60% of the fruit is discarded as unwanted waste. Yearly, 110–120 million tons of citrus waste are generated from citrus processing industries worldwide, which creates serious environmental challenges [7]. Presently, a huge amount of the waste is not utilized nor processed but consumed by animals as feed materials or dumped on sites. The citrus waste contains cellulose and hemicellulose with functional groups that enhance the adsorption of heavy metal ions from wastewater. Hence, the utilization of citrus waste as adsorbents will ensure environmental sustainability, which is one of the sustainable development goals. Citrus waste is, therefore, an inexpensive and sustainable resource biomaterial for laboratory and industrial research. This study is focused on the removal of copper and lead ions in the binary system from wastewater using orange peels by applying the central composite design (CCD) method.
Many physical and chemical factors affect the adsorption process of heavy metals from wastewater, which are pH, initial metal ion concentration, temperature, adsorbent dosage, particle size, etc. These factors control the overall performance of a bio-sorption process. Many studies have reported on the effect of different operating parameters on the bio-sorption of heavy metal ions; however, many of the studies have investigated one factor at a time (OFAT). This method wastes time and materials. In addition, many studies have focused on a single solute system; however, it is very rare for wastewater to contain a single metal ion. Even though many studies have been reported on the application of CCD in the field of environmental pollution, the interactive effect of different operating parameters in the binary solute system using CCD is an area of interest. In this study, the CCD was used to study the interactive effect of the operating parameters, such as initial metal ion concentration, adsorbent dosage, and particle size, on the percentage removal of copper and lead in a binary solute system.
In addition, the isotherm and kinetic studies were conducted to determine the adsorption mechanism and the rate of the adsorption process. For an industrial wastewater treatment plant, the rate of adsorption and the sorption efficiency must be investigated. This helps to determine the size of the column for industrial scale. A small column is required for a fast adsorption kinetic while a column with good height is necessary for a slow sorption kinetic. The equilibrium and kinetic parameters were determined using isotherm models (Langmuir and Freundlich) and kinetic models (pseudo-first order and pseudo-second order).

2. Materials and Methods

2.1. Preparation of Bio-Sorbent and Characterization

Ripened orange peels were collected from a local market in Durban, South Africa. The preparation processes were carried out as discussed by [8]. The Fourier transform infrared spectroscopy (FTIR) (Perkin Elmer, Frontier, Waltham, MA, USA) was used to determine the functional groups present on the surface of the bio-sorbent before and after adsorption. The surface morphology of the bio-sorbent before and after adsorption was determined using a scanning electron microscope (SEM) (FEI Nova NanoSEM 230, Lausanne, Switzerland) supported by energy-dispersive X-ray spectroscopy (EDS) (Oxford X-Max detector, Oxford, UK and INCA software v7.3, Stuttgart, Germany).

2.2. Preparation of the Synthetic Solution

A 1000 mg/L solution containing a mixture of copper and lead was prepared in a volumetric flask by dissolving 3.8 g of Cu(NO3)2.3H2O and 1.6 g PbNO3 in distilled water. The chemicals were of analytical grade and purchased from Laboratory Analytical Supplies Limited, South Africa. The desired concentration needed for each experimental run was obtained from the prepared stock solution by dilution. A digital pH meter (edge pH HI 2002) was used to determine the pH value of the solution while 0.1 M H2SO4 or 0.1 M NaOH was added in drops to obtain the desired pH value.

2.3. Batch Adsorption Studies

The batch experiments were conducted at room temperature. All experiments were carried out using a 250 mL conical flask containing a 100 mL mixed solution of copper and lead nitrate ions with varying initial concentrations (10–100 mg/L). The adsorbent dosage and the particle size also varied from 0.1–1 g and 75–455 μm, respectively. The pH of the solution was maintained at 5, which is the optimum pH obtained for the single solution systems [8]. The solution mixing was achieved using a linear shaker (Orbital shaker 262, Johannesburg, South Africa) with an agitation speed of 180 rpm and contact time of 120 min. After adsorption, the supernatant portion of the solution was filtered using Whatman filter paper and syringe filters of 0.45 μm. Thereafter, the samples were analyzed using a micro-plasma atomic emission spectrophotometer (MP-AES, MY 18379001, Agilent, Santa Clara, CA, USA). The percentage removal of the metal ions in the solution and the quantities of metal ions adsorbed onto orange peels were calculated using Equations (1) and (2), respectively.
%   R e m o v a l = C 0 C e C 0 × 100    
q t = C 0 C e m V
where C 0 and C e are the initial and final concentration (mg/L), respectively, q t is the amount of metal ion adsorbed (mg/g), m and V are the mass of the adsorbent (g), and the volume of the solution (mL), respectively.

2.4. Bio-Sorption Equilibrium

Adsorption isotherm study is one of the methods of comparing the amount of metal ion adsorbed during the adsorption process. Langmuir and Freundlich isotherm models are suitable for predicting the experimental equilibrium parameters of a bio-sorption process and these models are mostly used by researchers [9]. The isotherm experiments were conducted at a pH of 5 while 0.5 g of orange peels bio-sorbent was added in the solution containing Cu and Pb with an initial concentration of 10, 25, 50, 60, 80, 100, 125, 150, and 200 mg/L. All the isotherm experiments were conducted in triplicate, and the average of the values was reported.

2.4.1. Langmuir Isotherm

The Langmuir isotherm model assumes that the surface of the bio-sorbent is homogenous, and bio-sorption occurs in a single surface layer. The bio-sorption process is uniform, and the active sites are equal [10]. The model equation is expressed in Equation (3).
q e = q m a x b C e 1 + b C e              
where q e is the quantity of metal ions adsorbed at equilibrium,   q m a x is the bio-sorption capacity (mg/g), and b is the Langmuir isotherm constant (L/mg). The dimensionless factor R L expression is presented in Equation (4). The value of R L is used to determine whether the bio-sorption process is favorable (0 < R L < 1), unfavorable ( R L > 1), or irreversible ( R L = 0) [11].
R L = 1 1 + b C 0

2.4.2. Freundlich Isotherm

The Freundlich isotherm assumes the surface of the bio-sorbent is heterogeneous and the surface-active site energy of the bio-sorbent is different [12]. The Freundlich isotherm is presented in Equation (5).
q e = K f C e 1 / n
where K f (mg/g) and n are the Freundlich constants. The value of n suggests the bio-sorption condition. The value n < 1 means the bio-sorption process is unfavorable, n > 1 means the bio-sorption process is favorable, and n = 1 indicates the bio-sorption process is linear [13].

2.5. Adsorption Kinetic Studies

The adsorption kinetic study explains the adsorption reaction with time at the solid-solution interface. The kinetic studies were conducted with an initial concentration (10, 55, and 100 mg/L) of solution containing Cu and Pb with an adsorbent dosage of 1 g. The samples were taken at an interval of 0.25, 0.5, 1, 2, 3, 4, 5, 6, and 24 h. The two most popular adsorption kinetic models, pseudo-first-order and pseudo-second-order models, are used in this study. The pseudo-first-order model expression is given below:
log q e q t = log q e K 1 2.303 t        
The pseudo-second-order model is expressed as follows:
t q t = 1 K 2 q e 2 + t q e        
where q e and q t (mg/g) are the quantity of metal ions adsorbed at equilibrium and at any time t. K 1 and K 2 are the pseudo-first-order (min−1) and pseudo-second-order (g mg−1 min−1) rate constant, respectively, and t is the contact time (min).

2.6. Central Composite Design (CCD)

The design expert software (V.11.0.5.0, Stat-Ease Inc., Minneapolis, MA, USA) was used to generate the statistical design of the experimental runs. The experimental design was performed using face-centered CCD adapted from the RSM using three factors at three levels (−1, 0, +1) and six center points or replicate runs for the operating parameters. The three operating parameters selected for the bio-sorption of Cu2+ and Pb2+ ions in binary solute system onto orange peels are initial metal ion concentration, adsorbent dosage, and particle size at specified factor levels (Table 1). The CCD generated a total of 20 experimental runs with six replicates using a face-centered design. In the optimization study, the second-order polynomial equation was used to explain the interactive effects of the independent variables. The quadratic model used to optimize the process variables is shown below.
Y = β o + i = 1 k β i X i + i = 1 k β i i X i 2 + i = 1 j = i + 1 β i j X i X j + Ɛ  
where Y is the predicted response; Xi and Xj are the independent variables; βo, βi, βii, and βij are the regression coefficients; and Ɛ is the residual error. The interpretation of the experimental results and the significant variables are explained using mathematical functions called the analysis of variance (ANOVA).

3. Results and Discussion

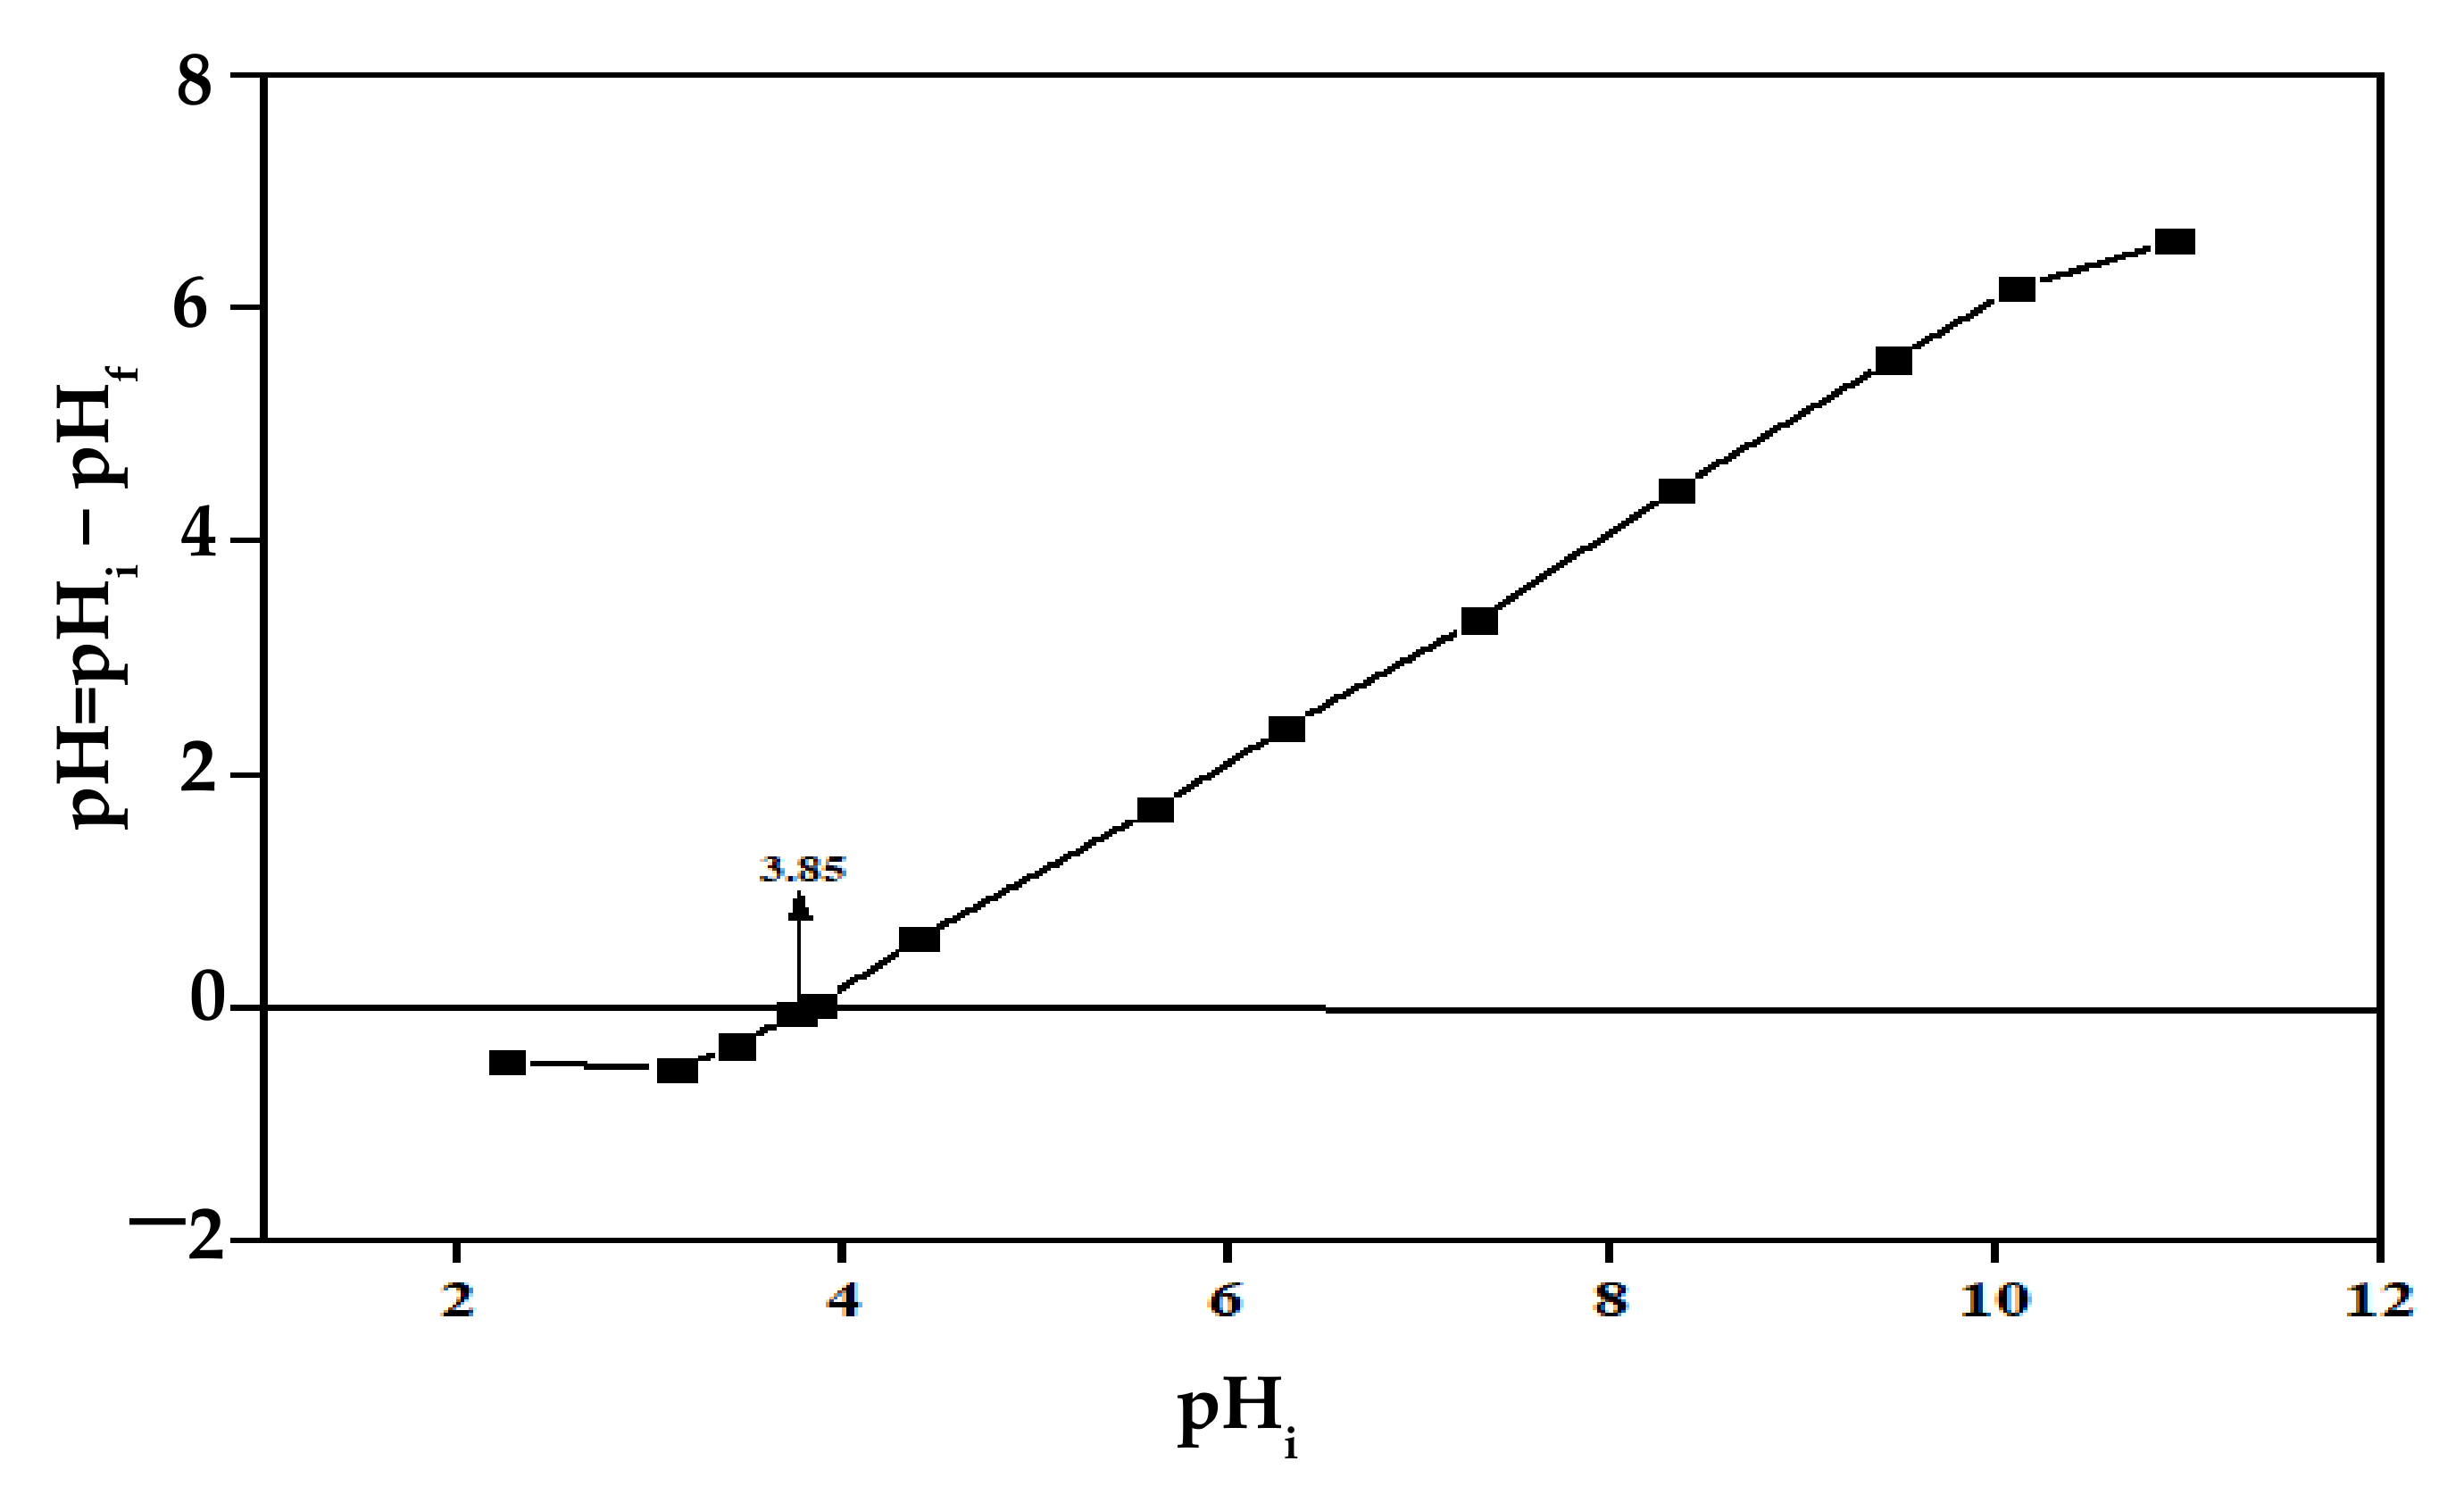
3.1. Point of Zero Charges of Orange Peels (pHpzc)

The point of zero charges (pHpzc) is a surface property usually investigated to determine the potential of a bio-sorbent for the removal of metal ions from an aqueous solution. The point of zero charges of an adsorbent is the point at which the surface of the adsorbent has zero net charges [14]. The pHpzc of an adsorbent gives insight into the ionization potential and the interactive effect between the adsorbent surface and the adsorbate. When the pHpzc is less than the solution pH, adsorption of cations is favored, and when the pHpzc is greater than the solution pH, the adsorption of anions is favored. In Figure 1, the pHpzc of natural orange peels gave 3.85. This means that the surfaces of orange peels are acidic and, therefore, favor the adsorption of cations.

3.2. Characterization of Bio-Sorbent

3.2.1. FTIR Spectroscopy Analysis

The FTIR spectrum is used to identify the functional groups present on the surface of an adsorbent. Adsorption is a physical phenomenon that involves the interaction between the functional groups on the surface of a bio-sorbent and the metal ions in an aqueous solution. These functional groups provide active sites for the adsorption of the metal ions on the surface of the adsorbent. The FTIR spectra represented in Figure 2 show the functional groups present on the surface of orange peels before adsorption. The FTIR of natural orange peels were obtained within the range of 500 to 4000 cm−1 wavenumber.
The spectra of orange peels before and after adsorption show the presence of a broad peak at 3382.62 cm−1, which indicates the presence of an intermolecular bonded O–H group consisting of alcohols and phenols. The peaks at 2918.92 cm−1, 2850.97 cm−1, 1441.94 cm−1, 1374.74 cm−1, and 887.26 cm−1 indicate the presence of a saturated C–H substitution bond, which can be likened to alkanes that are available in the pulp. The peaks at 1734.38 cm−1 and 1607.04 cm−1 reveal the presence of the carboxylic C=O bond and the unsaturated C=C bond, respectively, which are attributed to aldehydes and ketones. The existence of a high quantity of hydroxyl and carboxyl groups on the surface of the bio-sorbent suggests the tendency of orange peels to adsorb positively charged metal ions. The presence of these functional groups plays an important role in the bio-sorption of heavy metals through ion exchange, which occurs as a result of the affinity of metal ions to the functional groups.
A comparison of FTIR spectra of orange peels before and after adsorption is represented in Figure 2. All four patterns look similar, which suggests that the same functional groups are present on the surface of the bio-sorbent before and after adsorption. However, there are significant shifts in the peaks and intensities of the spectrum. These shifts are attributed to the interaction between the functional groups present on the surface of the bio-sorbent and the copper and lead ions in the solution. The significant shift occurred after adsorption in the peaks representing the O–H and C–O–H stretching, which are peculiar to the adsorption of both copper and lead. This shows that hydroxyl and carboxyl groups played a major role in the adsorption of copper and lead.

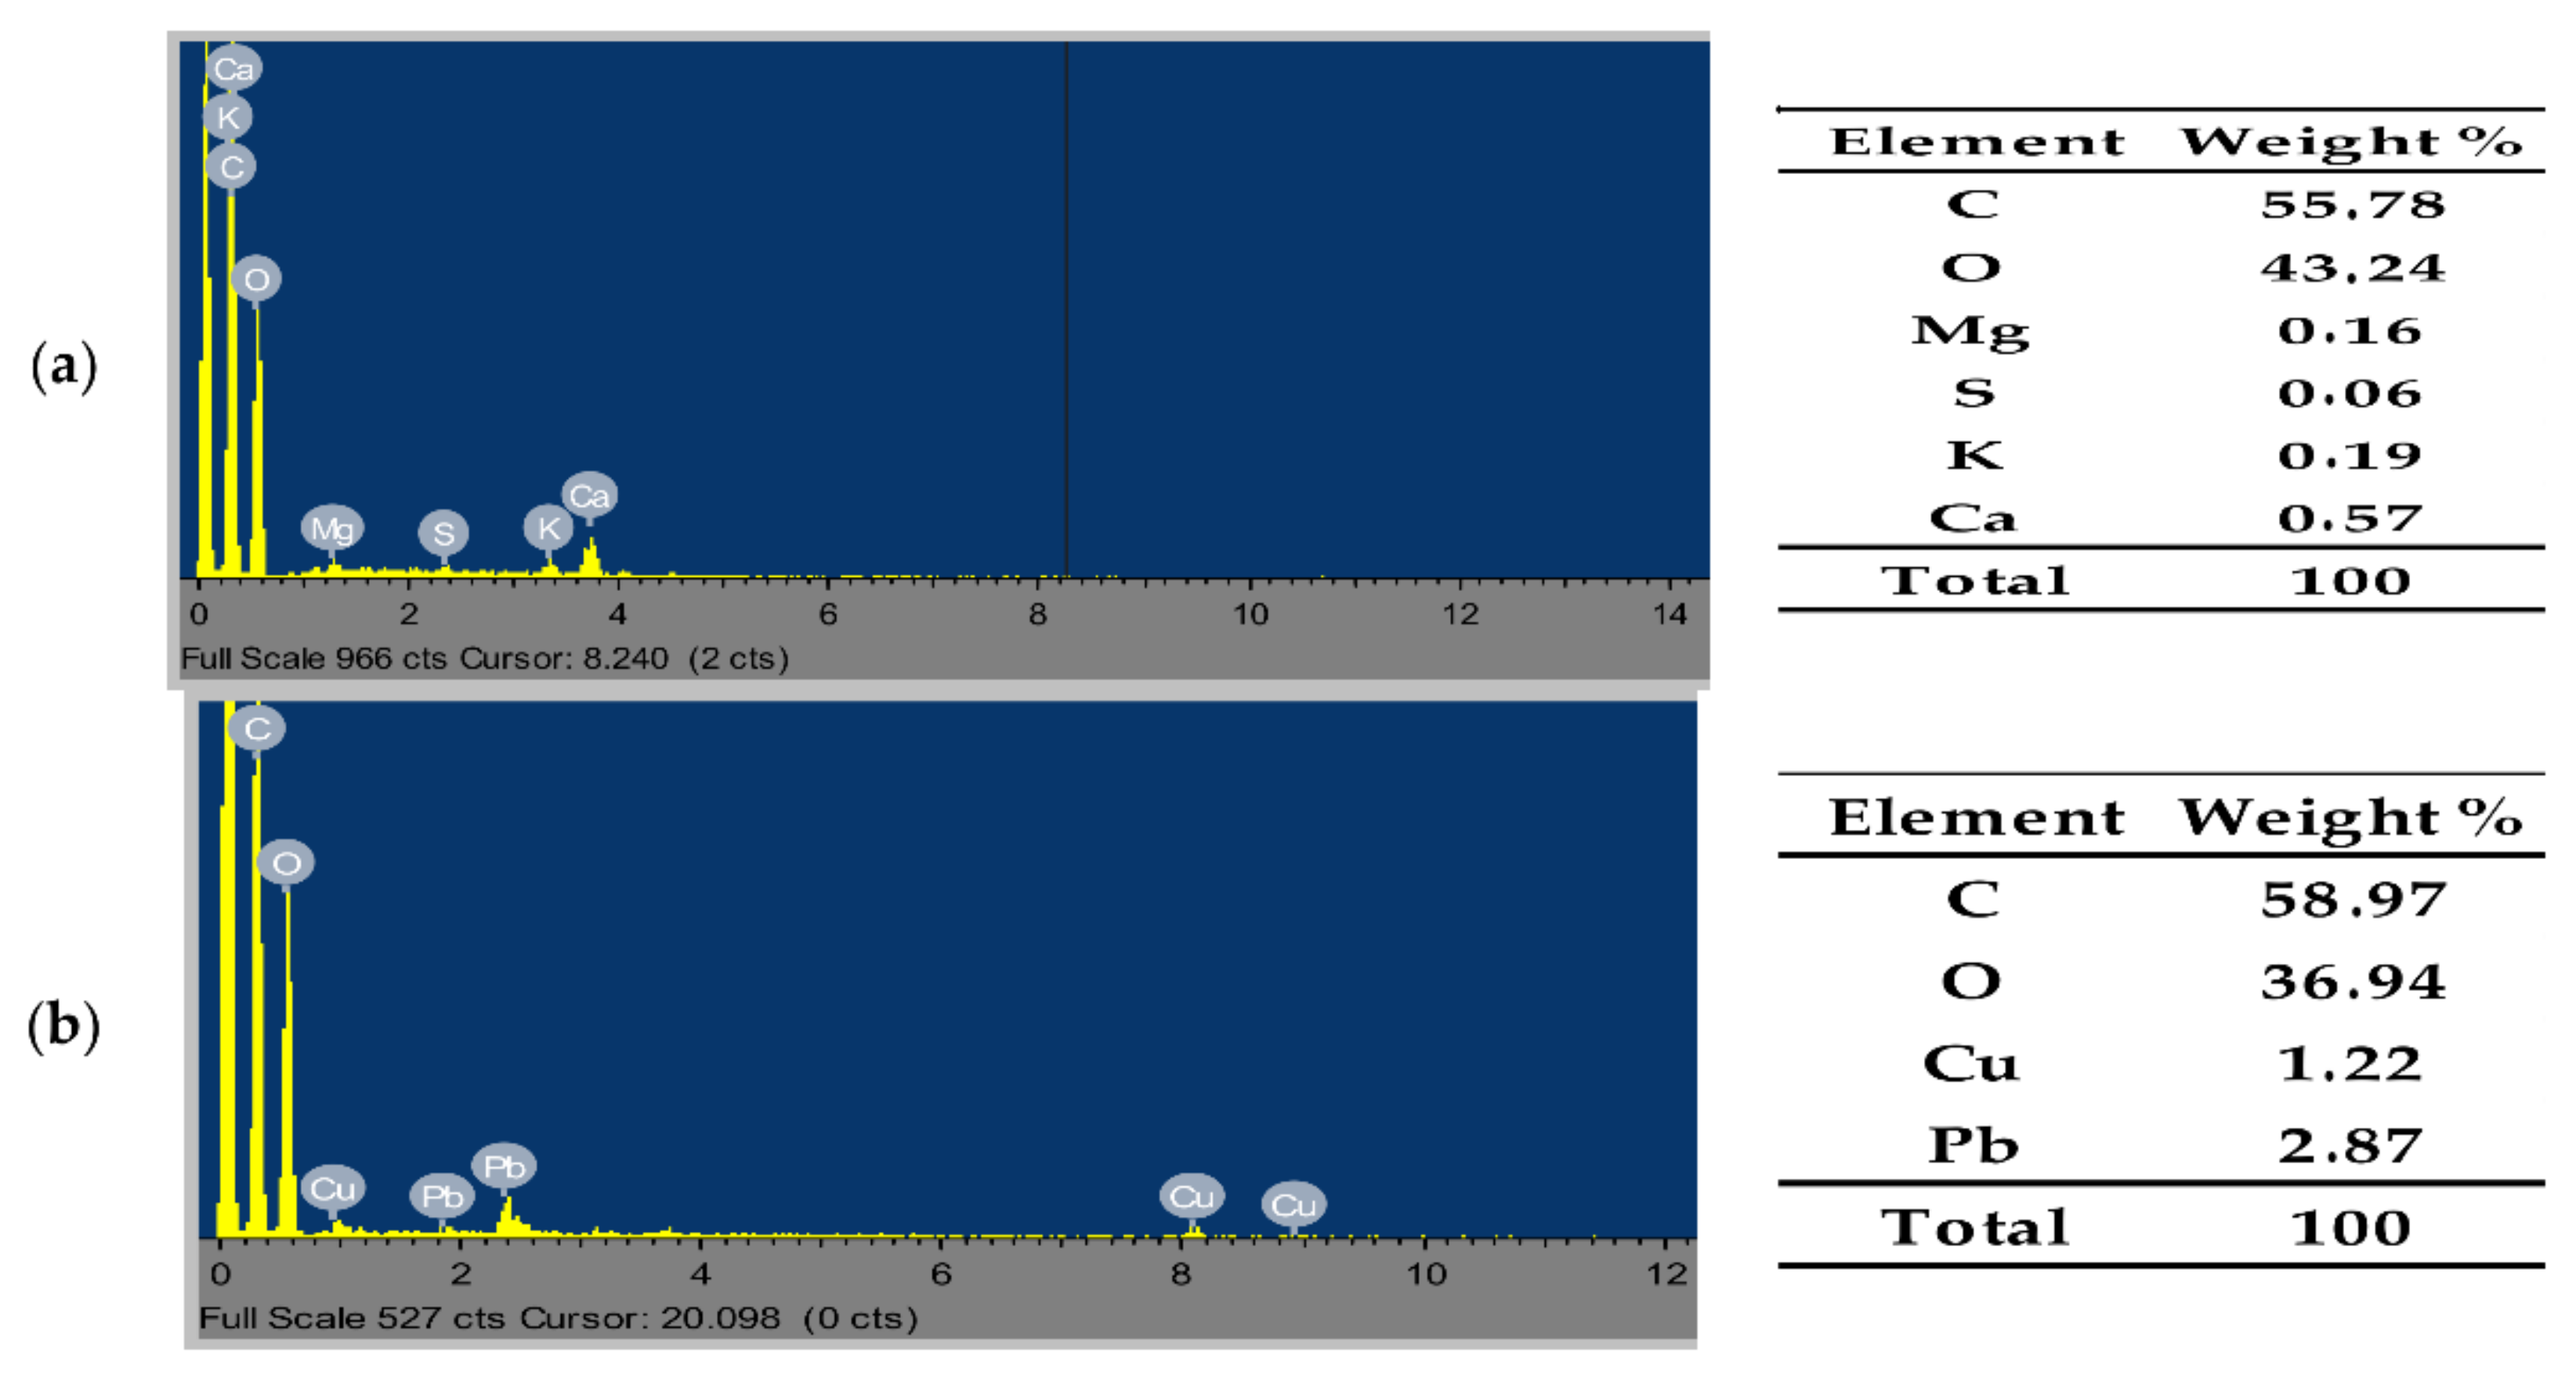
3.2.2. Scanning Electron Microscope-Energy Dispersive X-ray (SEM-EDX)

The SEM analysis of orange peels before and after adsorption of Cu and Pb was carried out to determine the morphological structure of the bio-sorbent (Figure 3a,b). The surface of the bio-sorbent prior to the adsorption process revealed an uneven and highly irregular surface. Additionally, sharp and coarse particles with varying shapes and sizes can be seen deposited randomly on the surface of the bio-sorbent. After adsorption of Cu and Pb ions, a highly significant change can be observed on the surface structure of the bio-sorbent. The surface structure of orange peel bio-sorbent loaded with Cu and Pb ions in a binary system appeared rough with little deposit of irregular particles distributed on the surface. In addition, the surface appeared shiny, which suggests physicochemical interactive effects of the metal ions with the functional groups present on the surface of the bio-sorbent.
The SEM results were supported by an EDX analysis of orange peel bio-sorbent before and after adsorption as shown in Figure 4a,b, respectively. Figure 4a reveals the chemical composition of orange peel bio-sorbent on a percent weight basis; the surface indicated the presence of carbon (C, 55.78%), oxygen (O, 43.24%), magnesium (Mg, 0.16%), sulphur (S, 0.06%), potassium (K, 0.19%), and calcium (Ca, 0.57%). The EDX spectra of orange peels after adsorption of Cu ions and Pb ions in a binary system are shown in Figure 4b. The EDX spectra of orange peel loaded with copper and lead ions in a binary system indicate the presence of only carbon and hydrogen with Cu and Pb peaks. It is apparent that all other elements except carbon and hydrogen disappeared and were replaced with Cu and Pb. The percentage composition of Pb adsorbed on the surface of orange peel is more than Cu, which suggests that orange peel bio-sorbent has more affinity for Pb2+ ions than Cu2+ ions. The surface area of an adsorbent also plays an important role in an adsorption process. The BET surface area of orange peel bio-sorbent relative to the particle size 75, 255, and 455 µm gave 9.8471, 6.6383, and 3.5685 m2/g, respectively.

3.3. Experimental Design

3.3.1. Adsorption of Cu2+ and Pb2+ onto Orange Peels in Binary Solute Using CCD

The experimental design matrix for the biosorption of Cu2+ and Pb2+ ions onto orange peels is presented in Table 2 with the predicted and experimental responses. The second-order polynomial Equation (6) with multiple regression analysis was used to generate the responses (percentage removal of Cu2+ and Pb2+) using the three design factors.
The quadratic regression model shows the model parameters generated for the responses; percentage removal of Pb (Y1) and percentage removal of Cu (Y2) written for coded factors as a function of initial concentration (A), adsorbent dosage (B), and the particle size (C) are represented in Equations (9) and (10), respectively.
Y 1 Pb = 83.93 5.03 A + 8.19 B + 1.56 AB + 1.87 AC 3.3 BC 1.61 C 2
Y 2 Cu = 71.48 + 8.79 B 3.89 C 2.19 AB 1.61 AC + 3.56 BC + 6.28 B 2  
Model Equations (7) and (8) comprise three main effects (A, B, C), three interactive effects (AB, AC, BC), and three quadratic effects (A2, B2, C2). The order of the interactive factors to increase the percentage removal of Pb(II) is AC > AB > BC while for percentage removal of Cu(II) is BC > AC > AB.

3.3.2. Analysis of Variance (ANOVA) for the Models

The regression models were evaluated using ANOVA to determine the significant factors that fitted well with the models as presented in Table 3 and Table 4. The ANOVA helps to identify the factors that had no significant influence on the model and the adsorption process. The models gave a 95% confidence level, 5% significance level, and a degree of freedom of 9. All the model features, the sum of squares, F-values (Fisher variation ratio), p-values, adequate precision, and the lack of fit values, were acceptable and show the significance of the models. The p-values of less than 0.05 shows that the regression model terms are highly significant. The p-values of the regression models representing percentage removal of Pb2+ and Cu2+ gave <0.0001, which implies that the regression model equation fitted well with the experimental data. The lack of fit value greater than 0.05 signifies that the models have one or more terms that have no significant influence on the regression models because of pure error or noise. However, such terms were included in the model to justify the parent terms and the interactive behavior. In the case of percentage removal of Pb2+, the significant model parameters are initial concentration A, adsorbent dosage B, interactive terms (AB, AC, BC), and quadratic term C2 while particle size C and quadratic terms (A2 and B2) are not significant. The significant model parameters for the percentage removal of Cu2+ are adsorbent dosage B and particle size C, which have a first-order main effect, interactive terms (AB, AC, BC), and quadratic term B2 while initial concentration A and quadratic terms (A2, and C2) are not significant.
The overall performance of the models was evaluated based on the regression coefficient of determination (R2), the adjusted R2, and the predicted R2. The R2 helps to ascertain the closeness of the experimental values to the predicted values, which range from 0 to 1, where 0 denotes no correlation between the data. The R2 obtained for the regression models was found to be close to 1, which implies a good fit between the experimental and the predicted data as represented in Figure 5. The predicted R2 and the adjusted R2 for the regression models of Pb2+ and Cu2+ are in reasonable agreement with a difference of less than 0.2, which validates the significance of the models. The R2 values for the models were found to be 0.9927 and 0.9725 for percentage Pb2+ removal and percentage Cu2+ removal, respectively. The adequate precision of the models, which is a measure of the signal-to-noise ratio, was desirable for a ratio greater than 4.

3.3.3. D Representation of the Interactive Effects on the Responses

The graphical representation of the interactive effects of the model parameters on each of the responses is shown in 3D plots depicted in Figure 6a–c. The surface plots were generated by writing code using MATLAB (MATLAB R2019a). Figure 6a shows the interaction between initial concentration and adsorbent dosage with the percentage removal of Pb2+ and Cu2+ ions. The bio-sorption capacity of Pb2+ increased with increasing adsorbent dosage while an increase in the initial concentration had slight changes in the adsorption capacity. This suggests that the surface of the bio-sorbent has reached the saturation point. In the case of the percentage removal of Cu2+, the initial concentration and the adsorbent dosage increased with increasing percentage removal. The percentage removal of Pb2+ and Cu2+ increased with the increasing dosage of orange peels. This result is reasonable because a little amount of bio-sorbent relates to a small active site, and since the surface of the bio-sorbent is acidic, more active sites must be occupied for proton-metal ion competition.
Figure 6b shows the interactive effect of initial concentration and particle size on the percentage removal of Pb2+ and Cu2+. The highest bio-sorption capacity of Pb2+ and Cu2+ gave 98.85% and 87.32%, respectively, at the initial concentration of 100 mg/L, while the particle size had no significant changes in the adsorption of Pb2+. On the contrary, the percentage removal of Cu2+ increased with increasing initial concentration and particle size.
Figure 6c depicts the interaction between the adsorbent dosage and the particle size on the percentage removal of Pb2+ and Cu2+. The bio-sorption capacity of Pb2+ and Cu2+ ions increased with increasing adsorbent dosage while the particle size had little effect on the adsorption efficiency of the metal ions. The intersection of the two graphs shows that the maximum percentage removal of Pb2+ and Cu2+ ions in the binary system was reached with a particle size of 75 microns. This result is significant because smaller particle sizes have a larger surface area and enhance adsorption capacity better than bigger particle sizes. Furthermore, Figure 6a–c showed that the percentage removal of Pb2+ was higher than Cu2+ with all the interactions, which are a result of the reactivity of Pb2+ over Cu2+ [15]. Hence, Pb2+ ions were more adsorbed in the binary system than Cu2+ ions, as represented in Table 2. In conclusion, adsorbent dosage had the highest influence on the percentage removal of Pb2+ and Cu2+ ions in the binary system followed by the initial concentration while particle size had little or no significant effect.

3.3.4. Optimization of the Adsorption Process

The goal of optimization is to obtain the optimal values for the operating parameters involved in a process. The purpose is to maximize the percentage removal of the metal ions to achieve the highest optimum removal. The desirability of the solution is used to evaluate the suitability of the optimum condition obtained. The optimization also helps to determine the performance and capacity of the adsorbent in the binary solute system. The optimized variable condition for the bio-sorption of Cu2+ and Pb2+ ions in the binary system using orange peels gave 98.85% and 86.27% removal for Pb2+ and Cu2+ ions, respectively, with an initial concentration of 100 mg/L, an adsorbent dosage of 1 g, and particle size of 75 µm. The desirability of the solution gave 0.895, which signifies that the optimum condition is reasonably acceptable.

3.3.5. Mechanism of Adsorption of Cu2+ and Pb2+ Ions

The bio-sorption uptake of Cu2+ and Pb2+ ions onto orange peels was achieved by the combination of the operating parameters. The functional groups identified on the surface of orange peels played a significant role in the bio-sorption process. The major shifts in the peaks representing –COOH and –OH after adsorption of Cu2+ and Pb2+ confirmed ion exchange as the adsorption mechanism. These functional groups become deprotonated at a solution pH higher than the pHpzc of the bio-sorbent, which favors adsorption uptake of cations. In addition, the displacement of the metals present on the surface of orange peels after adsorption (Figure 3) also revealed ion exchange as the adsorption mechanism responsible for the bio-sorption of Cu2+ and Pb2+ in a binary system using orange peels.

3.4. Equilibrium Study

The adsorption process for experimental data of Cu2+ and Pb2+ onto orange peels were fitted with Langmuir and Freundlich isotherm models. A very important guide to determining the best isotherm is to fit the experimental data with different isotherm models for estimation, and then compare the correlation coefficient (R2) values obtained [16].
The Langmuir isotherm model is a semi-empirical model that explains the adsorption mechanism based on the assumption that the surface of the bio-sorbent is energetically homogenous and adsorption energy is uniform for all sites [17]. The isotherm studies were performed with a fixed amount of bio-sorbent but varying initial concentrations. The quantity adsorbed for the binary adsorption system of Pb2+ and Cu2+ using orange peels is presented in Table 5.
Figure 7a shows the experimental data for the adsorption isotherm of Cu2+ and Pb2+ in the binary system as well as the linear fits for the Langmuir isotherm model. The adsorption of Cu2+ and Pb2+ increased with increasing initial metal ion concentrations. The Langmuir isotherm constant “b” is higher for Pb2+ (0.77 L/mg) than Cu2+ (0.15 L/mg), which buttresses the fact that Pb2+ was more adsorbed than Cu2+. In addition, the quantity adsorbed of Pb2+ was higher than Cu2+. Therefore, Pb2+ has a higher affinity for the active sites on the surface of orange peels. Comparing the correlation coefficient R2 value for Langmuir and Freundlich isotherm models (Table 5), it is obvious that the Langmuir isotherm fitted the experimental data well for both Cu2+ and Pb2+ with values of R2 very close to 1. Another important characteristic of the Langmuir isotherm model can be represented by a dimensionless factor RL, also known as the separation factor. This is used to determine the adsorption behavior of the bio-sorbent as presented in Table 5. The dimensionless factor, RL, for the adsorption of Pb2+ and Cu2+ in binary system onto orange peels falls within the range of 0 < RL < 1, which implies that the adsorption process is favorable within the concentration range studied. Hence, the orange peel is efficient for the adsorption of Pb2+ and Cu2+ ions from aqueous solutions.
The Freundlich isotherm assumes the surface of an adsorbent is heterogeneous, and adsorption energy is exponentially distributed [18]. Figure 7b represents the plot of the experimental data and the Freundlich isotherm linear fit of Pb2+ and Cu2+. The parameters KF and n are the Freundlich isotherm constants describing the adsorption capacity and intensity, respectively. The measure of the exponent ‘n’ explains the adsorbent–sorbent phenomenon capacity and favorability [19]. Table 5 shows the values of n and the interpretation. The Freundlich isotherm constant “n”, which evaluates the adsorption intensity of the metal ions was determined to be greater than 1 and in the range 1 < n < 10 for Pb2+ and Cu2+ in the binary system. This shows that the adsorption process is favorable and with high chemisorption. This implies there exist great bonds between the adsorbent and the adsorbate because of the chemisorption reactions.

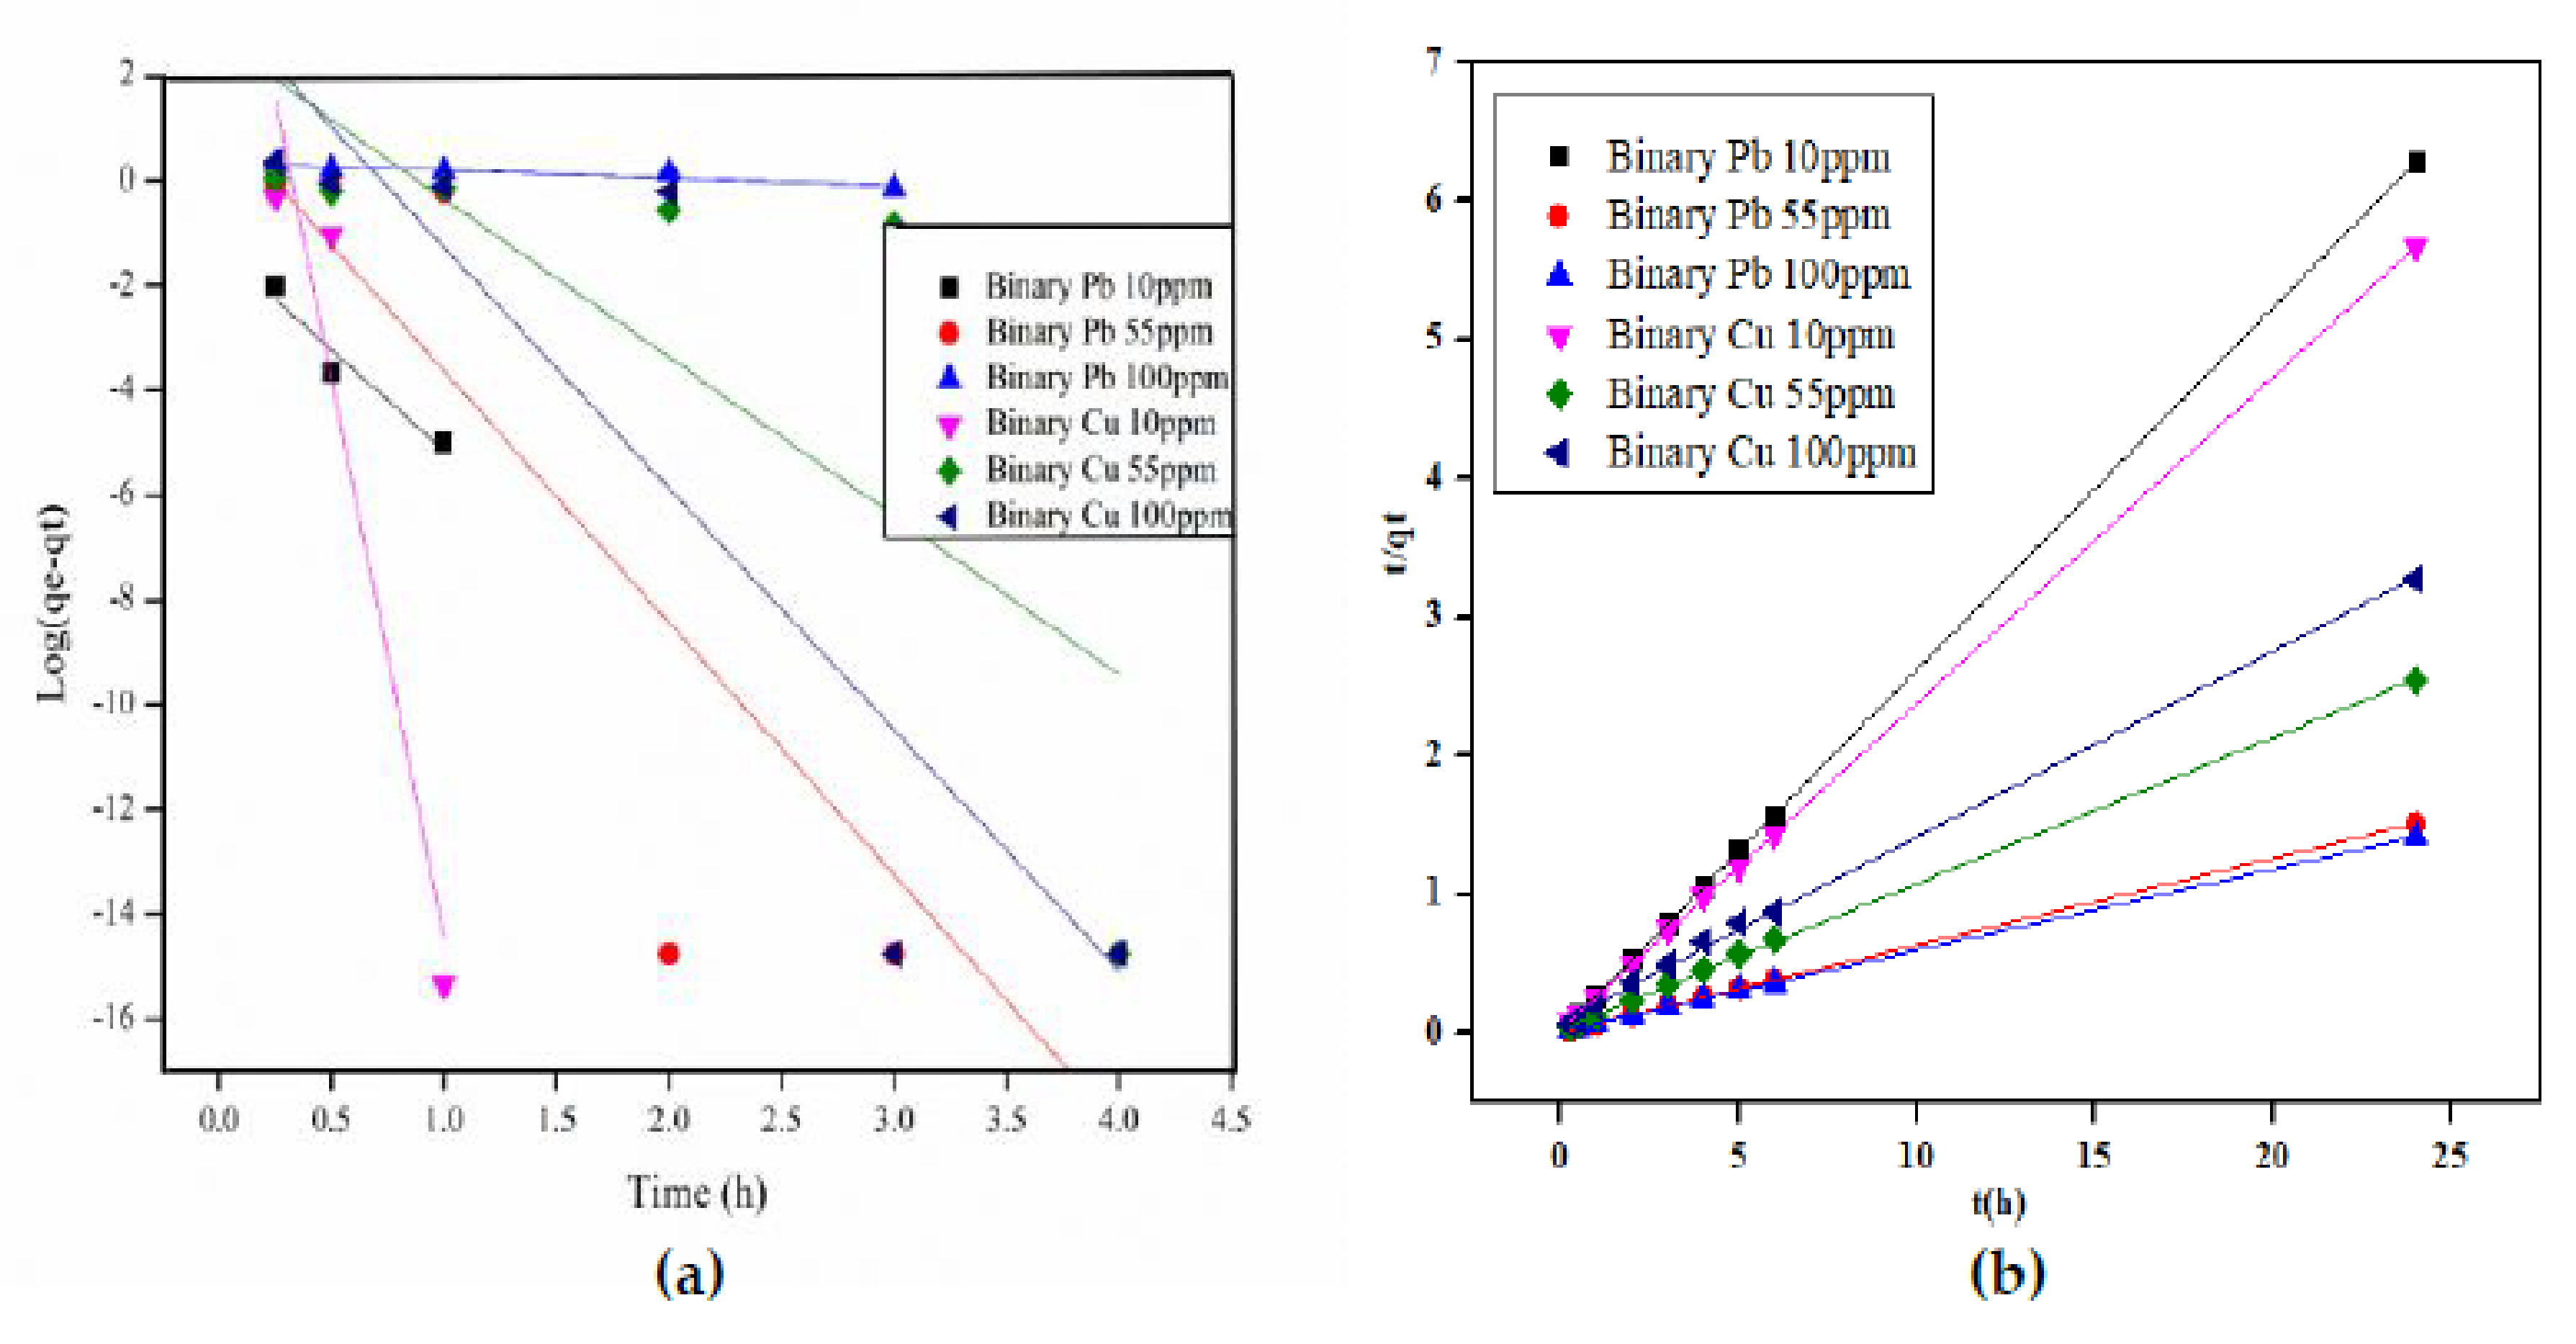
3.5. Kinetic Modelling of Pb2+ and Cu2+ onto Orange Peels

The kinetic study of Pb2+ and Cu2+ onto orange peels in binary systems with the effect of time at different initial concentrations (10, 55, and 100 mg/L) was investigated using the linearized pseudo-first-order and pseudo-second-order model. The calculated constant parameters obtained from the pseudo-first-order and pseudo-second-order linear models using orange peels are presented in Table 6. The effect of time on different initial concentrations was studied in the binary system containing Cu2+ and Pb2+. Figure 8a represents the plot of log q e q t against t for the binary system of Cu2+ and Pb2+ using orange peels. The correlation coefficient (R2) for the binary solute Cu2+ and Pb2+ pseudo-first-order model was in the range of 0.762 to 0.958. The pseudo-second-order model showed that the quantity of Pb2+ adsorbed is higher than Cu2+ for all the initial concentrations. The pseudo-second-order constant K2 value for Pb2+ was higher than Cu2+ signifying that adsorption of Cu2+ is negatively affected in the coexistence of Pb2+. The correlation coefficient for the pseudo-second order was observed to be very close to 1 for Cu2+ and Pb2+ at the different initial concentrations, which suggests that the adsorption rate is chemically controlled. Figure 8b shows the graph representing the linear form of the pseudo-second-order model of Cu(II) and Pb(II) in a binary system using orange peels. It can be observed that the graph started from the origin, indicating the good fit of the model.

3.6. Comparison of Cu2+ and Pb2+ Adsorption Capacity Using Orange Peels with Other Bio-Sorbents

The maximum uptake of Cu2+ and Pb2+ ions in binary solution is 38.18 mg/g and 40.05 mg/g, respectively. The adsorption uptake of Pb2+ was higher than Cu2+, which implies that orange peels have a higher affinity for Pb2+ than Cu2+. The maximum uptake of the metal ions obtained in this study is compared with other results reported using bio-sorbents as presented in Table 7.

4. Conclusions

The adsorption of Cu2+ and Pb2+ in a binary system from an aqueous solution using orange peels as a low-cost bio-sorbent was experimentally investigated in a batch mode. The interactive effect of the operating parameters, such as initial metal concertation, adsorbent dosage, and particle size, was examined using CCD. The adsorption capacity of Pb2+ was consistently higher than Cu2+ in all the experimental runs. The percentage removal increased with an increasing adsorbent dosage, which is attributed to the increase in the active sites available on the surface of the bio-sorbent. The adsorption of Cu2+ and Pb2+ occurred at a pH higher than the pHpzc of orange peels, which is 3.85. This reveals that the adsorption of cation is favored at pH > pHpzc of the adsorbent. The EDX analysis also showed that potassium, magnesium, and calcium disappeared on the surface of the bio-sorbent after adsorption. Hence, ion exchange is confirmed as the adsorption mechanism for the bio-sorption of Cu2+ and Pb2+.
The equilibrium and kinetic experimental results fitted well with Langmuir and pseudo-second-order models, respectively. This suggests that adsorption occurred on the monolayer, and the adsorption process has high chemisorption. Overall, this study suggests that orange peels are an efficient and inexpensive adsorbent suitable for the removal of Cu2+ and Pb2+ from wastewater in a bi-solute system.

Author Contributions

Conceptualization, F.O.A., P.M. and B.F.B.; methodology, F.O.A.; validation, F.O.A.; formal analysis, F.O.A.; investigation, F.O.A.; resources, P.M. and B.F.B.; data curation, F.O.A.; writing-original draft preparation, F.O.A.; writing-review and editing, P.M. and B.F.B.; visualization, F.O.A., P.M. and B.F.B.; supervision, P.M. and B.F.B.; project administration, F.O.A., P.M. and B.F.B.; funding acquisition, P.M. and B.F.B. All authors have read and agreed to the published version of the manuscript.

Funding

This work was supported by the National Research Foundation, South Africa (Grant No. 105235).

Institutional Review Board Statement

Not applicable.

Informed Consent Statement

Not applicable.

Data Availability Statement

Not applicable.

Acknowledgments

The authors wish to appreciate Durban University of Technology and Mangosuthu University of Technology for their support in using some equipment for the analytical work in this study.

Conflicts of Interest

The authors declare no conflict of interest.

References

  1. Wang, P.Y.; Li, M.; Huang, C. Hazardous Waste Treatment Technologies. Water Environ. Res. 2016, 88, 1467–1486. [Google Scholar] [CrossRef] [PubMed]
  2. Gunatilake, S.K. Methods of Removing Heavy Metals from Industrial Wastewater. J. Methods 2015, 1, 12–18. [Google Scholar]
  3. Afolabi, F.O.; Musonge, P.; Bakare, B.F. Evaluation of Lead (II) Removal from Wastewater Using Banana Peels: Optimization Study. Pol. J. Environ. Stud. 2021, 30, 1487–1496. [Google Scholar] [CrossRef]
  4. Krstić, V.; Urošević, T.; Pešovski, B. A review on adsorbents for treatment of water and wastewaters containing copper ions. Chem. Eng. Sci. 2018, 192, 273–287. [Google Scholar] [CrossRef]
  5. Fonseca-Cantabrana, Á.; Blancas-Benitez, F.J.; González-Estrada, R.R.; Sanchez-Silva, J.M. Biosorption of heavy metals by agroindustrial byproducts. TIP Rev. Espec. Cienc. Quím.-Biol. 2020, 23, 1–18. [Google Scholar]
  6. Singh, N.B.; Nagpal, G.; Agrawal, S.; Rachna. Water purification by using Adsorbents: A review. Environ. Technol. Innov. 2018, 11, 187–240. [Google Scholar] [CrossRef]
  7. Mahato, N.; Sharma, K.; Sinha, M.; Baral, E.R.; Koteswararao, R.; Dhyani, A.; Hwan Cho, M.; Cho, S. Bio-sorbents, industrially important chemicals and novel materials from citrus processing waste as a sustainable and renewable bioresource: A review. J. Adv. Res. 2020, 23, 61–82. [Google Scholar] [CrossRef]
  8. Afolabi, F.O.; Musonge, P.; Bakare, B.F. Application of the Response Surface Methodology in the Removal of Cu2+ and Pb2+ from Aqueous Solutions Using Orange Peels. Sci. Afr. 2021, 13, e00931. [Google Scholar] [CrossRef]
  9. Beni, A.A.; Esmaeili, A. Biosorption, an efficient method for removing heavy metals from industrial effluents: A review. Environ. Technol. Innov. 2020, 17, 100503. [Google Scholar] [CrossRef]
  10. Babapoor, A.; Rafiei, O.M.; Yousef, A.; Mohammad, M.P.; Meysam, N.; Ayat, K.W. Comparison and Optimization of Operational Parameters in Removal of Heavy Metal Ions from Aqueous Solutions by Low-Cost Adsorbents. Int. J. Chem. Eng. 2022, 2022, 3282448. [Google Scholar] [CrossRef]
  11. Achak, M.; Hafidi, A.; Ouazzani, N.; Sayadi, S.; Mandi, L. Low cost biosorbent “banana peel” for the removal of phenolic compounds from olive mill wastewater: Kinetic and equilibrium studies. J. Hazard. Mater. 2009, 166, 117–125. [Google Scholar] [CrossRef] [PubMed]
  12. Barquilha, C.E.R.; Cossich, E.S.; Tavares, C.R.G.; Silva, E.A. Biosorption of nickel(II) and copper(II) ions in batch and fixed-bed columns by free and immobilized marine algae Sargassum sp. J. Clean. Prod. 2017, 150, 58–64. [Google Scholar] [CrossRef]
  13. Febrianto, J.; Kosasih, A.N.; Sunarso, J.; Ju, Y.H.; Indraswati, N.; Ismadji, S. Equilibrium and kinetic studies in adsorption of heavy metals using biosorbent: A summary of recent studies. J. Hazard. Mater. 2009, 162, 616–645. [Google Scholar] [CrossRef] [PubMed]
  14. Pathak, P.D.; Mandavgane, S.A.; Kulkarni, B.D. Fruit peel waste: Characterization and its potential uses. Curr. Sci. 2017, 113, 444–454. [Google Scholar] [CrossRef]
  15. Martín-Lara, M.A.; Blázquez, G.; Calero, M.; Almendros, A.I.; Ronda, A. Binary biosorption of copper and lead onto pine cone shell in batch reactors and in fixed bed columns. Int. J. Miner. Process. 2016, 148, 72–82. [Google Scholar] [CrossRef]
  16. Foo, K.Y.; Hameed, B.H. Insights into the modeling of adsorption isotherm systems. Chem. Eng. J. 2010, 156, 2–10. [Google Scholar] [CrossRef]
  17. Hossain, M.; Ngo, H.H.; Guo, W.; Nguyen, T. Removal of copper from water by adsorption onto banana peel as bioadsorbent. Int. J. GEOMATE 2012, 2, 227–234. [Google Scholar] [CrossRef]
  18. Hossain, M.A.; Ngo, H.H.; Guo, W.S.; Nghiem, L.D.; Hai, F.I.; Vigneswaran, S.; Nguyen, T.V. Competitive adsorption of metals on cabbage waste from multi-metal solutions. Bioresour. Technol. 2014, 160, 79–88. [Google Scholar] [CrossRef]
  19. Dada, A.O.; Olalekan, A.P.; Olatunya, A.M.; Dada, O. Langmuir, Freundlich, Temkin and Dubini-Radushkevich Isotherms Studies of Equilibrium Sorption of Zn2+ Unto Phosphoric Acid Modified Rice Husk. IOSR J. Appl. Chem. 2012, 3, 38–45. [Google Scholar]
  20. Ashraf, M.A.; Wajid, A.; Mahmood, K.; Maah, M.J.; Yusoff, I. Removal of heavy metals from aqueous solution by using mango biomass. Afr. J. Biotechnol. 2011, 10, 2163–2177. [Google Scholar]
  21. Arunakumara, K.; Walpola, B.C.; Yoon, M.-H. Banana Peel: A Green Solution for Metal Removal from Contaminated Waters. Korean J. Environ. Agric. 2013, 32, 108–116. [Google Scholar] [CrossRef]
  22. Iqbal, M.; Khera, R.A. Adsorption of copper and lead in single and binary metal system onto Fumaria indica biomass. Chem. Int. 2015, 1, 157b–163b. [Google Scholar]
  23. Afolabi, F.O.; Musonge, P.; Bakare, B.F. Bio-sorption of a bi-solute system of copper and lead ions onto banana peels: Characterization and optimization. J. Environ. Health Sci. Eng. 2021, 19, 613–624. [Google Scholar] [CrossRef]
  24. Kumar, K.; Patavardhan, S.S.; Lobo, S.; Gonsalves, R. Equilibrium study of dried orange peel for its efficiency in removal of cupric ions from water. Int. J. Phytoremediat. 2018, 20, 593–598. [Google Scholar] [CrossRef]
  25. Safari, E.; Rahemi, N.; Kahforoushan, D.; Allahyari, S. Copper adsorptive removal from aqueous solution by orange peel residue carbon nanoparticles synthesized by combustion method using response surface methodology. J. Environ. Chem. Eng. 2019, 7, 102847. [Google Scholar] [CrossRef]
  26. Romero-Cano, L.A.; Gonzalez-Gutierrez, L.V.; Baldenegro-Perez, L.A. Biosorbents prepared from orange peels using Instant Controlled Pressure Drop for Cu(II) and phenol removal. Ind. Crop. Prod. 2016, 84, 344–349. [Google Scholar] [CrossRef]
Figure 1. Point of zero charges (pHpzc) of orange peels.
Sustainability 14 10860 g001
Figure 2. FTIR spectroscopy of natural orange peels before and after adsorption.
Sustainability 14 10860 g002
Figure 3. SEM images of orange peels (a) before adsorption and (b) after adsorption of Cu and Pb.
Sustainability 14 10860 g003
Figure 4. EDX spectra and elemental weight % table of orange peels (a) before adsorption and (b) after adsorption of Cu and Pb.
Sustainability 14 10860 g004
Figure 5. Graph showing actual (%) vs. predicted (%) removal percentages for (a) Pb and (b) Cu.
Sustainability 14 10860 g005
Figure 6. 3D surface plot of percentage removal of Cu and Pb with the interaction of variables; (a) initial concentration against adsorbent dosage (b) initial concentration against particle size (c) adsorbent dosage against particle size.
Sustainability 14 10860 g006
Figure 7. Adsorption isotherm of Cu and Pb onto orange peels in the binary system at pH 5. The symbols are the experimental results while the solid lines are the linear fittings of (a) Langmuir isotherm and (b) Freundlich isotherm.
Sustainability 14 10860 g007
Figure 8. Kinetic model graph of binary Cu2+ and Pb2+ at different initial concentrations: (a) Pseudo-first-order model and (b) pseudo-second-order model.
Sustainability 14 10860 g008
Table 1. Operating parameters, ranges, and levels.
ParametersFactorRange and Level
−10+1
Initial concentrationX11055100
Adsorbent dosageX20.10.551
Particle sizeX375265455
Table 2. CCD experimental matrix and responses of Pb2+ and Cu2+ removal onto orange peels.
StdRunInitial Conc. (mg/L)Adsorbent Dosage (g)Particle Size (µm)Responses
Lead % RemovalCopper % Removal
ExpPredExpPred
151550.5526583.7583.9372.8971.48
52100.145580.3480.5659.159.06
231000.17562.0761.9579.578.69
174550.5526582.8683.9370.1771.48
12555126590.4791.1885.0686.55
4610017588.1288.0484.7284.77
671000.145570.8671.1359.9560.57
208550.5526584.1583.9373.7271.48
99100.5526590.1288.8872.8270.86
31010017598.8598.7186.285.60
1611550.5526584.4583.9372.171.48
112100.17577.9778.8668.9870.76
1913550.5526583.2183.9369.6571.48
81410145584.7884.0382.6580.89
1815550.5526584.0583.9370.2571.48
1016100.5526578.1578.8369.2971.19
1417550.5545581.7581.7565.9866.34
1318550.557583.4582.9074.5574.13
1119550.126576.0674.8070.5368.98
720100145586.9587.2187.3288.14
Table 3. ANOVA for % Pb removal using orange peels.
SourceSum of SquaresdfMean SquareF-Valuep-Value
Prob > F
Comments
Pb Model1088.259120.92151.21<0.0001significant
A-Initial concentration252.511252.51315.76<0.0001
B-Adsorbent dosage670.271670.27838.17<0.0001
C-Particle size3.3413.344.180.0682
AB19.47119.4724.350.0006
AC28.05128.0535.080.0001
BC87.12187.12108.94<0.0001
A20.013810.01380.01730.8980
B22.4312.433.040.1116
C27.0917.098.870.0139
Residual8.00100.7997
Lack of Fit6.1751.233.390.1034not significant
Pure Error1.8250.3647
Cor Total1096.2519
Std. Dev.
0.8942
R2 0.9927Adjusted
R2 0.9861
Predicted
R2 0.9483
Adeq.
Precision 58.15
Mean 82.62C. V.%
1.08
Table 4. ANOVA for % Cu removal using orange peels.
SourceSum of SquaresdfMean SquareF-Valuep-Value
Prob > F
Comments
Cu Model1230.209136.6939.32<0.0001significant
A-Initial concentration0.285610.28560.08220.7802
B-Adsorbent dosage772.471772.47222.22<0.0001
C-Particle size151.711151.7143.64<0.0001
AB38.37138.3711.040.0077
AC20.67120.675.950.0349
BC101.391101.3929.170.0003
A20.576210.57620.16580.6925
B2108.531108.5331.220.0002
C24.2814.281.230.2931
Residual34.76103.48
Lack of Fit20.7954.161.490.3365not significant
Pure Error13.9752.79
Cor Total1264.9619
Std. Dev.
1.86
R2 0.9725Adjusted
R2 0.9478
Predicted
R2 0.7934
Adeq.
Precision 22.06
Mean 73.77C. V.%
2.53
Table 5. Langmuir and Freundlich isotherm parameters.
IonSystemLangmuir Freundlich
bqmR2RLKfnR2
(L/mg)(mg/g)
Cu2+Binary0.1538.180.9880.45.191.560.934
Pb2+Binary0.7740.050.9980.0224.064.290.898
Table 6. Pseudo-first-order model parameters for the adsorption of Cu2+ and Pb2+ using orange peels.
Metal Ion Concentration CuPb
10 mg/L55 mg/L100 mg/L10 mg/L55 mg/L100 mg/L
Pseudo-first orderBinary
qe 6.83E6465.272087.370.0514.722.18
K1 48.966.9610.598.8311.060.33
R2 0.9580.7620.8970.9700.8910.924
Pseudo-second
order
Binary
qe 42.489.4913.393.8215.9617.09
K2 0.020.440.0410.710.550.30
R2 0.9990.9990.9991.0000.9990.999
Table 7. Comparison of Cu2+ and Pb2+ ions uptake capacity with other bio-sorbents.
Bio-SorbentCu2+ Uptake (mg/g)Pb2+ Uptake (mg/g)Reference
Orange peels38.1840.05This study
Mango plant22.5124.4[20]
Banana peels287.97[21]
Fumaria Indica6.629.15[22]
Banana peels29.2639.32[23]
Cabbage waste12.9661.27[18]
Orange peels33.99 [24]
Orange peels16.64 [25]
Orange peels31.79 [26]
Publisher’s Note: MDPI stays neutral with regard to jurisdictional claims in published maps and institutional affiliations.

